
Providing Energy Self-Sufficiency to LoRaWAN Nodes by Means of Thermoelectric Generators (TEGs)-Based Energy Harvesting


1
Department of Information Engineering and Mathematics, University of Siena, 53100 Siena, Italy
2
Department of Information Engineering, University of Padova, 35131 Padova, Italy
*
Author to whom correspondence should be addressed.
Energies 2021, 14(21), 7322; https://doi.org/10.3390/en14217322
Submission received: 30 September 2021
/
Revised: 27 October 2021
/
Accepted: 1 November 2021
/
Published: 4 November 2021
(This article belongs to the Special Issue Near Real-Time Smart IoT Applications)
Abstract
:The aim of this paper is to present the viability of an energy-harvesting system prototype, based on thermoelectric generators (TEGs), to be embedded in a Long-Range Wide Area Network (LoRaWAN)-based wireless sensor node, allowing continuous quasi-real-time data transmission even for low temperature gradients and for frequent transmissions. To this end, an RFM95x LoRa module is used in the system. The energy management of the entire node is achieved by exploiting a nano power boost charger buck converter integrated circuit, which allows power extraction from the energy-harvesting source and, at the same time, regulates the charging/discharging process of a Li-Po battery that supplies the wireless node. The first phase of the project was dedicated to understanding the electrical characteristics of the TEG. A series of tests were performed to study the open circuit voltage, the current and the power generated by the TEG at different temperature gradients. Following this first phase, tests were then set up to study the charging/discharging process of the battery by changing two crucial parameters: the temperature between the faces of the TEG and the frequency of the transmissions performed by the transceiver. Experimental results show a positive balance for the battery charging at different conditions, which suggests two important conclusions: first of all, with high temperature gradients, it is possible to set relatively high transmission frequencies for the LoRaWAN module without discharging the battery. The second important consideration concerns the operation of the system at extremely low temperature gradients, with a minimum of 5 °C reached during one of the measurements. This suggests the usability of thermoelectric energy-harvesting systems in a wide range of possible applications even in conditions of low temperature gradients.
1. Introduction
The widespread diffusion of Internet of Things (IoT) networks has always gone hand in hand with the study of new techniques for energy provisioning and with the development of devices and programming techniques based on a low power perspective. A crucial aspect of every IoT node, in fact, is its energy autonomy, which represents a major challenge for those applications deployed in remote and hostile areas, without access to the energy grid and where the human intervention must be limited. Autonomous nodes can be powered by storage elements such as batteries or supercapacitors, but this poses additional problems mostly related to the lifetime of these elements and to their disposal.
The low cost and the reliability over long periods of time are among the most important requirements for the IoT nodes; therefore, energy-harvesting systems can be crucial to extend the average life of the battery and, therefore, of the entire node. Nowadays, a large number of different energy-harvesting techniques can be used to power wireless systems, but every one presents its own advantages and disadvantages. Hence, a preliminary study of the application scenario needs to be carried out with the objective to find the most suitable harvesting source. In recent years, there has been a growing interest towards thermoelectricity, namely the conversion of thermal energy derived both by thermal conduction and by radiation into electrical energy by means of thermoelectric generators (TEGs). Indeed, heat is generated by a variety of phenomena, both natural and human-made, and waste heat is free of charge and already available in several application scenarios. In addition, the fact that TEGs only need a temperature gradient to operate makes them suitable solutions especially for indoor applications, for which other power-generating systems cannot be conveniently used because of poor illumination, absence of winds, surfaces subjected to vibrations, etc. Moreover, the design simplicity and the high scalability of TEGs makes them easily applicable to heat sources of considerably different sizes and temperature gradients. Furthermore, the absence of mobile parts reduces the risk of faults in the cells and makes possible their application on different surfaces without need of continuous maintenance. Other strengths are the long life span and the fact of being environment friendly.
When developing IoT-based distributed systems, the more challenging aspect related to power consumption relies in the data transmission sub-system of the developed devices. Indeed, this task is the one that requires in general the largest amount of energy. For this reason, strong efforts have been made in the last years to develop novel telecommunication technologies with the aim of satisfying two crucial requirements: low power consumption and long-range data transmission. This has led to the emergence of a new set of telecommunication technologies indicated in general as Low Power Wide Area Networks (LPWANs): these include both cellular (Narrow Band-IoT (NB-IoT), LTE-M) and non-cellular (Sigfox, Long Range (LoRa)) technologies, with different features and drawbacks. Among these technologies, the LoRa modulation, together with the Low Power Wide Area Network (LoRaWAN) protocol, is rapidly becoming a sort of de-facto standard and has been actually employed in countless IoT application scenarios where real-time data collection is required [1,2]. Indeed, with respect to other LPWAN technologies, which rely on proprietary networks (SigFox) or cellular infrastructures (NB-IoT,LTE-M) and thus do not allow the deployment of custom network infrastructures, LoRaWAN Gateways can be easily deployed by the end-users according to each specific application requirement. This feature, together with the large availability of low-cost hardware components and the excellent performances in terms of receiver sensitivity (up to −140 dBm), which results in extremely large transmission ranges (up to 20 km in rural areas), have paved the way to the vast diffusion of this technology and thus to its adoption also in this research work. In order to provide LoRaWAN nodes with energy self-sufficiency, several energy-harvesting techniques have been tested, from common solar cells [3] to more peculiar microbial fuel cells [4] or sea waves motion [5]. TEGs have also been employed in a number of contributions, mainly focusing however on the actual application scenario.
Conversely, the scope of this paper is to demonstrate the advantages of a thermoelectric energy-harvesting system designed to be embedded in an IoT sensor node by focusing on the relation among different temperature gradients and the maximum achievable transmission rates. By applying a constant temperature gradient to the thermoelectric module, a continuous power supply is given to the entire node and is used to charge a Li-Po battery as storage element. A general purpose LoRaWAN node is employed: no specific sensor is embedded, assuming that the largest part of power consumption is due to data transmission. Instead, adopting a standard node configuration, different transmission rates are experimented for different temperature gradients among the two faces of the TEG. The results obtained from laboratory tests show a positive balance for the charging/discharging process of the storage element connected to the system. The final purpose of this work is to explore the applicability boundaries of this energy source when designing real-time remote monitoring systems, with the aim of identifying the maximum transmission rate achievable with the minimum temperature gradient.
The rest of the paper is structured as follows: in Section 2, the state of the art related to TEGs and their use within the IoT context is carefully reviewed, while Section 3 describes in detail the proposed architecture. Section 4 is related to the experimental analyses about the thermoelectric module adopted for the system. Section 5 is related to the experimental measures performed in laboratory, while Section 6 discusses the results obtained from laboratory tests. Finally, Section 7 presents the conclusions and future developments.
2. Related Works
In recent years, renewable energy has gained considerable importance in every region of the world. In 2021, the global use of renewable energy has increased by 3% from the previous year [6]. The widespread diffusion of clean energy is mainly due to the accessible cost of the equipment, in addition to important economic investments which have led to improvements in terms of efficiency and costs. Furthermore, one of the most remarkable characteristics of energy-harvesting modules is the possibility of employment in areas without an energy grid; this makes renewables a promising, environmentally friendly alternative to other energy sources such as oil, coal or natural gas.
Among all the sectors which have been influenced by the endless expansion of renewables, the IoT domain is the one which has greatly benefited from its advantages. IoT and, in general, Wireless Sensor Networks (WSN) are formed by a considerable number of nodes which can embed sensors and actuators, energy storage elements, processing units such as microcontrollers and microprocessors and data transmission devices. One of the mandatory requirements for all IoT applications is low power consumption, so energy efficiency represents one of the major challenges for every architecture, especially for the applications that need to be deployed in scenarios where the energy grid is not accessible or when the life-time duration of the deployed node must be the highest possible.
Different approaches can be combined to reduce energy consumption of a wireless node, both at software and hardware level. To ensure the autonomy for a certain amount of time, the general architecture foresees the use of an energy storage element (e.g., batteries, capacitors, etc.) as the main power source of the system. On the other hand, the extensive use of batteries poses additional problems mostly concerning their lifecycle. The choice of the energy storage element depends on several parameters such as operating temperature, power source availability, energy density, capacity and voltage [7], so a preliminary analysis must be carried out in order to adopt the technology which best fits with the application scenario.
IoT nodes (in particular low-power ones) can be powered by a wide number of clean sources [8], which can ensure a durable lifecycle for any energy storage element and reduce maintenance interventions. One of the most exploited is obviously the solar one. A typical wireless architecture based on solar energy harvesting is described in [9]. The model takes advantage of an energy management module, which is required since power and voltage provided by the harvesting modules are not compatible with the requirements of the sensing part in most of the cases. Moreover, numerous energy management circuits adopt techniques to maximize power extraction from different harvesting nodes, such as the Maximum Power Point Tracking (MPPT) algorithm.
Solar energy harvesting is directly related to another renewable source: thermoelectricity. The generation of heat coming from direct exposure of solar panels to sunlight, in fact, can be used to produce energy through thermoelectric generators. In such a configuration, TEGs have a dual advantage: first of all, they can increase the overall power generated by the architecture. Secondly, they can help to reduce the temperature of the solar cell, therefore improving its performances. An example can be found in [10], where the authors study the feasibility of a hybrid photovoltaic (PV)/thermal architecture. The PV panels are emulated by electrical resistance heaters, which are connected to the hot side of the TEG through a small amount of thermal paste; the cold side, instead, is attached to a heat sink placed in a water tank. The authors of [11] propose a similar architecture; in this case, the system is used to supply a synchronous reluctance motor used for pumping applications.
TEGs have also been tested with direct solar irradiation; the prototype developed by [12], for example, is a solar water heating system which employs a TEG to produce clean energy. Heat is provided to the harvesting device through concentrated solar irradiation: indeed, by using a Fresnel lens, light is redirected to an aluminium pipe partially covered by a black absorbing paint and directly connected to the hot side of the TEG. Conversely, the cold side is connected to a cold water tank to reach a consistent thermal gradient.
Hybrid harvesting systems which embed TEGs are also adopted to power wireless networks attached to the human body, called Wireless Body Area Networks (WBANs). In addition, researchers have developed flexible and stretchable TEGs over time, in order to adapt them to the human body, hence improving energy production [13]. In the literature, there are plenty of studies about flexible TEGs, which are mainly employed to harvest body heat [14,15,16,17,18]. An interesting example is proposed in [19], where the authors have developed a smart jacket prototype which takes advantage of solar cells as well as thermoelectric and piezoelectric generators. The prototype integrates several sensors whose main objective is to check environmental parameters in order to ensure workers’ safety.
WSNs are also widely employed for agricultural [20] and environmental purposes, where the energy autonomy of single nodes is a fundamental requirement [21]. In particular situations, TEGs can represent the most convenient solution. An example is provided in [22], where TEGs can ensure the energy self-sufficiency of a monitoring station by exploiting heat coming from volcanic fumaroles. Forest monitoring is another field where WSNs are widely employed, especially for fire detection [23]; in these situations, the so-called “ground-air thermoelectric generators” [24,25] represent a valid alternative to other energy sources, such as sun or wind. Indeed, air temperature is normally subject to considerable fluctuations, while ground temperature can remain stable for most of the day even at small depths; therefore, energy can be harvested night and day since these variations occur on a daily trend. Experimental studies show that TEGs can be used not only for forest soil applications [26] but also for harvesting energy directly from trees, exploiting the temperature difference between the tree trunk and the ambient air [27].
Industrial IoT is the field where TEGs are best suitable for energy harvesting if compared to other technologies, e.g., PV modules. Indeed, industrial environments are often associated with poor, artificial illumination, which poses a considerable obstacle to the use of these devices. On the contrary, since a TEG only requires a thermal gradient to be fully operative, it can be attached to numerous surfaces such as pipes or factory machineries, in order to recover heat wasted as part of different processes [28,29,30]. An interesting design is proposed by the authors of [31], whose objective is to monitor the concentration of various parameters such as CO, humidity and volatile compounds, in addition to the ambient temperature and the surface temperature of the pipe. The adoption of a flexible TEG and a flexible heat sink allows the application to any curve surface, enhancing the harvested power. The node is composed of a Battery Management System (BMS), a Li-Po rechargeable battery, a DC-DC converter, dedicated sensors, a microcontroller unit (MCU) and a transceiver adopting LoRa technology. The harvester is enveloped around a heat pipe with a temperature of 70 °C, which ensures the energy autonomy and the battery charging. A similar architecture is proposed in [32]: in this case, two rigid TEGs are placed in contact with a hot wall, and the harvested energy is stored in a 4 F supercapacitor.
3. System Overview
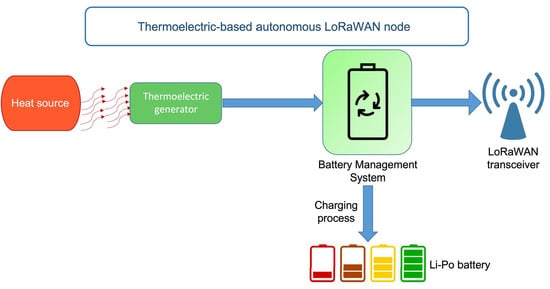
The overall system architecture, including both the energy harvesting and the LoRaWAN node sub-systems, is shown in Figure 1.
3.1. Energy Harvesting Architecture
The energy-harvesting sub-system consists of three main components: a TEG, a Li-Po rechargeable battery and a BMS. In this paper, we used commercial bismuth-telluride BiTe TEGs (model SP1848 27145 SA, size: 40 mm × 40 mm × 3.4 mm, weight: 25 g, maximum temperature: 150 °C, electric conductivity: 850∼1250 cm, thermal conductivity: 15∼16 × 10 W/ °C · cm), made up by thermocouples connected in series/parallel and insulated by a ceramic coat to avoid permanent damages due to high temperatures. The Li-Po battery used for energy storage is characterized by a capacity of 750 mAh and a 3.7 V nominal voltage. The low cost and the high energy density associated with this battery are essential to ensure a long energy autonomy for the node, particularly in those circumstances where the TEG does not operate full time.
The core component is represented by the BMS. The integrated circuit (IC) adopted in this project is the BQ25570, from Texas Instruments (Dallas, TX, USA) [33]. It integrates a boost charger and a buck converter and is highly recommended for ultra-low-power applications. According to the datasheet, it can extract W to mW of power from a large number of low-power energy-harvesting modules such as TEGs. Moreover, it offers the possibility to recharge energy storage elements such as rechargeable batteries, conventional capacitors or supercapacitors providing constant power to the system when peak currents are required (e.g., during the transmission of a radio module connected to the BMS) or when the energy recovery from the surrounding environment is sporadic and time-varying. The boost charger is used to effectively extract power from low voltage sources down to a minimum value of 100 mV of harvested voltage; the buck converter, instead, is used to give a voltage supply to an external load. The voltage value provided by this component can be programmed by setting external resistors in order to supply a wide range of loads. The voltage of the storage element (i.e., a Li-Po battery in the case study) is continuously compared with a series of voltage thresholds, in order to avoid permanent damages and extend its lifetime. Indeed, an excessive discharge makes Li-Po batteries unusable, while an overvoltage can lead to explosions or fires. A relevant feature of BQ25570 is a user-programmable algorithm for Maximum Point Power Tracking (MPPT), a mechanism used to extract the maximum power available from the harvesting source. For the BQ25570, this function is driven by the boost charger, which regulates the charger’s input voltage to a value stored in a dedicated capacitor: this value is obtained by periodically sampling the open circuit (OC) voltage at the input of the BQ25570 and computing a fraction of it according to a predetermined percentage set by the user. For example, solar panels have their maximum power point (MPP) at 80% of their OC voltage, while for TEGs this value is around 50% of the OC voltage.
Laboratory experiments were performed using the BQ25570EVM-206 evaluation board from Texas Instruments, and mounting the above-mentioned IC. The board comes with external passive components (resistors, capacitors and inductors) used to set voltage thresholds to fixed values and gives the opportunity to monitor the voltage related to the input source, the battery and the output of the buck converter. Besides, the input voltage can be regulated either to 50% or 80% of the OC voltage, making the implemented MPPT algorithm suitable for photovoltaic and thermoelectric harvesting; moreover, the output of the buck converter can be disabled with an appropriate jumper. Anyway, soldering different resistors is possible to adapt the MPPT algorithm and the thresholds to the required needs. Similarly, output voltage values can also be set by changing the hardware configuration of the board: these were chosen according to the node configuration and were then set to 4.2 V for the battery output (the actual charging voltage of a Li-Po battery) and 1.8 V for the system output according to the wireless node features (see Section 3.2). Eventually, higher output voltages can be provided by the BMS if necessary, up to 5.5 V.
3.2. Wireless Node
The wireless section of the prototype has been implemented with a low-power Long-Range (LoRa) transceiver RFM95x by Hoperf electronics (Shenzhen, China) [34] equipped with a 2 dBi gain whip antenna and an ATtiny84a-PU microcontroller by Atmel (San Jose, CA, USA) and has been used to evaluate the impact of the radio transmissions, which are the most energy-consuming activities performed by the sensor node, on the charging/discharging rate of the energy storage element. An in-depth study of the radio settings goes beyond the scope of the paper; therefore, a simple LoRaWAN network has been established between a LoRaWAN Class A End Device and a LoRaWAN Gateway, sending the received packets to a LoRaWAN Network Server and a LoRaWAN Application server, making the data available from a customized web interface. The sensor node was configured with operating frequency 868 MHz, coding rate 4/5, bandwidth 125 kHz and transmitted power 14 dBm according to the LoRaWAN regional parameters regulation [35]. The device was configured as a Class A device which, among the three Classes defined by the LoRaWAN regulation (i.e., Class A, Class B and Class C) is the one devoted to the definition of low-power End Devices. At the same time, Class B and Class C are specifically designed for bi-directional communication, which is in general not required for sensor nodes aiming at remote data collection. For this reason, despite the aim of this work was to test the most challenging system conditions, only Class A was tested. At the same time, the Spreading Factor (SF) was set at 12: this value, which is crucial together with output power to increase the transmission range, was chosen to set up a worst case condition in terms of longest airtime duration and thus highest power consumption for Class A LoRaWAN devices. The transmitted packets had a fixed length of 23 Bytes, embedding thus a 10 Bytes payload which was a generic alphanumeric string: this value can be assumed as an average dimension of a LoRaWAN packet carrying sensor data. Packets were periodically sent at fixed time intervals, depending on the performed test, adopting a sleep policy for the intervals between one transmission and the following. Since LoRaWAN transmissions have to comply with law regulations defining a maximum 1% duty cycle, the transmission rate was set at different frequencies, trying to reach a frequency compliant to the duty-cycle threshold. Exploiting the LoRaWAN air time calculator [36], the air time for the settings adopted in this paper was 1482.8 ms, thus entailing a transmission every 148.82 s ≃ 2.5 min. During the tests, a transmission frequency of one packet every minute was also tested, thus violating the duty-cycle regulations to test a worst case scenario. However, higher values were set for more critical conditions, as will be explained later in Section 5: these values have been assumed as satisfying to comply with the quasi-real-time transmission.
Since the proposed application is highly critical from the power consumption requirement, the used devices match well with the low voltages outputted by the buck converter. Indeed, the reliable functioning of the microcontroller and the RFM95x LoRa module is guaranteed with supply voltages down to 1.8 V, and energy consumption can be kept under control by providing suitable software programming strategies such as the adoption of a sleep routine allowing the devices to wake up only at the time of radio transmissions and the programming of the microcontroller at reduced clock frequencies.
4. TEG Characterization
The first laboratory tests campaign was aimed at electrically characterizing the commercial TEG used in our prototype, in terms of OC voltage and characteristic curves at different temperature gradients. A NI USB-6009 board from National Instruments (Austin, TX, USA) [37], monitored via LabVIEW, was used to gather the data. The high temperature source was provided by an Arcol (Truro, UK) HS25 aluminum-housed power resistor [38] with maximum power dissipation of 25 W, attached with two screws to a metal plate and connected to a Mastech (San Jose, CA, USA) HY3005D-3 DC linear power supply. By changing the voltage driven by the DC power supply, it was possible to increase/decrease the heat wasted by the power resistor generating different temperature gradients. The hot side of the TEG was placed in contact with the heated metal plate, while an aluminum heat sink was fixed by means of thermal paste to ensure a better heat transfer and on the cold face of the TEG to achieve a greater temperature gradient. This compound also had the advantage of removing all the air among the above-mentioned components. Due to the difficulty of accessing the surfaces, the temperatures on both the hot and the cold side of the cell were acquired by means of a type K thermocouple (which can measure temperatures from −270 °C to 1260 °C with an accuracy of ±2.2 °C) and a digital multimeter. In detail, the hot side temperature was measured by positioning the thermocouple on the bottom side of the heated metal plate, while the cold side temperature corresponds to the value acquired at the base of the heatsink. The gradient, which is referred to as “T” in the following sections, was then computed as the difference between the two values. The environmental temperature of the laboratory remained stable around 25 °C during the performed tests.
4.1. OC Voltage
The first test was necessary to measure the open circuit voltage generated by the TEG at different temperature gradients in order to evaluate its stability in view of its connection to the evaluation board. The acquired voltages were then analyzed using Matlab. The tested temperature gradients are T = 18 °C, T = 26 °C and T = 30 °C.
The acquired OC voltages are shown in Figure 2: the graph associated with the first tested gradient (i.e., T = 18 °C ) shows that a certain time is necessary to stabilize the temperature and, hence, the OC voltage. For the other curves, the related measurements were performed after waiting for the heatsink to reach a stable temperature value, in order to spot out the final constant value after the transient phase.
4.2. Characteristic Curves
The second test aimed at determining the characteristic V-I, P-I and P-V curves of the TEG. The used circuit exploits the simple method of variable resistor: it is a series connection of the TEG, a variable resistor (trimmer) with maximum value of 50 and a 1 small resistor R for current sensing. The value of the variable resistor is varied in steps in order to change the load and sense the different (I,V) couples from short to open circuit condition.
The power generated by the TEG is indirectly computed as
where V is the voltage between the terminals of the trimmer and I is the current flowing through the 1 resistor, whose small resistance value guarantees minimal voltage drop and essentially an equality between the voltage at the terminals of the variable resistor and the voltage generated by the TEG. Collected results are visible as scatter plots in Figure 3, Figure 4 and Figure 5, and they are coherent with TEGs physics. The dashed lines are obtained as polynomial fitting of the measured data. As expected, the power delivered by the TEG is maximal when the extracted voltage is 50% of its OC value, and this MPP moves growing as the temperature gradient increases. Based on these results, in further transmission tests, the MPPT value will be set at 50% in order to deliver to the BMS the maximum power payable from the TEG. The internal resistance of the TEG is given by the internal resistances of the thermocouples composing it and the total contact resistance given by the connections between the thermocouples, the hot side and the cold side junctions [39]. It can be estimated from the fitted V-I curve, and we found it is approximately equal to 5.5 at T = 18 °C, with slight variations according to the temperature gradient.
5. System Tests
The second laboratory tests campaign concerned the examination of the general behavior of the overall system composed of wireless node, evaluation board, Li-Po battery and TEG. In particular, a temperature gradient was established at the ends of the TEG with the method described in Section 4; then, the generator was connected to the evaluation board’s input terminal while the Li-Po battery was connected to a specific pin of the same board, named V. Finally, both the MCU and the RFM95 composing the node described in Section 3.2 were supplied by the V pin of the board, which provides a 1.8 V continuous voltage outputted by the buck converter. This value is indicated as minimum supply voltage for the MCU and the transceiver, which has peaks of current consumption during transmissions around 100 mA. The MCU managed the transmissions by waking up only at definite time intervals, while the transceiver was active only for the time required to send a packet; afterwards, both the components entered the sleep mode until the next transmission. Every test was performed for about 24 h in order to have an exhaustive view of the node’s behavior during a day, assuming that the heat source is always present.
The purpose was to determine the conditions (in terms of temperature gradient and frequency of transmission of the LoRaWAN packets) at which the energy independence of the architecture is guaranteed. To this end, the most relevant parameter to be taken into account is the voltage of the battery, in order to evaluate its charging/discharging behavior when the wireless node is powered up and is periodically performing radio transmissions. Hence, during the tests, the Li-Po battery voltage was monitored using LabVIEW and the USB-6009 DAQ device.
The first tests were implemented with MPPT set to 50% and T = 30 °C. The MCU and the LoRaWAN transceiver were first programmed to wake up every hour. The battery voltage trend is shown in Figure 6. The downward periodic voltage peaks visible in the graph are due to the RFM95x transmissions, but they do not significantly affect the charging process. Subsequent tests were set maintaining the same temperature gradient and decreasing the sleeping period of the wireless node in order to have radio transmissions every 10 min (Figure 7) and every minute (Figure 8). The purpose was to understand if frequent transmissions could cause the battery discharge despite the power supplied by the TEG. Both graphs confirm the charging trend observed in Figure 6.
All of the voltage curves present a flattening around 12 h from the beginning of the tests. This is probably due to a temperature difference in the laboratory where the tests were carried out that occurred during the night, which may have had a limited negative effect on the heating process carried out by means of the resistor or on the charging process of the battery. Indeed, the measurements were taken starting around 11 a.m., with an environmental temperature of approximately 24 °C, dropping to around 20 °C during the night. However, despite this phenomenon having a negative impact on the charging process, the positive trend of the battery charging was maintained. For this reason, we decided not to investigate this aspect in detail.
In the second test, the temperature gradient was decreased to 15 °C while the sleeping period of the MCU was left unaltered with transmissions every minute. The voltage curve visible in Figure 9 shows a positive trend for the voltage of the rechargeable battery, though it is less pronounced if compared to the previous analysis. Due to this positive outcome, tests with 10 min and 1 h transmission frequencies were not performed for this temperature gradient.
On the basis of this last experiment, the gradient was further reduced to T = 10 °C and the MCU was programmed to wake up the radio transceiver every 10 min (Figure 10).
By further decreasing the temperature gradient, the TEG produces smaller voltages which can be critical for the BMS since it can work properly only if the harvesting source can supply a minimum OC voltage of 130 mV. A single TEG is not able to develop such a voltage with low temperature gradients, and this causes the BMS to remain in its “cold start” stage. To overcome this problem, two TEGs of the same model were connected in series, and the MPPT was changed to 80% of the full-scale value. This last modification causes a decrease in the power supplied by the TEG but an increase in terms of provided voltage.
Further analyses were performed involving the new set-up in order to observe the system behavior in case of low-temperature gradients. Figure 11 and Figure 12 show the results of a 24 h long test performed with radio transmissions every 30 min and, respectively, T = 8 °C and T = 5 °C, which is the minimum temperature gradient tested. The Li-Po voltage difference between the start and end of the tests confirms the detected positive charging trend and the energy self-sufficiency of the system: overall, the battery voltage increased respectively by V = 15 mV and V = 5 mV.
The final set-up with the two TEGs in series, the wireless node, the Li-Po and the evaluation board is shown in Figure 13.
It was not possible to reach lower temperature gradients with the heating/cooling system employed: the temperature across the two sides of the TEG becomes uniform, and therefore, the gradient tends to 0 °C. Moreover, by going below T = 5 °C, the voltage generated by the TEGs is insufficient to supply the BMS.
6. Discussion
The studies that have been carried out about the aforesaid architecture have revealed some interesting peculiarities about the proposed energy-harvesting architecture. First of all, the experimental characterization of the single thermoelectric cell has shown results which are coherent with other studies in this field. A single generator of the model mentioned in Section 3, which covers an area of 16 cm, produces approximately 32 mW of power with a 30 °C gradient, as inferred from the interpolation of the P-V curve (Figure 5). Even with lower temperature gradients, the power generated by the cell far exceeds the minimum value necessary to begin the normal charging of the storage element connected to the BMS, as stated in [33].
A significant aspect that emerged during the tests is the autonomy of the system at relatively low temperature gradients: the values used during the last tests are easily available in a plethora of scenarios, from rural areas to industrial facilities. Moreover, the adoption of LoRaWAN technology offers different advantages in terms of power consumption and employment: indeed, thanks to the LoRaWAN performances, relatively high transmission rates are achievable for larger temperature gradients, close to the limits posed by the law regulations related to the system duty cycle which has to be lower than 1%. Indeed, the system has been tested adopting SF 12, which turns in longer airtime and thus higher power consumption: in this condition, and for a relatively short payload (10 B), the maximum achievable transmission rate foresees one transmission around every 2.5 min. The tests demonstrated the reachability of this value for larger temperature gradients and of relatively comparable values even for lower temperature gradients. In these conditions, the system proved to be able to set up quasi-real-time data collection. While similar results may be achieved also with other LPWAN technologies, the flexibility related to the customization of the LoRaWAN network infrastructure if compared with other proprietary technologies greatly simplifies the deployment of large-scale distributed monitoring systems. These aspects, combined with all the advantages presented above, concur to create a highly versatile architecture whose main peculiarities are a durable energetic autonomy and low maintenance needs.
Besides, the global design presents some limitations that emerged during the laboratory tests. Foremost, the OC voltage supplied by a single TEG at low temperature gradients is not acceptable to begin the charging process, and this can compromise the energy autonomy of the system. The problem can be solved by adopting a different configuration for the energy-harvesting part, such as the experimented one with two TEGs in series. In addition, the pre-set thresholds of the evaluation board represent an issue in terms of voltage supply for the wireless section. In particular, the V voltage set to 1.8 V is the minimum operating voltage for the RFM95x and the microcontroller, and it can be an excessively restrictive value in case of a need to connect sensors to the node. Indeed, during the tests phase, it was observed that even a small fluctuation of V below the above-mentioned value can impede normal transmissions. A viable solution for this last issue is offered by the BQ25570 device itself: in fact, it is possible to change every voltage threshold by creating an integrated circuit with different passive elements (resistors, inductors, capacitors) from the ones mounted on the evaluation board provided by Texas Instruments. In this way, the architecture can be adapted to a wide range of needs.
7. Conclusions
The research presented in this paper investigates the feasibility of a thermoelectric energy-harvesting system for Low-Power WSNs by using commercial thermoelectric generators. The system exploits LoRaWAN as a data transmission protocol: this technology is rapidly emerging as a de facto standard for wide-area data transmission due to its excellent performances in terms of long range and low power consumption. This aspect, combined with the flexibility of the network that is not based on proprietary infrastructures, has been the driver of the adoption of this technology to set up autonomous remote data collection platforms relying on energy harvesting. Since the objective was to demonstrate the autonomy from an energy point of view, a LoRaWAN Class A node was assembled in order to be general purpose. Results derived from the first tests campaign suggest that the system is particularly suitable within the smart industry scenario, where it is easy to reach elevated temperature gradients. For example, pipes and machinery give the opportunity to set up WSNs using the proposed energy-harvesting architecture, with little to no maintenance costs and a high independence.
According to subsequent tests, the energy autonomy is demonstrated even for high frequencies of radio transmissions of the wireless node powered by the BMS, in accordance with the law regulations that fix a maximum % duty cycle for LoRaWAN nodes. Therefore, the system can be configured for quasi-real-time applications and in general for all those deployments requiring a continuous low bit-rate flux of data coming from various sensors. The last test shows that, by using two TEGs in series, the battery charging and the full operation of the module are guaranteed even with a gradient of 5 °C. This represents a remarkable result because such a value can be easily obtained in the presence of several natural and artificial phenomena, as by directly exposing the TEGs to sunlight, opening up to new exploitation in outdoor scenarios.
Despite how energy-harvesting architecture has proven to be effective, its performances can still be improved designing an ad hoc BMS embedding the BQ25570 chip in place of the evaluation board or improving the cooling mechanism for the generation of the temperature gradient. Indeed, in the presented tests, an aluminum heat sink was attached to the cold side of the TEGs in order to maximize the gradient, and temperature difference could be further improved by adopting water tanks or phase change materials (PCM) in order to obtain lower temperatures at the cold side of the TEGs. At the same time, in-depth tests may also be carried out to identify the source of the decrease in the slope that occurred in the experiments during the night hours, which, however, did not negatively impact the overall success of the tests. Moreover, a future interesting development regards the implementation of an environmental monitoring sensor node embedding different sensors in order to test the charging capacity of the BMS even in case of actual field deployments.
Author Contributions
Conceptualization, A.P.; methodology, A.P., A.S. and I.C.; validation, A.S.; formal analysis, I.C.; investigation, A.S. and S.P.; data curation, A.S. and I.C.; writing—original draft preparation, A.P. and A.S.; writing—review and editing, A.P., A.S. and I.C.; supervision, A.P. and S.P. All authors have read and agreed to the published version of the manuscript.
Funding
This research received no external funding.
Institutional Review Board Statement
Not applicable.
Informed Consent Statement
Not applicable.
Data Availability Statement
Not applicable.
Conflicts of Interest
The authors declare no conflict of interest.
References
- Addabbo, T.; Fort, A.; Mecocci, A.; Mugnaini, M.; Parrino, S.; Pozzebon, A.; Vignoli, V. A lora-based iot sensor node for waste management based on a customized ultrasonic transceiver. In Proceedings of the 2019 IEEE Sensors Applications Symposium (SAS), Sophia Antipolis, France, 11–13 March 2019; pp. 1–6. [Google Scholar]
- Addabbo, T.; Fort, A.; Mugnaini, M.; Parri, L.; Parrino, S.; Pozzebon, A.; Vignoli, V. A low power IoT architecture for the monitoring of chemical emissions. ACTA IMEKO 2018, 8, 53–61. [Google Scholar] [CrossRef]
- Bruzzi, M.; Cappelli, I.; Fort, A.; Pozzebon, A.; Tani, M.; Vignoli, V. Polycrystalline silicon photovoltaic harvesting for indoor IoT systems under red-far red artificial light. In Proceedings of the 2021 IEEE Sensors Applications Symposium (SAS), Sundsvall, Sweden, 23–25 August 2021; pp. 1–6. [Google Scholar]
- Ayala-Ruiz, D.; Castillo Atoche, A.; Ruiz-Ibarra, E.; Osorio de la Rosa, E.; Vazquez Castillo, J. A Self-Powered PMFC-Based Wireless Sensor Node for Smart City Applications. Wirel. Commun. Mob. Comput. 2019, 2019, 8986302. [Google Scholar] [CrossRef]
- Chandrasekhar, A.; Vivekananthan, V.; Kim, S.J. A fully packed spheroidal hybrid generator for water wave energy harvesting and self-powered position tracking. Nano Energy 2020, 69, 104439. [Google Scholar] [CrossRef]
- IEA. Global Energy Review 2021; IEA: Paris, France, 2021; Available online: https://www.iea.org/reports/global-energy-review-2021 (accessed on 27 October 2021).
- Callebaut, G.; Leenders, G.; Van Mulders, J.; Ottoy, G.; De Strycker, L.; Van der Perre, L. The Art of Designing Remote IoT Devices–Technologies and Strategies for a Long Battery Life. Sensors 2021, 21, 913. [Google Scholar] [CrossRef]
- Peruzzi, G.; Pozzebon, A. A Review of Energy Harvesting Techniques for Low Power Wide Area Networks (LPWANs). Energies 2020, 13, 3433. [Google Scholar] [CrossRef]
- Mabon, M.; Gautier, M.; Vrigneau, B.; Le Gentil, M.; Berder, O. The smaller the better: Designing solar energy harvesting sensor nodes for long-range monitoring. Wirel. Commun. Mob. Comput. 2019, 2019, 2878545. [Google Scholar] [CrossRef] [Green Version]
- Lashin, A.; Al Turkestani, M.; Sabry, M. Concentrated Photovoltaic/Thermal Hybrid System Coupled with a Thermoelectric Generator. Energies 2019, 12, 2623. [Google Scholar] [CrossRef] [Green Version]
- Ibrahim, M.N.; Rezk, H.; Al-Dahifallah, M.; Sergeant, P. Hybrid photovoltaic-thermoelectric generator powered synchronous reluctance motor for pumping applications. IEEE Access 2019, 7, 146979–146988. [Google Scholar] [CrossRef]
- Kadohiro, Y.; Cheng, S.; Cross, J.S. All-Day Energy Harvesting Power System Utilizing a Thermoelectric Generator with Water-Based Heat Storage. Sustainability 2020, 12, 3659. [Google Scholar] [CrossRef]
- Rojas, J.P.; Singh, D.; Inayat, S.B.; Sevilla, G.A.T.; Fahad, H.M.; Hussain, M.M. Micro and nano-engineering enabled new generation of thermoelectric generator devices and applications. ECS J. Solid State Sci. Technol. 2017, 6, N3036. [Google Scholar] [CrossRef] [Green Version]
- Hyland, M.; Hunter, H.; Liu, J.; Veety, E.; Vashaee, D. Wearable thermoelectric generators for human body heat harvesting. Appl. Energy 2016, 182, 518–524. [Google Scholar] [CrossRef] [Green Version]
- Cao, Z.; Koukharenko, E.; Torah, R.N.; Tudor, J.; Beeby, S.P. Flexible screen printed thick film thermoelectric generator with reduced material resistivity. J. Phys. Conf. Ser. 2014, 557, 012016. [Google Scholar] [CrossRef]
- Shi, Y.; Wang, Y.; Mei, D.; Feng, B.; Chen, Z. Design and fabrication of wearable thermoelectric generator device for heat harvesting. IEEE Robot. Autom. Lett. 2017, 3, 373–378. [Google Scholar] [CrossRef]
- Proto, A.; Vondrak, J.; Schmidt, M.; Kubicek, J.; Gorjani, O.M.; Havlik, J.; Penhaker, M. A Flexible Thermoelectric Generator Worn on the Leg to Harvest Body Heat Energy and to Recognize Motor Activities: A Preliminary Study. IEEE Access 2021, 9, 20878–20892. [Google Scholar] [CrossRef]
- Lu, Z.; Zhang, H.; Mao, C.; Li, C.M. Silk fabric-based wearable thermoelectric generator for energy harvesting from the human body. Appl. Energy 2016, 164, 57–63. [Google Scholar] [CrossRef]
- De Fazio, R.; Cafagna, D.; Marcuccio, G.; Minerba, A.; Visconti, P. A Multi-Source Harvesting System Applied to Sensor-Based Smart Garments for Monitoring Workers’ Bio-Physical Parameters in Harsh Environments. Energies 2020, 13, 2161. [Google Scholar] [CrossRef]
- Jawad, H.M.; Nordin, R.; Gharghan, S.K.; Jawad, A.M.; Ismail, M. Energy-Efficient Wireless Sensor Networks for Precision Agriculture: A Review. Sensors 2017, 17, 1781. [Google Scholar] [CrossRef] [Green Version]
- Prauzek, M.; Konecny, J.; Borova, M.; Janosova, K.; Hlavica, J.; Musilek, P. Energy Harvesting Sources, Storage Devices and System Topologies for Environmental Wireless Sensor Networks: A Review. Sensors 2018, 18, 2446. [Google Scholar] [CrossRef] [PubMed] [Green Version]
- Catalan, L.; Garacochea, A.; Casi, A.; Araiz, M.; Aranguren, P.; Astrain, D. Experimental Evidence of the Viability of Thermoelectric Generators to Power Volcanic Monitoring Stations. Sensors 2020, 20, 4839. [Google Scholar] [CrossRef] [PubMed]
- Cantuna, J.G.; Bastidas, D.; Solorzano, S.; Clairand, J.M. Design and implementation of a Wireless Sensor Network to detect forest fires. In Proceedings of the 2017 Fourth International Conference on eDemocracy & eGovernment (ICEDEG), Quito, Ecuador, 19–21 April 2017; pp. 15–21. [Google Scholar]
- Stevens, J.W. Performance factors for ground-air thermoelectric power generators. Energy Convers. Manag. 2013, 68, 114–123. [Google Scholar] [CrossRef]
- Sigrist, L.; Stricker, N.; Bernath, D.; Beutel, J.; Thiele, L. Thermoelectric energy harvesting from gradients in the Earth surface. IEEE Trans. Ind. Electron. 2019, 67, 9460–9470. [Google Scholar] [CrossRef] [Green Version]
- Huang, Y.; Xu, D.; Kan, J.; Li, W. Study on field experiments of forest soil thermoelectric power generation devices. PLoS ONE 2019, 14, e0221019. [Google Scholar] [CrossRef] [Green Version]
- Meli, M.; Hegetschweiler, L. Harvesting energy from trees in order to power LPWAN IoT nodes. In Proceedings of the Wireless Congress 2018, Munich, Germany, 21–22 March 2018. [Google Scholar]
- Casi, A.; Araiz, M.; Catalan, L.; Astrain, D. Thermoelectric heat recovery in a real industry: From laboratory optimization to reality. Appl. Therm. Eng. 2021, 184, 116275. [Google Scholar] [CrossRef]
- Ando Junior, O.H.; Calderon, N.H.; De Souza, S.S. Characterization of a Thermoelectric Generator (TEG) System for Waste Heat Recovery. Energies 2018, 11, 1555. [Google Scholar] [CrossRef] [Green Version]
- Araiz, M.; Casi, A.; Catalan, L.; Aranguren, P.; Astrain, D. Thermoelectric Generator with Passive Biphasic Thermosyphon Heat Exchanger for Waste Heat Recovery: Design and Experimentation. Energies 2021, 14, 5815. [Google Scholar] [CrossRef]
- Kim, Y.J.; Gu, H.M.; Kim, C.S.; Choi, H.; Lee, G.; Kim, S.; Yi, K.K.; Lee, S.G.; Cho, B.J. High-performance self-powered wireless sensor node driven by a flexible thermoelectric generator. Energy 2018, 162, 526–533. [Google Scholar] [CrossRef]
- Hou, L.; Tan, S.; Yang, L.; Zhang, Z.; Bergmann, N.W. Autonomous Wireless Sensor Node with Thermal Energy Harvesting for Temperature Monitoring of Industrial Devices. Int. J. Online Eng. 2017, 13, 75–82. [Google Scholar] [CrossRef] [Green Version]
- Texas Instruments, Ultra Low Power Harvester Power Management IC with Boost Charger, and Nanopower Buck Converter. 2021. Available online: https://www.ti.com/product/BQ25570 (accessed on 27 October 2021).
- HOPERF. Low Power Long Range Transceiver Module Model No.:RFM95W/96W/98W. 2018. Available online: https://www.hoperf.com/modules/lora/RFM95.html (accessed on 27 October 2021).
- LoRa Alliance Technical Committee Regional Parameters Workgroup. LoRaWAN 1.1 Regional Parameters; LoRa Alliance: Fremont, CA, USA, 2018. [Google Scholar]
- The Things Network, LoRaWAN Airtime Calculator. Available online: https://www.thethingsnetwork.org/airtime-calculator (accessed on 27 October 2021).
- National Instruments, NI USB-6008/6009 User Guide. Available online: https://www.ni.com/pdf/manuals/371303n.pdf (accessed on 27 October 2021).
- Arcol, Aluminum Housed Resistors Datasheet. 2008. Available online: http://www.arcolresistors.com/wp-content/uploads/2014/03/HS-Datasheet.pdf (accessed on 27 October 2021).
- Hung, L.T.; Van Nong, N.; Han, L.; Bjork, R.; Ngan, P.H.; Holgate, T.C.; Balke, B.; Snyder, G.J.; Linderoth, S.; Pryds, N. Segmented thermoelectric oxide-based module for high-temperature waste heat harvesting. Energy Technol. 2015, 3, 1143–1151. [Google Scholar] [CrossRef]
Figure 1.
System architecture.

Figure 2.
OC voltage of the adopted TEG at three different temperature gradients T = 18 °C (red plot), T = 26 °C (black plot) and T = 30 °C (green plot). The dashed lines are the OC voltage values after stabilization of the temperature.
Figure 2.
OC voltage of the adopted TEG at three different temperature gradients T = 18 °C (red plot), T = 26 °C (black plot) and T = 30 °C (green plot). The dashed lines are the OC voltage values after stabilization of the temperature.

Figure 3.
V-I characteristic curve measured (scatter plots) and fitted (dashed lines) at three temperature gradients: T = 18 °C (red plots), T = 26 °C (black plots) and T = 30 °C (green plots). In the inset, the OC voltage V at the three temperature gradients.
Figure 3.
V-I characteristic curve measured (scatter plots) and fitted (dashed lines) at three temperature gradients: T = 18 °C (red plots), T = 26 °C (black plots) and T = 30 °C (green plots). In the inset, the OC voltage V at the three temperature gradients.

Figure 4.
P-I characteristic curve measured (scatter plots) and fitted (dashed lines) at three temperature gradients: T = 18 °C (red plots), T = 26 °C (black plots) and T = 30 °C (green plots).
Figure 4.
P-I characteristic curve measured (scatter plots) and fitted (dashed lines) at three temperature gradients: T = 18 °C (red plots), T = 26 °C (black plots) and T = 30 °C (green plots).

Figure 5.
P-V characteristic curve measured (scatter plots) and fitted (dashed lines) at three temperature gradients: T = 18 °C (red plots), T = 26 °C (black plots) and T = 30 °C (green plots).
Figure 5.
P-V characteristic curve measured (scatter plots) and fitted (dashed lines) at three temperature gradients: T = 18 °C (red plots), T = 26 °C (black plots) and T = 30 °C (green plots).

Figure 6.
Li-Po voltage trend with radio transmissions every hour and T = 30 °C.

Figure 7.
Li-Po voltage trend with radio transmissions every 10 min and T = 30 °C.

Figure 8.
Li-Po voltage trend with radio transmissions every minute and T = 30 °C. The inset shows a magnified 90-min section of the plot.
Figure 8.
Li-Po voltage trend with radio transmissions every minute and T = 30 °C. The inset shows a magnified 90-min section of the plot.

Figure 9.
Li-Po voltage trend with radio transmissions every minute and T = 15 °C. The inset shows a magnified 90-min section of the plot.
Figure 9.
Li-Po voltage trend with radio transmissions every minute and T = 15 °C. The inset shows a magnified 90-min section of the plot.

Figure 10.
Li-Po voltage trend with radio transmissions every 10 min and T = 10 °C.

Figure 11.
Li-Po voltage trend with radio transmissions every 30 min, MPPT set to 80% and T = 8 °C.

Figure 12.
Li-Po voltage trend with radio transmissions every 30 min, MPPT set to 80% and T = 5 °C.

Figure 13.
Final set-up with the two TEGs in series. The wireless node, the Li-Po battery and the evaluation node are also visible.
Figure 13.
Final set-up with the two TEGs in series. The wireless node, the Li-Po battery and the evaluation node are also visible.

Publisher’s Note: MDPI stays neutral with regard to jurisdictional claims in published maps and institutional affiliations. |
© 2021 by the authors. Licensee MDPI, Basel, Switzerland. This article is an open access article distributed under the terms and conditions of the Creative Commons Attribution (CC BY) license (https://creativecommons.org/licenses/by/4.0/).
Share and Cite
MDPI and ACS Style
Cappelli, I.; Parrino, S.; Pozzebon, A.; Salta, A. Providing Energy Self-Sufficiency to LoRaWAN Nodes by Means of Thermoelectric Generators (TEGs)-Based Energy Harvesting. Energies 2021, 14, 7322. https://doi.org/10.3390/en14217322
AMA Style
Cappelli I, Parrino S, Pozzebon A, Salta A. Providing Energy Self-Sufficiency to LoRaWAN Nodes by Means of Thermoelectric Generators (TEGs)-Based Energy Harvesting. Energies. 2021; 14(21):7322. https://doi.org/10.3390/en14217322
Chicago/Turabian StyleCappelli, Irene, Stefano Parrino, Alessandro Pozzebon, and Alessio Salta. 2021. "Providing Energy Self-Sufficiency to LoRaWAN Nodes by Means of Thermoelectric Generators (TEGs)-Based Energy Harvesting" Energies 14, no. 21: 7322. https://doi.org/10.3390/en14217322
Note that from the first issue of 2016, this journal uses article numbers instead of page numbers. See further details here.