Article

The Influence of Photovoltaic Cell Coverage Rate on the Thermal and Electric Performance of Semi-Transparent Crystalline Silicon Photovoltaic Windows Based on the Dynamic Power Coupling Model

1
School of Energy and Power Engineering, Nanjing University of Science and Technology, Nanjing 210094, China
2
Nanjing Architectural Design and Research Institute Co., Ltd., Nanjing 210014, China
*
Author to whom correspondence should be addressed.
Energies 2021, 14(21), 7117; https://doi.org/10.3390/en14217117
Submission received: 9 September 2021 / Revised: 14 October 2021 / Accepted: 26 October 2021 / Published: 1 November 2021

Abstract

:
Based on the energy conversion equation and dynamic power model of the semi-transparent crystalline silicon photovoltaic (PV) window (ST-PVW), through an iterative coupling solution to the operating temperature of the cell, a thermal-electric coupling calculation method for the ST-PVW is provided, and, combined with experiments, the method model was verified. Based on this model, the influence of PV cell coverage rate (PVR) on the thermal performance of the ST-PVW was studied. According to the simulation results, in summer, the heat gain of the ST-PVW decreases with the increase of PVR, and in winter, the amount of heat loss increases with the increase of PVR. For the four cities of Guangzhou, Nanjing, Beijing and Harbin, when the PVR is 1, 0.60 to 0.64, 0.28 to 0.32 and 0.26 to 0.30, respectively, the annual power consumption of the air conditioner can reach the minimum, and when the PVR is 0.16 to 0.17, 0.24 to 0.25, 0.22 to 0.23 and 0.19 to 0.20, respectively, the amount of electricity generated can just offset the power consumption of the air conditioner during the day.

1. Introduction

In 2018, building energy consumption in China reached 1 billion tons of standard coal, accounting for 21.7 percent of total energy consumption [1]. With the Chinese government’s policy of carbon peaking and carbon neutralization, green and clean energy plays an increasingly important role in replacing traditional energy. Solar energy is a type of renewable energy and will not produce carbon emissions, so it will play a greater role in the future. People can use solar energy to generate electricity through photovoltaic technology [2]. PV technology has advantages over traditional energy in environmental, economic and social aspects [3]. At present, the application of photovoltaic buildings is mainly to install photovoltaic panels on the roof, and the building facade has not been well utilized. Window is one of the important maintenance structures of buildings, which has the functions of heat insulation, sound insulation and sunshine lighting [4]. However, the window is also a part of the building envelope with poor thermal insulation performance, and the building air conditioning load caused by the heat transfer of the external window accounts for 25–40% of the total building load [5]. Therefore, the thermal performance of the outer window is also an important factor affecting building energy efficiency [6,7]. Many kinds of windows and glass have appeared. In terms of improving the thermal insulation of glass, there are commonly used vacuum glass, laminated glass and the so-called smart glazing such as thermochromic glazing [8].
Combining photovoltaic with Windows or glass curtain walls is a way to broaden the application of photovoltaic buildings [9]. Therefore, ST-PVW plays an important role in realizing the energy saving of building exterior windows and the development of green buildings, and it is also paid attention to in the field of building energy saving [10,11]. In Brazil, ST-PVW technology can save 43% of building energy consumption [12]. The photovoltaic windows and photovoltaic curtain wall not only provide the basic functions of lighting and thermal insulation, but can also generate electricity, which has a wide range of application value and research significance. One of the most common is the semi-transparent crystalline silicon laminated glass window, which is made by sandwiching the photovoltaic cell between two transparent tempered glass, filled and fixed by EVA (ethylene-vinyl acetate) adhesive material [13].
The influence of ST-PVW on buildings is analyzed from three dimensions: power generation, thermal performance and optical performance. [9,14] The thermal performance of ST-PVW, as the most important parameter to measure its comprehensive performance, has been widely studied in China and abroad. Fung et al. [15] established a one-dimensional unsteady heat transfer model of the ST-PVW and analyzed its heat gain. The results showed that solar heat gain was the main part of the heat gain of the ST-PVW, and the coverage rate of photovoltaic cells had a significant impact on its heat gain. Xu et al. [16] compared the energy performance of ST-PVW and transmission glass in different regions of China. The results show that ST-PVW has better energy performance than single-layer and double-layer glass in regions where refrigeration is the main demand. Jia et al. [17] confirmed that the double-skin semitransparent photovoltaic (DS-STPV) windows can reduce building energy consumption through the experiment of the DS-STPV windows power generation efficiency and the change of building electricity consumption in cold areas, and proposed the corresponding control strategy. Guo et al. [18] established the heat transfer model, power generation model and daylighting model of double-layer glued photovoltaic window, hollow photovoltaic windows and ventilated photovoltaic windows based on EnergyPlus. The results show that compared with ordinary windows, single-layer photovoltaic windows can save energy by 3.6%, hollow photovoltaic windows can save energy by 4.8% and ventilated photovoltaic windows can save energy by 6.7%. Skandalos et al. [19] calculated the solar heat gain coefficient (SHGC) and comprehensive heat transfer coefficient (U-value) of ST-PVW based on WINDOW and OPTICS software, and analyzed the thermal performance of ST-PVW at different orientations and different window–wall ratios by TRNSYS. Ghosh et al. [20] combined experimental data to study the thermal performance of the translucent crystalline silicon vacuum photovoltaic window, and the results showed that compared with the photovoltaic double glass, the U value of the translucent crystalline silicon vacuum photovoltaic window decreased by 66%, and the SHGC value decreased by 46%. In the above related studies on the thermal performance of ST-PVW, most of them are based on the joint calculation of the energy conversion process of heat and electricity in the ST-PVW. In order to simplify the calculation, the efficiency constant model is used to calculate the power generation. In fact, during the working process of photovoltaic modules, the power generation efficiency changes dynamically with the change of working temperature. Although this change has little effect on the power generation in the photovoltaic window, according to the thermoelectric characteristics [21] of photovoltaic cells, the change of power generation will further lead to significant changes in the working temperature of the photovoltaic cells, which will affect the calculation of the thermal performance of the ST-PVW.
As the most important parameter in the ST-PVW, the PVR has a significant impact on its thermoelectric performance. Based on the thermoelectric characteristics of crystalline silicon photovoltaic cells, this paper establishes the thermal-electric coupling calculation model of the ST-PVW. Through the iterative solution of the power generation process and energy balance process of the ST-PVW, the power generation and heat transfer process of the ST-PVW are more accurately calculated. Based on this, the performance of the ST-PVW with different PVR is discussed and analyzed, which provides some theoretical support and guidance for the practical application of the ST-PVW.

2. Numerical Model of ST-PVW

The structure of ST-PVW is shown in Figure 1. According to whether there is photovoltaic cell coverage, it is divided into transparent and opaque parts. The non-transparent part is the core of the ST-PVW, which is mainly divided into five layers in structure, namely, the outer glass layer, the outer EVA layer, the photovoltaic cell layer, the inner EVA layer and the inner glass layer. The transparent part is only the outer glass layer, EVA layer and the inner glass layer. The heat transfer process of the opaque part can be divided into the following five parts according to the heat transfer boundary.
1.
The outer glass layer,
G α gla 1 = h c , pvgla 1 , out T pvgla 1 , o T e + ε gla 1 h r , pvgla 1 out T pvgla 1 , o T e + λ gla 1 d gla 1 T pvgla 1 , o T pvgla 1 , i
2.
The outer EVA layer,
G τ gla 1 α EVA 1 + λ gla 1 d gla 1 T pvgla 1 , o T pvgla 1 , i = λ EVA 1 d EVA 1 T pvgla 1 , i T pv
3.
The photovoltaic cell layer,
G τ gla 1 τ EVA 1 α pv + λ EVA 1 d EVA 1 T pvgla 1 , i T pv = E out + λ EVA 2 d EVA 2 T pv T pvgla 2 , o
4.
The inner EVA layer,
λ EVA 2 d EVA 2 T pv T pvgla 2 , o = λ gla 2 d gla 2 T pvgla 2 , o T pvgla 2 , i
5.
The inner glass layer,
λ EVA 2 d EVA 2 T pv T pvgla 2 , o = λ gla 2 d gla 2 T pvgla 2 , o T pvgla 2 , i
In Equations (1)–(5), T represents temperature, K. T e and T room represent outdoor environment temperature and indoor air temperature, respectively, K. ε represents the surface emissivity. G denotes ST-PVW surface solar radiation intensity, W/m2. α   represents the radiant heat absorption coefficient. τ represents the radiation penetration coefficient. λ   represents the thermal conductivity, W/(m·K). d represents the thickness, m. E out represents the power generation per unit area of ST-PVW, W/m2, calculated by dynamic power model. h c represent the convective heat transfer coefficient, W/(m2·K), and the calculation formula [22] is shown in Equation (6), namely, McAdams equation. h r , pvgla 1 out ,   h r , pvgla 2 in   represent the radiation heat transfer coefficients of the outer surface and inner surface of the ST-PVW photovoltaic cells, respectively, W/(m2·K), and the calculation formula is shown in Equations (7) and (8). Subscripts pvgla 1 ,   pv ,   pvgla 2 represent the outer glass layer, the photovoltaic cells and the inner glass layer covered by the photovoltaic cells of the ST-PVW, respectively. Subscripts gla 1   ,   gla 2 , EVA 1   ,   EVA 2 denote the glass on the outer surface and inner surface of the ST-PVW, the outer EVA glue and the inner EVA glue, respectively. Subscripts o and i represent the outer surface and inner surface, respectively.
h c = 5.7 + 3.8 v
h r , gla 1 out = σ ( T gla 1 , o 2 + T e 2 ) ( T gla 1 , o + T e )
h r , gla 2 in = σ ( T gla 2 , i 2 + T room 2 ) ( T gla 2 , i + T room )
where v denotes the wind speed at the outer surface of the ST-PVW while calculating h c , pvgla 1 out , m/s, When calculating h c , pvgla 2 in , v is the wind speed on the inner surface of ST-PVW. σ is a Stefan–Boltzmann constant, equal to 5.67 × 10 8 , W/(m2·K4).
Taking into account the high accuracy of the five-parameter model of the single diode equivalent circuit, which not only matches the time step of the building thermal calculation, but also fully reflects the mutual influence of the working temperature and power generation efficiency of the photovoltaic modules in the building, the single-diode five-parameter model is selected as the photovoltaic dynamic power model. The I-V characteristic equation [23] of the photovoltaic cells is:
I = I ph I o exp U + I R s a 1 U + I R s R sh
where, I ph represents photovoltaic cell photocurrent, A. I o represents equivalent diode reverse saturation current, A. a represents the curve fitting factor. R s represents the equivalent circuit series resistance, Ω. R sh represents equivalent circuit parallel resistance, Ω. These five parameters can be solved by the nameplate parameters of photovoltaic modules.

3. Numerical Simulation Process and Experimental Verification

3.1. Numerical Calculation Process

In the above energy balance equation of ST-PVW, the working temperature of photovoltaic cell is used as the common input parameter of photovoltaic power generation and heat transfer. Therefore, the working temperature of photovoltaic module is used as the intermediate variable to solve the energy balance equation and dynamic power model of ST-PVW by coupling iteration. Considering that the thermal and electrical properties of ST-PVW with different PVR are quite different, it is necessary to solve the solar heat gain coefficient (SHGC) and the comprehensive heat transfer coefficient (U-value) of the ST-PVW [24] according to Formula (10) and Formula (11) combined with the non-photovoltaic cell coverage part of the ST-PVW, and then calculate the heat gain. SHGC determines the direct solar energy into the indoor heat [25]. U-value determines the heat gain and loss caused by the temperature difference between indoor and outdoor through the window [26], which will affect the cooling and heating load of the building air conditioning system, thus changing the energy consumption of the building [10,27]. The solution flow chart is shown in Figure 2, where T gla 1 , o , T gla 1 , i , T gla 2 , o   and T gla 2 , i represent the node temperature at the outer surface of the outer glass layer, the inner surface of the outer glass layer, the outer surface of the inner glass layer and the inner surface of the inner glass layer, respectively, K.
S H G C = τ gla 1 τ EVA τ gla 2 1 PVR + ( α gla 1 α EVA 1 α gla 1 PVR h total , pvgla 2 , i h total , pvgla 2 , i + h total , pvgla 1 , o + α gla 1 α EVA α gla 2 1 PVR h total , gla 2 , i h total , gla 2 , i + h total , gla 1 . o )
U = ( PVR 1 h total , pvgla 2 , i + 1 h total , pvgla 1 , o + 2 d gla 1 λ gla 1 + 2 d EVA 1 λ EVA 1 + 1 PVR 1 h total , gla 2 , i + 1 h total , gla 1 , o + 2 d gla 1 λ gla 1 + 2 d EVA λ EVA ) 1    
where PVR denotes the area proportion of photovoltaic cells in the ST-PVW, namely, the coverage of photovoltaic cells. h total , pvgla 1 , o and h total , pvgla 2 , i represent the comprehensive heat transfer coefficients of the outer surface and inner surface of the ST-PVW photovoltaic cells, namely, the sum of convective heat transfer coefficient and radiative heat transfer coefficient, W/(m2·K). h total , gla 1 , o , h total , gla 2 , i represent the comprehensive heat transfer coefficients of the outer surface and the inner surface of the ST-PVW without photovoltaic cell coverage, respectively, W/ (m2·K). λ EVA represents the thermal conductivity of the EVA sandwich layer in the non-photovoltaic cell coverage part of the ST-PVW, W/(m·K). d EVA denotes the thickness of the EVA sandwich layer of the transparent crystalline silicon photovoltaic window without photovoltaic cell coverage, m. Other parameters mean the same.

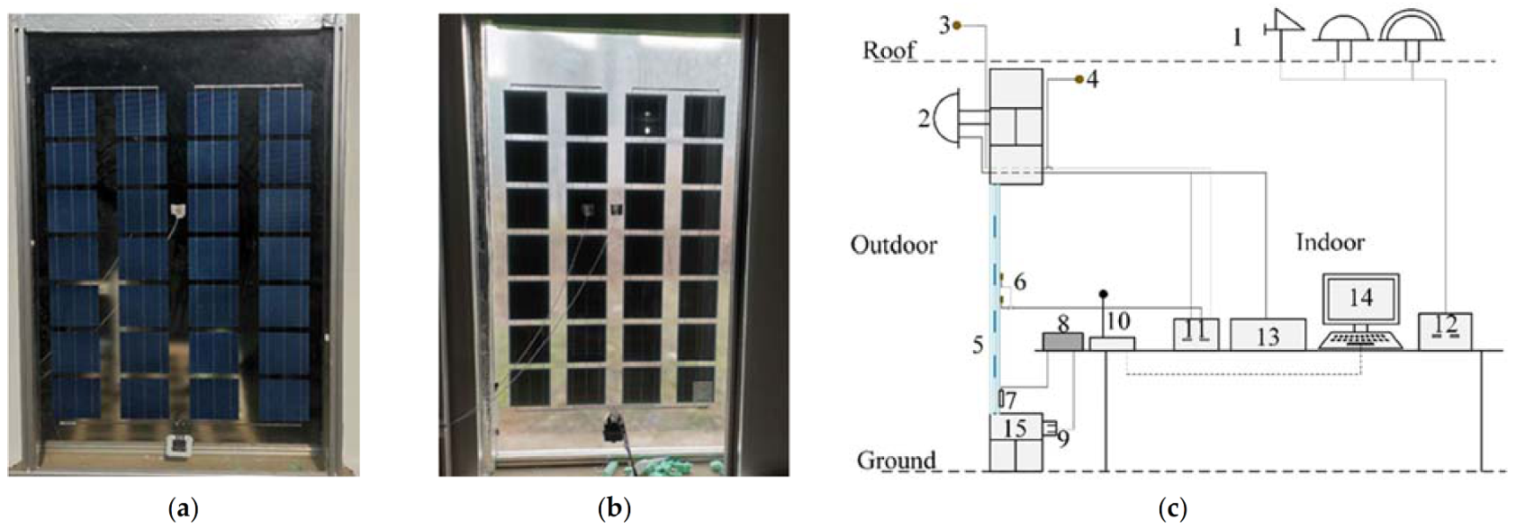
3.2. System Experiment Platform

For the above research, an experimental platform for the southward ST-PVW iwas built in Nanjing, and its schematic diagram and measuring point layout are shown in Figure 3. The ST-PVW is constructed by a 150 W semi-translucent crystal silicon sandwich module with a width of 0.95 m, a height of 1.65 m, and a thickness of 8 mm. The coverage of photovoltaic cells is 46.3%.

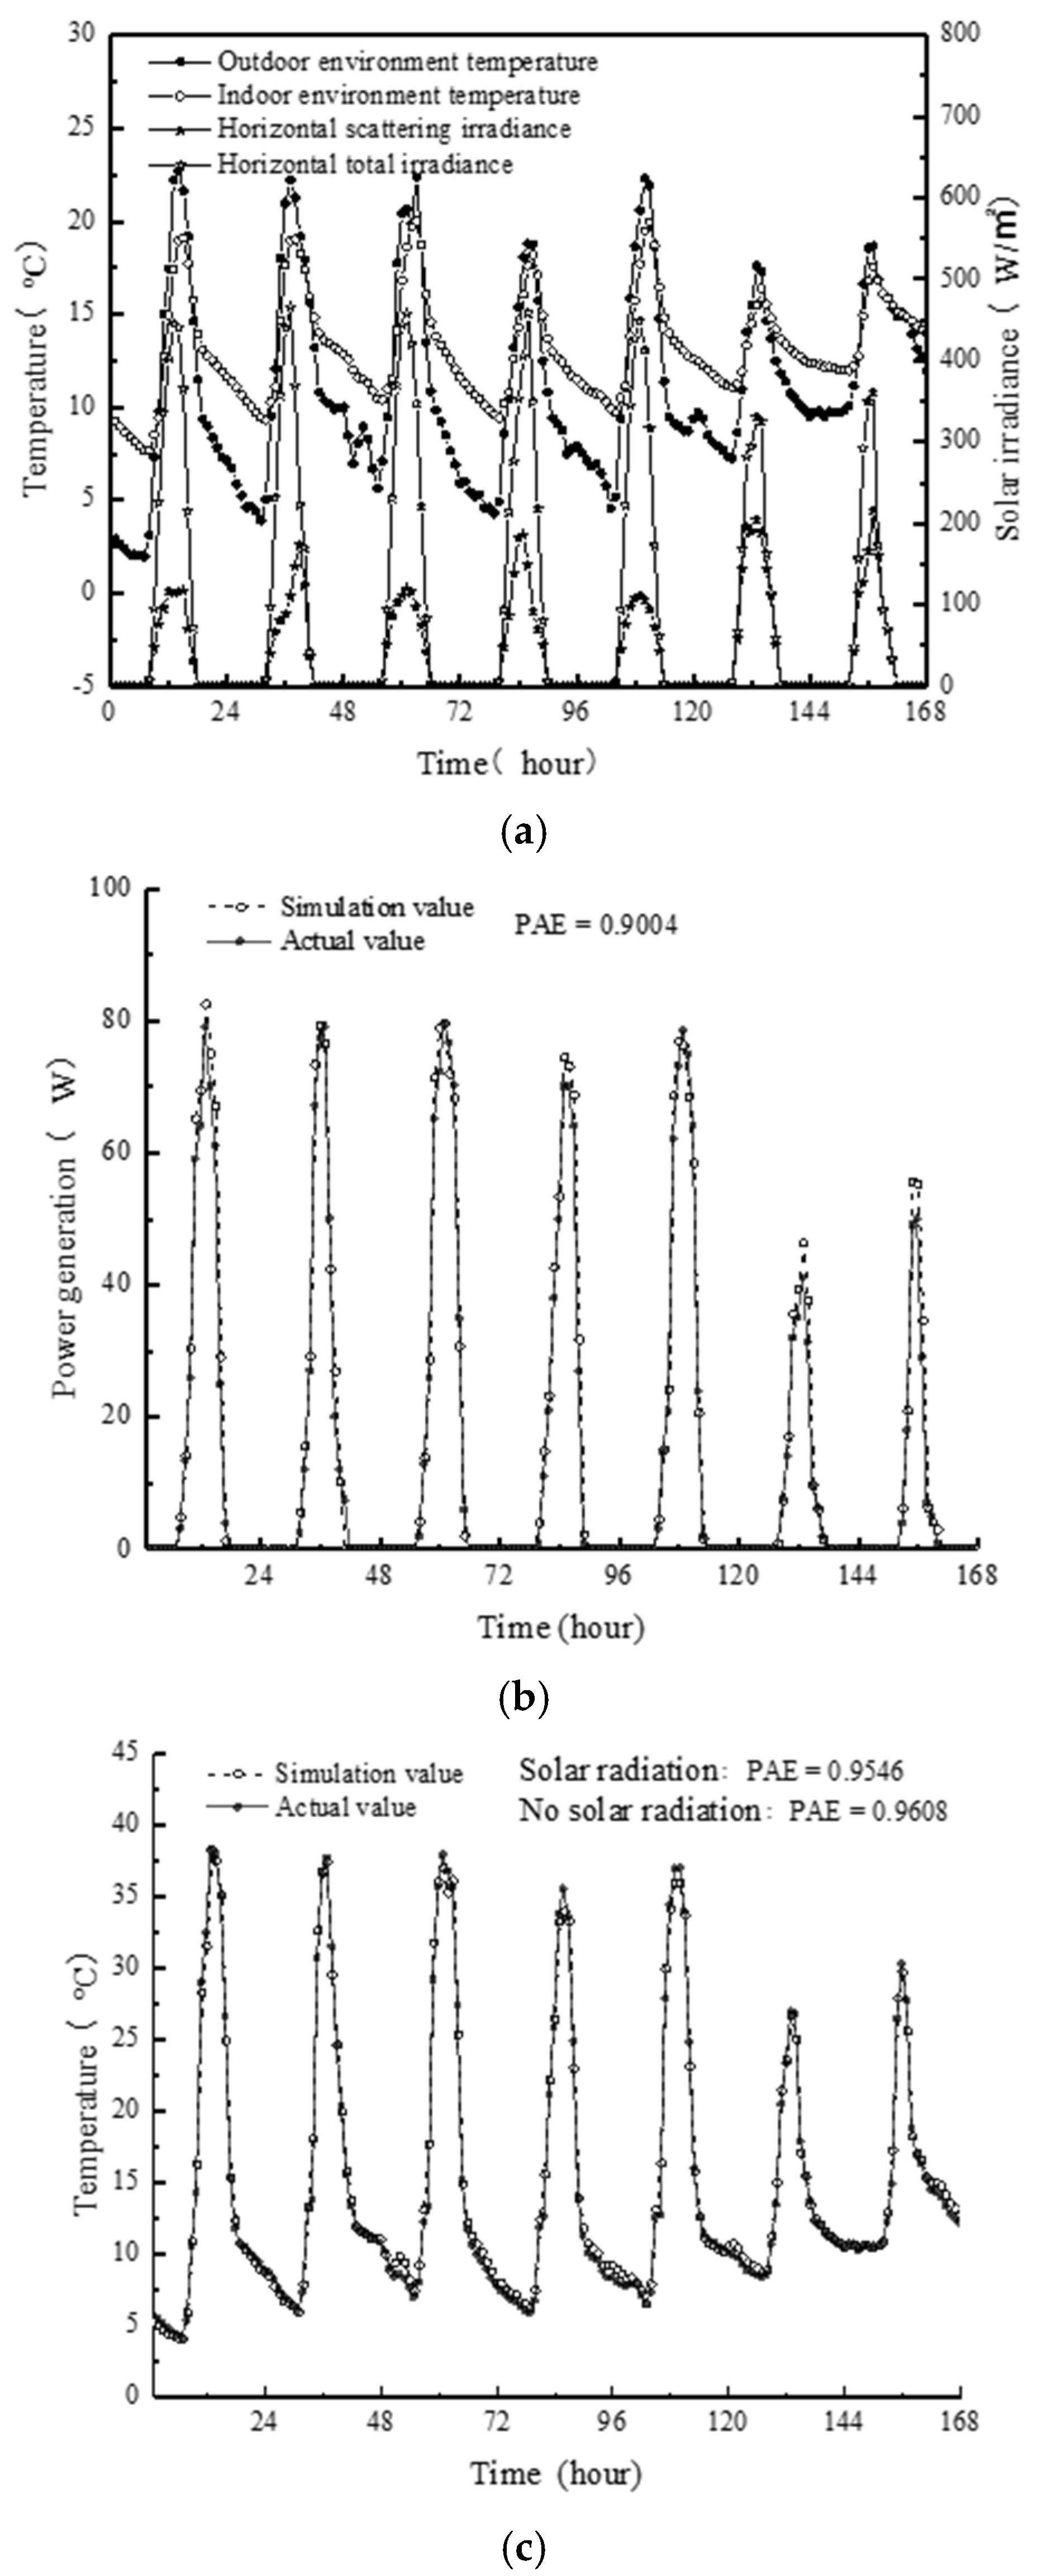
3.3. Experimental Verification and Error Analysis

Based on the above experimental methods and measurement equipment, the continuous acquisition data from 9 December to 15 December 2019 were selected to verify the calculation model. Figure 4a shows the measurement of indoor and outdoor environmental temperature and solar irradiance during this period in Nanjing. Table 1 shows the input parameters of the simulation calculation of the ST-PVW. The accuracy rate (PAE) was used to evaluate the simulation results, and the closer this value is to 1.00, the more correct the simulation value is.
Figure 4b shows the comparison between the simulated and measured hourly power generation of the ST-PVW in these seven days. It can be seen that the simulated hourly power generation is largely consistent with the measured value, and the correct rate is 0.90. Figure 4c is the comparison between the simulated and measured values of the glass temperature on the inner surface of the ST-PVW photovoltaic cell covering area. During the experiment, regardless of the day (total irradiation > 0) or night (total irradiation = 0), the absolute error between the simulated and experimental values is less than 1 °C, and the correct rate is relatively high, 0.95 in the day and 0.96 at night. Therefore, the comparison between the simulated and measured values of the power generation of the ST-PVW and the glass temperature of the inner surface of the photovoltaic cell covering part shows that the model has certain accuracy.

4. Effect of PVR on the Performance of ST-PVW

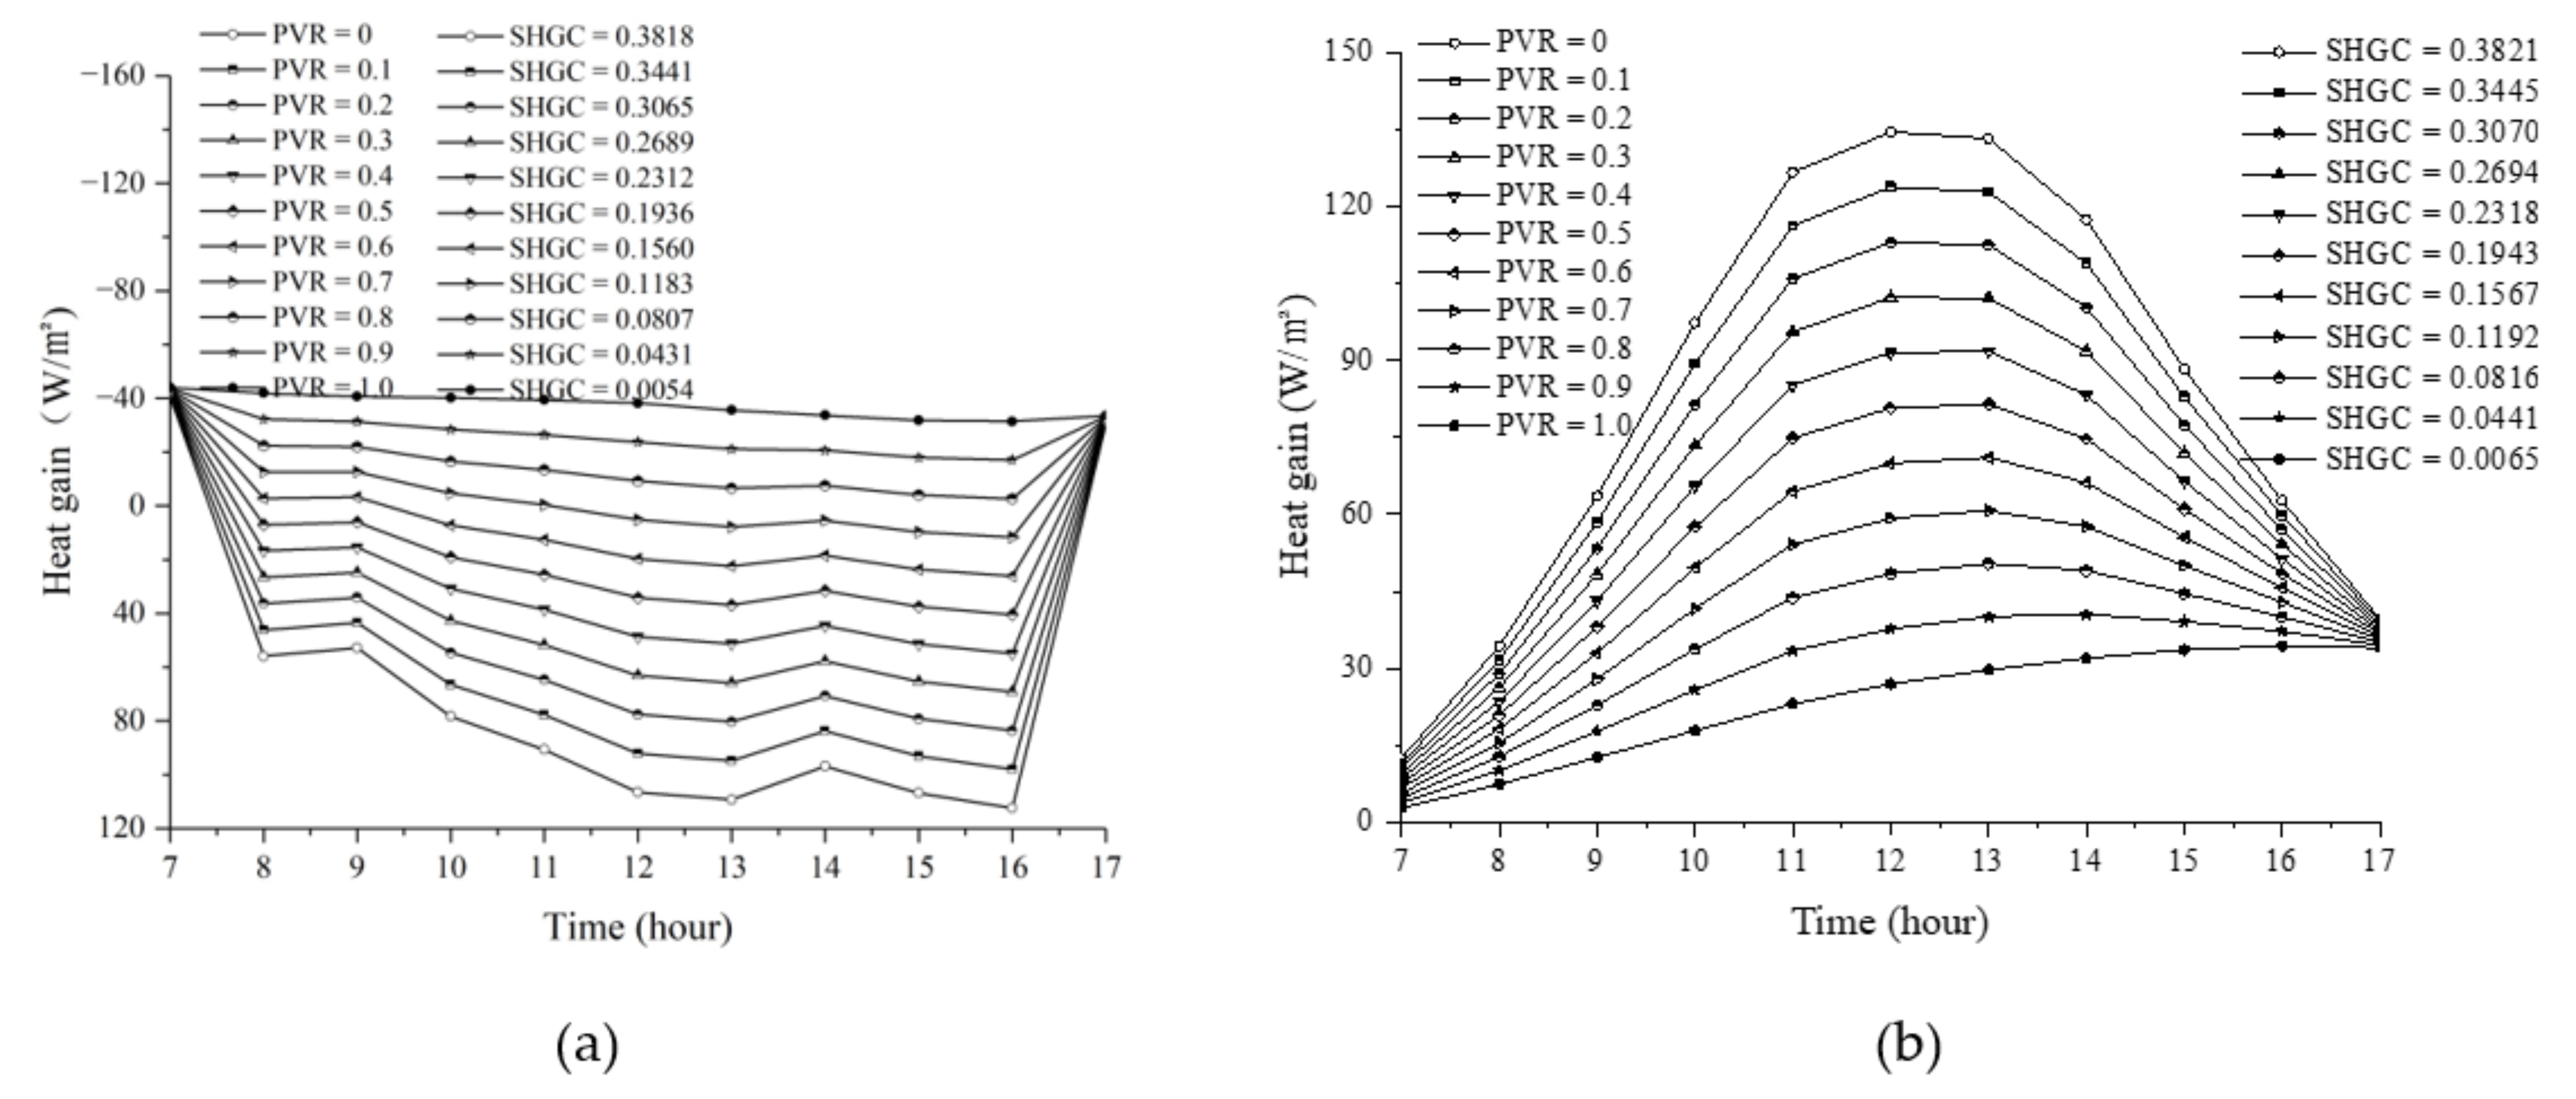
4.1. Effect of PVR on Thermal Performance of ST-PVW

As can be seen from the above, the ST-PVW, due to its translucent characteristics greatly reducing the solar heat gain in the day, so the total heat gain in the day will be lower than the ordinary double sandwich glass window, which is beneficial to reduce the indoor cooling load in summer, and increase the indoor heating load in winter, mainly depends on the PVR of the ST-PVW. Figure 5a,b shows the heat gain of ST-PVW in Nanjing with different PVRs during the daytime on typical days in summer and winter, respectively. It can be seen that in summer, the heat gain of ST-PVW decreases with the increase of PVR, while in winter, the heat loss of ST-PVW increases with the increase of PVR. This is because the ST-PVW with different PVRs have different SHGC values, and the larger the PVR is, the smaller the SHGC value is. On a typical summer day, the ST-PVW is in the heat gain state, and when PVR = 1, the minimum SHGC is 0.0065, so the total heat gain is the smallest. On the typical winter day, the heat gain state of the ST-PVW depends on its PVR value. When the PVR is greater than 0.8, the occlusion of the photovoltaic cell reduces the heat gain of the indoor solar radiation, so that it is in the heat loss state in the daytime as a whole. When the PVR is less than 0.5, the ST-PVW is in the heat gain state from 8:00 to 16:00.

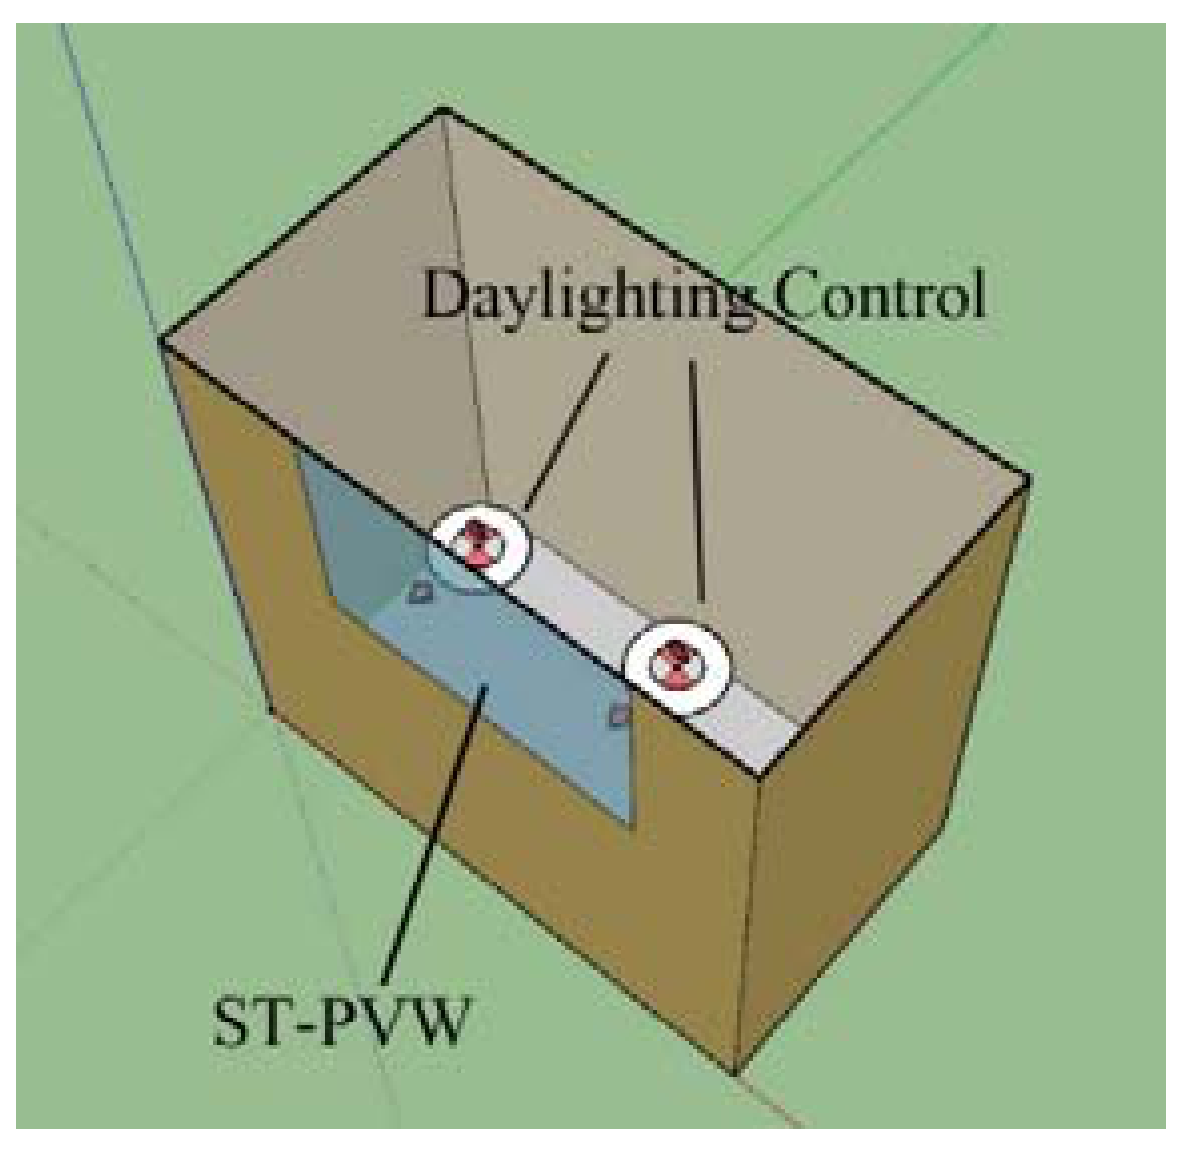
4.2. Effect of PVR on Building Energy Consumption

PVR will not only affect the thermal performance of the ST-PVW, but also affect its power generation performance and lighting performance. This part analyzes the optimal PVR value of the ST-PVW from the total energy consumption of heat, electricity and lighting in summer and winter. By using Energy Plus software, a building model with an area of 1.2 m2 in Nanjing was established, and ST-PVW with an area of 1.46 m2 was installed on the south wall. The design temperature of indoor heating and air conditioning is 26 °C in summer and 18 °C in winter, and the refrigeration and heating efficiency are 2.8. The normalized power density of lamps is 5 w/m2, and the lighting model is the calculation model of artificial lighting supplement. Using lighting control, the luminance of 75 cm working face in the room is maintained at 300 Lux. When the luminance of the working face exceeds 300 Lux, the energy consumption of artificial lighting is 0. When the illuminance of the working face is lower than 300 Lux, the artificial lighting will automatically supplement and maintain the illuminance at 300 Lux, so as to calculate the energy consumption of artificial lighting. Figure 6 shows the model established in the simulation software, and the roof cannot be seen because of the use of the section drawing.
The energy consumption values within 4 months in summer and 3 months in winter were obtained by simulation, and the optimal PVR value considering energy consumption was explored. The cooling and heating energy consumption, PV power generation and lighting energy consumption in different periods of the building are obtained by simulation. The influence of PVR on building energy consumption can be gained by calculating the TEC (total energy consumption) in the cooling and heating period of the building. The TEC in the cooling and heating period of the building is calculated by Equation (12).
T E C = E H + E C + E L E G
where E H , E C ,   E L ,   E G denote heating energy consumption, cooling energy consumption, lighting energy consumption and photovoltaic power generation, respectively, kWh/m2. The energy consumption values and TEC are shown in Table 2.
According to Table 2, with the growth of PVR value, heating energy consumption will increase continuously in winter and cooling energy consumption will decrease in summer, while lighting energy consumption and PV power generation will also increase. Through the calculation of TEC value, it can be found that when PVR is less than 0.6, TEC will decrease with the rise of PVR; when PVR is greater than 0.6, increasing PVR will increase TEC. It can be seen that in these six cases, PVR = 0.6 is the condition that can save building energy consumption most, TEC value is 15.63 kWh/m2, and the benefit is the largest.

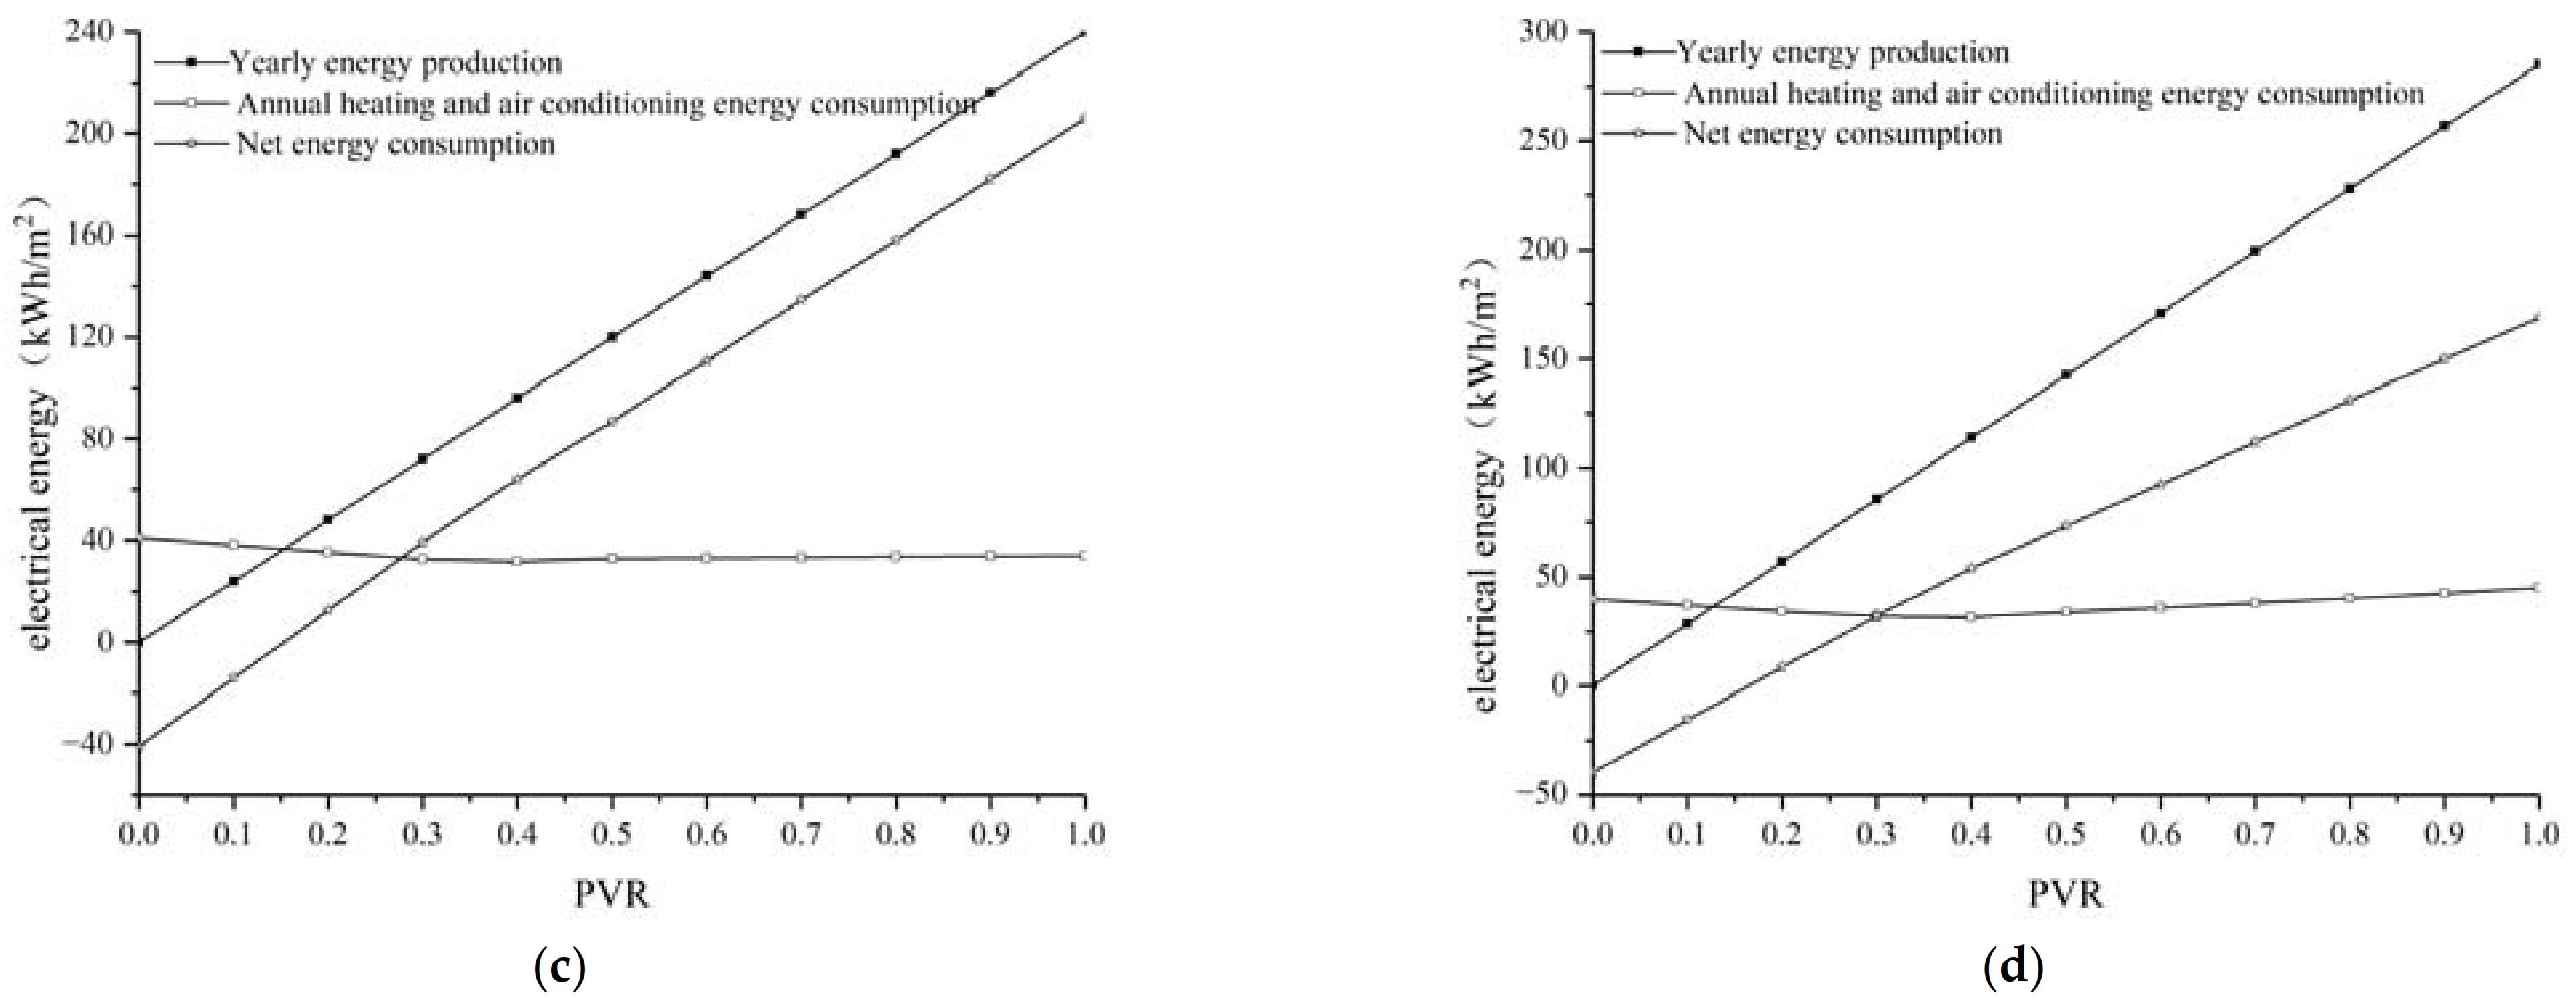
4.3. Analysis of the Impact of PVR in Different Regions

PVR will not only affect the thermal performance of the ST-PVW, but also lead to large differences in the power generation per unit area due to the different photovoltaic cell areas. Based on the above model, the influence of PVR in different regions on the thermal and electrical properties of ST-PVW is simulated. Figure 7a–d shows the annual power generation and cooling or heating power consumption caused by heat gain or heat loss of ST-PVW in four typical climate regions of Guangzhou, Nanjing, Beijing and Harbin. In order to maintain the unity of the system, the design temperature of indoor heating and air conditioning is 26 °C in summer and 18 °C in winter. The cooling efficiency of the air conditioning system in summer is calculated as 2.78 [28]. The thermal efficiency of gas boilers in winter is calculated as 0.8 [29], and the natural gas consumed is converted into electricity by conversion coefficient 3.02 [30].
It can be seen from Figure 7 that in these four cities, the annual power generation of ST-PVW increases with the increase of PVR, while the power consumption of air conditioning shows different trends, mainly because the energy consumption of heating and air conditioning in different cities is quite different in summer and winter, and when the PVR is in a specific range, the power generation is just equal to the power consumption of heating and air conditioning due to heat gain or heat loss. Among them, Guangzhou is a hot summer and warm winter zone, and the heating power consumption in winter is the smallest among the four cities, while the cooling power consumption in summer is significantly larger. In the whole year, with the increase of PVR, the power consumption of air conditioning gradually decreases, and the ST-PVW can significantly reduce the heat gain in summer. Therefore, when the PVR is close to 0.16–0.17, the power generation can just offset the power consumption of air conditioning. Nanjing is a hot summer and cold winter zone, which is humid and sultry in summer. The annual heating and air conditioning energy consumption is the largest in these four cities, and the heating energy consumption in winter is also high. In the whole year, with the increase of PVR, the energy consumption of heating, air conditioning and air conditioning first decreases and then increases. When the PVR is close to 0.60–0.64, the air conditioning power consumption reaches the minimum. Nanjing is located in the four categories of solar energy resources, and the annual power generation is the minimum in these four cities. When the PVR is close to 0.24–0.25, the power generation is just equal to the air conditioning power consumption. Beijing is a cold region. The energy consumption of heating and air conditioning in winter increases significantly, and the cooling power consumption in summer is also relatively large. Therefore, the annual energy consumption of heating and air conditioning decreases first and then increases with the increase of PVR. When the PVR is close to 0.28–0.32, the energy consumption of heating and air conditioning reaches the minimum, while the solar energy in Beijing is relatively sufficient, and the power generation is roughly similar to that in Guangzhou. When the PVR is 0.22–0.23, the power generation just offsets the energy consumption of heating and air conditioning. Harbin belongs to the cold zone, winter heating energy consumption in the four cities is the largest, and the summer is relatively cool, cooling power consumption in the four cities is the least, so the annual heating and air conditioning energy consumption with the increase of PVR decreases slowly first and then rises rapidly, when the PVR is close to 0.26–0.30, heating and air conditioning energy consumption is the smallest, and Harbin belongs to the areas with poor solar energy resources, the annual power generation is significantly higher than other cities, when the PVR is close to 0.19–0.20, the power generation can just offset the air conditioning power consumption.

5. Conclusions

  • The thermal-electric coupling calculation model based on dynamic power proposed in this paper is used to accurately simulate the thermal and electrical properties of the ST-PVW;
  • The thermal performance of ST-PVW in summer and winter mainly depends on the PVR of ST-PVW. In summer, the heat gain of ST-PVW decreases with the increase of PVR, while in winter, the heat loss of ST-PVW increases with the increase of PVR. On typical summer days, ST-PVW is in a heat-gaining state. In typical winter days, when the PVR is greater than 0.8, the ST-PVW is in a state of heat loss in the daytime. When the PVR is less than 0.5, the ST-PVW is in heat-gaining state from 8:00 to 16:00;
  • PVR will affect the energy consumption of heating and cooling and indoor lighting. In Nanjing, if the lighting energy consumption is considered, the building energy consumption reaches the minimum when PVR is 0.6, and the total energy consumption is 15.63 kWh/m2;
  • For different regions, climate conditions and solar energy resources are different, and the PVR will have great differences in the thermal and electrical properties of ST-PVW. According to the simulation results, for Guangzhou, Nanjing, Beijing and Harbin, when the PVR is 1.00, 0.60–0.64, 0.28–0.32 and 0.26–0.30, the annual air conditioning power consumption reaches the minimum, and when the PVR is 0.16–0.17, 0.24–0.25, 0.22–0.23 and 0.19–0.20, the power generation of ST-PVW can just offset the air conditioning power consumption in the daytime.

Author Contributions

Writing—original draft preparation, W.Z.; Writing—review & editing, K.L.; Formal analysis, S.M.; Project administration, T.G.; Software, Y.Z.; Writing—original draft, W.Z. All authors have read and agreed to the published version of the manuscript.

Funding

This research was funded by the National Natural Science Foundation of China (Grant No. 51908287), the National Natural Science Foundation of Jiangsu Province (Grant No. BK20180484), and the Opening Funds of State Key Laboratory of Building Safety and Built Environment and National Engineering Research Center of Building Technology (Grant No. BSBE2020-7).

Institutional Review Board Statement

Not applicable.

Informed Consent Statement

Not applicable.

Data Availability Statement

Not applicable.

Acknowledgments

The authors gratefully acknowledge the support provided by the National Natural Science Foundation of China (Grant No. 51908287), the National Natural Science Foundation of Jiangsu Province (Grant No. BK20180484), and the Opening Funds of State Key Laboratory of Building Safety and Built Environment and National Engineering Research Center of Building Technology (Grant No. BSBE2020-7).

Conflicts of Interest

The authors declare no conflict of interest.

Nomenclature

PVphotovoltaic
PVRphotovoltaic cell coverage rate
ST-PVWSemi-transparent Crystalline Silicon Photovoltaic Windows
PAEaccuracy rate
SHGCsolar heat gain coefficient
EVAethylene-vinyl acetate
TECthe total energy consumption
Ttemperature, ℃
hheat transfer quantity, W/(m2·K)
εsurface emissivity, W/m2
αradiant heat absorption coefficient
τradiation penetration coefficient
λthermal conductivity, W/ (m · K)
dthickness, m
Epower generation, W/m2
Icurrent, A
acurve fitting factor
Rresistance, Ω
νwind speed, m/s
σStefan–Boltzmann constant, 5.67 × 10 8 W/(m2·K4)
UU-value
pvgla1the outer glass layer
pvgla2the inner glass layer
othe outer surface
ithe inner surface
eoutdoor environment
roomindoor
cconvective
rradiation
gla1the outer surface of the ST-PVW
gla2the inner surface of the ST-PVW
eva1the outer EVA sandwich
eva2the inner EVA sandwich
sthe equivalent circuit

References

  1. China Association of Building Efficiency (CABEE). Research Report on Building Energy Consumption in China. Constr. Archit. 2020, 7, 30–39. [Google Scholar]
  2. Peng, J.; Lin, L. Investigation on the Development Potential of Rooftop PV System in Hong Kong and its Environmental Benefits. Renew. Sustain. Energy Rev. 2013, 27, 149–162. [Google Scholar] [CrossRef]
  3. Hou, G.; Honghang, S.; Ziying, J.; Ziqiang, P.; Yibo, W.; Xiaodan, Z.; Ying, Z.; Qiang, Y. Life Cycle Assessment of Grid-Connected Photovoltaic Power Generation from Crystalline Silicon Solar Modules in China. Appl. Energy 2016, 164, 882–890. [Google Scholar] [CrossRef]
  4. Rezaei, S.D.; Santiranjan, S.; Seeram, R. A Review of Conventional, Advanced, and Smart Glazing Technologies and Materials for Improving Indoor Environment. Sol. Energy Mater. Sol. Cells 2017, 159, 26–51. [Google Scholar] [CrossRef]
  5. Kou, R.; Zhong, Y.; Wang, Q.; Kim, J.; Chen, R.; Qiao, Y. Improved Window Energy Efficiency with Thermal Insulating Polymer-Air Multilayer. Appl. Therm. Eng. 2021, 191, 116890. [Google Scholar] [CrossRef]
  6. Sun, Y.; Wu, Y.; Wilson, R. A Review of Thermal and Optical Characterisation of Complex Window Systems and their Building Performance Prediction. Appl. Energy 2018, 222, 729–747. [Google Scholar] [CrossRef]
  7. Barman, S.; Chowdhury, A.; Mathur, S.; Mathur, J. Assessment of the Efficiency of Window Integrated CdTe Based Semi-Transparent Photovoltaic Module. Sustain. Cities Soc. 2018, 37, 250–262. [Google Scholar] [CrossRef]
  8. Ye, H.; Long, L.; Zhang, H.; Gao, Y. The Energy Saving Index and the Performance Evaluation of Thermochromic Windows in Passive Buildings. Renew. Energy 2014, 66, 215–221. [Google Scholar] [CrossRef]
  9. Lu, L.; Law, K.M. Overall Energy Performance of Semi-Transparent Single-Glazed Photovoltaic (PV) Window for a Typical Office in Hong Kong. Renew. Energy 2013, 49, 250–254. [Google Scholar] [CrossRef]
  10. Peng, J.; Lu, L.; Yang, H.; Ma, T. Comparative Study of the Thermal and Power Performances of a Semi-Transparent Photovoltaic Facade under Different Ventilation Modes. Appl. Energy 2015, 138, 572–583. [Google Scholar] [CrossRef]
  11. Alrashidi, H.; Ghosh, A.; Issa, W.; Sellami, N.; Mallick, T.K.; Sundaram, S. Thermal Performance of Semitransparent CdTe BIPV Window at Temperate Climate. Sol. Energy 2020, 195, 536–543. [Google Scholar] [CrossRef]
  12. Leite, D.; Evelise, L.; Wagner, A. Semi-Transparent PV Windows: A Study for Office Buildings in Brazil. Energy Build. 2013, 67, 136–142. [Google Scholar] [CrossRef]
  13. Yu, G.; Yang, H.; Luo, D.; Cheng, X.; Ansah, M.K. A Review on Developments and Researches of Building Integrated Photovoltaic (BIPV) Windows and Shading Blinds. Renew. Sustain. Energy Rev. 2021, 149, 111355. [Google Scholar] [CrossRef]
  14. Li, D.H.; Lam, T.N.; Chan, W.W.; Mak, A.H. Energy and Cost Analysis of Semi-Transparent Photovoltaic in Office Buildings. Appl. Energy 2009, 86, 722–729. [Google Scholar] [CrossRef]
  15. Fung, T.Y.Y.; Yang, H. Study on Thermal Performance of Semi-Transparent Building-Integrated Photovoltaic Glazings. Energy Build. 2008, 40, 341–350. [Google Scholar] [CrossRef]
  16. Liao, W.; Xu, S. Energy Performance Comparison among See-Through Amorphous-Silicon PV (Photovoltaic) Glazings and Traditional Glazings Under Different Architectural Conditions in China. Energy 2015, 83, 267–275. [Google Scholar] [CrossRef]
  17. Jia, J.; Gao, F.; Cheng, Y.; Wang, P.; EI-Ghetany, H.H.; Han, J. A Comparative Study on Thermoelectric Performances and Energy Savings of Double-Skin Photovoltaic Windows in Cold Regions of China. Sol. Energy 2020, 206, 464–472. [Google Scholar] [CrossRef]
  18. Guo, W.W.; Qiu, Z.Z.; Li, P.; He, J.; Zhang, Y.; Li, Q.M. Application of PV Window for Office Building in Hot Summer and Cold Winter Zone of China. Adv. Mater. Res. 2012, 347, 81–88. [Google Scholar] [CrossRef]
  19. Skandalos, N.; Karamanis, D. Investigation of Thermal Performance of Semi-Transparent PV Technologies. Energy Build. 2016, 124, 19–34. [Google Scholar] [CrossRef]
  20. Ghosh, A.; Sundaram, S.; Mallick, T.K. Investigation of Thermal and Electrical Performances of a Combined Semi-Transparent PV-vacuum Glazing. Appl. Energy 2018, 228, 1591–1600. [Google Scholar] [CrossRef]
  21. Wysocki, J.J.; Rappaport, P. Effect of Temperature on Photovoltaic Solar Energy Conversion. J. Appl. Phys. 1960, 31, 571–578. [Google Scholar] [CrossRef]
  22. Agathokleous, R.A.; Kalogirou, S.A. Double Skin Facades (DSF) and Building Integrated Photovoltaics (BIPV): A Review of Configurations and Heat Transfer Characteristics. Renew. Energy 2016, 89, 743–756. [Google Scholar] [CrossRef]
  23. Ma, M.; Liu, H.; Zhang, Z.; Yun, P.; Liu, F. Rapid diagnosis of hot spot failure of crystalline silicon PV module based on I-V curve. Microelectron. Reliab. 2019, 100-101, 113402. [Google Scholar] [CrossRef]
  24. Liao, W. Investigation of Overall Energy Performance of Transparent mono Crystalline Silicon Glazing in Architecture Application. Huazhong Univ. Sci. Technol. 2015, 92. [Google Scholar]
  25. Chen, F.; Wittkopf, S.K.; Ng, P.K.; Du, H. Solar Heat Gain Coefficient Measurement of Semi-Transparent Photovoltaic Modules with Indoor Calorimetric Hot Box and Solar Simulator. Energy Build. 2012, 53, 74–84. [Google Scholar] [CrossRef]
  26. Cuce, E.; Young, C.-H.; Riffat, S.B. Thermal Performance Investigation of Heat Insulation Solar Glass: A Comparative Experimental Study. Energy Build. 2015, 86, 595–600. [Google Scholar] [CrossRef]
  27. Peng, J.; Lu, L.; Yang, H. An Experimental Study of the Thermal Performance of a Novel Photovoltaic Double-Skin Facade in Hong Kong. Sol. Energy 2013, 97, 293–304. [Google Scholar] [CrossRef]
  28. Zhou, S.; Zhao, J. Comparative Analysis of Energy Efficiency in Air-Conditioning System with GSHP, Electricity-Driven Refrigerating Unit and Direct-Fired Li-Br Absorption Refrigerating and Heating Unit. Energy Procedia 2012, 16, 673–678. [Google Scholar] [CrossRef] [Green Version]
  29. Wang, M.; Peng, J.; Li, N.; Yang, H.; Wang, C.; Li, X.; Lu, T. Comparison of Energy Performance Between PV Double Skin FacaDes and PV Insulating Glass Units. Appl. Energy 2017, 194, 148–160. [Google Scholar] [CrossRef]
  30. Hu, J.; Kwok, G.; Xuan, W.; Williams, J.H.; Kahrl, F. Using Natural Gas Generation to Improve Power System Efficiency in China. Energy Policy 2013, 60, 116–121. [Google Scholar] [CrossRef]
Figure 1. Schematic diagram of ST-PVW structure: (a) Layered diagram of ST-PVW structure; (b) The name of each part; (c) The temperature node.
Energies 14 07117 g001
Figure 2. Thermal-electric coupling calculation flowchart for ST-PVW.
Energies 14 07117 g002
Figure 3. ST-PVW experimental platform and measuring point layout: (a) ST-PVW outside; (b) ST-PVW inside; (c) Schematic diagram of measuring point layout, 1. Outdoor weather stations. 2. Wall irradiance sensors. 3. Outdoor temperature sensors. 4. Indoor temperature sensor. 5. Photovoltaic glass window. 6. Thermal resistance temperature probe. 7. Photovoltaic module wiring port. 8. Microinverters. 9. Inverter grid interface. 10. Inverter signal receivers. 11. Data recorders. 12. Meteorological data recorder. 13. Regulators. 14. Computers. 15. Building walls.
Energies 14 07117 g003
Figure 4. Comparison between simulated and measured values of ST-PVW in Nanjing: (a) Outdoor meteorological condition; (b) Comparison of hourly power generation of photovoltaic modules; (c) Comparison of glass temperature on inner surface of PV cell.
Energies 14 07117 g004
Figure 5. Effect of PVR on thermal performance of ST-PVW in Nanjing: (a) The relationship between PV window PVR and summer heat gain; (b) The relationship between PV window PVR and winter heat gain.
Energies 14 07117 g005
Figure 6. Simulation modeling model diagram (sectional drawing).
Energies 14 07117 g006
Figure 7. Impact analysis of PVR in different regions: (a) Guangzhou; (b) Nanjing; (c) Beijing; (d) Harbin.
Energies 14 07117 g007aEnergies 14 07117 g007b
Table 1. Simulation input parameters of ST-PVW.
Parameter NameValueParameter NameValue
Short-circuit current I sc /A8.88Thermal radiation absorption coefficient of external and internal glass
α gla
0.25
Open circuit voltage
U oc /V
21.3Thermal radiation penetration coefficients of external and internal glass
τ gla
0.65
Maximum power point current
I mp /A
8.38Thermal conductivity of outer and inner glass
λ gla /(W/(m·K))
1.09
Maximum power point voltage
U mp /V
17.9Thickness of external and internal glass
d gla /m
0.003
Current temperature coefficient
μ I , sc
−0.06%EVA thermal radiation absorption coefficient
α EVA
0.1
Peak power
P m /W
150EVA thermal radiation penetration coefficient
τ E V A
0.9
Photovoltaic window area
A /m2
1.49Thermal conductivity of EVA adhesive
λ E V A /(W/(m·K))
0.116
Photovoltaic cell area
A p v / m2
0.69EVA adhesive thickness
d E V A /m
0.0008
Table 2. The energy consumption values and TEC.
PVRHeating Energy Consumption
E H /(kWh/m2)
Cooling Energy Consumption
E c /(kWh/m2)
Lighting Energy Consumption
E L /(kWh/m2)
PV Power Generation
E G /(kWh/m2)
TEC
/(kWh/m2)
03.3858.5041.390.00103.27
0.23.5150.0441.6921.7873.46
0.43.5141.5841.9843.5643.51
0.63.9233.3043.7365.3115.63
0.88.7824.8471.3087.0917.83
119.8516.38104.94108.8732.30
Publisher’s Note: MDPI stays neutral with regard to jurisdictional claims in published maps and institutional affiliations.

