
Long-Term Natural Gas Consumption Forecasting Based on Analog Method and Fuzzy Decision Tree


Faculty of Management, AGH University of Science and Technology, 30-059 Cracow, Poland
*
Author to whom correspondence should be addressed.
Energies 2021, 14(16), 4905; https://doi.org/10.3390/en14164905
Submission received: 20 June 2021
/
Revised: 29 July 2021
/
Accepted: 4 August 2021
/
Published: 11 August 2021
(This article belongs to the Special Issue Sources and Markets of Coal, Oil, Gas, and Renewable Energy)
Abstract
:Classic forecasting methods of natural gas consumption extrapolate trends from the past to subsequent periods of time. The paper presents a different approach that uses analogues to create long-term forecasts of the annual natural gas consumption. The energy intensity (energy consumption per dollar of Gross Domestic Product—GDP) and gas share in energy mix in some countries, usually more developed, are the starting point for forecasts of other countries in the later period. The novelty of the approach arises in the use of cluster analysis to create similar groups of countries and periods based on two indicators: energy intensity of GDP and share of natural gas consumption in the energy mix, and then the use of fuzzy decision trees for classifying countries in different years into clusters based on several other economic indicators. The final long-term forecasts are obtained with the use of fuzzy decision trees by combining the forecasts for different fuzzy sets made by the method of relative chain increments. The forecast accuracy of our method is higher than that of other benchmark methods. The proposed method may be an excellent tool for forecasting long-term territorial natural gas consumption for any administrative unit.
1. Introduction
Forecasting the consumption of energy has been an important research topic for many decades. Its role has been growing in proportion to the increase in energy demand in all countries of the world. The quality of forecasts in various time horizons and for various time periods remains a significant research problem. A considerable research challenge is to improve the accuracy of long-term forecasts, which do not keep up with the growing volatility of the economic environment in the long term. For instance, for electricity markets, the quality of short-term and medium-term forecasts obtained with the use of various models is relatively good, because, for example, the typical forecasting error of monthly electricity consumption for one geographical area, measured by the mean absolute percentage error MAPE, is about 2% [1]. However, the quality of electricity consumption forecasts may vary depending on the group of consumers and the MAPE error variance, for example, from 2% to 10% for short-term forecasts, while the MAPE error for long-term forecasts is from 4% to 32% [2].
In the case of forecasting of natural gas consumption, the quality of the forecasts is usually lower. The MAPE error in daily gas consumption forecasts is around 10% [3] or slightly less for hourly forecasts on a daily basis—MAPE 6–8% [4]. Forecasts of daily gas consumption on one day in advance, made by the best of the tested algorithms, have the MAPE error of 2% to 5% [5]. Nevertheless, the quality of forecasts significantly differs depending on the time horizon and the algorithms used—the MAPE error can range from 17% to over 100% [6,7]. Along with the extension of the time horizon, the quality of forecasts drops significantly.
In recent years, innovations of forecasting techniques have resulted in a great improvement of forecasting accuracy. Nowadays, the modern forecasting toolbox consists of a wide range of methods from classical statistical methods (autoregressive integrated moving average ARIMA and seasonal ARIMA–SARIMA family or exponential smoothing ETS family) to modern computational intelligence tools (long-short term memory LSTM, neutral networks, etc.). The common denominator of methods mentioned above is the way of describing the uncertainty related to errors in data collection, time lag and reciprocal effect between variables. Modern forecasting methods most often try to quantify this uncertainty using a probabilistic approach based on the time series which represents the behavior of a random variable over time. The occurrence of dependence between observations is a desirable feature that enables the forecasting of time series.
However, it should be remembered that traditional time series forecasting is based on historical data, which are usually incomplete, imprecise, and ambiguous. These uncertainties decrease long-term forecasting accuracy. Unlike classical time series forecasting, the fuzzy approach can deal with vague and incomplete time series data under uncertain circumstances. This problem particularly affects long-term forecasting.
Long-term forecasting is an essential part of the strategic decision-making process. In the case of the natural gas market, such decisions usually concern the situation where gas sellers want to know the demand on territorial area in order to organize their supply chain and plan the infrastructure. It is assumed that the minimum period for this type of decision is five years.
The aim of our article is to show the effectiveness of the analog forecasting paradigm (by analogy) in combination with the fuzzy approach for forecasting long-term gas demand. Analog forecasting is a method of forecasting value of variable based on another variable that has a similar change in value over time, but not simultaneously. Our goal is to find a methodology for forecasting long-term annual gas consumption with a low forecast error, allowing the use of economic data from some territorial units to construct a forecast for other similar territorial units. Territorial units can be entire countries, as in the case of our research, but also administrative units of any country or geographic region.
In simple terms, the forecasting methodology proposed in this article is as follows. Based on data on the annual consumption of natural gas and other energy carriers over many years, in dozens of countries around the world, we find groups with similar characteristics of annual consumption and the structure of energy carriers. As a result of grouping, a single country may be included in several clusters in different years. Then, using a fuzzy decision tree, we classify all countries in individual years into previously created groups using other explanatory variables, this time economic, social, and climatic. As a result, we create a prediction of membership to the energy consumption groups based on the forecasts of socio-economic indicators being the values of the explanatory variables in the formerly built fuzzy decision tree. In the last step, using the chain increment method, we build forecasts of natural gas consumption for individual countries based on average indicators of changes in the structure of energy consumption in individual energy consumption groups.
The rest of the article is organized as follows. Section 2 provides an overview of research in the area of forecasting of natural gas consumption. Section 3 introduces the concept of analog forecasting. Section 4 contains the formal foundations of fuzzy sets and fuzzy decision trees. The data with their basic statistical analysis are described in Section 5. Section 6 presents the research methodology. Section 7 contains the research results and their discussion. Section 8 presents conclusions and directions for further research.
2. Literature Review
Long-term gas consumption forecasting, although it seems to be a recognized research topic, have still not received universal solutions [8,9]. This is due to the diversified decision makers’ demand for the granularity of forecasting information and differences in gas consumption patterns between countries. Taking into account the publication activity, after 2008 we have observed a significant increase in interest in this area (10–20 publications a year [8,9], previously there were 1–2 publications a year).
Every market is made up of producers and consumers. In a broader context, forecasting the consumption of natural gas is an attempt to show the market potential. Thus, we are trying to solve two related problems—Can producers sell more and cheaper? Can demand keep pace with or exceed supply? On the gas market, we are dealing with a situation in which, on the one hand, we observe an increase in consumption. On the other hand, at some point (called peak), the production will start to decline. The market is therefore described by two types of models: one for production and the other for consumption. In our article, we will focus on the demand part of the natural gas market.
The most well-known model for predicting production peak is the Hubbert curve. According to this theory, the production of any fossil fuel first increases due to the discovery of new resources and technology improvements, then reaches its peak and declines. The point at which each fossil fuel will achieve its peak has been predicted many times (e.g., Hubbert originally set the year 2000 for the oil peak). It is important to stress that this is not due to the weakness of the theory, but the fact that the parameters are burdened with uncertainty The difficulties in building the model lie in the uncertainty of the rate of: discovery of new sources, the development of mining technology, and consumption over time. Current research estimates peaks for coal in 2014, oil in 2022, and gas in 2030 [10]. Other studies report a natural gas peak in 2035 with a ten to fifteen-year plateau [11].
Hubbert model [12] can be considered as a pillar and one of first studies of natural gas forecasting. Despite its simplicity, it worked quite well in long-term forecasts. It was very popular in 1950–1970. Nowadays, it is still often used to forecast oil peak. Several publications include significant uses of the Hubbert model in the 21st century for gas peak. In [13], multicycle Hubbert model is employed to forecast gas production in China and Grey model to forecast consumption. Gray theory is especially useful for developing a model with a small amount of incomplete data, which is common in long-term forecasts. In [14] Hubbert model with Starzman modification was implemented to forecast gas demand in Poland. Researchers estimated the forecast error at 20%, which is high compared to classical methods. Mohr et al. [15] present projections of fossil fuel production for China, USA, Canada, Australia and the whole world. They predict a gas peak for the world in 2050. Recent uses of the Hubbert model (2019) relate to forecasts for Ecuador [16] and Pakistan [17].
However, Cavallo in his paper [18] made a critical assessment and has shown that the Hubbert model has failed in situations of substantial economic change, especially for political or social reasons. The second major disadvantage is the fact that it fits only the forecasts of large countries, such as the USA, which are net producers and importers of gas.
In the gas forecasting literature, many more items relate to consumption than production. Regarding smaller countries, individual forecasting methodology of natural gas consumption for countries of a similar size is more appropriate than the general Hubbert model. Relevant studies include: ref [19] (decomposition method), ref [20] (neural networks, Belgium), ref [21] (Spain, stochastic diffusion models), ref [22] (Turkey, econometric models), ref [23] (Turkey, machine learning, neural networks), ref [24] (Turkey, Gray models), ref [25] (Argentina, aggregation of short- and long-run models). However, these models are usually country specific which makes it difficult to use for other countries.
There are many forecasts of natural gas demand in the US, Canada, China (e.g., [26,27,28]), and Australia, but their accuracy is worse for smaller countries compared to country-specific models. The trend of building country-specific forecasts is very visible in the literature. Policymakers are interested in the relationship between consumption and country-specific variables. Unfortunately, the literature on forecasting for middle markets, e.g., Poland, is quite scarce and includes: ref [14] (logistic model), ref [29] (neural networks, medium-term forecasting for a single urban area).
The main research gap is that long-term forecasting appears only in about 20% of studies [8,9,30]. Many researchers create long-term forecasts using models with dependent macroeconomic variables (GDP, population, unemployment rate, etc.), without distinguishing between spatial and types of gas consumption (private-industrial). Exceptions here are the forecasts for Iran [31] (logistic regression and genetic algorithms) and Argentina [25] (logistic models, computer simulation and optimization models), ref [32] (regression, elasticity coefficients).
The construction of long-term forecasts should also consider the analysis of difficult to quantify factors, such as political regulations or changes in private consumption. For this purpose, attempts are made to approximate the behavior of consumers through the use of text streams in the web and sentimental analysis [33]. This is a relatively new approach and there is no extensive research in the literature yet.
Short-term gas consumption forecasts, traditionally using simple time series forecasting models, are more and more often replaced by artificial neural networks, in particular deep neural networks, including LSTM (Long Short Term Memory) networks [3,5,34].
However, in contemporary research, econometric and statistical methods are most often used. In the literature, the most popular group of models are econometric models (e.g., [35,36]) and statistical models ([19,22]). Recent years have brought a lot of interest in artificial intelligence methods [20,24,37,38,39]. The latest research (2018) [9] compares the accuracy of more than 400 models of energy demand planning. The authors of this study note that statistical methods work better in short- and medium-term models, while in the long-term, models based on computational intelligence are much better. This is due to, among others, the advantage of computational intelligence methods for poorly cleaned data. Typical data sets used in gas demand forecasts are: gas consumption profiles, macro- and microeconomic data (e.g., households), and climatic data [40].
The Gray models have become quite popular recently [24,26,27] and they give good results in the case of short time series. A relatively new method presented in this article is the use of the fuzzy approach in gas forecasting [41,42]. So far, there are few publications on the use of the fuzzy approach in the forecasting of natural gas consumption in relation to other forecasting methods. Significantly, in recent years the interest in this approach has been growing. It is commonly expressed in the literature that the accuracy of forecasts in each horizon can be significantly improved by aggregating forecasts made with different methods [43,44]. For gas consumption, a typical combination of forecasts is a mixture of regression and neural networks [45,46]. Regression extrapolates trends better, and neural networks give better estimation of changes in the behavior of the forecasted object over time. This is possible because the artificial intelligence approach allows for the evolution of parameters over time. For long-term forecasting Azadeh et al. [47] proposed a methodology that integrates adaptive neuro-fuzzy inference systems with DEA and Fuzzy DEA to improve forecast for five Middle-Eastern countries.
An important element in creating forecasts is the scenario analysis. Currently, simple scenario-variant analyzes are being built. There are very few gas consumption forecasts with scenario analysis in the literature (e.g., [35,36]—Italy, regression analysis).
The concept of combining analogue forecasting with a fuzzy decision tree extends the method of medium-term forecasting of sales of clothing industry products proposed by Thomassey and Fiordaliso [48]. This method is based on grouping products using the k-means clustering and then classifying them with a decision tree. Analogue forecasting is often used in forecasting new product sales based on past sales of similar products. This approach was presented for instance by Basallo-Triana, Rodríguez-Sarasty and Benitez-Restrepo [49]. An analogous approach was applied also to the forecasting of sales of steel products [50,51].
The aim of our solution proposed in the article was to build a forecasting method based on analog forecasting and fuzzy decision trees. There are no such solutions in the literature on the subject.
3. Analog Forecasting
The concept of analog forecasting was introduced by Lorenz in 1969 [52] in application to the states of the atmosphere. This concept was later also used in economic forecasting, e.g., [53,54,55].
There are four main analog forecasting methods in the literature [56]:
- The method of biological analogies,
- The method of spatial analogies,
- Historical analogy method,
- The method of space-time analogies.
In the further part of the paper, we applied the spatial-temporal analogy method to selected countries in different periods of time. Assuming that the states of the economy can be described by a set of measurable quantitative indicators, we assume that , where f is the transformation of the state of the economy into a vector of measurable indicators, is a certain state of the economy in period T, and is a vector of selected indicators.
Definition 1.
Letand, be the states of the economy in one or two objects described by the parameter vectors. Similar by analogy are the states of the economy for whichdiffer slightly from each other, with the assumed similarity indexand the assumed error.
The most important methodological problem of the analog forecasting is determining the similarity of states of economy. For quantitative forecasts, quantitative similarity criteria should be used. Regarding time series, they are the shape similarity criterion and the level similarity criterion. In the case of similarity in shape, the critical value should be met, which indicates the existence of a sufficient similarity of the tested fragments of the time series. The objects for which the condition is met:
where is a measure of the similarity of objects O and m, are considered to be similar.
Regarding time series, the criterion for the similarity level of the vectors in two objects O and m is:
where t is time index.
The concept of similarity level commonly used in time series can be easily generalized to an n-dimensional state space (states of the economy or more generally—features of objects) in which objects will be similar if their distance in the n-dimensional feature space is small.
The generalization of the idea of simple time series similarity to states of the economy and , where each observation is a n-dimensional real vector , the similarity criterion takes the form:
where is the norm of a vector.
The generalization of the similarity criterion to n-dimensional vector allows the use of the k-means clustering algorithm. Its idea is to find objects close to each other in the n-dimensional feature space using the mean value of a group of similar objects.
Given a set of observations {1, 2, …, m}, where each observation is a n-dimensional real vector, k-means clustering groups the m observations into k (≤m) sets C = {c1, c2, …, ck} so as to minimize the within-cluster sum of squares (i.e., variance). Formally, the objective is to find:
where is the mean of points in set ci. This is equivalent to minimizing the pairwise squared deviations of points in the same cluster:
The basic algorithm of the k-means method [57] is as follows:
- Determining the number of classes (clusters).
- Selection of class centers (centroids) by random selection of k observations, selection of the first k observations from a set, or selection that allows to maximize the distance of the clusters.
- Assigning points to the nearest centroids—each element is assigned to the class (cluster) to the center of which it has the closest (the measure of similarity here is the distance between the element and the centroid).
- Calculation of new cluster centers—most often the new center of the class is the point whose coordinates are the arithmetic mean of the coordinates of the elements belonging to this class.
- Repeating the algorithm until reaching the convergence criterion (usually it is a step in which the allocation of points has not changed or after the algorithm has reached the number of adopted iterations).
To calculate distance between observations the Euclidean distance (Equation (6)), Manhattan distance (Equation (7)), or Minkowski distance (Equation (8)) are among the most popular measures. Let observations and be n-dimensional vectors. Euclidean distance is defined as:
Similarly, we can define other measures: Manhattan
and Minkowski distance, which is a generalization of Euclidean distance
After obtaining the assignment of objects to classes based on a certain set of features, it is possible to make forecasts for new objects based on the similarity criterion determined for other features of objects belonging to each class.
4. Fuzzy Approach in Learning Decision Trees
4.1. Basic Concepts of Fuzzy Learning
Regardless of the continuous development of methods of obtaining knowledge from data, classical crisp approach is insufficient to represent human thinking and perception. For this reason, the use of the fuzzy approach is becoming more and more common. Therefore, the proposed method of forecasting uses a fuzzy sets theory. First, we introduce some basic concepts, beginning from dataset.
The training set is a bag (multiset) consisting of a set of instances (objects). Each instance is described by vector of attribute values denoted as . The bag schema gives the description of the attributes and their domains. In this article, bag schema consists of set of input attributes and and target attribute .
Domain values of are denoted by . All attributes have infinite cardinalities, and target attribute has the finite cardinality , where . Formally, training set is
where . Given the training set , the goal of classification problem is to induce optimal classifier with minimum generalization errors.
Despite the rapid development of classification methods, crisp decision trees are one of the most used algorithms for this purpose. Unfortunately, this method has its serious drawbacks. It does not deal well with datasets which are mixture of numeric and categorized variables. Classical crisp trees are also very prone to incompleteness, imprecision, and ambiguity in data.
There are at least two main types of uncertainty: probabilistic (aleatory) and epistemic. Probabilistic uncertainty deals with the behavior of process that arises from its natural, built-in randomness. Epistemic uncertainty, on the other hand, deals with limited knowledge and lack of information. Epistemic uncertainty stems from vagueness and ambiguity. Ambiguity occurs when choice between two or more alternatives is unspecified. Vagueness, on the other hand, concerns a difficulty in making a precise distinction between states of the nature [58].
Fuzzy set theory, first introduced by Zadeh [59], deals with epistemic uncertainty and provides a framework for study of vague phenomena. Fuzzy concept can be introduced into a classification problem if at least one of the input attributes is fuzzy.
Definition 2.
Letbe a universe of discourse (UoD), representing a collection of objects denoted generically by. A fuzzy setis a collection of ordered pairswhereis a non-empty set andis a membership function that assigns to eacha grade of membership.
There are several algorithms for induction of fuzzy decision trees. We implement the algorithm proposed by Yuan and Shaw [60] because it can handle the situations where numerical values can be represented as different types of fuzzy terms. Training procedure of fuzzy decision tree model consists of following steps:
- partitioning,
- fuzzification,
- pruning tree.
4.2. Partitioning
Partitioning process is a transformation of numerical attributes into linguistic variables. Each numerical attribute needs to be represented as linguistic attribute . Let be numerical attribute, where the Universe of Discourse is delimited by known bounds of , such that . Linguistic attribute takes values from domain . The membership specifies the degree to which object ’s attribute is .
Definition 3.
Linguistic attributeis called the linguistic attribute overifis a collection of fuzzified values of.
Definition 4.
The group of fuzzy sets, foris understood as the linguistic variable, and each fuzzy setis a linguistic value of the linguistic variable. Technically,.
Partitioning process is the division of each into intervals i.e., split into overlapping intervals , creating the linguistic attribute to describe .
To create partitioning method three hyper-parameters impact creation of linguistic attribute : the membership function number of partitions , and partitioning method . They indirectly influence the classification [61].
The membership function has the lowest impact on the accuracy of the forecast. The most popular membership functions are: singleton, triangular, trapezoidal, and Gaussian. Yuan and Shaw [60] suggested a simple partitioning algorithm which used triangular membership function on attribute data. The high efficiency of this algorithm is confirmed by many studies and by observations of the authors of the article.
The choice of the number of partitions has a direct impact on the accuracy of the model. The value of is a trade-off between accuracy (bias) and generalization (variance). A low value of will generate too few fuzzy sets representing the attribute, making the model too general. High will generate too many fuzzy sets, causing the model to overfit. The optimal number of has to be optimized for each problem.
The partitioning scheme should be also treated as hyper-parameter. The most often used partitioning method is called Grid Partitioning where the domain of numerical attribute is divided into equal length intervals. There are many other partitioning techniques, the most popular are k-means and fuzzy c-means. However, the grid partitioning should be always the first approach to start with, due to its simplicity and small cost.
In our method each linguistic attribute consists of the same number of intervals , and each has a triangular membership function:
The only parameters that need to be determined are the set of centers .
4.3. Fuzzification
Fuzzification—this stage aims to transform the crisp numerical attributes into linguistic attribute . There are two approaches to this topic: maximizing and holistic. Formally these approaches are as follows:
for the maximizing one and
for the holistic approach. The method of fuzzification can be considered as another hyper-parameter method.
Once the crisp attribute is converted to the fuzzy time series the process of induction of a fuzzy decision tree is ready to start.
In our method we utilize the Fuzzy Iterative Dichotomizer 3 (FID3). The algorithm measures the classification ambiguity associated with each attribute and splits the data using the attribute with the smallest classification ambiguity.
Definition 5.
Cardinality measure for a given pair of linguistic termswith membership functionsand class, the fuzzy subsethoodmeasures the degree to whichis a subset of
whereis the cardinality measure defined as:
Note that for a given pair of fuzzy sets and with membership functions and respectively, the membership function of the intersection is defined as the minimum of the two individual membership functions
Note also that in our case membership function for is a crisp membership i.e.,
This measure can be used to determine the splitting criteria of the attribute. There are various splitting criteria. In our research we choose classification ambiguity and fuzzy entropy.
Definition 6.
Fuzzy entropy of linguistic attributeis calculated as follows:
Definition 7.
The classification ambiguity of fuzzy attribute, on fuzzy evidence, denoted as, is the weighted average of classification ambiguity calculated as follows:
whereis the weight which represents the relative size ofdefined subsequently:
4.4. Pruning and Inducing Fuzzy Decision Tree
Pruning a decision tree is a technique which involves the selective removal of certain branches of a tree to improve the tree’s structure and overcome problem of overfitting. Before presenting the tree-building algorithm, let us first consider the hyper-parameters responsible for its pruning. Let be the number of objects in feature set and number of objects classified as . Leaf controls threshold specifies the minimum number of elements in filtered fuzzy evidence for a node. The fuzzy threshold determines the share of the most frequent value of the classification in . The induction algorithm of fuzzy decision tree is based on Definitions 3 through 7. The idea of algorithm inducting the fuzzy decision tree is presented in Algorithm 1.
| Algorithm 1. Algorithm for fuzzy decision tree induction |
| Input: –a training set, –Input feature set, –target feature, –thresholds for control of growth of the tree |
| Output: Fuzzy Decision Tree FDT |
| START |
| 1: Create fuzzy decision tree FDT with a single root node |
| 2: if is empty or one of the ’s is below critical value then |
| 3: Mark DFT as leaf with the most common value of from as label |
| 4: Return DFT |
| 5: end if |
| 6: For each find with the smallest classification ambiguity |
| 7: for each outcome of do |
| 8: Recursively call procedure with corresponding partition |
| 9: Connect the root node to the returned subtree with an edge that is labelled as |
| 10: end for |
| 11: Return DFT |
| STOP |
Classification of new instance—in crisp decision tree, only one rule can be applied for every object in training set. In fuzzy decision tree, several rules can be applied. In contrast to classical approach an object is classified with different degrees of membership into several classes. The fuzzy classification procedure for new instance consists of following steps [60]:
- Converted FDT into set of rules.
- For each rule, calculate the membership of the object for the premise of rule.
- For each class, aggregate membership derived from all rules.
As a result, object (new instance) is classified into several classes with different degree. To obtain final classification the process of defuzzification needs to be completed (Section 4.3). Detailed description of our approach to classify new instance and build forecast is described in Section 6.3.
5. Data
5.1. Data Description
The study used publicly available data from several sources. The annual natural gas consumption and total annual energy consumption has been taken from the BP Statistical Review of World Energy [62]. Our dataset covers all countries from this dataset. The data covers 79 countries around the world for the period 1965–2019. The macroeconomic data including GDP, the country’s population, the share of industry in generating GDP, and CO2 emissions for the period 1960–2019 come from the World Bank database—World Development Indicators (The World Bank, Washington, DC, USA) [63]. In addition, the data on the heating degree days index for temperatures lower than 15 °C from 1948–2013 from the database [64] were used. Our dataset was divided into training set (years 1980–2011) and test set (2012–2019).
Nevertheless, the number of potential variables explaining the consumption of natural gas in many different countries of the world is limited compared to the typical explanatory variables used in forecasting gas consumption for a single country.
Typical explanatory variables used in traditional forecasting of gas demand for a single country are [65]:
- Historical gas prices (local, global, current, and future),
- Weather data (temperature, wind, precipitation, and sunshine),
- Number and consumption of gas of individual customers (also price and income elasticity coefficients),
- Data on construction and renovation activities (construction of new houses, changes in energy consumption, and others),
- The number and consumption of gas by large consumers (size and characteristics of off-take, flexibility factors),
- Macroeconomic data (GDP, inflation, wages, unemployment rate, and others),
- Political situation
- Metadata (data of local government, statistical offices, and others).
Extensive literature studies [9,37] confirm the use of the above-mentioned variables in forecasting natural gas consumption, however, the choice of variables depends on time horizon and the area for which the forecast is built.
The long forecast horizon means that detailed weather data is replaced by the climate data represented by degree heating days. Detailed data on individual customers and the construction industry have been simplified to the share of industrial customers in generating GDP. Continuous changes in the prices of energy carriers make it impossible to use in a long-term forecast. Significant changes in economic and technological conditions over the years prevent the use of data on wages, unemployment, and inflation rates. The necessity to compare countries with different stages of development in different periods forces an additional limitation in choice of variables.
Finally, we decided to use the following variables: gas consumption, GDP, population, energy consumption, degree heating days, industrial production, and CO2 emissions as a measure of adaptation for climate change.
The final set of data used in the research is presented in Table 1. Each observation represents natural gas consumption of one country in one year. Basic descriptive statistics of the variables are presented in Table 2. To make the patterns more consistent across the whole dataset and to ensure compatibility between countries of different size and economic development, all variables were adjusted to relative values for further analysis.
None of the above-mentioned variables are directly related to renewable energy sources. But they are indirectly represented in NG_mix. Natural gas, with lower emissions per unit of energy, replaces coal in power plants due to its low emissivity during combustion. Therefore this variable describes the relationship between fossil fuels and renewables as gas which will become the dominant fossil fuel in more and more countries. This approach is consistent with the literature [46]. While alternative energy sources and nuclear power are listed in this paper as potential variables for long-term forecasting, in fact these variables were only used in one study [66]. In [66], the goal was to build a global gas demand model. In this model, the percent of consumption of alternative energy sources in energy mix was adopted as a variable. Thus this use of energy mix was similar to presented in this article. In [66] the goal was to build a global gas demand model. In this model, the percent of consumption of alternative energy sources in energy mix was adopted as a variable.
5.2. Correlation Analysis
The final selection of variables for the prognostic model was based on the linear correlation analysis, according to which the model should include variables correlated with the dependent variable, but weakly correlated with each other. The detailed results of the correlation analysis are summarized in Table 3. Almost all linear correlation coefficients are statistically significant at 0.95 level. The only exception was correlation between Population and Industry_GDP. Due to the strong correlation of carbon dioxide emissions in relation to GDP (variable CO2_GDP) with energy intensity of GDP (variable Energy_GDP), this variable was omitted in further modeling. Although CO2 emissions have already been used in another study [67], this variable does not seem to be a good explanatory variable, as CO2 emissions are directly proportional to the level of GDP energy intensity and the high correlation only confirms the existence of such a relationship.
The correlation analysis provides interesting conclusions, e.g., it indicates the existence of a fairly strong negative correlation of economic development (GDP_PC) with the energy intensity of the economy (Energy_GDP). Another interesting result is the positive correlation of the share of natural gas in the energy mix (NG_mix) with the energy intensity of the economy (Energy_GDP). The share of natural gas in the energy mix is also moderately positively correlated with the share of industrial production in generating GDP (Industry_GDP). The expected importance of the climate for forecasts of natural gas consumption and, in general, energy consumption, turned out to be negligible. The correlation of the Degree Heating Days index with the share of natural gas in the Energy mix and the energy consumption of GDP was below 0.1, which resulted in its removal from further analyzes and forecasts. Interestingly, the significant correlation of this indicator with the value of GDP per capita indicates that more developed countries are located in areas of a cooler climate.
There were numerous missing data in the collected dataset. Two strategies were possible for dealing with missing data: imputation or removing missing observations. In the available data, most of the missing data occurred in the initial years 1965–1980 and was related to the lack of data reporting by many countries at that time. Moreover, many countries emerged after the collapse of the socialist system in Europe and in the former Soviet Union. Due to the above, we decided to delete data for years before 1980. The remaining few missing data were imputed with use of moving averages of three periods for individual variables for individual countries separately. In such data set, there were no data for years 1980–1990 for several countries created after 1990. The resulting dataset eventually contained 3160 observations. Each observation was the consumption of natural gas with other economic indicators in one country during one year. This set was divided into a training set covering the years 1980–2011 and a test set containing data from the years 2012–2019.
6. Methodology
6.1. Finding Analogies Using Clustering
The proposed forecasting method combines k-means clustering and fuzzy decision trees into a single framework that operates on panel data.
The k-means algorithm is an unsupervized learning method that classifies observations based on the adopted distance measure to a predetermined number of classes. The purpose of the k-means method is to create groups of analogies. Determining the variables underlying the analogy for natural gas consumption is an important step in analog forecasting. For this purpose, two relative measures were selected: energy intensity of the economy (Energy_GDP) and the share of natural gas in the consumption of primary energy carriers (NG_mix). The first one characterizes the level of technological development (the negative correlation with GDP per capita mentioned in the previous section), as well as describes the energy intensity of the economy depending on the structure of GDP generation according to sectors. The second indicator—the share of natural gas in the Energy mix—takes into account two elements: the ease of access to natural gas resources (net exporter/importer of a given country) and a country’s commitment to decarbonizing the economy by replacing fossil fuels with natural gas.
Contrary to the results of the correlation analysis, we also try to include the degree heating days index, but the empirical verification did not bring positive results and did not improve the accuracy of classification and forecasting. According to the results of the correlation analysis, climatic factors are not important for determining the level of natural gas consumption in the world. Finally, clusters for country-year observations were created based on two variables: Energy_GDP and NG_mix.
Subsequently, a v-fold cross-check was used to determine the number of clusters. The minimum number of clusters suggested in automatic clustering algorithm is six clusters, the optimal number of clusters is 12, however the cost function (double log likelihood function) is further reduced to about 15 clusters. The error in the training sample for 15 clusters was 0.047 for normalized data, for 12 clusters it was 0.059, while for six clusters the error was 0.086. The characteristics of the obtained clusters are presented in Table 4. The values in the Energy_GDP and NG_mix columns are the coordinates of the centers of individual clusters.
Detailed cluster analysis provides interesting observations on energy consumption and the level of natural gas use in the structure of primary energy carriers. For example, China in the years 1980–1994 was in cluster three (quite high energy intensity of the economy and moderate consumption of natural gas), and in the years 1995–2011 it was in cluster two (not very high energy intensity and low consumption of natural gas). Germany in the years 1980–1993 was in cluster seven (low energy intensity of the economy and moderate consumption of natural gas), and then in the years 1994–2011 it was in cluster 15 (low energy intensity of the economy and higher consumption of natural gas). Similar observations can be made for other countries. For example, France in the entire period 1980–2011 was in cluster seven. In turn, the USA in the entire period 1980–2011 was in cluster 15. Japan in 1980–1983 was in cluster 12, and then in 1984–2011 in cluster seven. Russia throughout the period 1980–2011 belonged to cluster 13. Great Britain in the years 1980–1995 was in cluster 15, and then in the years 1996–2011, it was in cluster 11. Poland in the years 1990–1999 was in cluster two, then in cluster seven. Brazil in 1980–2003 was in cluster 12, then in 2004–2011 it was in cluster 7. India was in cluster two throughout the entire period 1990–2011. Australia in 1980–2006 was in cluster two, then in 2007–2011 it was in cluster three. Switzerland in 1980–1998 was in cluster 8, then in 1991–2011 was in cluster two. It is visible that analogue approach can capture changes in the economic behavior of a country by changes in a group membership. Synthetic indicators of Energy GDP and Energy_mix partially consider the technological development of the country. The combination of these two variables also includes the impact of increased use of alternative energy sources.
6.2. Fuzzy Decision Tree Learning
The decision tree is a supervized learning method in which the assignment to previously created classes is based on selected explanatory variables. In the next step, a fuzzy decision tree was built. The purpose of was to assign country using selected variables to appropriate groups of analogies created by clustering. We started with a selection of explanatory variables for a fuzzy decision tree. As a rule, chosen variables have to be a different explanatory variable than those used for k-means clustering. The explanatory variables in this stage should reflect commonly measured economic phenomena in all countries of the world. These variables, as independent variables used to forecast future membership in clusters, must have individual long-term forecasts.
Hence, the variables for which strategic forecasts are usually created, being a component of social and economic development plans for any country in the world, were chosen. These are the forecasts for the country’s GDP and population, as well as the target structure of energy consumption reflected in Energy mix indicator. The target structure of the Energy mix is actively supported by national governments through fiscal policy. For the sake of comparability between countries, we have converted the GDP to a relative value—GDP per capita. Finally, three explanatory variables were selected: GDP per capita, population, and share of natural gas consumption in the Energy mix. Selected explanatory variables served as an input variable in learning of a fuzzy decision tree, where consumption profiles were the explained variable. The construction of a fuzzy tree consisted of three steps:
- Transformation of explanatory variables of crisp type into fuzzy variables.
- Extraction of knowledge from a dataset containing explanatory variables and explained variable with the help of a decision tree.
- Building a forecast based on the acquired knowledge.
The transformation of explanatory variables into fuzzy versions is performed with the help of a linguistic variable. In our case, selected explanatory variables were used in fuzzy decision tree learning process to classify observations from 1980–2011 into 15 classes based on the labels previously assigned to each observation as a result of clustering with the k-means method (unsupervised learning). The accuracy of the best fuzzy decision tree classification, measured by accuracy coefficient, was 80%.
6.3. Final Analog Forecasting of Natural Gas Consuption
The procedure described above creates country profiles using the k-means clustering method. Then the fuzzy tree determines the similarity of the territory for which the forecast is built to these groups of analogies. We will call this approach FAM (fuzzy analog model) in the rest of the article. Since we are dealing with a fuzzy classification, our model returns collection of membership functions that define the similarity to particular groups of analogies.
where is a grade of membership to the group of analogies cl.
Forecasting procedure based on FAM for a single object O consists of building a forecast for each group of analogies with non-zero membership function. Then, all forecasts are aggregated by the mean weighted by the membership functions.
The easiest way to create forecast for one group of analogies is to use the average values of energy consumption and the share of natural gas in the energy mix for cluster members, and then multiply them by the value of the forecast GDP. However, such forecast is subject to a large error, because each country within any cluster has a different base value of natural gas consumption at the beginning period of forecasting. We decided to use chain increments instead. This is a commonly used approach in analog forecasting [56]. It is based on averaging relative increments of the two indicators (Energy_GDP and Energy_mix) for a given cluster and the creation a forecast starting from the base year—the last year of actual data.
The forecast for the object O in the period T+h for group O of analogies cl is given by function
where —forecast for the variable O in the period T+h, —arithmetic mean of relative chain increments in natural gas consumption in cluster cl to which object O belongs in period t based on economic indicators.
The forecast for the object O in the period T+h can be written as
where is obtained as follows:
where: —relative increase of natural gas consumption of the country l belonging to cluster cl in period t, end(l)—the last year of the period in which country l belongs to the cluster cl, |cl|—number of countries belonging to the cluster k.
Relative chain increments for country l in period t are calculated according to the formula:
where: —gas consumption of country l belonging to cluster cl in period t, ti0—the first year of data for the country l.
As a result, k forecast is being built. In order to prepare a forecast, it is necessary to somehow aggregate the forecasts using membership functions. This process is called sharpening. As we show it above there are, broadly speaking, two approaches. It is usually assumed that the aggregate forecast is equal to the forecast for the group of analogies with the highest membership function. This would lead to the loss of information contained in the fuzzy set. In our method, we proposed to make k forecasts, which then are sharpened based on the membership function.
Our hybrid forecasting process using analog forecasting and fuzzy decision trees is presented in Figure 1 and Algorithm 2. After necessary modifications of input variables, described forecasting process can also be used for territorial units of any country.
| Algorithm 2. Algorithm for forecasting the annual consumption of natural gas |
| Input: S(B)—collection of m observations containing attributes—annual economic indicators for ms territorial units from the period of T years, where m = msT |
| Ster—set of forecasts of n economic indicators for ms territorial units for period of T years |
| Output: Sf—set of annual natural gas consumption forecasts for ms territorial units in h years |
| START |
| 1: Calculate the growth rates of the economy’s energy consumption indicators and the share of gas in the Energy mix for each ms territorial units in the subsequent years of the T period |
| 2: Assign observations from the set S(B) to k subsets Each subset contais selected energy carrier consumption indices, where the number of clusters k is determined by the cross-validation method for the declining cost function |
| 3: Calculate the average growth rates of the economy energy consumption indices and the share of gas in the Energy mix in period T for each of the k clusters |
| 4: Fuzzy the s selected attributes (economic and social indicators) from the set S(B) |
| 5: Build the fuzzy decision tree describing the relationship between s attributes and k analogy groups (clusters) |
| 6: Fuzzy input variable in test set Stest |
| 7: Build a collection of membership functions that define the similarity to particular groups of analogies using the fuzzy decision tree obtained in step 5 |
| 8: Build gas consumption forecasts for each territorial unit by relative chain increments using average growth rates for all clusters to which each observation belongs |
| 9: Calculate the forecasts for each territorial unit by sharpening the center of gravity method. Repeat the calculation for each unit in subsequent years of the forecast |
| STOP |
7. Results
7.1. Hyper-Parameters Selection
The following approach was used to make forecasts of natural gas consumption for all countries included in the dataset. The horizon of forecast was 2012–2019. To build forecasts, it was necessary to select hyper-parameters for decision trees. Then, the results of forecasting were compared with the benchmark forecasts.
Selection of hyper-parameters plays an important role in the process of assessing similarity of test cases to group of analogies. During preliminary experiments, it turned out that the number of fuzzy linguistic terms, partitioning method, and thresholds were the most important parameters that affect the accuracy of the forecast. Let us assume that fuzzy decision tree is the function of subsequent parameters:
where —membership function: triangular, —fuzzyfication approach: holistic, k—number of fuzzy linguistic variable: 5 to 20, —partitioning method: grid, k-means, FC-Means, —fuzzy control treshold: 0 to 1, —leaf control treshold: 0 to 1.
For the purpose of selection of hyper-parameters, a test environment was built, where, using the gradient method and sensitivity analysis, the optimal value of parameters was obtained. The Figure 2 shows an example of fuzzing GDP per capita using grid, k-means, and fuzzy c-means algorithm into 10 partitions. The values of lower bonds, upper bonds and centroid for each partition are shown in Table 5.
To choose the best hyper-parameters of FDT we used misclassification rate of FDT on the training set measured by accuracy indicator. The final, chosen model for further forecast was
Several observations made during the calibration may be useful in forecasting gas consumption for other territorial units.
The most important parameters influencing the accuracy of the forecast are partitioning method and number of partitions. Hyper-parameters that affect pruning a tree do not significantly affect the quality of the classification. This is in line with the conclusions made by many researchers that in analogue forecasting, uncertainty is the most important factor influencing the quality of the classifier.
Among the tested models, the best results were given by trees with a small number of branches and nodes. Best consists of 30 rules. To compare the strength of our methods, the fuzzy decision tree was replaced with the crisp one. The best crisp trees were about two times bigger than the fuzzy one. This shows differences of how both approaches deal with uncertainty. A fuzzy tree quantifies the uncertainty on attributes, and a crisp one in branching. Although accuracy of crisp decision tree was about 84%, and the accuracy of the best FDT was about 80%, the forecast was better using fuzzy tree.
Partitioning methods have the biggest impact on classification results. The best partitioning parameter demonstrated almost twice as good accuracy as the other ones.
The number of partitions was also a very important parameter. As the number of partitions increased, the accuracy also increased to stabilize around 12 partitions and then slowly decrease.
Final fuzzy decision tree consisted of 30 rules. The most important parameter turned to be Energy_mix, then the next was GDP, and population.
7.2. Comparison of Results
To assess the accuracy of forecasts obtained with various methods, we used typical measures of ex post forecast errors. Errors of forecasts were summarized in two ways: scale-dependent (RMSE—root mean square error) and percentage (MAPE—absolute percentage error). RMSE error is expressed as
and MAPE error is calculated subsequently
where is time interval, is real value in time and is a forecast.
In order to compare the forecasting results with our hybrid fuzzy method, four benchmark approaches were used: naive, classical, machine learning (ML), and regression. When selecting benchmarks, we chose the approach presented in [68]. These benchmarks use typical forecasting methods used in practice with automatic selection of parameters. This allows to measure the difference between the automated approach and the proposed method. These approaches are outlined below.
The naive approach includes two simple but often surprisingly effective methods—naïve and drift , in which forecasts are defined as follows:
and
The training procedure was as follows: for each country in the training dataset, both models were built. Then, the one with the lower MAPE was chosen . Those best models were then used to build the forecast for each country in the test set.
In classical approach we chose two families of models, ETS (exponential smoothing methods) [69] and ARIMA . In order to obtain hyper-parameters for each family, algorithms that automate the construction of models were used. For ETS family, Hyndman–Koehler algorithm for automatic modelling was used [69]. For ARIMA, Hyndman–Khandakar automatic time series forecasting approach was used [70]. The training procedure was the same as in naive approach.
We also test a regression approach. In this approach we used two methods. First, we calculated linear regression forecasts for all data together treated as homogenous dataset (pooled regression). We also built individual forecasts for each country using a linear trend. As ML benchmark, we decided to train a simple NNAR network (neural network autoregression model). Comparison of approaches is presented in Table 6. The best benchmark is ML-benchmark. Therefore our approach improves MAPE in relation to best benchmark by about 37%.
We also compare effectiveness of crisp and fuzzy decision tree in our method. Seemingly, crisp decision trees provide a lower ex post forecast error than the fuzzy tree, however, the forecasts obtained by this method used the actual realized values of GDP and population for the years 2012–2019 as independent variables in the model. In real life situations, the forecasts of the explanatory variables are used as input data to the model. These forecasts are subject to some error in relation to the real values, and their quality is of key importance for the accuracy of gas consumption forecasts [30]. Whereas, fuzzy variables are assumed to account for the “confidence degree” of the prediction of the explanatory variable through the value of the membership function. The scenarios of economic and social development included in the governmental strategies make it possible to include this uncertainty in diffused explanatory variables. In order to obtain the comparability of the crisp decision tree, a random disturbance was introduced into the GDP forecast consisting in a relative change of the GDP value by the random component . This small disturbance imitating the potential change in actual GDP in relation to the forecast has significantly worsened the accuracy of the gas consumption forecasts in the crisp approach.
8. Discussion
8.1. Long-Term Natural Gas Consuption Forecasting for Teritiral Units
Building long-term natural gas consumption forecasts for territorial units is an important scientific task. The construction of forecasts for the whole world and for individual countries allows for better shaping of energy policy. The approach presented in this article helps to build long-term forecasts and can be applied as independent or an additional forecasting source in forecasting aggregation. Our approach also works well as a scenario forecast. In the case of having actual strategic forecasts for individual countries, the following scenarios should be used: real, optimistic, and pessimistic as the borderline values of the membership function to a set of values for explanatory variables.
In literature, building a forecast is a three step process: define a model, check performance, and produce forecast. In literature, “check performance” means comparison of fitting forecast and measured data. For long-term forecast it is usually a five to ten year period (e.g., [30]).
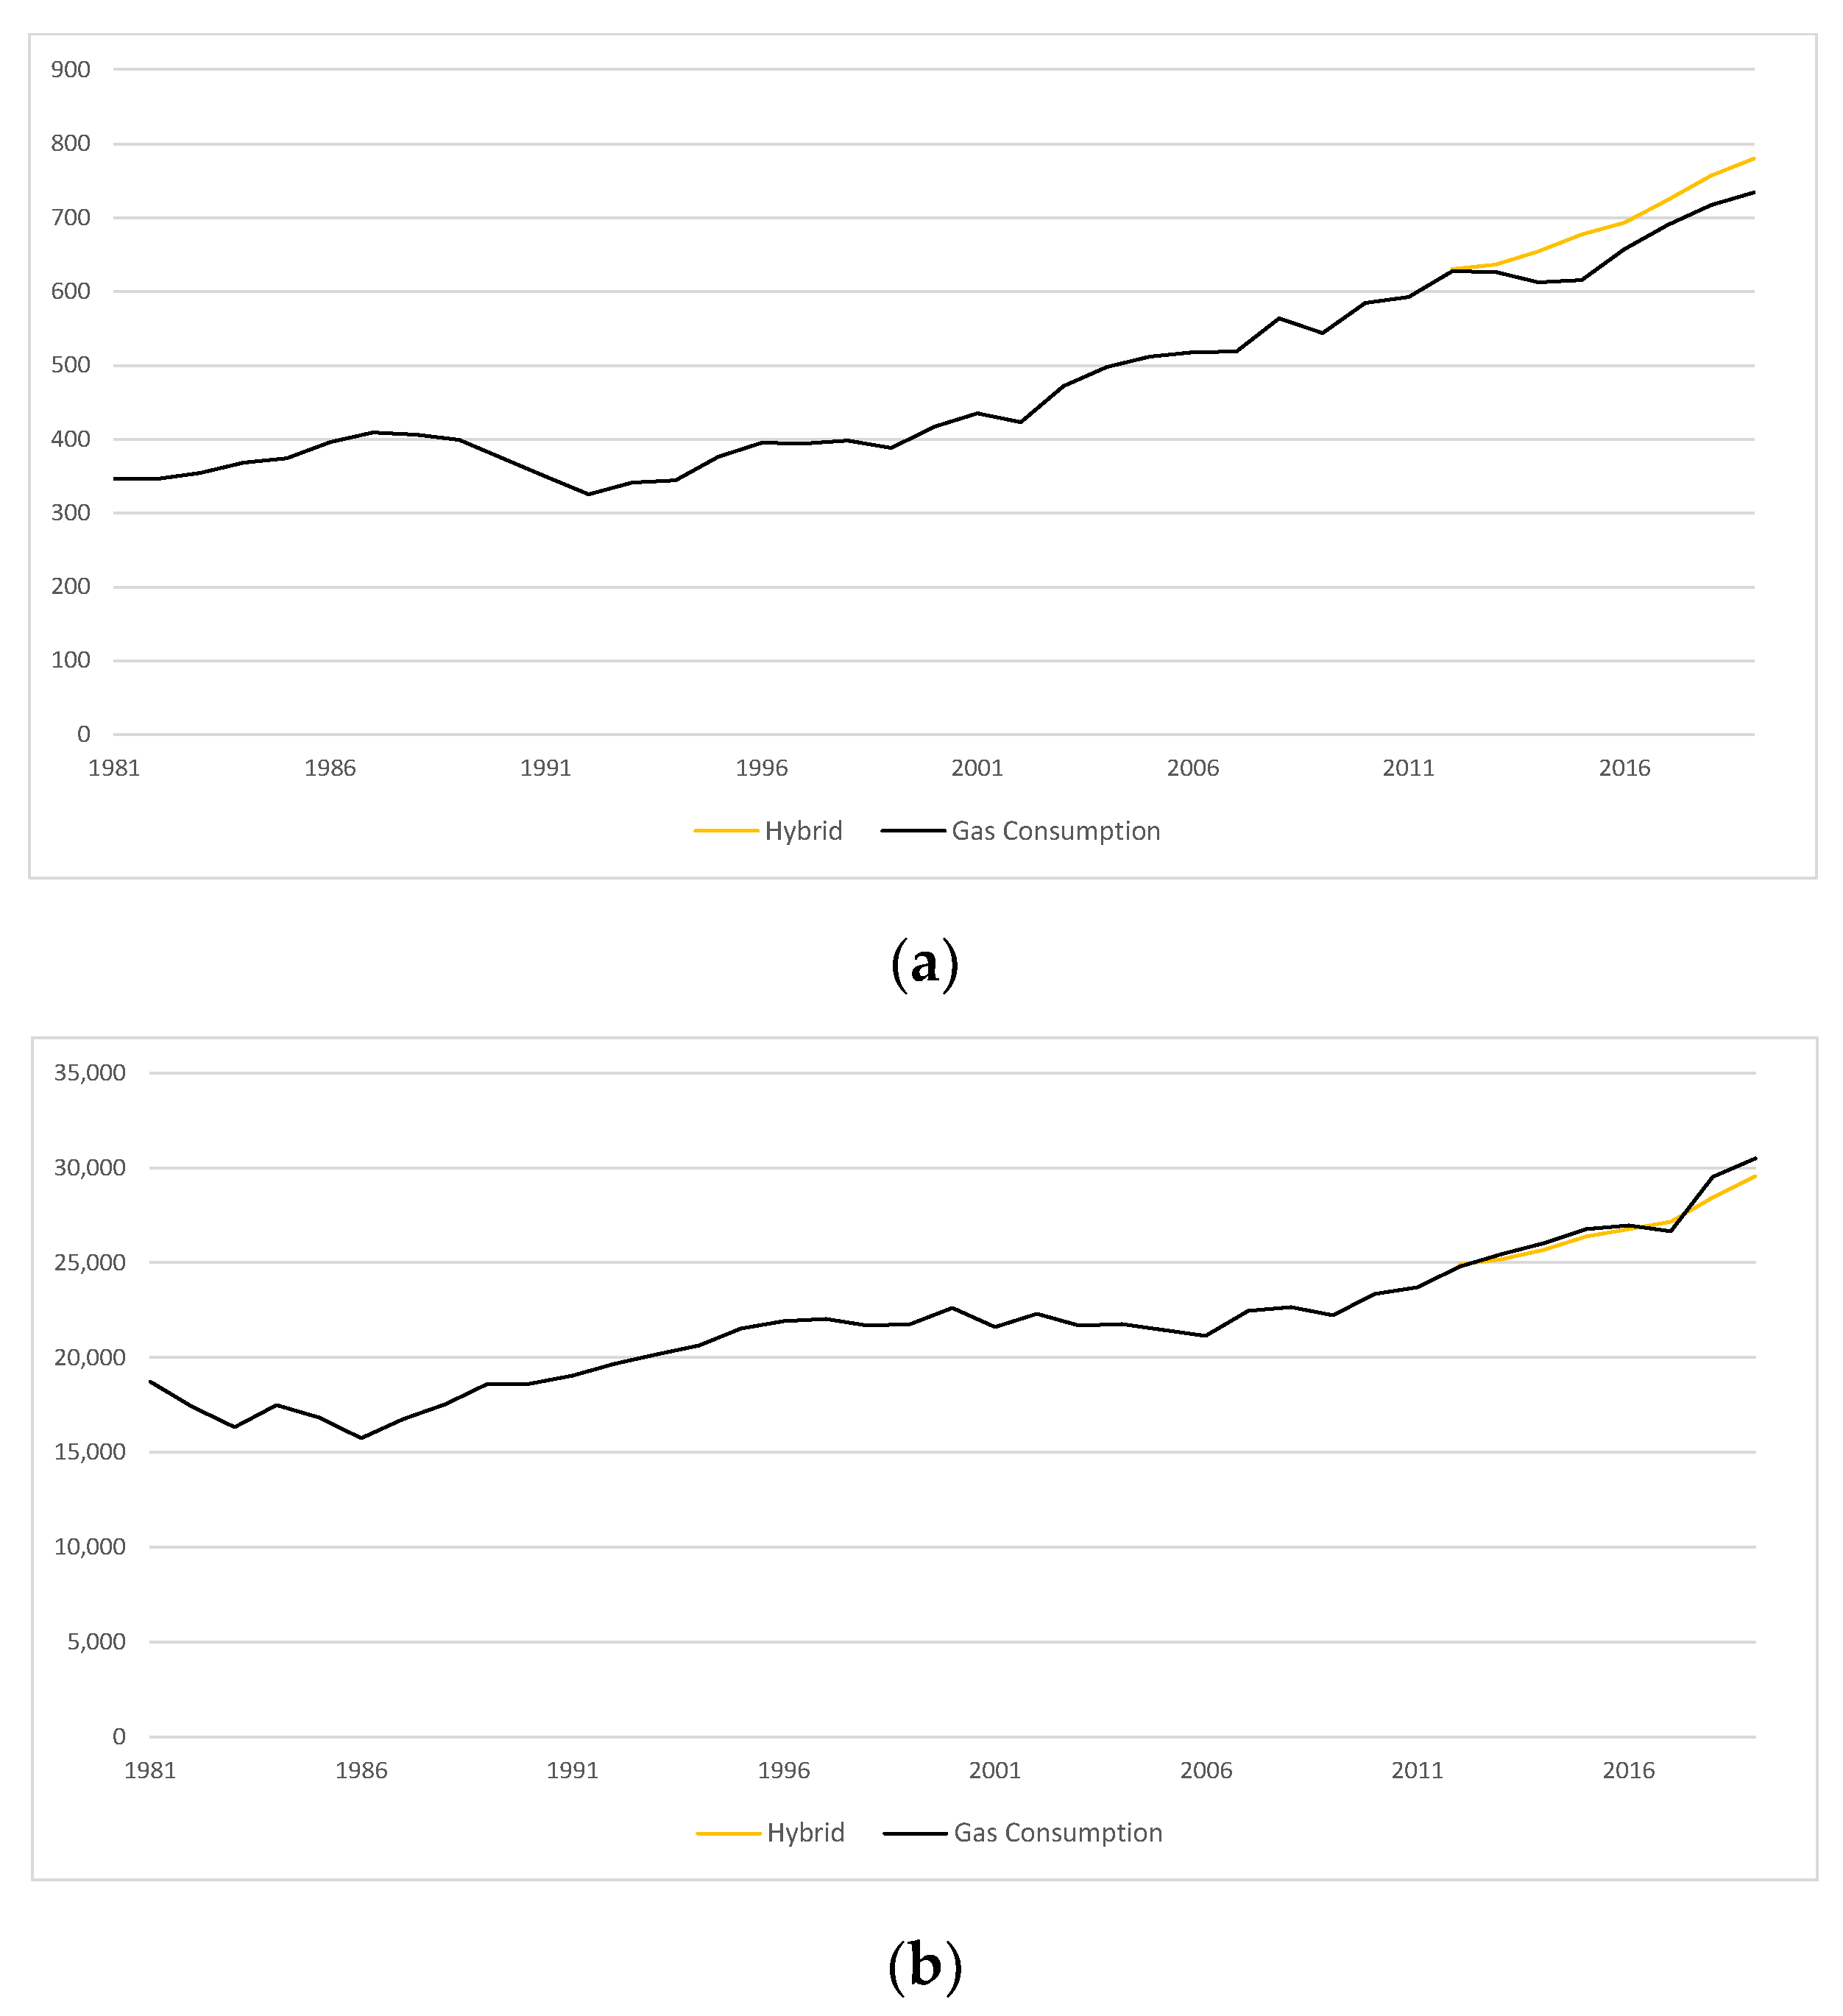
Table 7 summarizes the classic and hybrid approaches for selected countries. Selected forecasts are also depicted in Figure 3, Figure 4 and Figure 5. As we can see, the results of our hybrid approach can compete with classical forecasting methods. Our method of analogues can cover changes in membership to particular clusters of natural gas consumption due to the level of development of a country measured by energy mix and energy intensity of economy. Our forecasting method, like other long-term ones, is unable to predict political, social, or weather changes.
In addition to comparison of forecasting approaches, the forecasts for individual countries were also compared. For this purpose, the countries were divided into quartiles based on gas consumption in 2019. Then, the accuracy of forecasts per country was compared. The analysis of the forecasts for individual countries shows that the effectiveness of this approach is, as predicted, best for medium-sized gas consumers (2nd and 3rd quartiles). Over 80% of countries from these groups had the lowest MAPE for our method.
The method is not always good when dealing with data from the 1st or 4th quartiles. It is consistent with the assumptions of the analog forecast. Therefore, our approach should be used as one of the scenarios for the development of medium-sized gas consumers. The use of analogies may also help in the analysis of the similarities of consumers between individual countries.
8.2. Methodology for Forecasting Long-Term Annual Gas Consumption with Low Forecast Error for Territorial Units
In this study, we also showed that the proposed methodology, after slight changes (regarding the explanatory variables), can be successfully applied to any forecasting of gas consumption on territorial level. We show that fuzzy approach is better at dealing with the variability of consumption pattern between geographical areas. In this study, we specifically selected the country level as high-diversity sites. For local data (within one country) this differentiation will be smaller, and thus the forecast will be burdened with a smaller error.
As shown in the Table 6 our forecast gives very good results (low RMSE and MAPE error) compared to other approaches, especially statistical. Compared with crisp trees, we also showed that it is particularly important to introduce a fuzzy approach to the forecast, which significantly contributes to the reliability of the forecast.
It also important to stress that the introduction of linguistic variables allows our approach to easily attach qualitative variables to the forecasting process, such as an indicator of the possibility of rapid changes in the energy mix due to legal or environmental changes. The proposed method is perfectly suited to represent this type of situation and could be used in future works.
Our research proves the thesis that the computational intelligence methods to which our method belongs give more robust long-term forecasts.
9. Conclusions
Our hybrid method of long-term forecasting of annual natural gas consumption has brought promising results. The accuracy of the forecasts obtained with this method is better than forecasts obtained with other methods. It should be taken into consideration that the conducted studies are only a sample of the prognostic quality of this method. Efficient forecasting of long-term gas consumption at the country level is not possible without more detailed data then we have used. The forecast for each country requires an individual approach related to its historical, social, and economic situation, and above all, to the existing structure of energy devices. The data we have used covered countries that changed their political and economic system, such as the former socialist countries in Europe or the former republics of the Soviet Union that became independent states. Such a situation lowers the credibility of data for countries undergoing such significant transformations, which affects the quality of forecasts.
Our hybrid forecasting method using analogue forecasting and fuzzy decision tree seems to be particularly useful for forecasting energy consumption for territorial units of a single country. In this case, the explanatory variables in the model will be the social, economic, and urban data of territorial units. It will be possible to use additional data e.g., wages, unemployment, level of urbanization, and others. The most important advantage of this method is the possibility of taking into account the cognitive uncertainty related to the forecasts of socio-economic development, which are input variables to the model of forecasting the demand for natural gas or other energy carriers. Growth scenarios, interval forecasts, or forecasts along with forecast errors, can be used to blur the input fields and create a membership function.
Author Contributions
Both authors contributed substantially to all aspects of this article. All authors have read and agreed to the published version of the manuscript.
Funding
The APC was funded under subvention funds for the Faculty of Management and by- program “Excellence Initiative—Research University” for the AGH University of Science and Technology.
Institutional Review Board Statement
Not applicable.
Informed Consent Statement
Not applicable.
Data Availability Statement
Publicly available datasets were analyzed in this study. This data can be found here: https://www.bp.com/en/global/corporate/energy-economics/statistical-review-of-world-energy.html (accessed on 9 February 2021), https://datacatalog.worldbank.org/dataset/world-development-indicator, https://datasource.kapsarc.org/pages/home/ (accessed on 9 February 2021).
Conflicts of Interest
The authors declare no conflict of interest.
References
- Sangrody, H.; Zhou, N.; Tutun, S.; Khorramdel, B.; Motalleb, M.; Sarailoo, M. Long term forecasting using machine learning methods. In Proceedings of the 2018 IEEE Power and Energy Conference at Illinois (PECI), Champaign, IL, USA, 22–23 February 2018; pp. 1–5. [Google Scholar]
- Choi, E.; Cho, S.; Kim, D.K. Power demand forecasting using long short-term memory (LSTM) deep-learning model for monitoring energy sustainability. Sustainability 2020, 12, 1109. [Google Scholar] [CrossRef] [Green Version]
- Wei, N.; Li, C.; Peng, X.; Li, Y.; Zeng, F. Daily natural gas consumption forecasting via the application of a novel hybrid model. Appl. Energy 2019, 250, 358–368. [Google Scholar] [CrossRef]
- Hribar, R.; Potočnik, P.; Šilc, J.; Papa, G. A comparison of models for forecasting the residential natural gas demand of an urban area. Energy 2019, 167, 511–522. [Google Scholar] [CrossRef]
- Marziali, A.; Fabbiani, E.; De Nicolao, G. Forecasting residential gas demand: Machine learning approaches and seasonal role of temperature forecasts. Int. J. Oil Gas Coal Technol. 2021, 26, 202. [Google Scholar] [CrossRef]
- Keijzer, B.; Visser, P.; Romillo, V.G.; Muñoz, V.G.; Boesten, D.; Meezen, M.; Rahola, T.B.S. Forecasting residential gas consumption with machine learning algorithms on weather data. E3S Web Conf. 2019, 111, 05019. [Google Scholar] [CrossRef] [Green Version]
- Panapakidis, I.P.; Dagoumas, A.S. Day-ahead natural gas demand forecasting based on the combination of wavelet transform and ANFIS/genetic algorithm/neural network model. Energy 2017, 118, 231–245. [Google Scholar] [CrossRef]
- Soldo, B. Forecasting natural gas consumption. Appl. Energy 2012, 92, 26–37. [Google Scholar] [CrossRef]
- Tamba, J.G.; Essiane, S.N.; Sapnken, E.F.; Koffi, F.D.; Nsouandélé, J.L.; Soldo, B.; Njomo, D. Forecasting natural gas: A literature survey. Int. J. Energy Econ. Policy 2018, 8, 216–249. [Google Scholar]
- Peak Hydrocarbons. Available online: https://eto.dnv.com/2019/peak-hydrocarbons (accessed on 17 July 2021).
- Maggio, G.; Cacciola, G. When will oil, natural gas, and coal peak? Fuel 2012, 98, 111–123. [Google Scholar] [CrossRef]
- Hubbert, M.K. Energy from fossil fuels. Science 1949, 109, 103–109. [Google Scholar] [CrossRef] [Green Version]
- Wang, J.; Jiang, H.; Zhou, Q.; Wu, J.; Qin, S. China’s natural gas production and consumption analysis based on the multicycle Hubbert model and rolling grey model. Renew. Sustain. Energy Rev. 2016, 53, 1149–1167. [Google Scholar] [CrossRef]
- Siemek, J.; Nagy, S.; Rychlicki, S. Estimation of natural-gas consumption in Poland based on the logistic-curve interpretation. Appl. Energy 2003, 75, 1–7. [Google Scholar] [CrossRef]
- Mohr, S.H.; Wang, J.; Ellem, G.; Ward, J.; Giurco, D. Projection of world fossil fuels by country. Fuel 2015, 141, 120–135. [Google Scholar] [CrossRef]
- Espinoza, V.S.; Fontalvo, J.; Martí-Herrero, J.; Ramírez, P.; Capellán-Pérez, I. Future oil extraction in Ecuador using a Hubbert approach. Energy 2019, 182, 520–534. [Google Scholar] [CrossRef]
- Rehman, S.A.U.; Cai, Y.; Mirjat, N.H.; Walasai, G.D.; Shah, I.A.; Ali, S. The future of sustainable energy production in Pakistan: A system dynamics-based approach for estimating Hubbert peaks. Energies 2017, 10, 1858. [Google Scholar] [CrossRef] [Green Version]
- Cavallo, A.J. Hubbert’s petroleum production model: An evaluation and implications for world oil production forecasts. Nat. Resour. Res. 2004, 13, 211–221. [Google Scholar] [CrossRef]
- Sanchez-Ubeda, E.F.; Berzosa, A. Modeling and forecasting industrial end-use natural gas consumption. Energy Econ. 2007, 29, 710–742. [Google Scholar] [CrossRef]
- Suykens, J.; Lemmerling, P.; Favoreel, W.; de Moor, B.; Crepel, M.; Briol, P. Modelling the Belgian gas consumption using neural networks. Neural Process. Lett. 1996, 4, 157–166. [Google Scholar] [CrossRef]
- Gutiérrez, R.; Nafidi, A.; Gutiérrez Sánchez, R. Forecasting total natural-gas consumption in Spain by using the stochastic gompertz innovation diffusion model. Appl. Energy 2005, 80, 115–124. [Google Scholar] [CrossRef]
- Erdogdu, E. Natural gas demand in Turkey. Appl. Energy 2010, 87, 211–219. [Google Scholar] [CrossRef] [Green Version]
- Olgun, M.; Özdemir, G.; Aydemir, E. Forecasting of Turkey’s natural gas demand using artifical neural networks and support vector machines. Energy Sources Econ. Plan. Policy 2012, 11, 295–302. [Google Scholar]
- Boran, F.E. Forecasting natural gas consumption in Turkey using grey prediction. Energy Sources Econ. Plan. Policy 2015, 10, 208–213. [Google Scholar] [CrossRef]
- Gil, S.; Deferrari, J. Generalized model of prediction of natural gas consumption. J. Energy Resour. Technol. 2004, 126, 90–98. [Google Scholar] [CrossRef]
- Wu, L.; Liu, S.; Chen, H.; Zhang, N. Using a novel grey system model to forecast natural gas consumption in China. Math. Probl. Eng. 2015, 2015, 1–7. [Google Scholar] [CrossRef]
- Zeng, B.; Li, C. Forecasting the natural gas demand in China using a self-adapting intelligent grey model. Energy 2016, 112, 810–825. [Google Scholar] [CrossRef]
- Xu, G.; Wang, W. Forecasting China’s natural gas consumption based on a combination model. J. Nat. Gas. Chem. 2010, 19, 493–496. [Google Scholar] [CrossRef]
- Szoplik, J. Forecasting of natural gas consumption with artificial neural networks. Energy 2015, 85, 208–220. [Google Scholar] [CrossRef]
- Scarpa, F.; Bianco, V. Assessing the quality of natural gas consumption forecasting: An application to the Italian residential sector. Energies 2017, 10, 1879. [Google Scholar] [CrossRef] [Green Version]
- Forouzanfar, M.; Doustmohammadi, A.; Menhaj, M.B.; Hasanzadeh, S. Modeling and estimation of the natural gas consumption for residential and commercial sectors in Iran. Appl. Energy 2010, 87, 268–274. [Google Scholar] [CrossRef]
- Khan, M.A. Modelling and forecasting the demand for natural gas in Pakistan. Renew. Sustain. Energy Rev. 2015, 49, 1145–1159. [Google Scholar] [CrossRef]
- Levenberg, A.; Levenberg, A.; Pulman, S.; Moilanen, K.; Simpson, E.; Roberts, S. Predicting economic indicators from web text using sentiment composition. Int. J. Comput. Commun. Eng. 2014, 3, 109–115. [Google Scholar] [CrossRef] [Green Version]
- Merkel, G.D.; Povinelli, R.J.; Brown, R.H. Short-term load forecasting of natural gas with deep neural network regression. Energies 2018, 11, 2008. [Google Scholar] [CrossRef] [Green Version]
- Bianco, V.; Scarpa, F.; Tagliafico, L.A. Scenario analysis of nonresidential natural gas consumption in Italy. Appl. Energy 2014, 113, 392–403. [Google Scholar] [CrossRef]
- Bianco, V.; Scarpa, F.; Tagliafico, L.A. Analysis and future outlook of natural gas consumption in the Italian residential sector. Energy Convers. Manag. 2014, 87, 754–764. [Google Scholar] [CrossRef]
- Šebalj, D.; Mesarić, J.; Dujak, D. Predicting natural gas consumption—A literature review. In Proceedings of the Central European Conference on Information and Intelligent Systems; Faculty of Organization and Informatics Varazdin, Zagreb, Croatia, 27–29 September 2017; pp. 293–300. [Google Scholar]
- Paliński, A. Data warehouses and data mining in forecasting the demand for gas and gas storage services. Naft. Gaz 2018, 74, 283–289. [Google Scholar] [CrossRef]
- Paliński, A. Forecasting gas demand using artificial intelligence methods. Naft. Gaz 2019, 75. [Google Scholar] [CrossRef]
- Bartels, R.; Fiebig, D.G.; Nahm, D. Regional end-use gas demand in Australia. Econ. Rec. 1996, 72, 319–331. [Google Scholar] [CrossRef]
- Behrouznia, A.; Saberi, M.; Azadeh, A.; Asadzadeh, S.M.; Pazhoheshfar, P. An adaptive network based fuzzy inference system-fuzzy data envelopment analysis for gas consumption forecasting and analysis: The case of South America. In Proceedings of the International Conference on Intelligent and Advanced Systems, Manila, Philippines, 15–17 June 2010. [Google Scholar] [CrossRef]
- Elragal, H. Improving neural networks prediction using fuzzy-genetic model. In Proceedings of the Twenty-First National Radio Science Conference, Cairo, Egypt, 18 March 2004; p. C12-1. [Google Scholar]
- Hambali, M.A. Electric power load forecast using decision tree algorithms. Comput. Inf. Syst. Dev. Inform. Allied Res. J. 2016, 7, 29–42. [Google Scholar]
- Fiordaliso, A.A. Constrained Takagi–Sugeno fuzzy system that allows for better interpretation and analysis. Fuzzy Sets Syst. 2001, 118, 307–318. [Google Scholar] [CrossRef]
- Vitullo, S.; Brown, R.; Corliss, G.; Marx, B. Mathematical models for natural gas forecasting. Can. Appl. Math. Q. 2009, 17, 1005–1013. [Google Scholar]
- Liu, J.; Wang, S.; Wei, N.; Chen, X.; Xie, H.; Wang, J. Natural gas consumption forecasting: A discussion on forecasting history and future challenges. J. Nat. Gas. Sci. Eng. 2021, 90, 103930. [Google Scholar] [CrossRef]
- Azadeh, A.; Asadzadeh, S.M.; Saberi, M.; Nadimi, V.; Tajvidi, A.; Sheikalishahi, M. A neuro-fuzzy-stochastic frontier analysis approach for long-term natural gas consumption forecasting and behavior analysis: The cases of Bahrain, Saudi Arabia, Syria, and UAE. Appl. Energy 2011, 88, 3850–3859. [Google Scholar] [CrossRef]
- Thomassey, S.; Fiordaliso, A. A hybrid sales forecasting system based on clustering and decision trees. Decis. Support. Syst. 2006, 42, 408–421. [Google Scholar] [CrossRef]
- Basallo-Triana, M.J. Analogue-based demand forecasting of short life-cycle products: A regression approach and a comprehensive assesment. Int. J. Prod. Res. 2017, 55, 2336–2350. [Google Scholar] [CrossRef]
- Skalna, I.; Rębiasz, B.; Gaweł, B.; Basiura, B.; Duda, J.; Opiła, J.; Pełech-Pilichowski, T. Advances in Fuzzy Decision Making: Theory and Practice, Studies in Fuzziness and Soft Computing; Springer: New York, NY, USA, 2015; ISBN 978-3-319-26492-9. [Google Scholar]
- Gaweł, B.; Rębiasz, B.; Skalna, I. Data mining methods for long-term forecasting of market demand for industrial goods. In Information Systems Architecture and Technology; Wilimowska, Z., Borzemski, L., Grzech, A., Świątek, J., Eds.; Springer: Cham, Germany, 2016; pp. 3–13. [Google Scholar]
- Lorenz, E.N. Atmospheric predictability as revealed by naturally occurring analogues. J. Atmos. Sci. 1969, 26, 636–646. [Google Scholar] [CrossRef] [Green Version]
- Rogers, D.S.; Green, H.L. A new perspective on forecasting store sales: Applying statistical models and techniques in the analog approach. Geogr. Rev. 1979, 69, 449–458. [Google Scholar] [CrossRef]
- Sidle, R.E.E.; Lee, W.J.J. An update on the use of reservoir analogs for the estimation of oil and gas reserves. SPE Econ. Manag. 2010, 2, 80–85. [Google Scholar] [CrossRef]
- Szozda, N. Analogous forecasting of products with a short life cycle. DMMS 2010, 4, 71–85. [Google Scholar] [CrossRef]
- Zeliaś, A.; Pawełek, B.; Wanat, S. Prognozowanie Ekonomiczne Teoria Przykłady Zadania; PWN: Warszawa, Poland, 2020; ISBN 83-01-14043-7. [Google Scholar]
- Macqueen, J. Some methods for classification and analysis of multivariate observations. In Proceedings of the 5th Berkeley Symposium on Mathematical Statistics and Probability, Berkeley, CA, USA, 21 June–18 July 1967; pp. 281–297. [Google Scholar]
- Rokach, L.; Maimon, O. Data mining with decision trees: Theory and applications. In Machine Perception and Artificial Intelligence, 2nd ed.; World Scientific: Singapore, 2014; Volume 81, ISBN 978-981-4590-07-5. [Google Scholar]
- Zadeh, L.A. Fuzzy sets. Inf. Control 1965, 8, 338–353. [Google Scholar] [CrossRef] [Green Version]
- Yuan, Y.; Shaw, M.J. Induction of fuzzy decision trees. Fuzzy Sets Syst. 1995, 69, 125–139. [Google Scholar] [CrossRef]
- Silva, P.C.D.L.E.; Júnior, C.A.S.; Alves, M.A.; Silva, R.C.P.; Vieira, G.L.; Lucas, P.D.O.E.; Sadaei, H.J.; Guimarães, F.G. PYFTS/pyFTS: Stable Version 1.6; Zenodo: Geneva, Switzerland, 2019; Available online: https://zenodo.org/record/2669398 (accessed on 17 July 2021).
- Statistical Review of World Energy. Available online: https://www.bp.com/en/global/corporate/energy-economics/statistical-review-of-world-energy.html (accessed on 11 February 2021).
- World Development Indicators. Available online: https://datacatalog.worldbank.org/dataset/world-development-indicators (accessed on 11 February 2021).
- KAPSARC Data Portal. Available online: https://datasource.kapsarc.org/pages/home/ (accessed on 12 February 2021).
- Balfe, P.; Kelp, O. Gas consumption forecasting. A methodology. Acil Allen Consulting: Brisbane, Australia, 2014. Available online: https://www.aemo.com.au/-/media/files/gas/national_planning_and_forecasting/ngfr/gas-consumption-forecasting-methodology.pdf (accessed on 9 August 2021).
- Hafezi, R.; Akhavan, A.N.; Zamani, M.; Pakseresht, S.; Shamshirband, S. Developing a data mining based model to extract predictor factors in energy systems: Application of global natural gas demand. Energies 2019, 12, 4124. [Google Scholar] [CrossRef] [Green Version]
- Azadeh, A.; Zarrin, M.; Rahdar Beik, H.; Aliheidari Bioki, T. A neuro-fuzzy algorithm for improved gas consumption forecasting with economic, environmental and IT/IS indicators. J. Pet. Sci. Eng. 2015, 133, 716–739. [Google Scholar] [CrossRef]
- Makridakis, S.; Spiliotis, E.; Assimakopoulos, V. The M4 competition: 100,000 time series and 61 forecasting methods. Int. J. Forecast. 2020, 36, 54–74. [Google Scholar] [CrossRef]
- Hyndman, R.; Koehler, A.B.; Ord, J.K.; Snyder, R.D. Forecasting with Exponential Smoothing: The State Space Approach; Springer Science and Business Media: Berlin, Germany, 2008. [Google Scholar]
- Hyndman, R.J.; Khandakar, Y. Automatic time series forecasting: The forecast package for R. J. Stat. Softw. 2008, 27, 1–22. [Google Scholar] [CrossRef] [Green Version]
Figure 1.
Forecasting algorithm diagram.
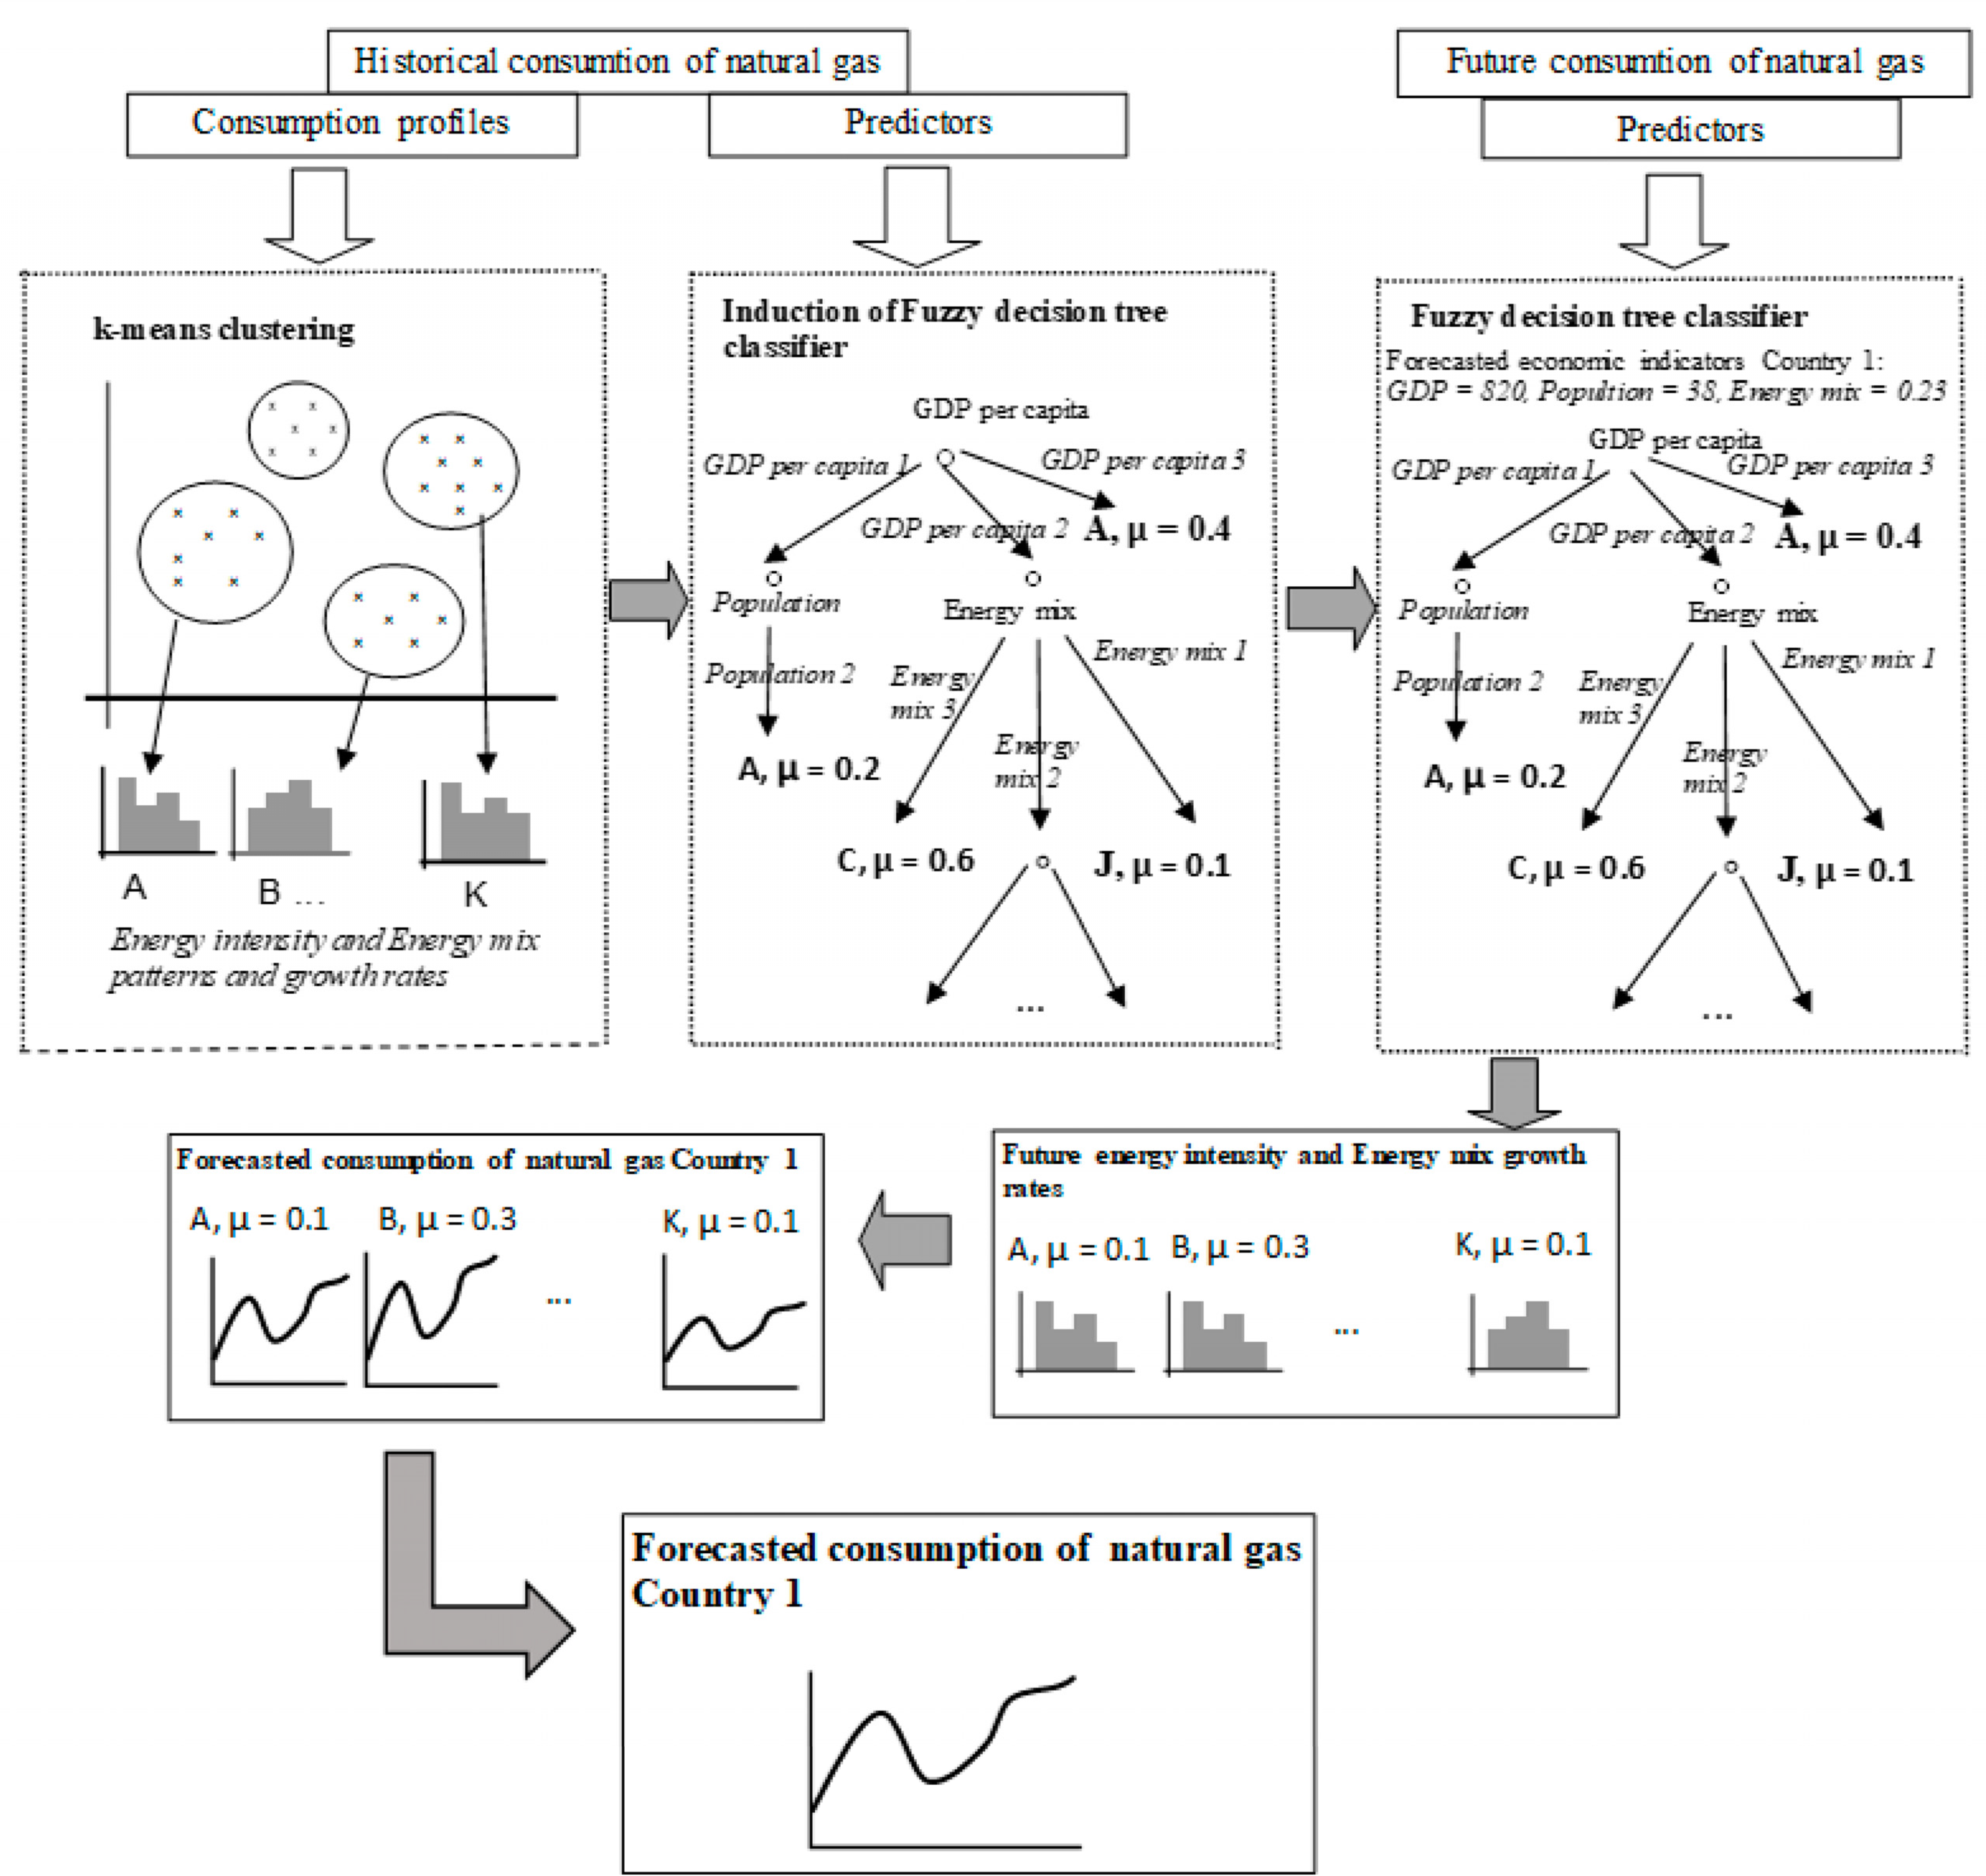
Figure 2.
Fuzzing GDP per capita using: (a) Grid, (b) k-Means, (c) fuzzy C-means.
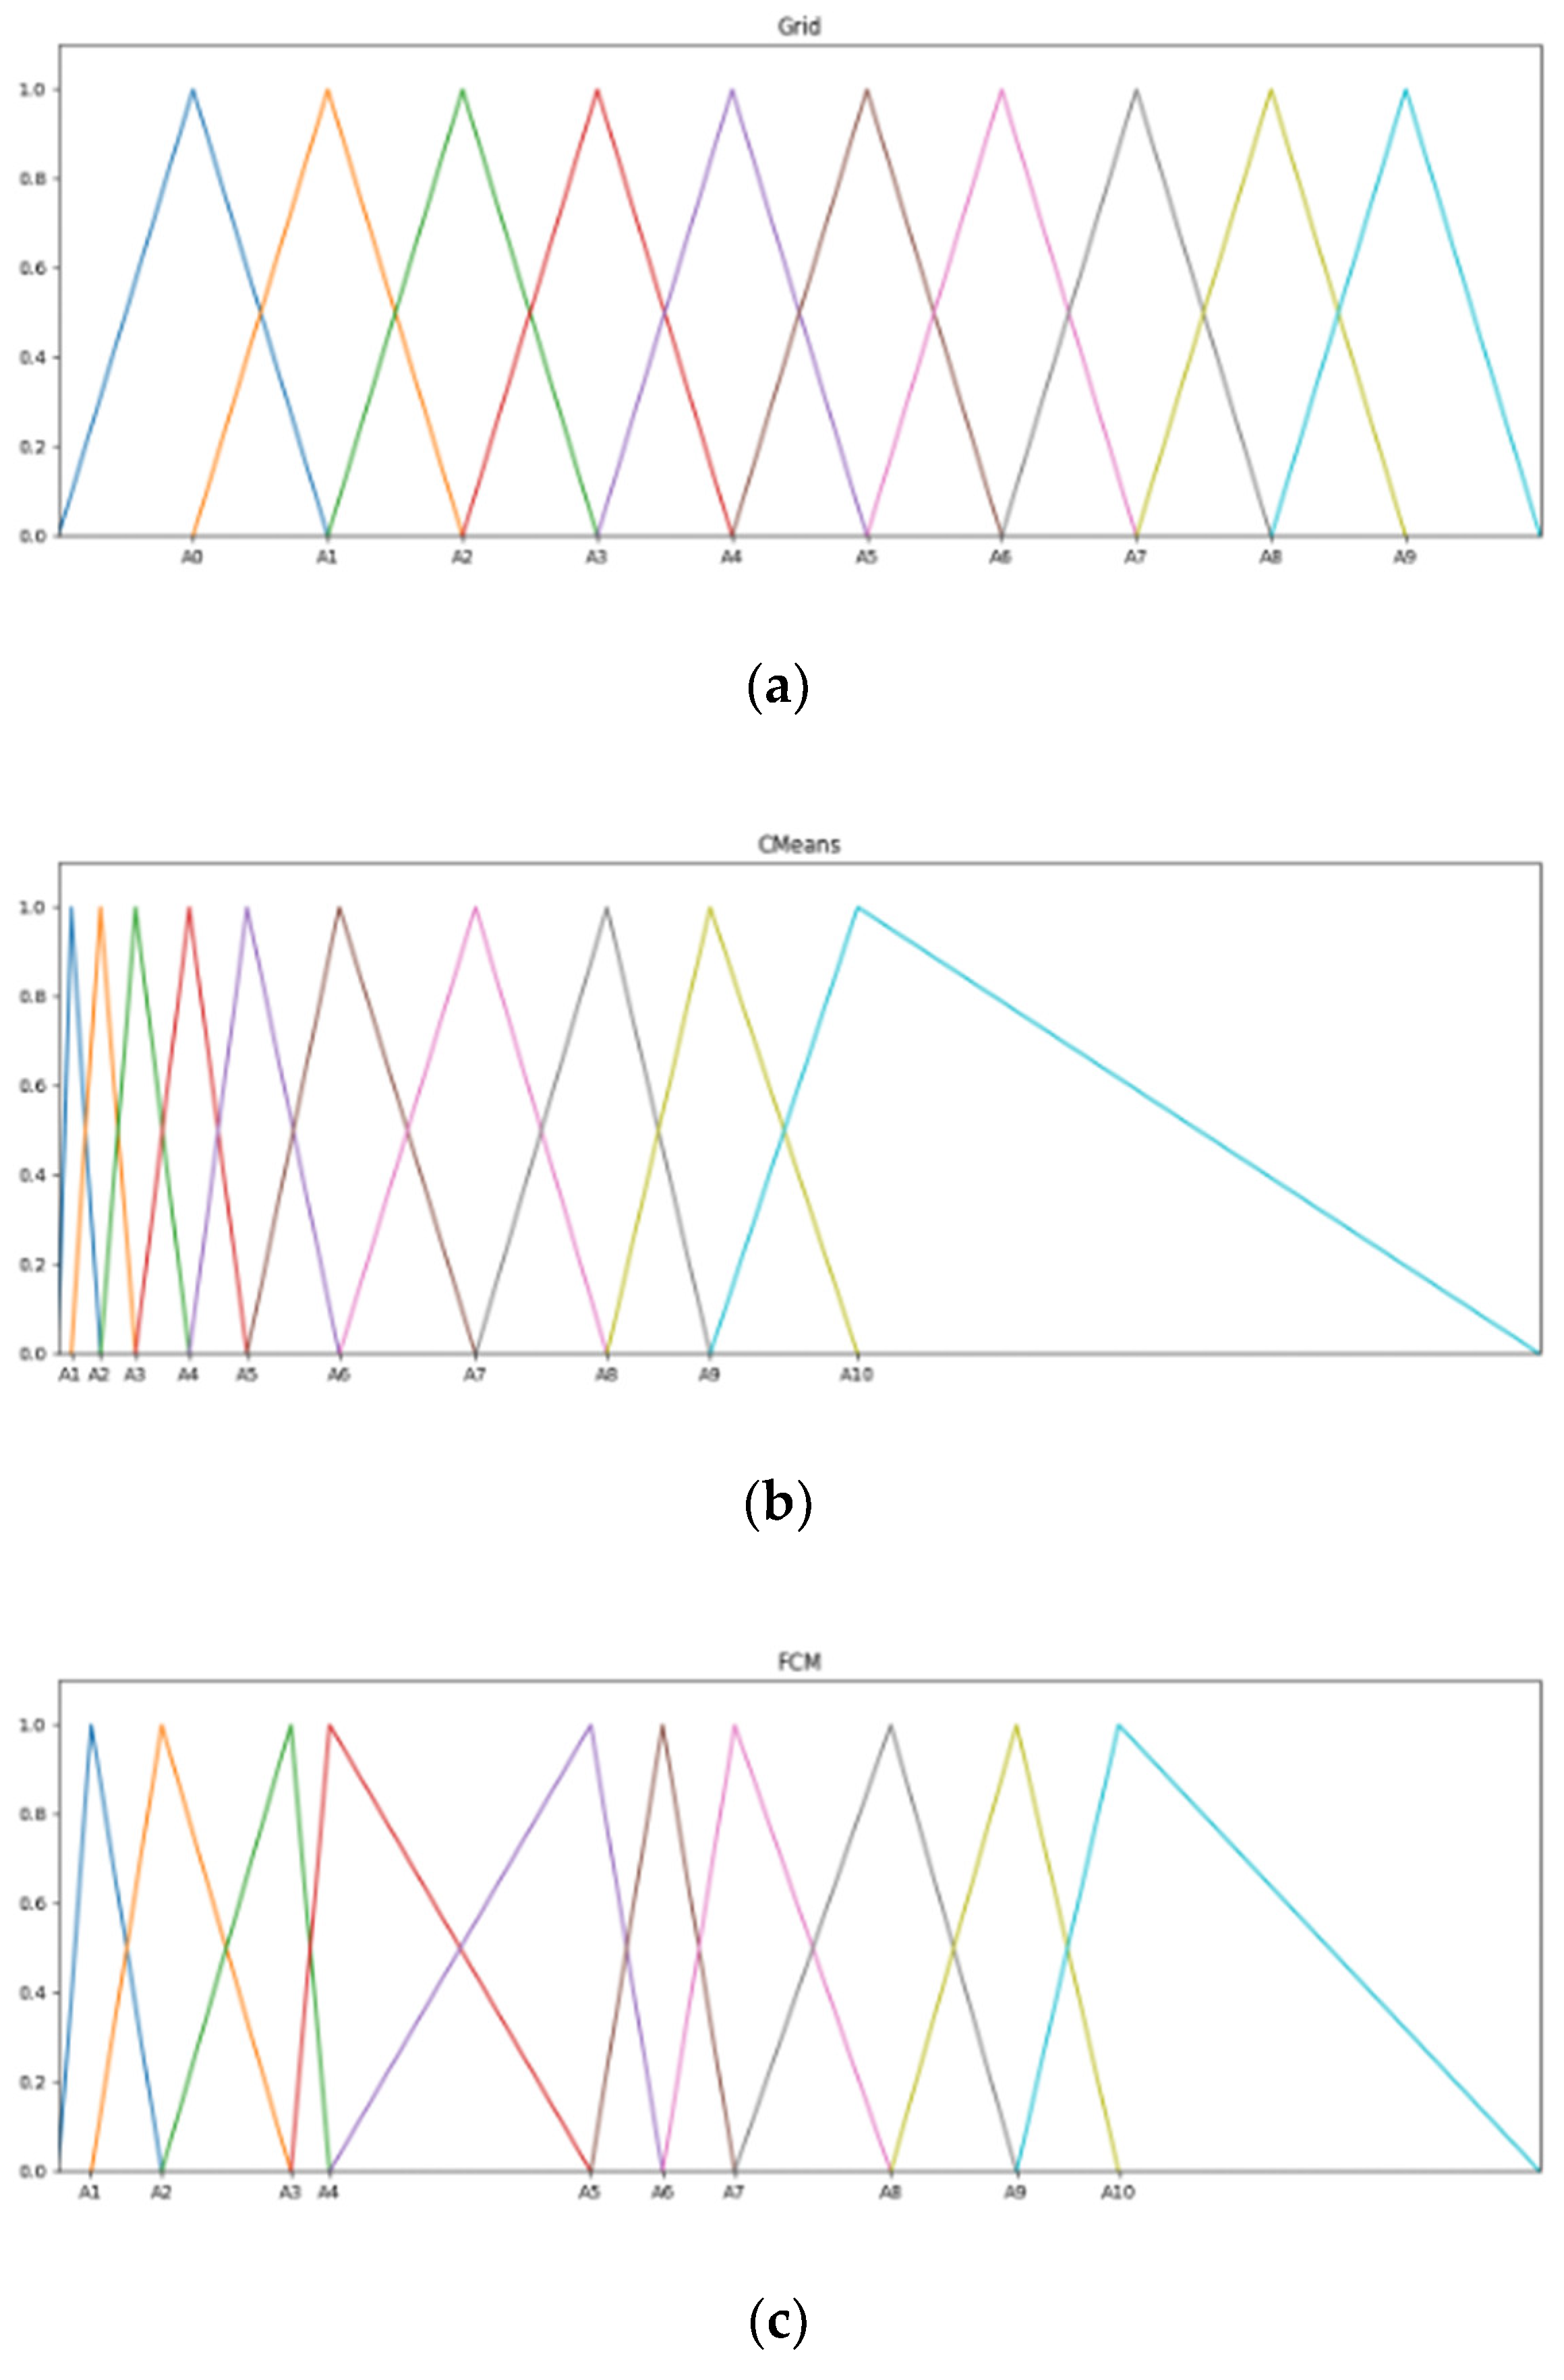
Figure 3.
Natural gas consumption [TJ]–actual values and forecasts: (a) Algeria; (b) China.

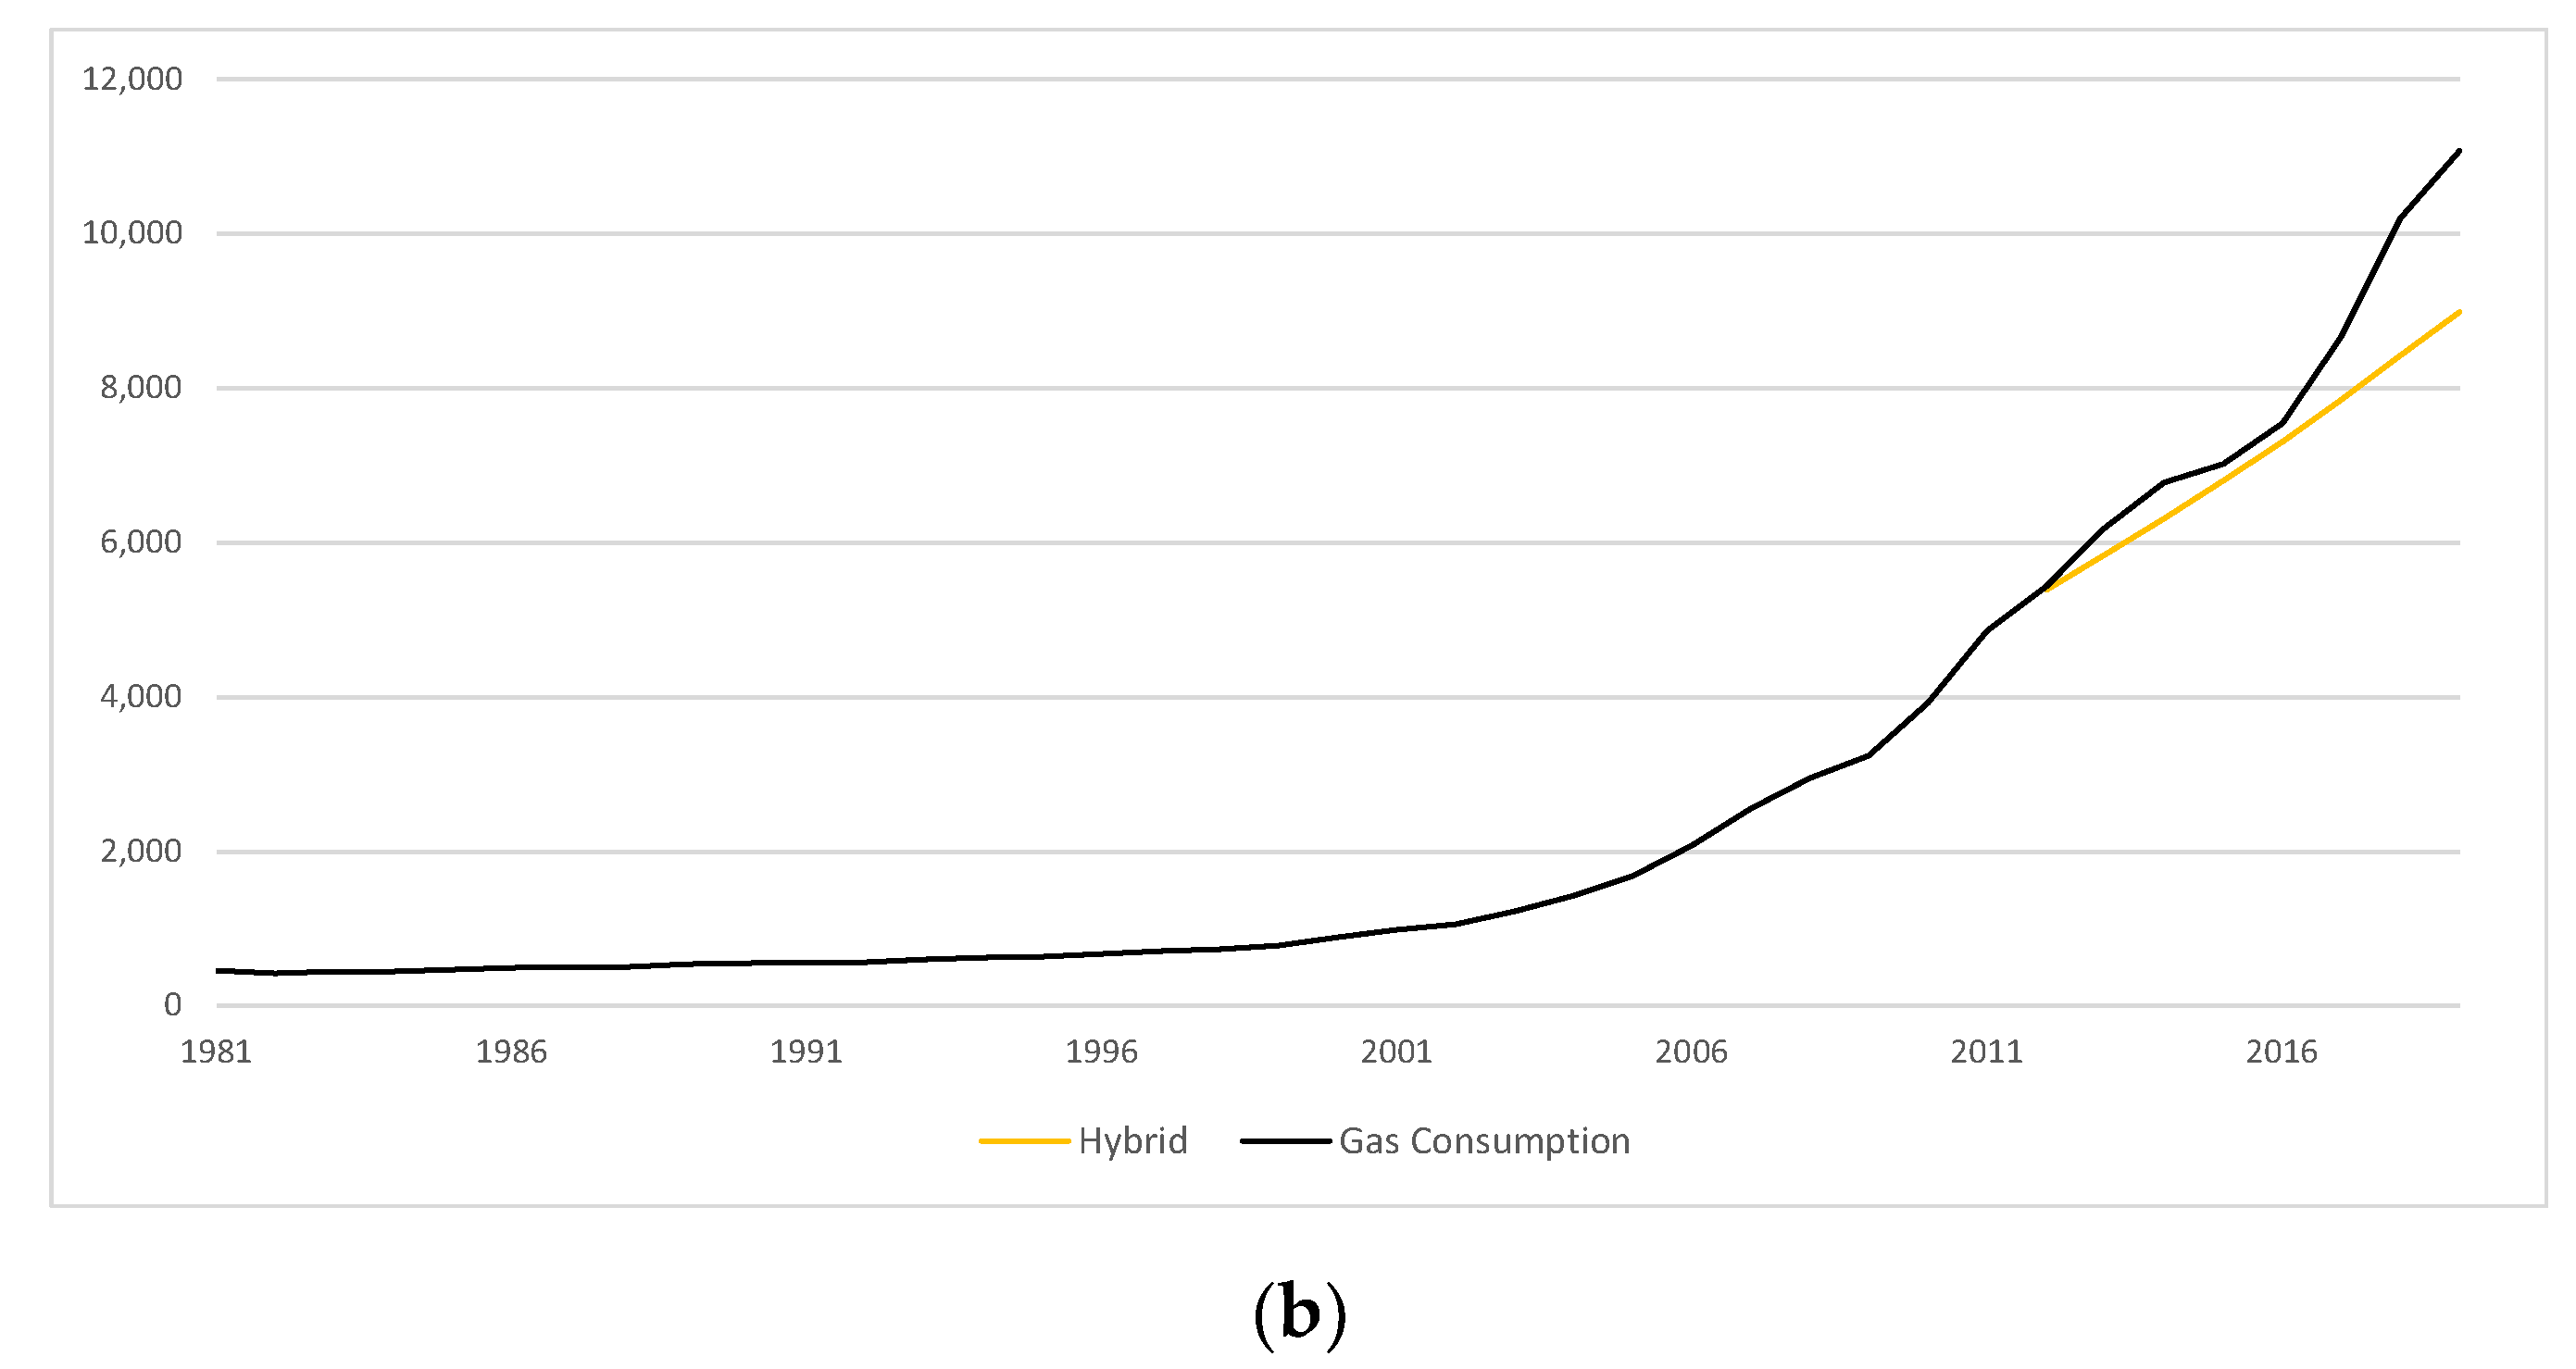
Figure 4.
Natural gas consumption [TJ]–actual values and forecasts: (a) Germany; (b) Japan.
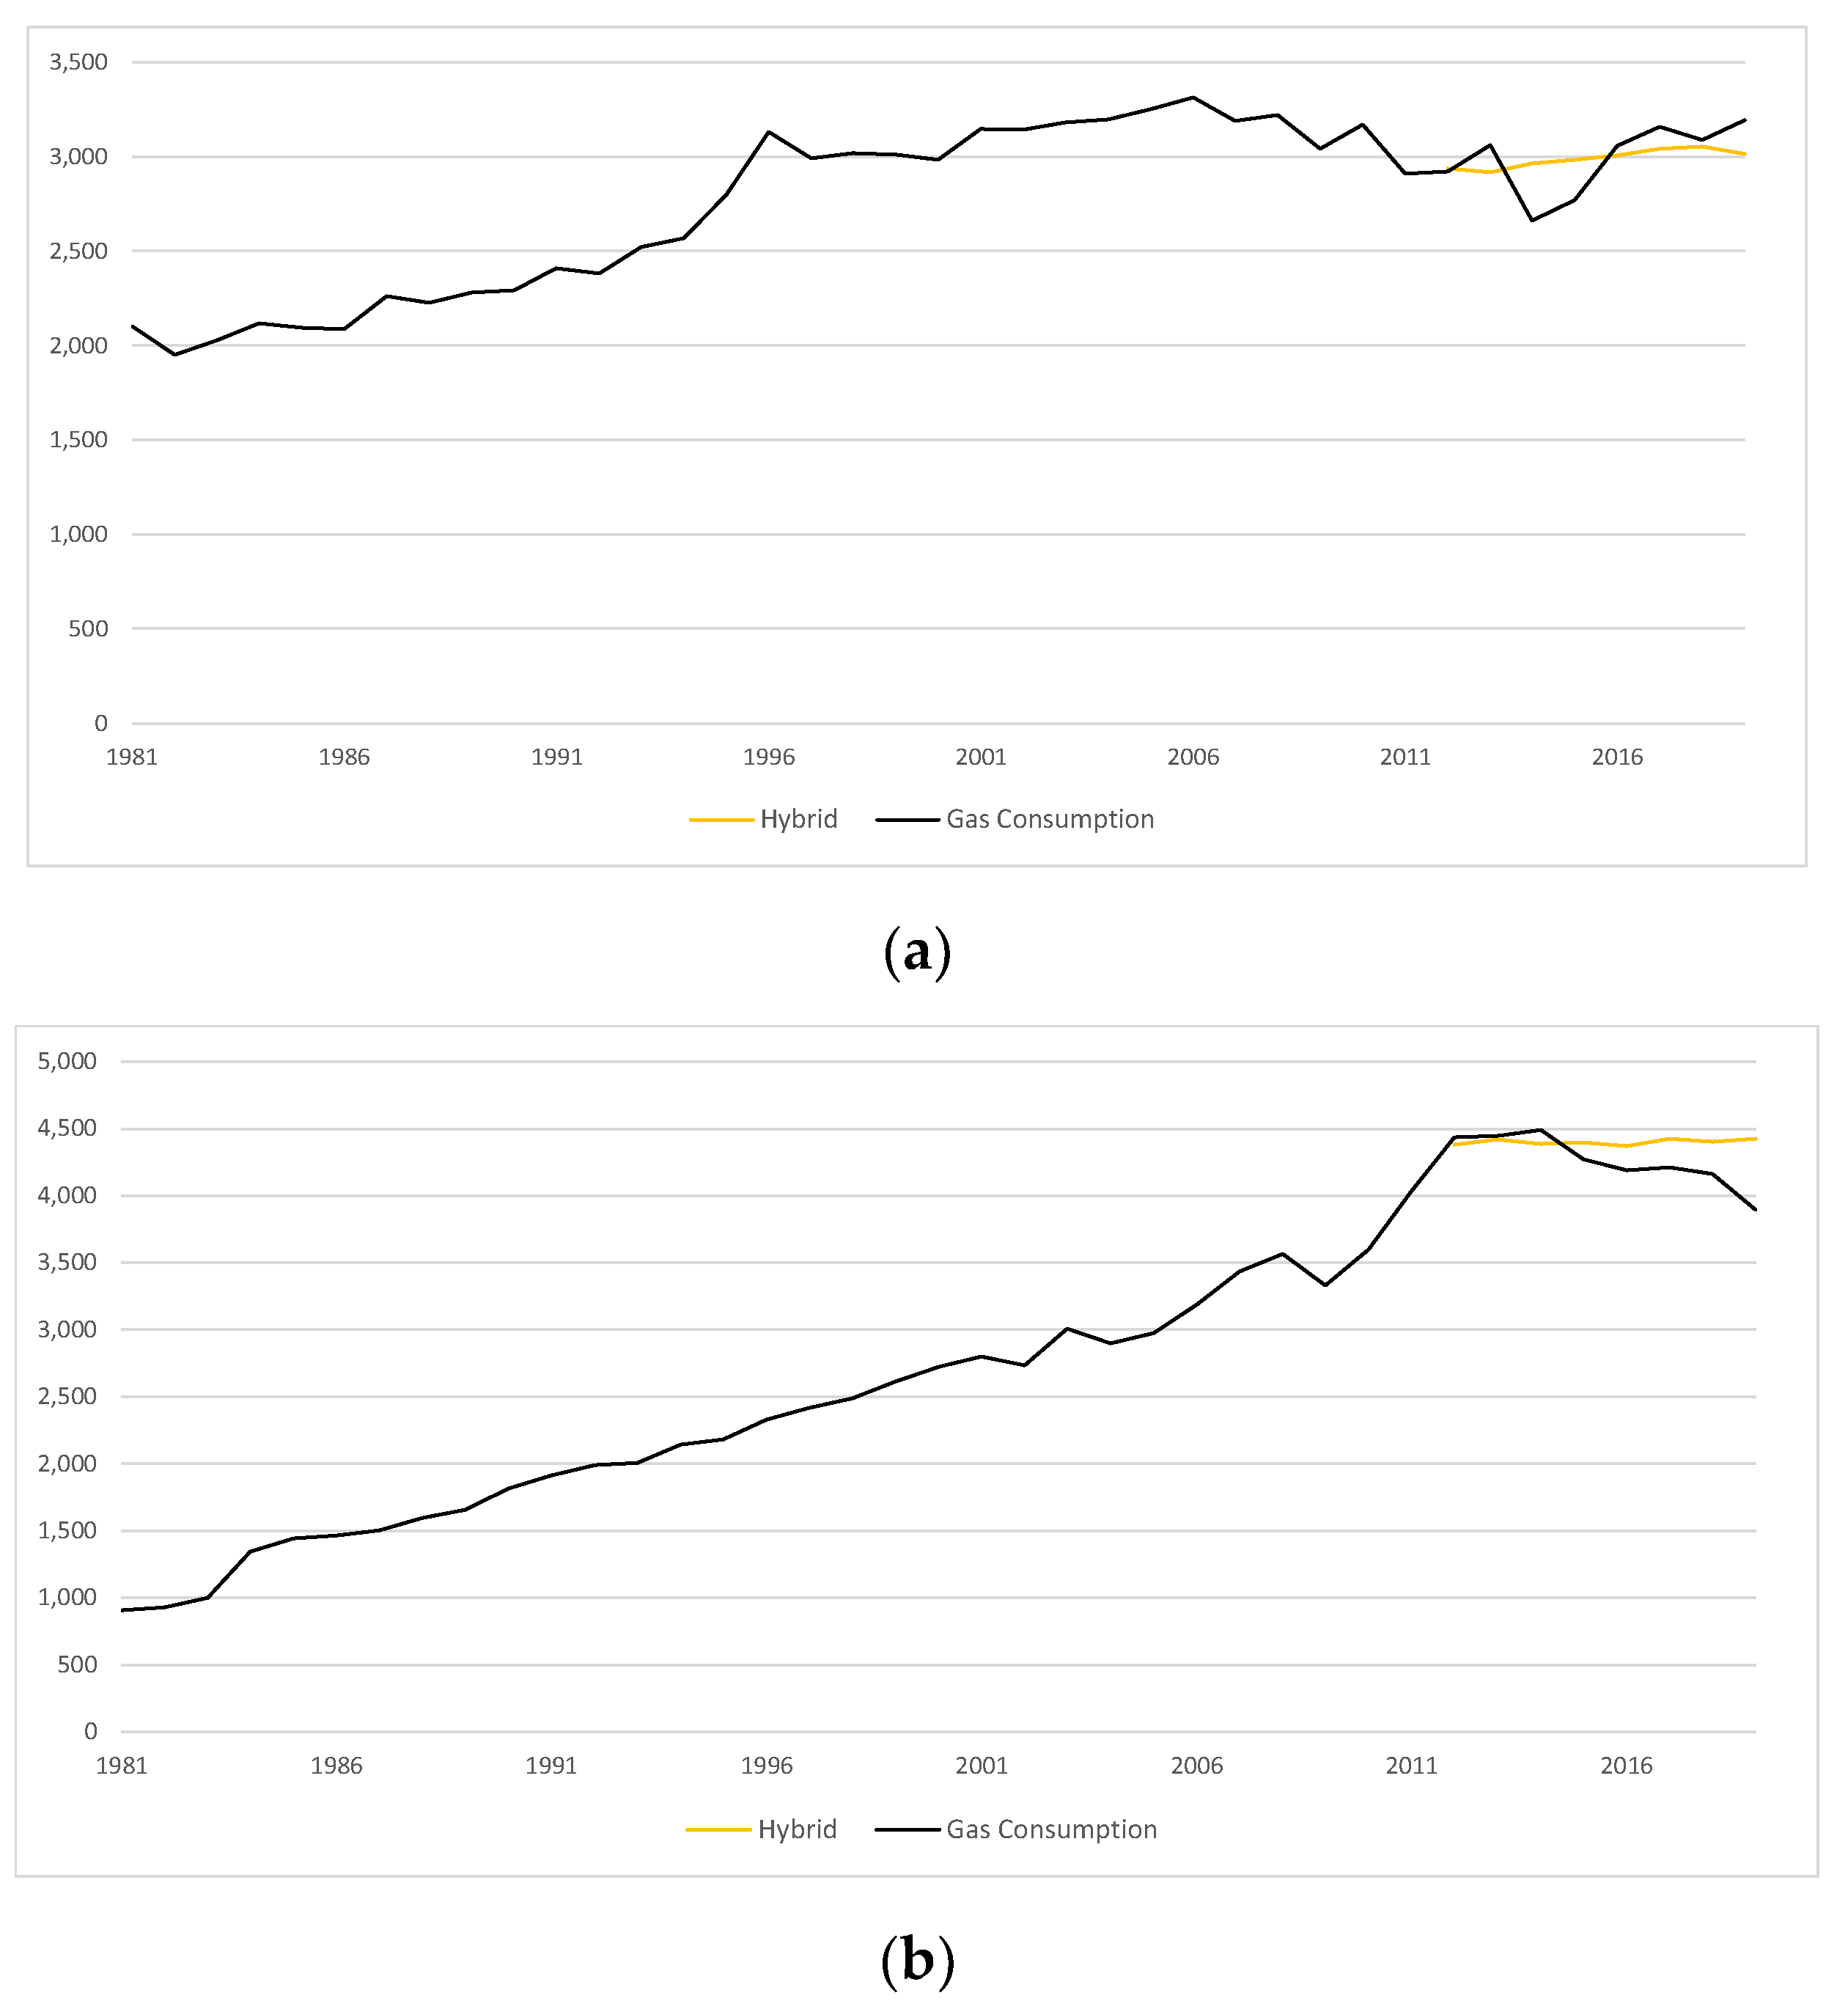
Figure 5.
Natural gas consumption [TJ]–actual values and forecasts: (a) Poland; (b) US.

Table 1.
Description of variables.
| Energy_GDP | — | Energy intensity of GDP–ratio of annual energy consumption to GDP in TJ/billion USD at constant prices 2010 |
| NG_mix | — | Share of natural gas consumption in the Energy mix (in total annual consumption of primary energy carriers) |
| GDP_PC | — | GDP per capita in USD at constant prices 2010 |
| Industry_GDP | — | The share of industrial production in generating GDP |
| HeatingDays | — | Heating Degree Days (HDD) index for 15 degrees Celsius |
| Population | — | The country’s population in millions |
| CO2_GDP | — | Relation of CO2 emissions to GDP in million tons/billion USD at constant prices 2010 |
| GDP | — | Annual GDP in USD billion at constant prices 2010 |
| NG | — | Annual consumption of natural gas in TJ |
Table 2.
Basic descriptive statistics of variables.
| Mean | Median | Standard Deviation | Kurtosis | Skewness | Min | Max | Number of Observations | |
|---|---|---|---|---|---|---|---|---|
| Energy_GDP | 10.7 | 7.2 | 10.3 | 17.7 | 3.7 | 0.0 | 92.8 | 3668 |
| NG_mix | 0.2 | 0.2 | 0.2 | 0.9 | 1.2 | 0.0 | 0.9 | 4064 |
| GDP_PC | 19,036.0 | 11,969.0 | 19,560.0 | 3.0 | 2.0 | 173.0 | 116,233.0 | 3665 |
| Industry_GDP | 31.7 | 29.2 | 11.9 | 2.1 | 1.1 | 0.0 | 84.8 | 3063 |
| HeatingDays | 898.0 | 9455.0 | 6729.0 | −1.0 | 0.0 | 0.0 | 25,416.0 | 4345 |
| Population | 58.3 | 14.20 | 167.6 | 36.40 | 5.9 | 0.0 | 1397.7 | 4345 |
| CO2_GDP | 0.7 | 0.4 | 0.7 | 13.80 | 3.3 | 0.0 | 5.5 | 3634 |
| GDP | 602.4 | 169.7 | 1567.1 | 50.10 | 6.3 | 0.0 | 18,273.0 | 3703 |
| NG | 1080.0 | 262.5 | 3016.3 | 35.50 | 5.7 | 0.0 | 30,479.0 | 3564 |
Table 3.
Correlation coefficients for all variables.
| Variable | Energy_ GDP | NG_mix | GDP_PC | Industry_ GDP | Heating Days | Population | CO2_GDP | GDP | NG |
|---|---|---|---|---|---|---|---|---|---|
| Energy_GDP | 1.00 | 0.39 | −0.37 | 0.22 | 0.06 | 0.19 | 0.96 | −0.12 | 0.06 |
| NG_mix | 0.39 | 1.00 | −0.05 | 0.26 | −0.08 | −0.18 | 0.30 | −0.06 | 0.18 |
| GDP_PC | −0.37 | −0.05 | 1.00 | −0.17 | 0.34 | −0.20 | −0.42 | 0.22 | 0.11 |
| Industry_GDP | 0.22 | 0.26 | −0.17 | 1.00 | −0.23 | 0.03 | 0.27 | −0.15 | −0.07 |
| HeatingDays | 0.06 | −0.08 | 0.34 | −0.23 | 1.00 | −0.11 | 0.04 | 0.07 | 0.14 |
| Population | 0.19 | −0.18 | −0.20 | 0.03 | −0.11 | 1.00 | 0.28 | 0.33 | 0.19 |
| CO2_GDP | 0.96 | 0.30 | −0.42 | 0.27 | 0.04 | 0.28 | 1.00 | −0.11 | 0.05 |
| GDP | −0.12 | −0.06 | 0.22 | −0.15 | 0.07 | 0.33 | −0.11 | 1.00 | 0.80 |
| NG | 0.06 | 0.18 | 0.11 | −0.07 | 0.14 | 0.19 | 0.05 | 0.80 | 1.00 |
Correlation coefficients are significant at 0.05 level, nonsignificant correlation is marked with shaded background, N = 2701 (missing data were removed in pairs).
Table 4.
Characteristics of 15 clusters obtained by the k-means method.
| Cluster | Energy_GDP (TJ/USD Billion) | NG_mix (%) | Number of Cases | Percent (%) |
|---|---|---|---|---|
| 1 | 69.09 | 0.73 | 14 | 0.62 |
| 2 | 15.66 | 0.05 | 196 | 8.64 |
| 3 | 31.90 | 0.11 | 53 | 2.34 |
| 4 | 44.67 | 0.40 | 27 | 1.19 |
| 5 | 61.34 | 0.45 | 13 | 0.57 |
| 6 | 37.01 | 0.85 | 30 | 1.32 |
| 7 | 6.31 | 0.13 | 431 | 19.00 |
| 8 | 9.74 | 0.46 | 131 | 5.77 |
| 9 | 10.85 | 0.65 | 115 | 5.07 |
| 10 | 87.90 | 0.79 | 11 | 0.48 |
| 11 | 9.78 | 0.35 | 270 | 11.90 |
| 12 | 6.24 | 0.02 | 475 | 20.93 |
| 13 | 23.31 | 0.52 | 45 | 1.98 |
| 14 | 39.69 | 0.64 | 33 | 1.45 |
| 15 | 7.42 | 0.23 | 425 | 18.73 |
Table 5.
Comparison of fuzzing GDP per capita by different partitioners.
| Partition | Grid | c-Means | Fuzzy c-Means |
|---|---|---|---|
| A1 | [−12441; 312; 13,066] | [312; 1502; 4474] | [312; 3127; 6129] |
| A2 | [312; 13,066; 25,821] | [1502; 4474; 8332] | [3127; 6129; 6461] |
| A3 | [13,066; 25,821; 38,575] | [4474; 8332; 13,337] | [6129; 6461; 13,511] |
| A4 | [25,821; 38,575; 51,329] | [8332; 13,337; 19,226] | [6461; 13,511; 14,920] |
| A5 | [38,575; 51,329; 64,084] | [13,337; 19,226; 26,060] | [13,511; 14,920; 24,823] |
| A6 | [51,329, 64,084; 76,838] | [19,226; 26,060; 32,233] | [14,920; 24,823; 33,456] |
| A7 | [64,084; 76,838; 89,592]) | [26,060; 32,233; 39,576] | [24,823; 33,456; 38,081] |
| A8 | [76,838; 89,592; 102,347] | [32,233; 39,576; 48,189] | [33456; 38,081; 39,270] |
| A9 | [89,592; 102,347, 115,101] | [39,576; 48,189; 62,294] | [38,081; 39,270; 53,481] |
| A10 | [102,347; 115,101; 127,856] | [48,189; 62,294; 127,856] | [39,270; 53,481;127,856] |
Table 6.
Comparison of errors for individual benchmarking approaches for all 79 analyzed countries.
| Method | RMSE | MAPE (%) |
|---|---|---|
| Naïve approach 1 | 1259 | 16.8 |
| Classical approach (ETS, ARIMA) 1 | 1203 | 16.3 |
| ML benchmark (NARR) | 534 | 15.3 |
| Linear regression (pooled) | 923 | 100.0 |
| Individual linear trend for each country | 567 | 13.0 |
| Hybrid with crisp decision tree | 271 | 7.8 |
| Hybrid with crisp decision tree and random term | ~552 | ~12.7 |
| Hybrid with fuzzy decision tree | 395 | 9.5 |
1 Classical and naïve approach are similarly effective.
Table 7.
Forecast errors for selected countries in classic and hybrid approaches.
| Country | Our Hybrid Approach (MAPE) | Classical (MAPE) |
|---|---|---|
| United States | 1.80% | 3.12% |
| China | 9.50% | 4.94% |
| Japan | 4.30% | 5.60% |
| Mexico | 4.10% | 4.39% |
| Germany | 4.40% | 6.08% |
| Algeria | 5.80% | 7.38% |
| Poland | 5.10% | 4.14% |
Publisher’s Note: MDPI stays neutral with regard to jurisdictional claims in published maps and institutional affiliations. |
© 2021 by the authors. Licensee MDPI, Basel, Switzerland. This article is an open access article distributed under the terms and conditions of the Creative Commons Attribution (CC BY) license (https://creativecommons.org/licenses/by/4.0/).
Share and Cite
MDPI and ACS Style
Gaweł, B.; Paliński, A. Long-Term Natural Gas Consumption Forecasting Based on Analog Method and Fuzzy Decision Tree. Energies 2021, 14, 4905. https://doi.org/10.3390/en14164905
AMA Style
Gaweł B, Paliński A. Long-Term Natural Gas Consumption Forecasting Based on Analog Method and Fuzzy Decision Tree. Energies. 2021; 14(16):4905. https://doi.org/10.3390/en14164905
Chicago/Turabian StyleGaweł, Bartłomiej, and Andrzej Paliński. 2021. "Long-Term Natural Gas Consumption Forecasting Based on Analog Method and Fuzzy Decision Tree" Energies 14, no. 16: 4905. https://doi.org/10.3390/en14164905
Note that from the first issue of 2016, this journal uses article numbers instead of page numbers. See further details here.