1. Introduction
The iron and steel industry accounts for 4–7% of global CO
2 emissions, making it one of the largest industrial emitters [
1]. The emissions intensity of the steelmaking industry is due to the use of fossil fuels, mainly coal and coke, to provide the energy required by the process as well as a reducing agent. Since the 1970s, direct reduction (DR) processes, which rely on natural gas rather than coal or coke, have emerged and gained traction. In DR processes, iron ore in the form of lumps, pellets, or fine powder is reduced in the solid state to direct reduced iron (DRI), which is thereafter converted to steel in an electric arc furnace (EAF). The most widely used DR process, MIDREX, has a CO
2 intensity that is 30–45% that of the traditional blast furnace–basic oxygen furnace (BF–BOF) route when using natural gas [
2]. However, CO
2 emissions remain high at 1.1–1.2 tCO
2 per tonne of steel. The use of scrap significantly reduces the energy consumption of the process, although scrap input into the EAF is limited by its availability. To reduce or completely abate emissions from steelmaking, carbon capture and storage (CCS) must be employed or fossil fuels must be replaced by renewable sources. Hydrogen, produced from water electrolysis using fossil-free electricity, is an alternative to natural gas that has been proposed for the DRI-EAF route, as it can reduce iron ore to metal iron. Furthermore, in combination with electricity, hydrogen can cover the energy demand of the process. The HYBRIT project in Sweden aims to demonstrate the viability of such a process [
3]. The first pilot plant to test the production of DRI using hydrogen was started in 2020.
Meeting the 1.5 or 2.0 °C targets put forward by the IPCC [
4] will likely require the achievement of negative emissions of CO
2 [
5]. This means that the use of biomass coupled with CCS should be considered for all plants in which fossil resources are currently being used, in particular in applications that require a carbon input, as biomass and captured CO
2 are the only renewable carbon sources. In steelmaking, biomass can act simultaneously as the reducing agent for the iron ore, the carbon source for the required carbon content of the steel, and the energy source. In the DRI-EAF route, the reduction agent can be produced through steam gasification of biomass to produce a gas that is rich in H
2 and CO. The only biomass steam gasification technology that has been demonstrated at industrial-scale is the dual fluidized bed (DFB) gasification technology [
6].
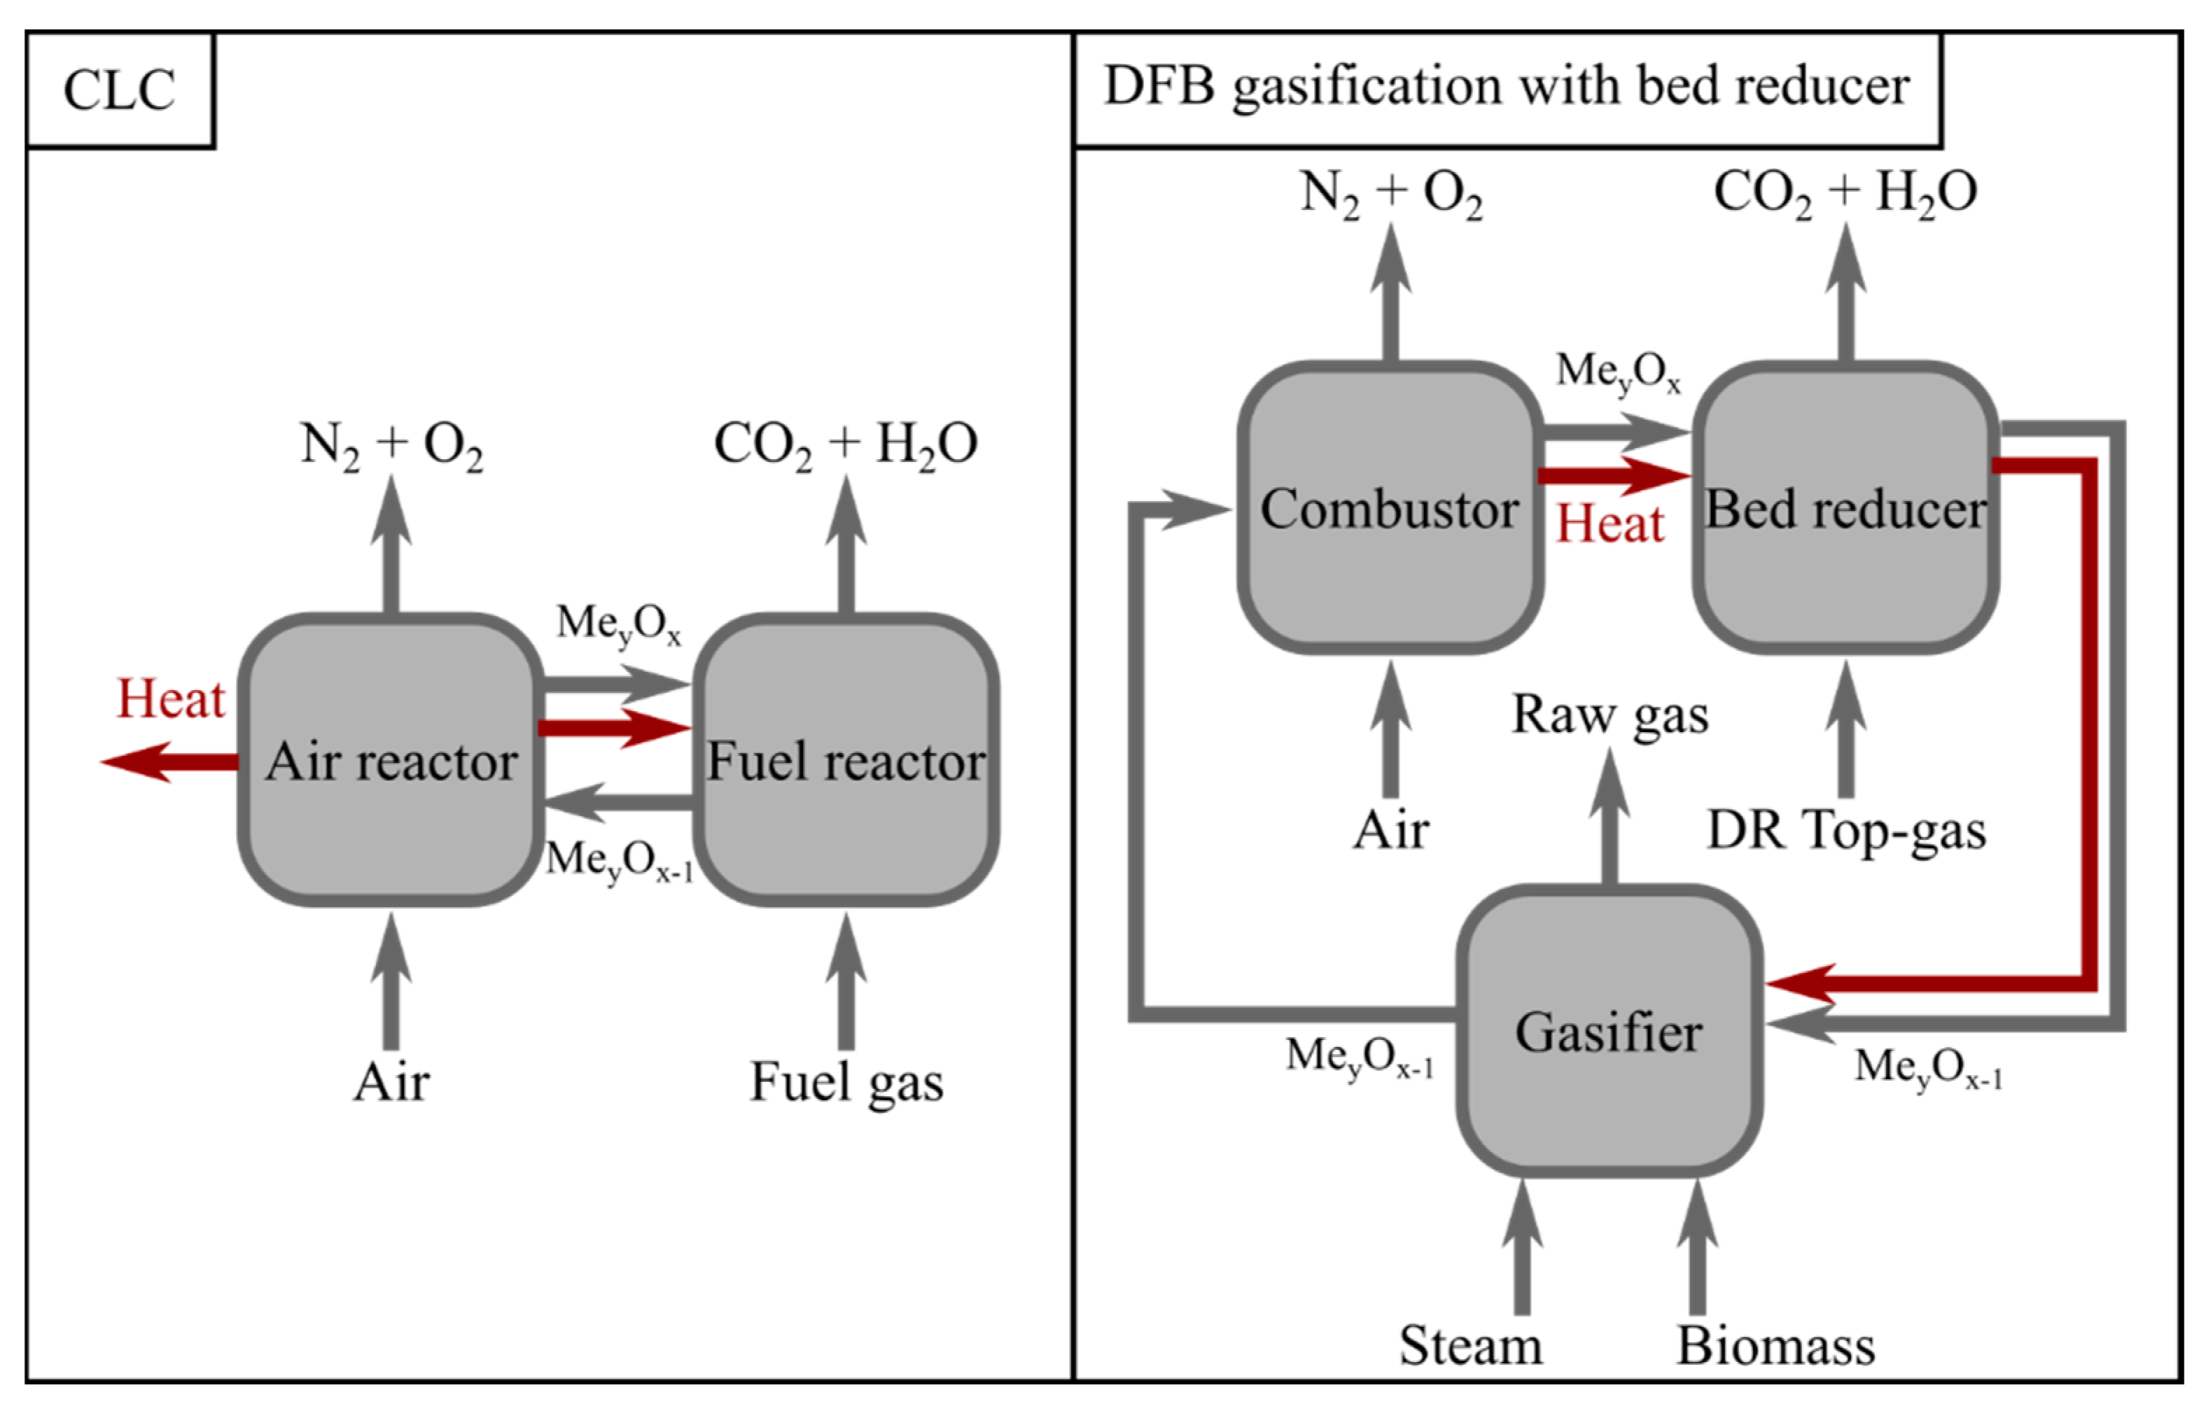
A DFB gasification system consists of two interconnected reactors, a gasification reactor in which the biomass is converted to a gas, referred to as the ‘raw gas’, and a combustor in which the unconverted biochar from the gasifier is burnt, thereby providing heat to the process [
7]. The heat and char are transported between the reactors by a fluidized bed. The integration of DFB gasification with the BF–BOF route has recently been investigated by Rosenfeld et al. [
8] and Müller et al. [
9]. In both of these works, H
2 from biomass gasification and the electrolysis of water is used to methanize the CO
2 produced from the steel mill, thereby reducing both the emissions and the need for natural gas for heating purposes [
8,
9]. The proposed DFB gasification configuration is the sorption-enhanced reforming (SER) technology, which relies on the adsorption of CO
2 in the gasifier and its release in the combustor to produce a H
2-rich syngas [
10]. When the combustor is fired with pure oxygen, a concentrated CO
2-stream is formed, which can be converted to methane to replace the natural gas used in the steel mill.
The integration of DFB gasification with DR of iron has recently been investigated by Hammerschmid et al. [
11] as a means to provide a biogenic-based reducing gas for a DR steelmaking process. Here again, the SER technology has been proposed, as well as its Oxyfuel version, which can provide net-negative emissions. The authors found that the reducing gas was suitable for use in DR. The cost of the reducing gas was found to be comparable to the cost of steam-reformed natural gas in Europe, albeit about twice as expensive as the reducing agent used in the BF–BOF route. The net-negative-emissions gas was found to be in the range of the steam-reformed natural gas only if the Oxyfuel-SER unit was integrated into the DRI-EAF plant, taking advantage of the existing air separation unit (ASU) to produce pure oxygen, and if the CO
2 was utilized. Otherwise, the SER unit without oxyfuel combustion is preferable. Even without CO
2 utilization, the biomass-based reducing gas leads to a decrease in emissions of more than 80% compared to the BF–BOF route. Hammerschmid and colleagues estimated that about 3.5 Mt of crude steel could be produced in this way in Austria, which would represent a 50% decrease in emissions from the Austrian iron and steel sector [
11].
In similarity to the study of Hammerschmid et al. [
11], the present work aims to describe the feasibility of using DFB gasification to provide a renewable reducing gas to a DRI-EAF process. However, the process that we propose here is not based on the SER technology but involves instead the use of slag from steelmaking as the bed material, which can act as an oxygen carrier, thereby enabling inherent CO
2 separation in the DFB gasification process. The production of steel using a reducing gas generated during DFB gasification is compared with the traditional DR route using natural gas, as well as with the use of hydrogen from electrolysis for steel production. Based on the mass and energy balances, the energy efficiency of the three DR routes is compared. As the DR reactor has flexibility with respect to a wide range of reducing gas characteristics, the economic benefit of one DR route over another ultimately comes down to the cost of the reducing gas that they can produce; this cost is, therefore, compared in this work. The economics of the DFB gasification route is assessed based on economic data obtained from the GoBiGas plant [
12], which is the largest DFB gasification plant to date, so as to estimate the costs related to the DFB gasification section. In contrast to Hammerschmid et al. [
11], the DR reactor is included in the mass and heat balances of the system, and the specificities of its operation with a DFB gasification-derived gas are discussed. The total production cost of the liquid steel is also assessed for the three routes and compared with the traditional BF–BOF route, accounting for the economic consequences of positive and negative CO
2 emissions, respectively.
3. Description of the Proposed System
In this section, the layout of the system proposed in this work and introduced in
Section 2.3 is described in greater detail. This description is restricted to the DR reactor in the steel production chain since the operation of the EAF and subsequent units will not significantly differ from the traditional DRI-EAF route. Still, it is worth noting that heat integration possibilities may differ and that, in comparison to the H
2-DR case, the DRI is carburized. Furthermore, biochar, which may be needed in the EAF, is inherently produced by the DFB process.
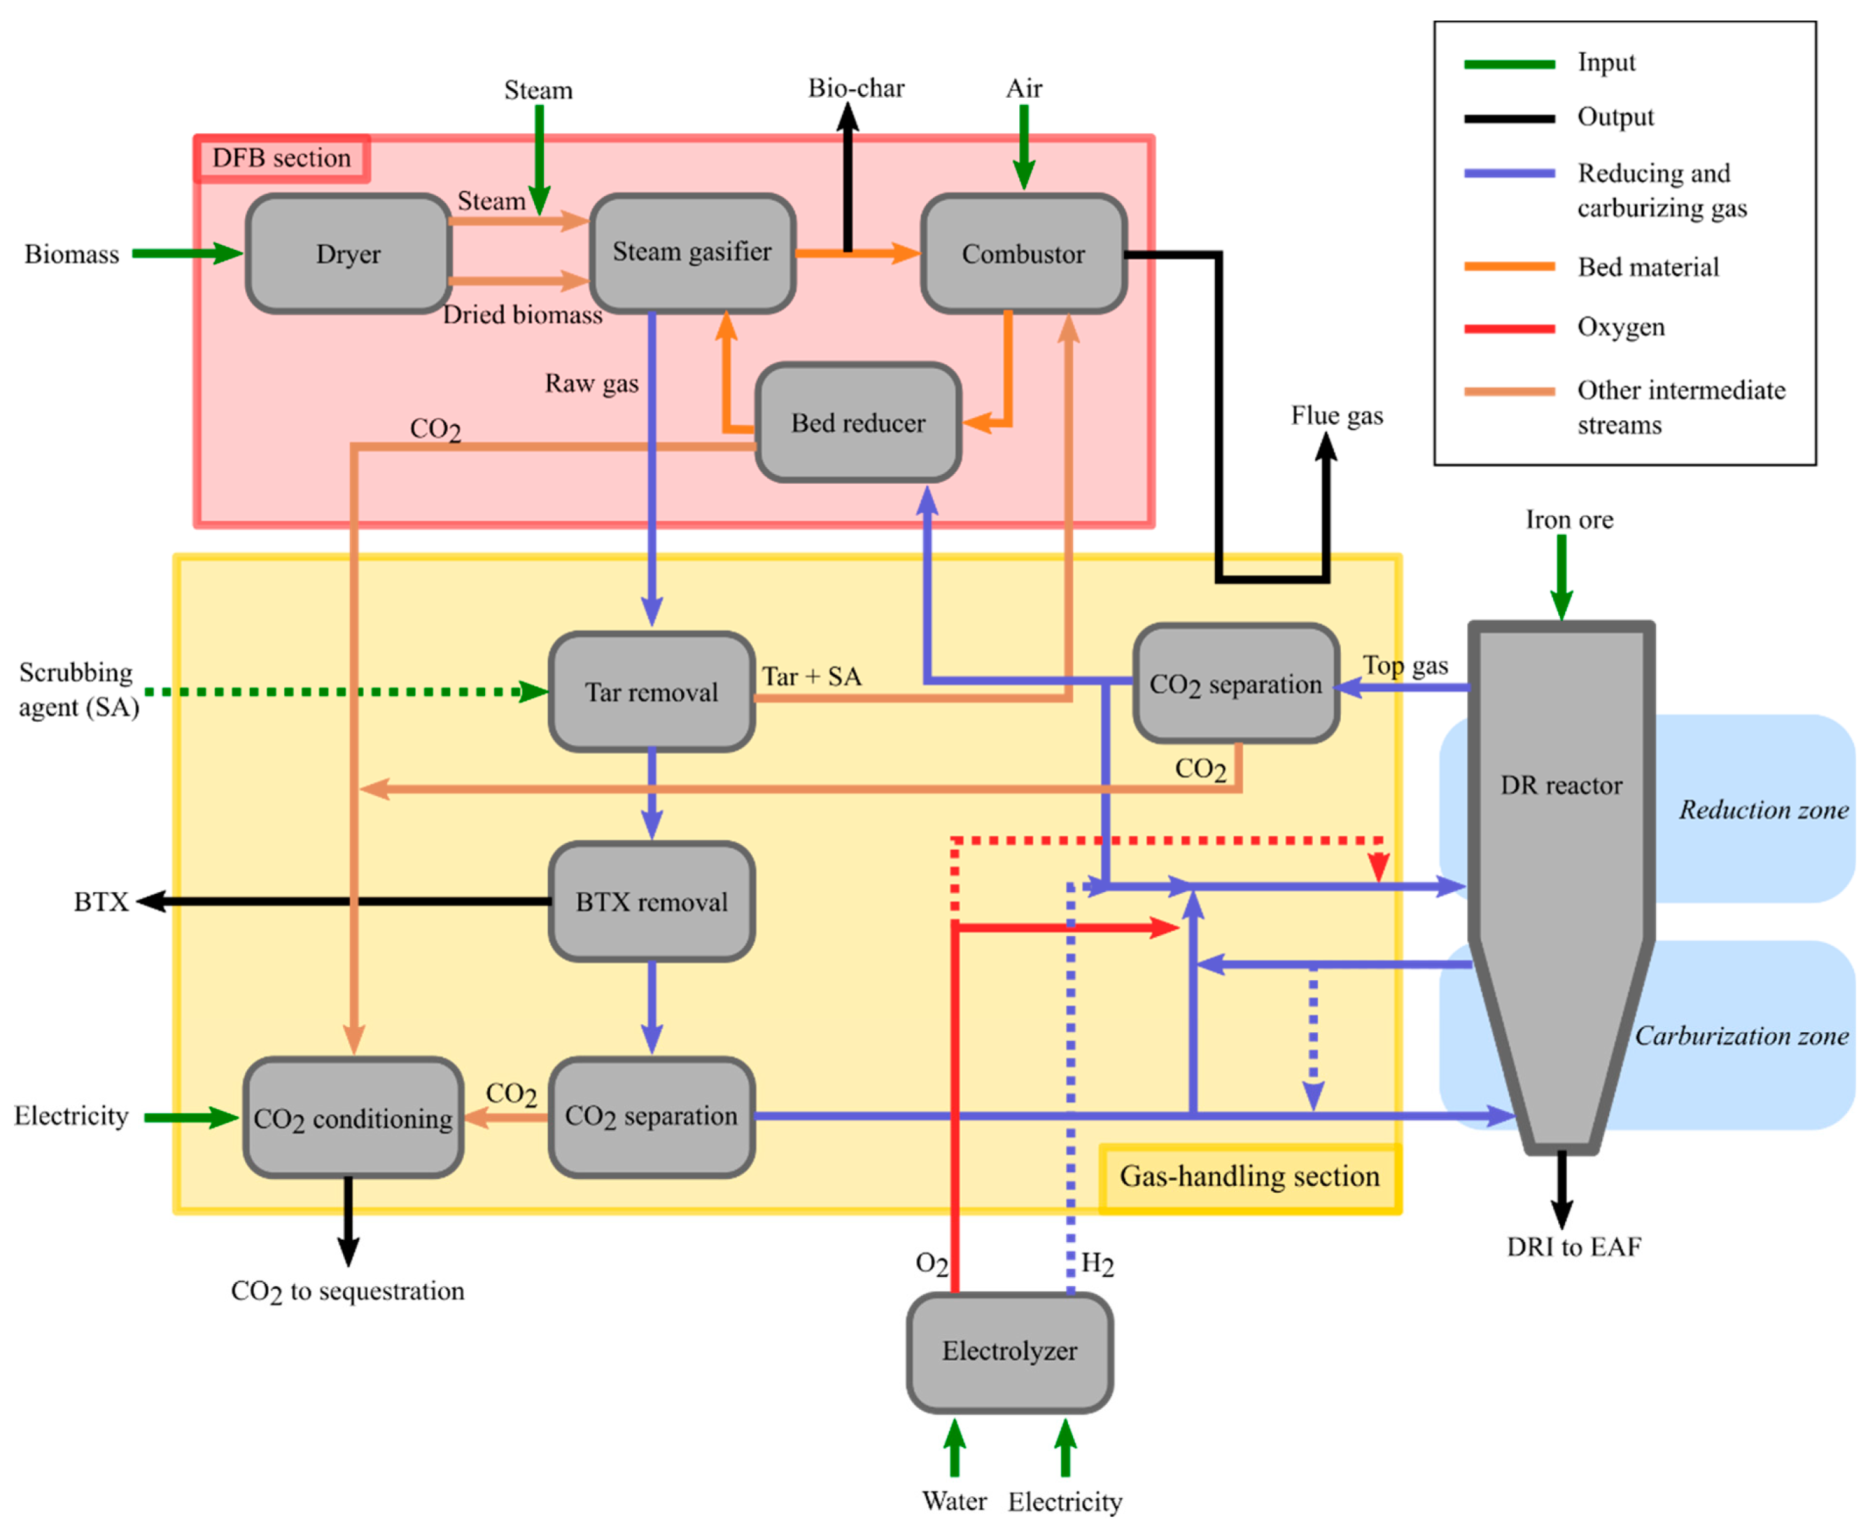
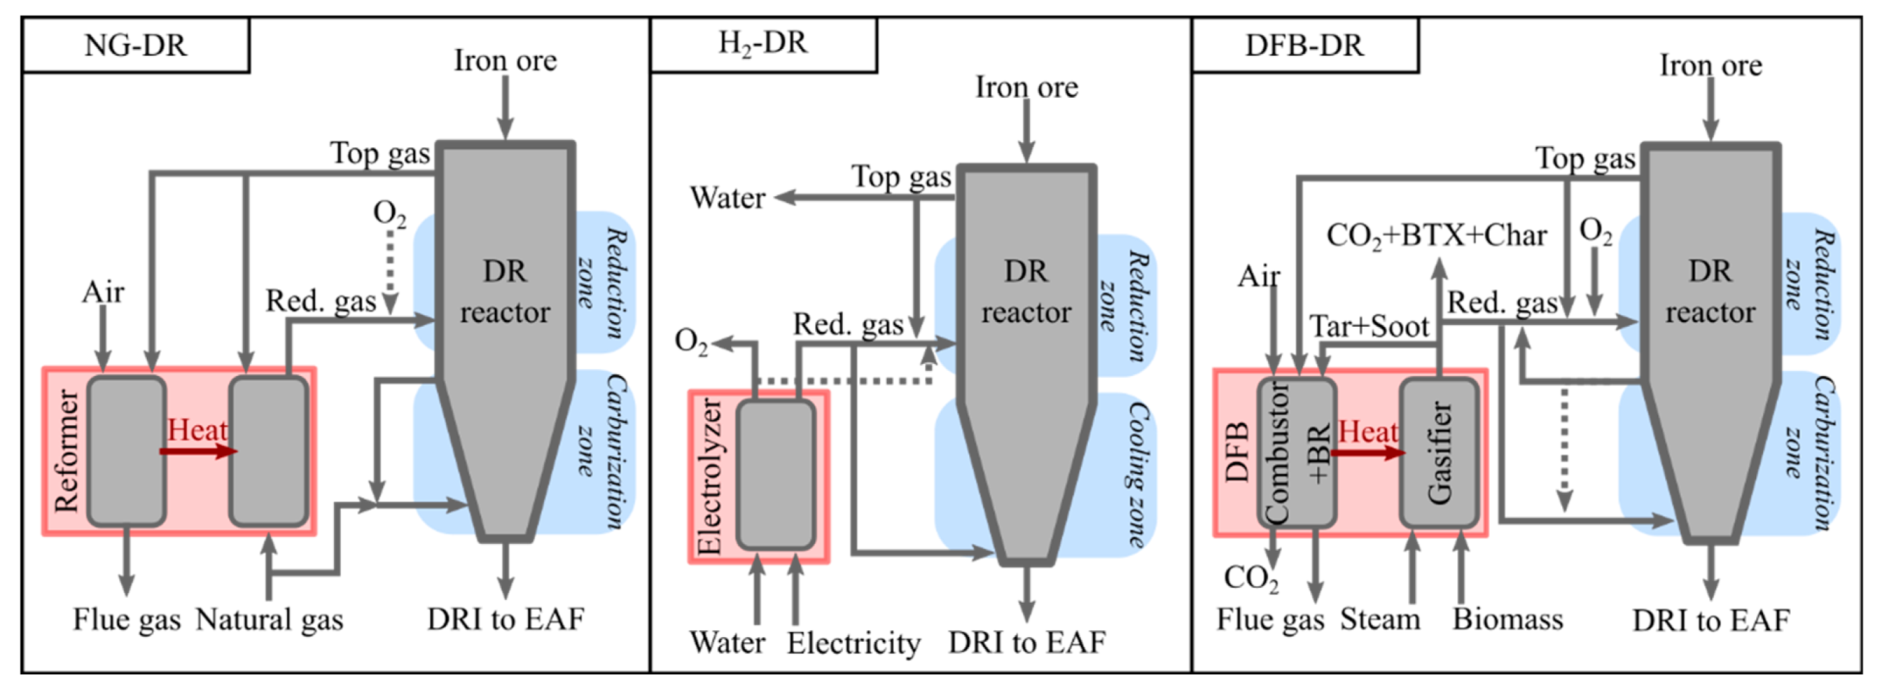
The layout of the DFB-DR section of the steel mill is shown in
Figure 3. This section is conceptually divided into three sub-sections: (1) the DFB loop, including the bed reducer, as well as the fuel dryer, and steam and air preheating; (2) the DR reactor; and (3) the gas-handling section. The latter includes all the cleaning, upgrading, separation, and preheating steps for the raw gas from the gasifier, the top-gas from the DR reactor, and the H
2 gas from electrolysis. The electrolyzer itself is not a part of any of these three sections. The H
2 stream from the electrolyzer is indicated as a dashed line in
Figure 3 because the O
2 required by the process can alternatively be produced by an ASU, in which case no H
2 is available for the gas-handling section.
3.1. DR Process
The DR reactor technology considered in this work is a shaft furnace, similar to the MIDREX process, in which the DRI is assumed to leave the DR reactor hot, to be fed directly into the EAF to decrease the energy consumption of that unit. As described in
Section 2.1, the DR reactor requires the introduction of a reducing gas to reduce the iron ore to Fe, as well as a carburization gas to ensure a carbon content that is optimal with regards to the end-use requirements, EAF operation, and energy consumption. The pressure requirement for the reducing gas used in the MIDREX process is only about 2 barg [
30]. Consequently, and given that the DFB section does not require pressures higher than atmospheric pressure, the compression needs of the DFB-DR plant and the associated energy demand are low.
The light hydrocarbons formed during biomass gasification, such as methane and ethylene, can be used as carburization gas for the reduced iron. Therefore, it is desirable to retain the light hydrocarbons in the raw gas from the gasification reactor, instead of fully converting them to H
2 and CO via steam or dry reforming, which is both costly and energy-intensive. In the MIDREX process, natural gas is used as the carburizing gas and to quench the hot DRI. The gas is extracted before the reduction zone and recirculated to the bottom of the furnace, as shown by the arrow in the left-hand panel in
Figure 2. As the MIDREX process is taken as the reference for the DFB-DR process proposed in this work, it is assumed that the carburizing gas is also partially recirculated, with the remaining fraction being mixed with the reducing gas and transported to the reducing zone. In contrast to MIDREX, this carburizing gas is rich in H
2 and CO and contains light hydrocarbons in addition to CH
4, predominantly C
2H
4 and C
3H
6.
To maintain suitable reducing conditions that allow for extensive metallization of the iron ore, which is defined as the ratio of metallic iron to total iron, a certain reduction potential (RP) must be maintained within the reactor. This means that the gas introduced into the DR reactor must have sufficiently high partial pressures of H
2 and CO to ensure reduction of the iron ore, as well as to ensure that the gas leaving the DR reactor, referred to as the top-gas, will still contain significant amounts of reducing gas. The RP, also referred to as the gas quality, is typically qualitatively estimated according to the (H
2 + CO)/(H
2O + CO
2) ratio [
11,
31]. Data from actual MIDREX plants, on which the NG-DR case is based, show a reducing gas input, sometimes referred to as bustle gas, with RP in the range of 8.7–12.3 and a top-gas with RP in the range of 1.7–2.5 [
31,
32]. Therefore, in this work, these RP values are used as references, and it is considered that the reducing gas should have an RP that is at least equal to 8.7, and the top-gas should have an RP that is at least equal to 1.7. That is not to say that an RP below these lower RP boundaries would not allow for significant reduction or would entail re-oxidation; rather, the reasoning is that efficient DR has been demonstrated for reducing and top gases with those characteristics and that the H
2-DR and DFB-DR routes should aim to deliver a reducing gas and top gas of comparable or superior quality (in terms of RP). Note, however, that the RP of the top-gas will depend to a large extent on the H
2/CO ratio of the reducing gas and the energy balance of the DR reactor.
To increase the production yield of metal iron, the top-gas should be recirculated to the DR reactor. However, to avoid the accumulation of CO
2 and H
2O in the reducing gas and a consequent decrease in the RP, the steam is condensed and the CO
2 is separated from the gas (upper “CO
2 separation” box in
Figure 3). Note that, prior to the CO
2-separation step, dust, originating from the iron ore, must be removed from the top-gas. This step is not depicted in
Figure 3. Due to the recirculation of the top-gas, the accumulation of inert or contaminant species could be a concern. Nonetheless, in the MIDREX process, two-thirds of the top-gas are recirculated to the reformer and, therefrom, to the DR reactor, which suggests that the accumulation of inerts and contaminants should not be an issue.
3.2. Preparation of the Reducing and Carburization Gases
The gas from DFB gasification is split into a reducing gas stream that is sent to the reducing zone of the DR reactor and a carburizing gas that is sent to the bottom of the furnace (
Figure 3). However, the raw gas from the gasifier contains significant quantities of CO
2, which would act as a dilutant for the reducing and carburizing gases, decreasing the RP of the former and possibly re-oxidizing the metallic iron in the case of the latter. Therefore, a CO
2 separation step before the DR reactor is also required (the lower “CO
2 separation” box in
Figure 3).
The raw gas also contains heavy hydrocarbons, referred to as tar, which must be removed because they can lead to operational issues in the colder sections of the process, owing to their high boiling points [
33]. This step is depicted as the “Tar removal” box in
Figure 3. The removal of tar from the raw gas from the gasifier can be accomplished by scrubbing. For calculation purposes, it is assumed that rapeseed methyl ester (RME) is used as the scrubbing agent, as was used in the GoBiGas plant. The tar thus removed and the spent RME from the scrubbing process can be dealt with by burning them in the combustor of the DFB, thereby recovering energy, albeit with the loss of a small amount of C in the form of CO
2. Some mono-aromatic hydrocarbons, such as BTX, are not removed by the RME scrubbing step. They can be removed by means of an active carbon bed. As described in
Section 2.3, BTX are of high value and can be extracted as products of the process. Note that RME is expensive, so other tar-separation solutions will in practice likely be preferred, for instance, using self-cleaning heat exchangers [
34] or other scrubbing agents, referred to as SA in
Figure 3, which can also be produced inherently through the distillation of tar products [
35].
As mentioned above, two CO
2 separation steps must be performed, one before the introduction of the reducing and carburizing gas to the DR reactor and one thereafter. If MEA scrubbing, which is the state-of-the-art technology for CO
2 capture, is used, the two scrubbing columns can use a single, shared reboiling column. The specific energy consumption for CO
2 separation using MEA scrubbing is typically within the range of 3.5–4.0 MJ/kg CO
2 for a combustion flue gas [
36]. The CO
2 concentrations in the cold gas and top-gas from which the CO
2 is separated are 22% and 11%, respectively, similar to typical flue gas CO
2 concentrations. Additionally, both the raw gas and the top-gas will be at near-atmospheric pressure. Therefore, the specific energy consumption for CO
2 separation in the proposed process will be within the abovementioned range. Although this energy demand is high, it is covered in the form of low-temperature (about 120 °C) heat, which can be provided by heat integration, given the substantial amounts of heat in the raw and flue gases from the DFB loop. This is, however, a matter of process optimization, as this heat can also be used for drying the fuel and preheating the streams.
3.3. DFB Loop Operating Conditions
The choices made regarding the temperature, degree of catalytic activity of the bed, and steam flow, which will affect both the residence time of the gas in the gasifier and the mixing behavior in the bed, will be an engineering trade-off with respect to the characteristics desired for the outputs from the gasifier. The degree of char gasification targeted will depend on how valuable the biochar is compared with the steel, since a higher degree of gasification will increase the production of H2 and CO, and, thereby, increase the production of DRI. High temperature and high bed catalytic activity will enhance the gasification rate. They will also decrease the tar yield, thereby reducing the demand for scrubbing agent in the tar-removal step. These conditions also promote the reforming of hydrocarbons to H2 and CO. On one hand, this will increase the amount of reducing gas available to the DR process. On the other hand, it will decrease the levels of light hydrocarbons. Depending on how the kinetics of the carburization reactions (following R2 and R3) compare with the carburization with hydrocarbons, this might limit the degree of carburization.
It should be noted that intensifying the reactions in the gasifier, in particular via the use of a higher temperature, increases the heat demand of the DFB gasification process, which increases the demand for top-gas in the bed reducer. This, however, decreases the amount of reducing gas available for the DR reactor. Alternatively, or additionally (if using all the reducing gas from the top-gas is insufficient to reduce the bed), H2 must be provided from electrolysis, which increases the electricity consumption of the process, thereby decreasing its efficiency.
In light of these considerations, it is deemed preferable to operate the gasifier at the relatively low temperature of about 800 °C. Addition of promoters of catalytic activity, such as potassium salts, will likely not be necessary, since the reduced iron-rich bed material should provide a catalytic surface. Nevertheless, potassium salts may be added to promote gas-phase reactions and decrease the tar content, in the case that the contacts between the bed material and gas are insufficient, or during start-up if the iron-rich bed requires an activation period. Although oxygen addition to the gasifier is to be avoided, a level of oxygen transport from the bed reducer to the gasifier of about 5% of the stoichiometric demand for full combustion of the fuel is judged to be acceptable. This value corresponds to the level of oxygen transport in the GoBiGas plant using active olivine as the bed material, as estimated by Alamia et al. [
37]. The reason for accepting a low level of oxygen transport is that it allows for the production of a highly concentrated CO
2 gas from the bed reducer, with low H
2 and CO concentrations, which can be sent to transport and storage after only limited conditioning. Indeed, if the bed were to be fully reduced, an excess of reducing gas would be needed in the bed reducer, which could result in a need to inject pure oxygen to polish the CO
2-rich stream. The CO
2 gas stream from the bed reducer is mixed with the CO
2 from the two separation steps, and the formed stream is conditioned for transport and storage, as shown in
Figure 3.
3.4. Partial Oxidation and Combustion of Reducing Gas
As noted in
Section 2.3, partial oxidation of the hydrocarbons in the reducing gas is carried out prior to mixing with the recycled top-gas and the hydrogen produced from electrolysis (represented by the solid red O
2 arrow meeting the cold gas arrow in
Figure 3). Considering the relatively low concentrations of hydrocarbons in the reducing gas and that a temperature of about 1400 °C is required for non-catalyzed POX, large proportions of the H
2 and CO are combusted, thereby producing H
2O and CO
2, and this decreases the reduction potential. This issue can be partly resolved by preheating the reducing gas using heat integration. The reducing gas, which is free of hydrocarbons, is then mixed with the recirculated top-gas and the hydrogen produced from electrolysis, with both of those streams being preheated by heat integration. If the temperature of the resulting stream is <1000 °C, a small amount of oxygen is added to bring the temperature up to 1000 °C, as indicated by the dashed red arrow in
Figure 3.
3.5. Electrolysis
The pure oxygen required to raise the temperature of the reducing gas and for its partial oxidation is produced through the electrolysis of water. The choice of electrolysis rather than the less-energy-intensive ASU is based on two considerations: (1) the added hydrogen is fed to the DR reactor along with the reducing gas to increase the yield of reduced iron, as indicated by the dashed blue arrow going from the electrolyzer to the reducing gas in
Figure 3, and (2) the reduction of the oxygen-carrying bed material in the DFB loop prior to the gasifier may require more reducing gas than may be available after the DR reactor. Note, however, that the choice between electrolysis and ASU for the production of oxygen is ultimately made based on economics, i.e., the price of electricity and the investment costs of the units. It is also possible to have in place both an ASU and an electrolysis plant and operate the latter when electricity prices are low or to over-dimension the electrolysis plant and operate it only during low-electricity-price periods and store the generated hydrogen and oxygen.
4. Methods
4.1. Main Assumptions Related to the Mass and Energy Balances of the DFB-DR Route
4.1.1. DFB Loop
The raw gas produced by the gasifier is given a composition that is based on the results of experiments carried out with active olivine in the Chalmers gasifier, as described previously [
20]. The reason for this choice is that no experiments have been conducted in the Chalmers gasifier with an iron-rich bed that was reduced before entering the gasifier. Nonetheless, such a bed material would be expected to have a very high catalytic activity, due to its concentrations of iron and calcium. Consequently, it is assumed that its activity would be similar to that of the most active olivine case tested in the Chalmers gasifier.
The heat of oxidation of the bed material was based on the Fe
2O
3/Fe
3O
4 couple, corresponding to −476 kJ/mol O
2. This choice may seem to contradict the results of Hildor et al. [
26], who studied the oxygen-carrying behavior of BF–BOF slag and found that the couple involved in oxygen transport was Fe
3O
4/FeO, corresponding to a heat of oxidation of −627 kJ/mol O
2. However, they also reported that the Fe
3O
4 and FeO phases included dopants such as Mg and Mn. The presence of these dopants likely alters the heat of oxidation of the material. Given that the heat of oxidation of the slag considered for bed material in the present work is not known, and considering that a heat of oxidation of −627 kJ/mol O
2 is relatively high compared with the heat of oxidations of typical oxygen carriers considered for chemical-looping applications [
22], the choice of using a value of −476 kJ/mol O
2 (based on the Fe
2O
3/Fe
3O
4 couple) is deemed reasonable. This value will lead to a conservative estimate of the level of oxygen transport required for autothermal operation of the process.
Based on the aforementioned experiments, a temperature of 810 °C is assumed for the gasifier. The combustor is assumed to be operated at 860 °C. The bed material entering the bed reducer is assumed to be at a temperature of 835 °C, i.e., the average of the temperatures in the gasifier and combustor. The fraction of the top-gas remaining after H2-separation that is sent to the bed reducer is assumed to be at room temperature. Despite this large temperature difference, the high thermal inertia of the circulating bed ensures that the temperature of the bed does not drop below the temperature assumed for the gasifier.
The degree of gasification of the char in the gasifier is set at 20%. The degree of gasification is a function of the combined influences of several factors, mainly the temperature but also the bed catalytic activity and the circulation rate of the bed. The 20% value is meant to reflect that the low temperature will not be conducive to a high gasification rate but that some degree of gasification is to be expected, in particular due to catalytic effects.
In addition to these assumptions, other minor assumptions are made that have an influence on the performance of the DFB loop. In the gasifier, a steam-to-fuel ratio of 0.80 kg steam/kg (on a dry, ash-free basis) fuel is assumed. This value includes the moisture of the fuel recovered from the dryer, which is assumed to dry the fuel completely, using heat from the raw gas and flue gases. The heat from the raw gas and flue gas is also used to preheat the air and steam fed to the combustor and gasifier, respectively, to a temperature of 350 °C, which was the preheating level in the GoBiGas plant. The combustor is assumed to operate with an excess oxygen ratio of 1.2 (mol O2/mol stoichiometric O2 demand). Finally, the mixture of tar and spent RME burnt in the combustor is assumed to enter at room temperature, meaning that this stream is not preheated, since the low volume flow does not justify the installation of a heat exchanger. It is important to recall that the RME is only used as a model of a generic scrubbing agent for the mass and energy balances. The consumption of the scrubbing agent is based on the RME consumption of the GoBiGas plant, corresponding to 0.03 MW/MW fuel. It should be noted that this means that the scrubbing agent flow is not proportional to the amount of tar.
4.1.2. Gas-Handling Section
The separation of CO2 from the hydrocarbon-rich gas is assumed to be achieved by MEA scrubbing, with a specific energy consumption of 3.5 MJ/kg CO2, i.e., the lower limit of the aforementioned 3.5–4.0 MJ/kg CO2 range, based on the assumption that the energy consumption of MEA scrubbing from flue gas will, in the future, be decreased such that 3.5 MJ/kg CO2 will be a conservative value. The temperature of the scrubbing column is assumed to be 40 °C and that of the reboiling column is assumed to be 120 °C. The separation efficiency of CO2 is assumed to be 95% and the purity of the CO2 stream is assumed to be 100%.
The gas-handling section receives all the useful heat from the DFB section, i.e., from the raw gas and flue gas, as well as the heat from the top-gas. The heat balance of the process shows that these heat sources are sufficient to cover the heat demand for CO2 separation and the preheating demand of the reducing gas prior to its partial oxidation, the recirculated top-gas and the hydrogen from electrolysis, and the carburizing gas. The preheating temperature of these three streams is assumed to be 600 °C. The reducing gas and top-gas are preheated from 40 °C, which is the assumed temperature of the MEA scrubber, and the hydrogen from electrolysis is preheated from 70 °C. A proper heat integration study would account for the temperature level of the heat sources and the heat demands. However, such an exercise was deemed to be outside the scope of the present study. Nonetheless, the heat demand for CO2 separation dominates the heat demand in the gas-handling section, and this demand is at a low temperature level, which suggests that heat integration will be feasible.
4.1.3. DR Reactor
The DR reactor is modeled as a black box that consists of two zones. At the bottom of the reactor is the carburization zone, where the carburizing gas is introduced at 600 °C, which is also the temperature that is assumed for the DRI extracted from the furnace. The carburizing gas reacts with Fe to form Fe3C and is then extracted before the second zone. A carbon content of 2%wt is assumed to be achieved, and, for the sake of simplification, all the carbon is assumed to be in the form of Fe3C, meaning that no free carbon is formed. The conversion of hydrocarbons via R1 is arbitrarily set to 50%, and the rest of the carbon comes from R2 and R3, with half of the CO assumed to react via R2 and the other half via R3. The recycling rate of the hydrocarbons is arbitrarily set to 50%. This recycling rate is chosen because it results in a carburization gas with an RP of 8. This ensures that accumulation of H2O and CO2 is limited and that the carburizing gas will not re-oxidize the reduced iron. These arbitrary values were verified, by a sensitivity analysis, to have negligible impacts on the results of the work.
Located above the carburization region is the reduction zone, wherein iron ore, assumed introduced as pellets, is reduced to Fe. A metallization degree of 92% is assumed, meaning that 8% of the iron in the DRI is in the form of FeO. The reducing gas is assumed to be introduced at a temperature of 1000 °C and exits as the top-gas at 350 °C. Iron ore is introduced at the top of the furnace at room temperature. The reduction reactions are assumed to occur with H
2 and CO in proportion to their relative concentrations in the gas. No re-oxidation with H
2O or CO
2 is assumed, and no slippage of hydrocarbons from the carburization zone is considered. The composition of the top-gas is modified to account for the water–gas shift (WGS) reaction, the exothermic nature of which is also accounted for in the DR reactor heat balance. Rather than setting it to equilibrium, it is assumed that the WGS reaction will reach a quotient of reaction equal to 2.5, which corresponds to the average of the values recorded in the top-gases of the Gilmore and Contrecoeur NG-DR plants [
31]. The heat losses from the DR reactor walls to the surrounding are assumed to be equal to 2.5% of the energy content of the iron, expressed here as the heat of oxidation of Fe to Fe
2O
3.
4.1.4. Electrolyzer
The electrolyzer is assumed to provide the oxygen required for the partial oxidation of the reducing gas and to raise its temperature prior to introduction into the DR reactor. The electrolysis efficiency is assumed to be 75%, based on typical values for state-of-the-art electrolyzers [
38]. The operating pressure and temperature are assumed to be atmospheric and 70 °C, respectively.
4.1.5. Electric Arc Furnace
The EAF and downstream steel-processing steps are not included in the mass and energy balances in this work. However, the EAF unit is included in the calculation of the total production cost of liquid steel (LS). It is assumed that the EAF is entirely charged with DRI, i.e., no scrap is fed into it. The choice to not include scrap in the charge to the EAF is motivated by the desire to have a direct relationship between the amount of steel produced and the consumption of biomass and electricity in the DFB-DR process. The electric energy consumption of the EAF is thus about 570 kWh/t steel, based on the value used by Kirschen et al. [
16]. As the DRI is hot-charged to the EAF, the energy consumption is decreased. It is assumed that the electricity demand is reduced by 120 kWh/t steel when the DRI is charged at 600 °C, in line with the experience reported for the hot-charging of DRI [
14]. The steel produced is assumed to have a carbon content of 0.2%wt. For the sake of simplicity, all the iron introduced with the ore is assumed to end up in the LS. This means that losses in the form of fines and, more importantly, in the slag, are neglected. Note that the oxygen input to the EAF is not included in the oxygen demand of the process.
4.2. NG-DR and H2-DR Comparison Cases
4.2.1. NG-DR
The NG-DR case is built upon data obtained from existing and decommissioned MIDREX plants, in particular the Contrecoeur plant in Montreal, Quebec, Canada, and the Gilmore plant in Portland, Oregon, USA, using the data from Béchara et al. [
31], as well as the data from the SIDERCA plant in Campana, Buenos Aires, Argentina [
32].
Table 1 shows the compositions of the reducing gas and top gas in these plants. The natural gas consumption of the NG-DR case is based on that of the Contrecoeur plant, corresponding to 2.6 MWh/t iron. This is the amount of natural gas consumed in the reformer, as well as a small fraction (about 7%) that is combusted with air to raise the temperature of the reducing gas after the reformer. Here, it is assumed that the heat demand of the reformer is entirely covered by the top-gas, about one-third of which is combusted, with two-thirds being recycled to the reformer, based on the Gilmore data. Only the reducing zone section of the DR reactor is considered, as information on the level of natural gas consumption in the carburization zone and the recycling rate of the carburizing gas could not be found.
4.2.2. H2-DR Case
The H
2-DR case (
Figure 2) is built upon simple considerations of the mass and energy balances. The assumptions made for the temperature and efficiency of the electrolyzer are the same as those for the DFB-DR case (see
Section 4.1.4). It is assumed that the reducing gas, which consists of the H
2 produced from electrolysis and the top-gas and which is entirely recycled, can be preheated to 350 °C, which is the temperature assumed for the top-gas. About 10% of the hydrogen in the reducing gas must be burnt subsequently to raise the temperature to 1000 °C, using pure oxygen, which is a by-product of the electrolysis.
Table 2 shows the compositions and reduction potentials of the reducing gas and top-gas for the H
2-DR case. As the reducing gas has an RP comparable to that of the Gilmore MIDREX plant, it can be deemed sufficient for extensive reduction of the iron ore. The composition of the top-gas is determined so as to achieve an RP of 3. This RP value is established based on the heat balance of the reduction zone of the DR reactor, where the DRI is assumed to exit the reactor at 600 °C. The higher RP value compared with the NG-DR case reflects the fact that reduction of Fe
2O
3 with H
2 is endothermic, whereas with CO, it is exothermic. Thus, a lower H
2/CO ratio of the reducing gas decreases the endothermicity of the reduction reaction, thereby increasing the DRI yield per unit energy of reducing gas input. The level of H
2 consumption of the process is estimated to be 2.8 MWh H
2/t iron, corresponding to 84 kg H
2/t iron.
4.3. Performance Indicators
The performances of the various routes for the production of DRI are compared in this work. The energetic performance of the system can be assessed in a multitude of ways. The approach chosen in this work is to establish energy efficiency performance indicators based on chemical and electrical energy terms, which means that sensible and latent heat terms are excluded from the definitions. The rationale for this choice is that the sensible and latent heat terms will depend on specific temperature levels and heat integration possibilities for the system, whereas relying solely on chemical energy terms reflects the higher-level design choices for the system, i.e., which reactors and separation steps are chosen rather than the specific details of their operation. The chemical energy terms are defined as the lower heating value for combustible streams and as the heat of oxidation for the reduced iron. The efficiency performance indicators are defined in
Table 3, and the subscripts used to describe the energy terms in these definitions are explained in
Table 4.
Before defining and comparing the efficiencies of DRI production for the various routes, the efficiency of the gasifier of the DFB-DR case is determined to compare it with the efficiency of the GoBiGas gasifier [
39]. Two main efficiencies can be defined. The first, shown in Equation (1), is the raw gas efficiency
εrg, which corresponds to the energy content of the biomass that was converted to the hot raw gas, i.e., including tar. The second efficiency performance indicator is the cold gas efficiency. It corresponds to the ratio of the energy content of the tar-free cold gas to the energy content of the biomass, as shown in Equation (2). One additional efficiency performance indicator of interest, shown in Equation (3), is the gasification section efficiency. It corresponds to the ratio of the energy content of the two outputs from this section, i.e., the raw gas and the char, to the (chemical) energy content of all the inputs to that section, i.e., the biomass fuel, the hydrogen-rich gas to the bed reducer, and the mixture of tar and scrubbing agent from the tar separation step. It cannot be directly compared with the gasification section efficiency of the GoBiGas plant, as the DFB configuration is different, in that the GoBiGas reactor does not have a bed reducer that is fed with reducing gas and does not use an oxygen-carrying bed material.
The overall DRI production efficiency can be defined for each of the three routes, NG-DR, H2-DR, and DFB-DR, as the ratio of the energy content of the reduced iron to the energy content of the inputs to the DR plant. The energy content of the iron is defined as the heat of oxidation of FeOx to Fe2O3, where FeOx is the average composition of the reduced iron. In this work, it is assumed that a metallization degree of 92% is reached in all the cases, such that the energy content of the iron is 391 kJ/mol or 1.9 MWh/t. The overall efficiency of the NG-DR route is simply the ratio of the energy content of iron to that of the natural gas input. Some DR plants use an ASU to provide pure oxygen for raising the temperature of the reducing gas. The associated electrical energy demand is not accounted for in the overall efficiency, and other electrical demands, for instance for fans, are neglected. For the H2-DR route, the overall efficiency of the DRI production is the ratio of the energy content of iron to the electricity input to the electrolyzer, where once again other electrical demands are neglected.
For the DFB-DR route, the energy inputs are the biomass, the scrubbing agent (if any), and the electricity provided to the electrolyzer. Note that the energy content of the MEA scrubbing agent used for the CO2 separation is not included. Since the extracted char and BTX do not represent losses, their energy contents are removed from the energy inputs. Similarly, as the DFB-DR route defined here includes energy inputs that will become carbon-bound as Fe3C, the energy content of that carbon is subtracted from the denominator of εDFB,1. Two modified versions of this efficiency are additionally defined. The first, εDFB,2, accounts for the fact that an advantage of the DFB gasification process is that wet fuels can be used, whereby heat from the DFB flue gas or raw gas provides heat for drying the fuel, with the generated steam being used in the process. As such, the efficiency εDFB,1 can be recalculated using the energy content of the biomass on a wet basis. The second modified efficiency, εDFB,3, accounts for the fact that part of the energy input is converted to heat that is then used to cover the heat demand of the MEA reboiling column, translating into the production of CO2 for sequestration, representing a valuable product of the DFB-DR route. If this heat is not used for CO2 separation, it can be used to optimize the process, notably via preheating, and thereby increase the efficiency. To account for this, εDFB,2 is modified to incorporate this valuable heat, which covers the MEA reboiler heat demand and should not be considered a loss, in the form of in εDFB,3.
4.4. Assumptions Made for the Economic Calculations
This section describes the assumptions that are made during the derivation of the economics of the three routes. In this work, the DR routes are initially compared on the basis of the reducing gas cost. The DR furnace is a highly flexible reactor that can accommodate a wide range of compositions of the reducing gas. Therefore, comparing the costs of the reducing gas, in EUR/MWh, is a way to compare the economic feasibility levels of the DR routes. The total production costs of the LS, expressed in EUR/t LS, are also compared for the three routes, as well as for the traditional BF–BOF route, as they reflect the actual costs for the steel produced using these technologies. For the H2-DR and NG-DR routes, the cost related to the production of reducing gas is calculated based only on the electrolyzer and the reformer, respectively, since other costs are assumed to be negligible in comparison. The capital expenditures (CAPEX) and operational expenditures (OPEX) for the electrolyzer are set to be the same (per unit energy) for both the H2-DR and DFB-DR routes.
4.4.1. Investment Cost
This section describes the capital expenditures related to the compared DR routes. The EAF is included in the calculation of the total production cost of LS only, although the downstream steel processing units are not included. The CAPEX is given as the total investment cost in millions of euros (MEUR), as a cost that is relative to the yearly LS production capacity, and as an annualized cost, based on a weighted average cost of capital (WACC) of 5%, a lifetime of 20 years for all the items of equipment, and a plant that operates at 8000 full-load hours in a year. All costs are calculated in EUR for Year 2020.
DFB Loop and Gas-Handling Section
The investment costs of the DFB loop and the gas-handling section are derived from the economic assessment of an advanced biofuel production (ABP) plant by Thunman et al., which was based on the economic data from the GoBiGas project [
35]. In the present study, the plant is scaled to fit the needs of a 1 Mt/year steel plant based on the DRI-EAF route. The upscaling of the cost data for the GoBiGas plant, which had a biomass input of 32 MW, is performed using the scaling factors provided in the work of Thunman et al. [
35]. Some differences in design exist between the ABP plant and the DFB loop and the gas-handling section of the present study.
The first main design difference is in the DFB loop itself, which in the present study includes a bed reducer that is absent from the ABP plant design. The proposed bed reducer will be a fluidized section that is relatively small compared with the gasifier and combustor. The main cost associated with these process units is the cost of the refractory. Even though the proposed bed reducer will have a higher surface-to-volume ratio than the gasifier or combustor, entailing a greater need for refractory proportional to its size, it is likely to be small enough that the cost of the DFB loop will not increase significantly.
A second major difference in design corresponds to the synthesis section of the ABP plant, which is not present in the proposed process. The avoided costs are related to the compression of the cold gas from gasification, and the olefin hydrogenation, pre-methanation, and methanation steps in the ABP plant design. For a 100-MW biomass input ABP plant, the total cost related to these units can be roughly estimated using a Lang Factor, which relates the total investment cost of a unit to its delivered cost, and the Lang Factor value of which is around 5 for fluid processes [
40]. To be conservative and not overestimate the cost reduction linked to the absence of these units, a Lang factor of 4 is used. The avoided costs correspond to 33% of the total cost of the ABP plant for the 100-MW case. It is assumed that the same decrease in cost would be obtained at larger scales.
The proposed process will have a CO2 separation system that is comparable to that of the ABP plant, with two MEA scrubbing columns sharing a single MEA reboiling column. However, it will also have a CO2 liquefaction unit. The cost of the CO2 liquefaction unit will be made up mostly of the cost of compressors. It is assumed that the added cost of the CO2 liquefaction unit, relative to the ABP plant, will be low compared with the avoided cost of the synthesis section. Additionally, the gas-handling section of the present study will likely require a much higher level of heat integration than the ABP plant, due in part to the necessity to preheat the gases introduced into the DR reactor. Although this cost can be substantial, it will likely be low in comparison with that of the synthesis section.
Based on these considerations, the overall cost of the DFB loop and the gas-handling section of the DFB-DR route will be determined based on the cost of the ABP plant, reduced by a factor of 20–30%. This range is conservative, as it likely underestimates the savings related to the avoided synthesis section. It is also important to consider that, as with any economic estimate, this figure is small in comparison with other cost variations that exist between projects. Note that in the economic assessment of the ABP plant, a steam cycle and a belt dryer, which were not present in the GoBiGas design, are added. These two units are also included in the proposed system. The corresponding costs for a 100 MW substitute natural gas plant are given. The scale factors are arbitrarily assumed to be 0.60, 0.70, and 0.80, for the low, medium, and high scale factors, respectively, based on the scale factor of 0.67 given in
Table 4 of [
35]
DRI-EAF
The CAPEX values for the DRI-EAF sections in the three DR routes are derived from [
41], attributing a value of 370 EUR/t crude steel for the DR furnace, EAF, and auxiliary units (but not including the price for the indurated pellets production plant). For the DFB-DR and H
2-DR routes, the reducing gas produced has a higher H
2/CO ratio (infinite for the H
2-DR case) than it has for the NG-DR route, on which the CAPEX for the DRI is typically based. As a higher H
2/CO ratio means a more endothermic reduction reaction, the volume of gas needed to produce one tonne of DRI will be higher the higher the H
2/CO ratio. Therefore, to produce the same amount of DRI, the DFB-DR, and especially the H
2-DR, will require a larger DR reactor. This, in turn, means that the specific cost of the DR reactor may slightly underestimate the cost of the reactor, as compared with the NG-DR case. Nonetheless, this discrepancy is not expected to have a significant impact on the total CAPEX and an even weaker impact on the total production cost of the steel, since at a large scale the OPEX and fuel cost are much higher than the annualized CAPEX.
Electrolyzer
The investment cost of the electrolyzer is based on Brynof et al. [
38]. The cost estimation is based on the alkaline electrolyzer, which is by far the most mature technology. The corresponding investment cost is predicted to reach 700 EUR
2015/kW
elec in the near future (2030), according to the IEA [
42].
BF–BOF Route
The total production costs of liquid steel of the three DR routes are compared with the production cost of the traditional BF–BOF route. While brownfield investments are considered for the DR routes, the abundance of BF–BOF plants and the fact that it is the dominant technology mean that the DR routes must compete with BF–BOF plants that are only relined. The investment cost of relining a BF–BOF plant is set at 190 EUR/t annual production, derived from Wörtler et al. [
43].
4.4.2. Operating Expenditures
In this section, the “fixed” operational expenditures, i.e., those that are assumed to remain constant from year to year, are described. Note that the prices for biomass and electricity are not included, whereas those for iron ore pellets and natural gas are included. The price of the iron ore pellets will affect all the DR routes equally. The price of natural gas fluctuates significantly over time, so a reasonable average price level for Sweden has been used.
DFB Loop and Gas-Handling Section
The operational costs for the DFB loop and the gas-handling section are also taken from the economic analysis of Thunman et al. [
35]. To calculate the OPEX, reference values from the GoBiGas 32-MW biomass plant are used, along with the scaling factors provided, using the scaling law described in Equation (9), where
X is the biomass input (in MW) of the upscaled plant and
SF is the scaling factor. As the levels of consumables and waste products are directly proportional to the biomass input to the plant, their cost in EUR/MWh is not influenced by scale, so they do not follow the scaling law. The electricity-related cost is not considered, as it is assumed that the steam cycle will cover the electricity demand of the DFB loop and the gas-handling section, which does not include the electricity demand from the electrolyzer. Note that even though RME is used in the mass and heat balance calculations, its cost is not included in the economic calculation, since RME has a high price and would not be used as the scrubbing agent in a commercial unit. Instead, a cheaper scrubbing agent (possibly one distilled from its own tar) or other tar removal methods would be used, as described earlier.
Table 5 details the various operating costs, which are given in EUR per MWh biomass input. The cost of the “Other” subcategory in the “Consumable and waste products” category in
Table 5 is arbitrarily fixed at 1.5 EUR/MWh instead of the value of 4.5 EUR/MWh from the ABP plant, since the latter value is dominated by the price of methanation and WGS catalysts, which do not exist in the present process.
DRI-EAF
The price of iron pellets was derived from Pardo and Moya, who used a price of 133 EUR/t for Year 2010 and estimated the growth rate of the price until Year 2030 at 1.20% [
44]. The price of the flux is set at 27 EUR
2010/t, following the estimation of Fischedick et al. [
45], who relied upon the data from Pardo and Moya [
44]. Here again, an annual growth rate of 1.20% was used for the flux price. The consumption of flux in the DRI-EAF process was set to 58 kg/t steel, based on previous data on lime consumption [
46]. The amount and price of alloy were set to 11 kg/t steel and 1777 EUR/t, respectively, as selected by Vogl et al. [
47], based on the data from Remus et al. [
48] and Fischedick et al. [
45]. The cost of replacing the graphite electrodes in the EAF is based on the assumptions reported by Vogl et al. [
47], i.e., a consumption rate of 2 kg/t steel and a price of 4 EUR/kg. Finally, operation and maintenance costs equal to 3% of the CAPEX and labor costs of 38 EUR
2010/t are derived from Fischedick et al. [
45].
The cost of the various items described in the previous paragraph are adjusted from Year 2010 to Year 2020 using an average inflation rate of 1.3%. The calculation of the individual cost items is shown in Equation (10):
where
j refers to a cost item,
a refers to the growth rate, which is fixed at 1.2% based on Pardo and Moya [
44], and
i refers to the average inflation rate.
Electrolyzer
The “fixed” operational costs related to the electrolyzer and its operation are set to 3.5% of the CAPEX, based on the data of Brynolf et al. [
38]. The stack replacement costs, which typically make up 50% of the CAPEX, are not included in the economic calculation.
BF–BOF Route
For the BF–BOF route, the consumption rates of coking coal and natural gas in the plants are derived from Cavaliere [
46] at 400 kg/t LS and 1.4 MWh/t LS, respectively. The price for the coking coal is derived from data from the IEA for the period 2016–2020, with prices ranging 75 to 310 USD/t [
51]. The iron feedstock to the BF is assumed to be sinter fines, whose price in Sweden ranged 40 to 200 USD/t during the period 2010–2020, according to the SGU—Geological Survey of Sweden [
52]. In the results shown in
Section 5.5, only the production cost based on the median values of the ranges given for coal and sinter fines, corresponding to 170 EUR/t and 105 EUR/t, respectively, is shown. For simplicity, the operation and maintenance costs and labor costs are set as equal to those of the NG-DR route, and the costs of flux and alloys are derived using the same cost data as described above, with consumption rates taken from Cavaliere [
46]. Although there are certainly differences in operation and maintenance and labor costs between the two routes, these differences are dwarfed by the price fluctuations of the fuel and feedstock. The approach of using a median cost estimation for the production cost of the BF–BOF route is deemed reasonable, as the other routes will also be impacted by volatility in the prices of their fuel (energy sources and reducing agents) and feedstocks.
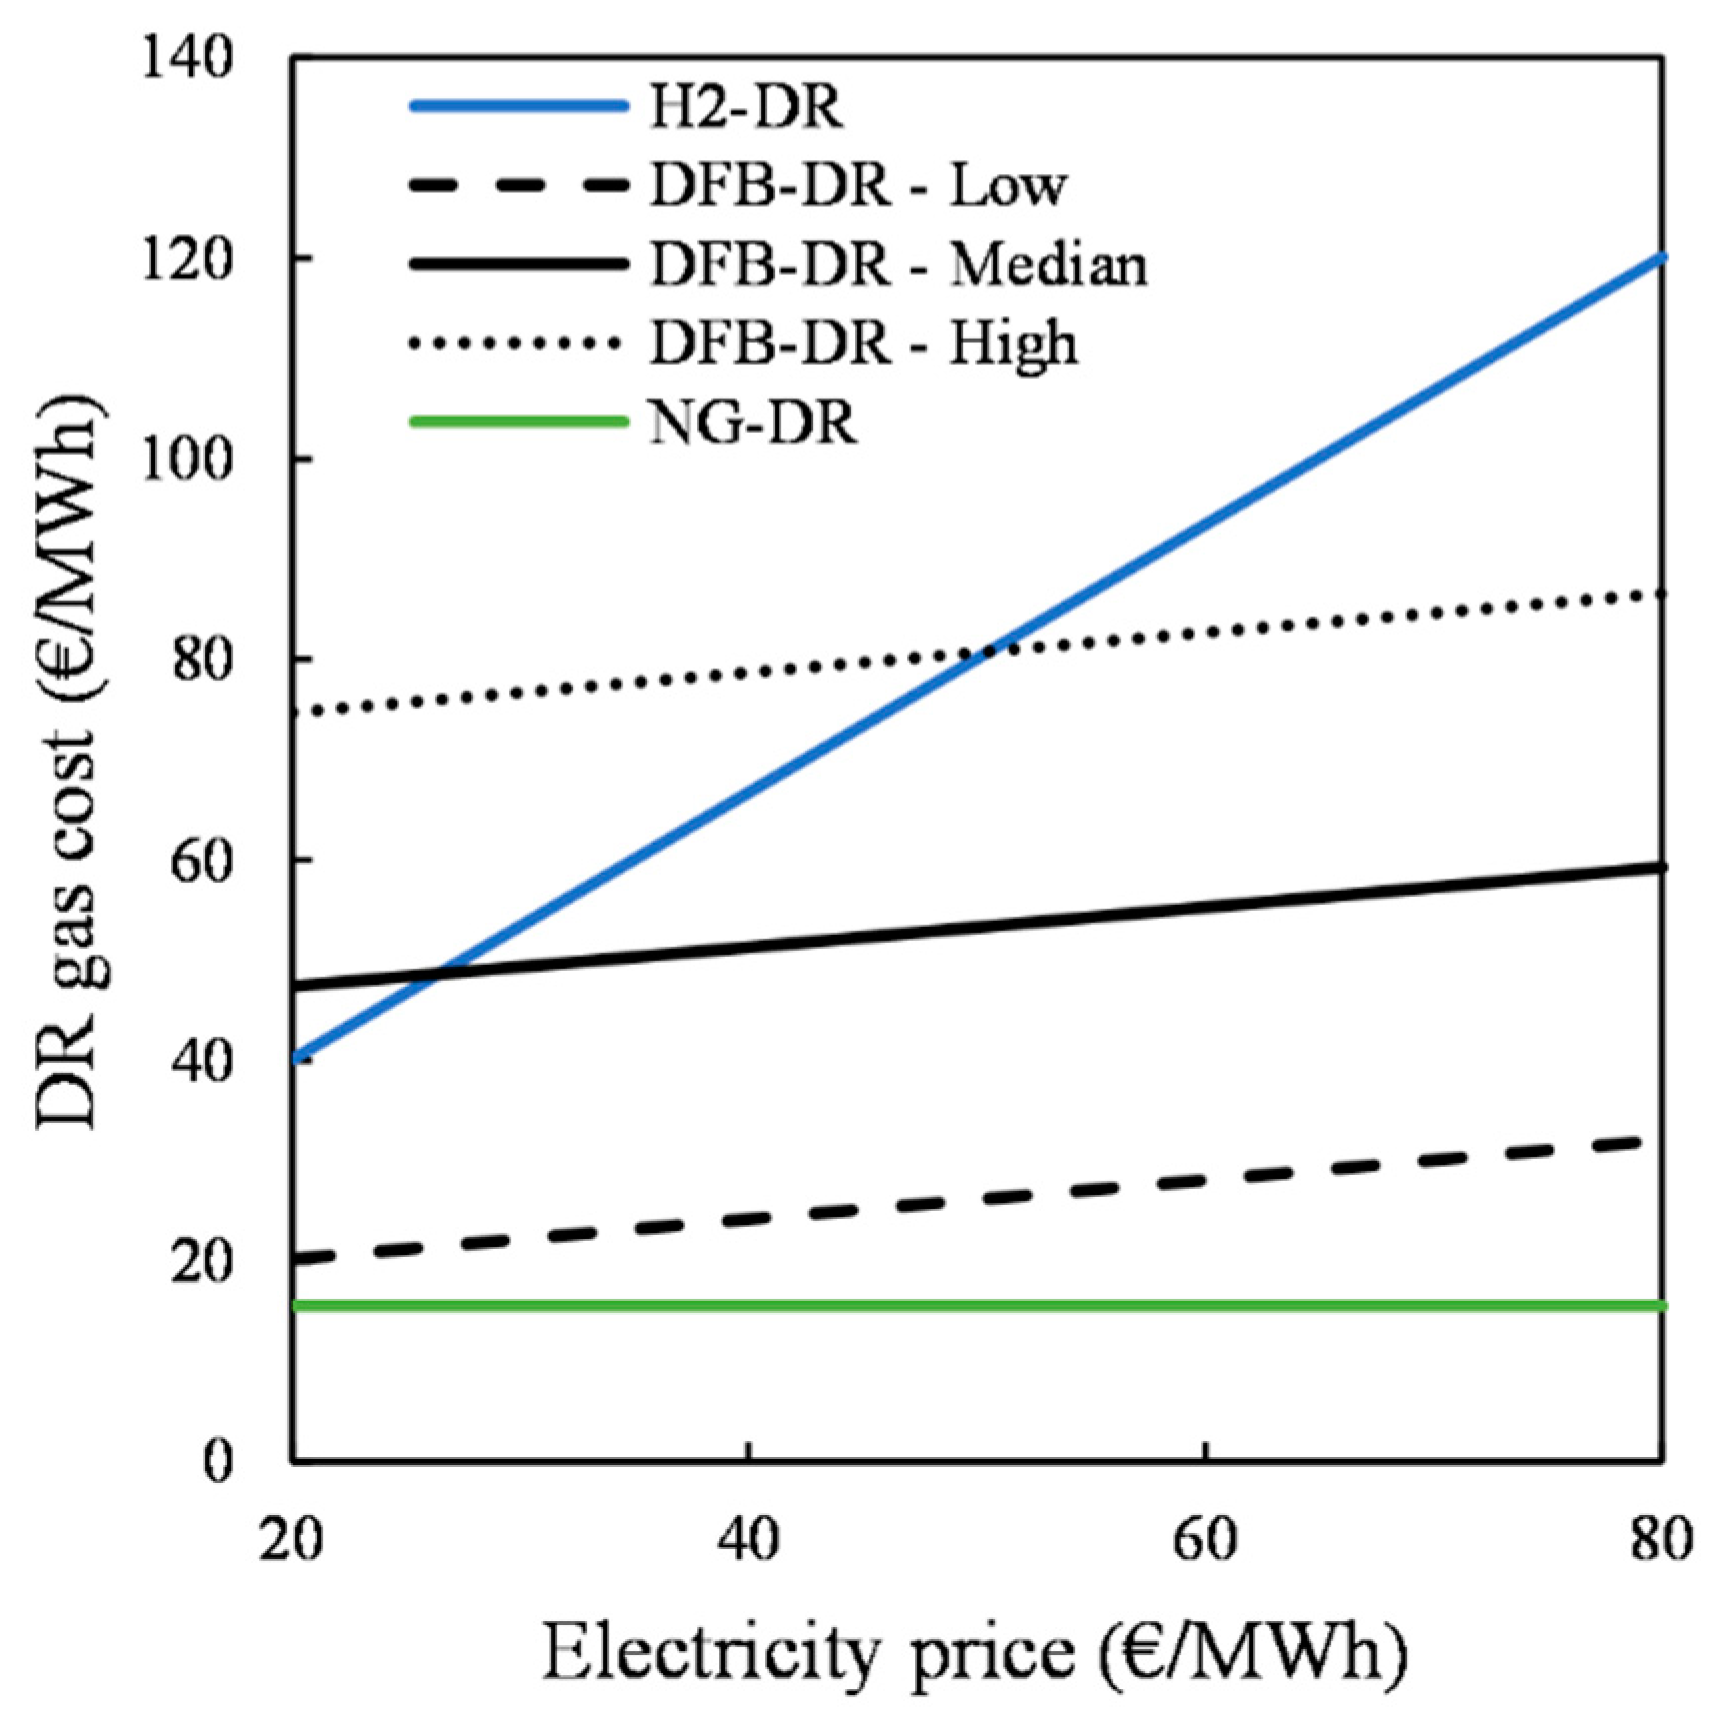
4.4.3. Cost for the Reducing Gas
Given the flexibility of the DR reactor, the main difference between the three DR routes lies in how the reducing gas is produced. Therefore, the easiest way to compare their economic feasibility levels is to compare the costs for production of the reducing gas. For the NG-DR route, this is determined by the cost of the reformer and the price of the natural gas. For the H2-DR route, the value is fixed based on the cost of the electrolyzer and the electricity price. For the DFB-DR route, the reducing gas cost is based on the costs for the DFB gasification loop and gas-handling section, as well as on the prices for biomass and electricity. The cost of the reducing gas considered in the DFB-DR case comprises the cost of the cold gas plus the cost of the hydrogen produced from electrolysis.
4.4.4. Biomass and Electricity Prices, Revenue from Negative CO2 Emissions, and Total Liquid Steel Production Cost
The economic feasibilities of the DFB-DR and H
2-DR routes are assessed based on a range of electricity and biomass prices. The electricity price is varied from 20 to 60 EUR/MWh, with current values at around 40 EUR/MWh in Sweden. The biomass price will depend on the quality and moisture content of the biomass resource, which in this study is varied from 0 to 40 EUR/MWh, on an as-received basis for a moisture content of 40%. High-quality woody biomass fuel corresponds to wood pellets, with prices at around 25 EUR/MWh. A large-scale plant would, however, most likely be fueled with forest residues, with prices at around 20 EUR/MWh, or with recovered wood, the price of which varies in the range 0–10 EUR/MWh [
35].
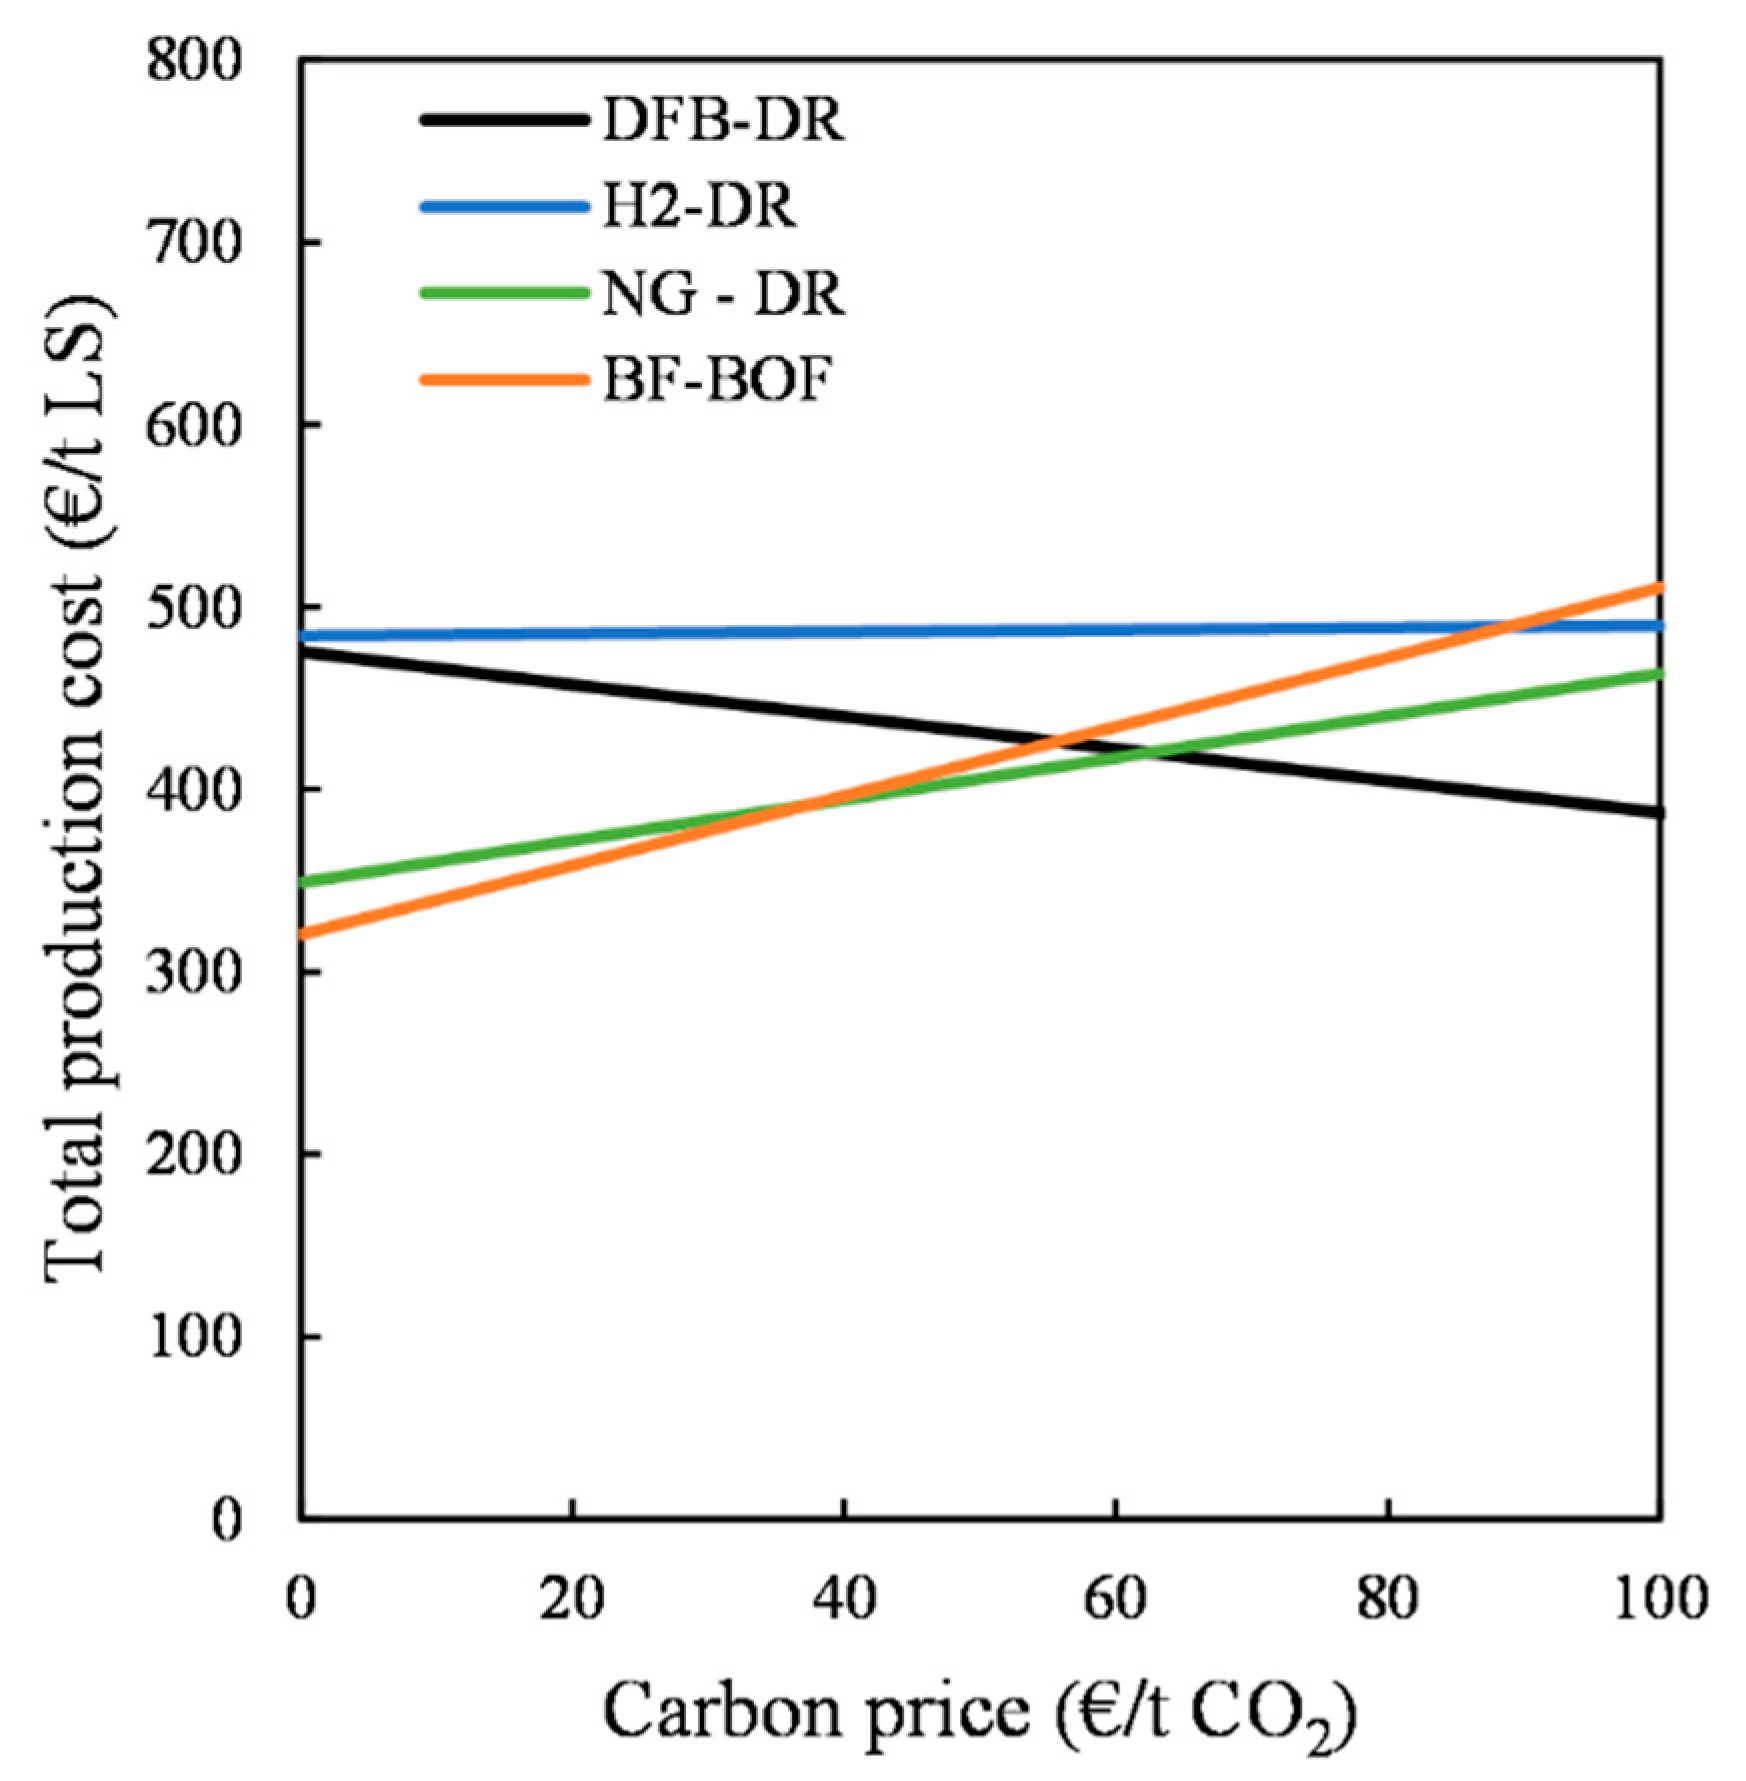
As the DFB-DR route has the potential to create significant negative CO2 emissions, the total production cost of the LS can be modified to account for the revenue of the sequestered CO2, if society places a value on removing CO2 from the atmosphere. In this work, the revenue considered for the negative CO2 ranges from 0 EUR/t CO2 to 100 EUR/t CO2. In contrast, the BF–BOF and NG-DR routes rely on fossil fuels and emit large amounts of CO2. In addition to revenue from negative emissions, the total production cost of the various routes can be compared while accounting for the penalty cost linked to emitting fossil CO2, with a carbon price that can be set as equal to the revenue from negative emissions.
The total production costs of LS for the three DR routes are then calculated using Equation (11):
The first term in Equation (11) is the cost associated with the reducing gas, where
Yred gas is the reducing gas consumption in MWh/t LS and
Cred gas is the cost of the reducing gas in EUR/MWh. The second term,
CDRI+EAF, is the total cost, in EUR/t LS, of the DR reactor and EAF, accounting for the annualized CAPEX and OPEX, as determined in
Section 4.4.1 and
Section 4.4.2, respectively. The third term is the electricity consumption of the EAF, based on an energy consumption
YEAF of 450 kWh/t LS, as given in
Section 4.1.5, and based on the variable electricity price
cel. The fourth term is the revenue associated with negative emissions, where
is the revenue in EUR/t CO
2 and
is the production rate of negative emissions in t/t LS.
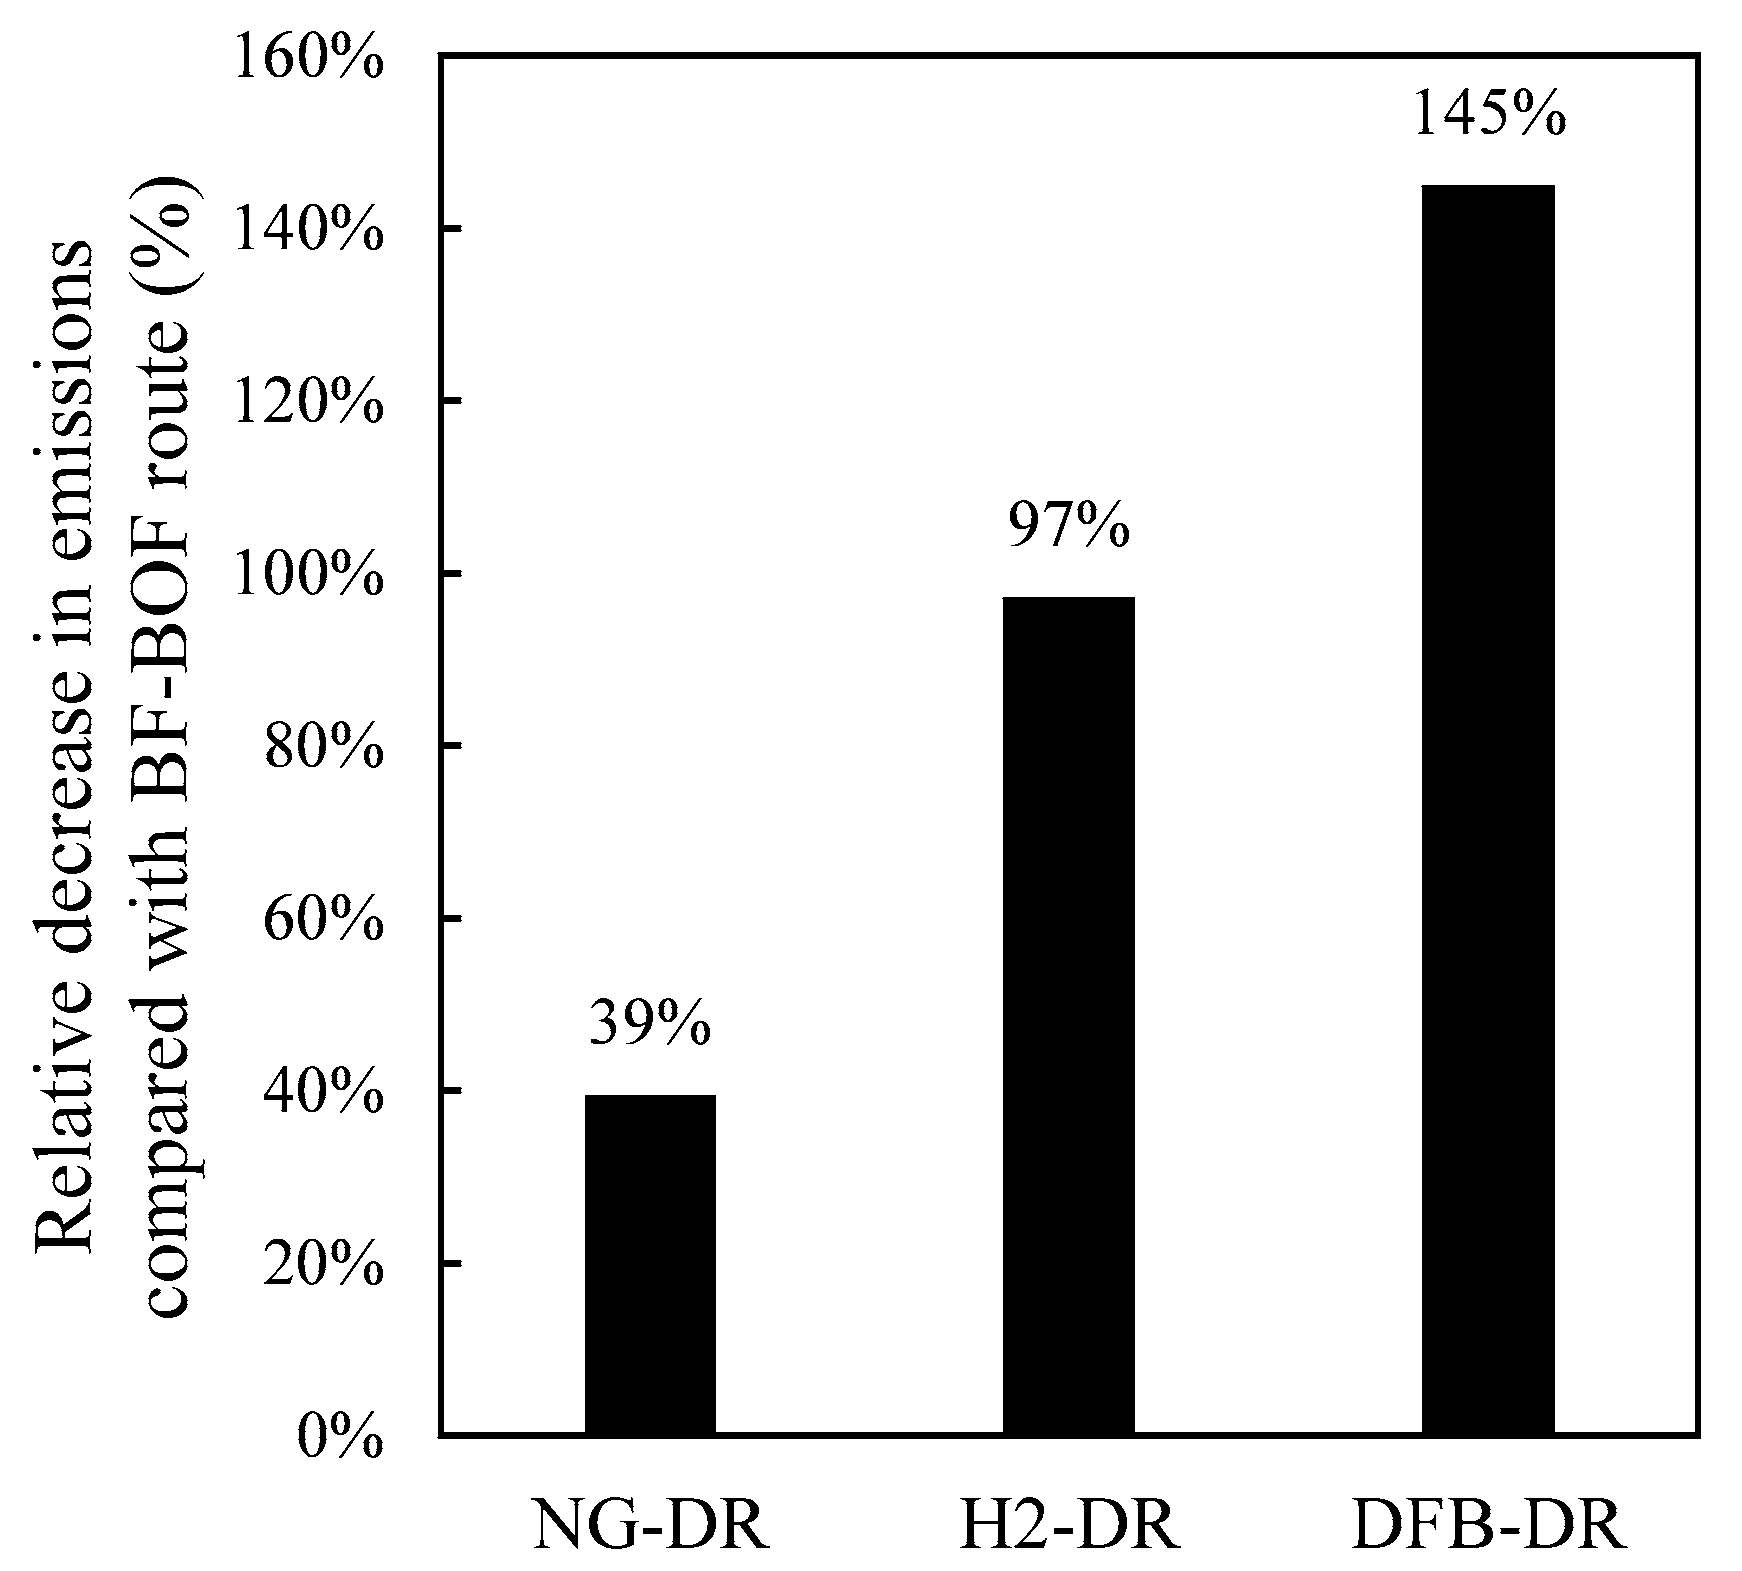
4.5. CO2 Emissions Reduction Relative to the BF–BOF Route
The three DR routes compared in this work all confer significant reductions in emissions compared with the BF–BOF route. The CO
2 emissions for the BF–BOF route are assumed to be 1900 kgCO
2/t LS, based on a range of 1600–2200 kg/t steel [
53]. The emissions for the NG-DR route are set at 1150 kgCO
2/t LS [
2]. Note that these two routes can be modified to reduce their emissions levels, even without using a biogenic or renewable reduction agent, for instance via CO
2 capture. However, the present work focuses on comparisons of the well-established instances of these technologies.
For the H2-DR route, assuming that the electricity used is generated fossil-free and that biochar is used in the EAF, the only positive CO2 emissions are related to the flux agent used in the EAF and the graphite electrodes. Assuming that this flux agent is pure limestone (CaCO3), the H2-DR route has positive emissions of 25 kgCO2/t LS. Based on a consumption of 2 kg of graphite electrodes per tonne of steel, the associated emissions amount to 7 kgCO2/t LS. On this basis, the only positive emissions from the DFB-DR also originate from limestone and graphite electrode consumption and are set at the same value of 32 kgCO2/t LS. All other emissions from the DFB-DR route, here again assuming a fossil-free electricity source, are either neutral or negative, given the biogenic origin of the fuel used. It is also assumed, for the sake of comparibility, that the pelletization plant that provides iron ore pellets to all three DR routes can be operated without positive emissions.
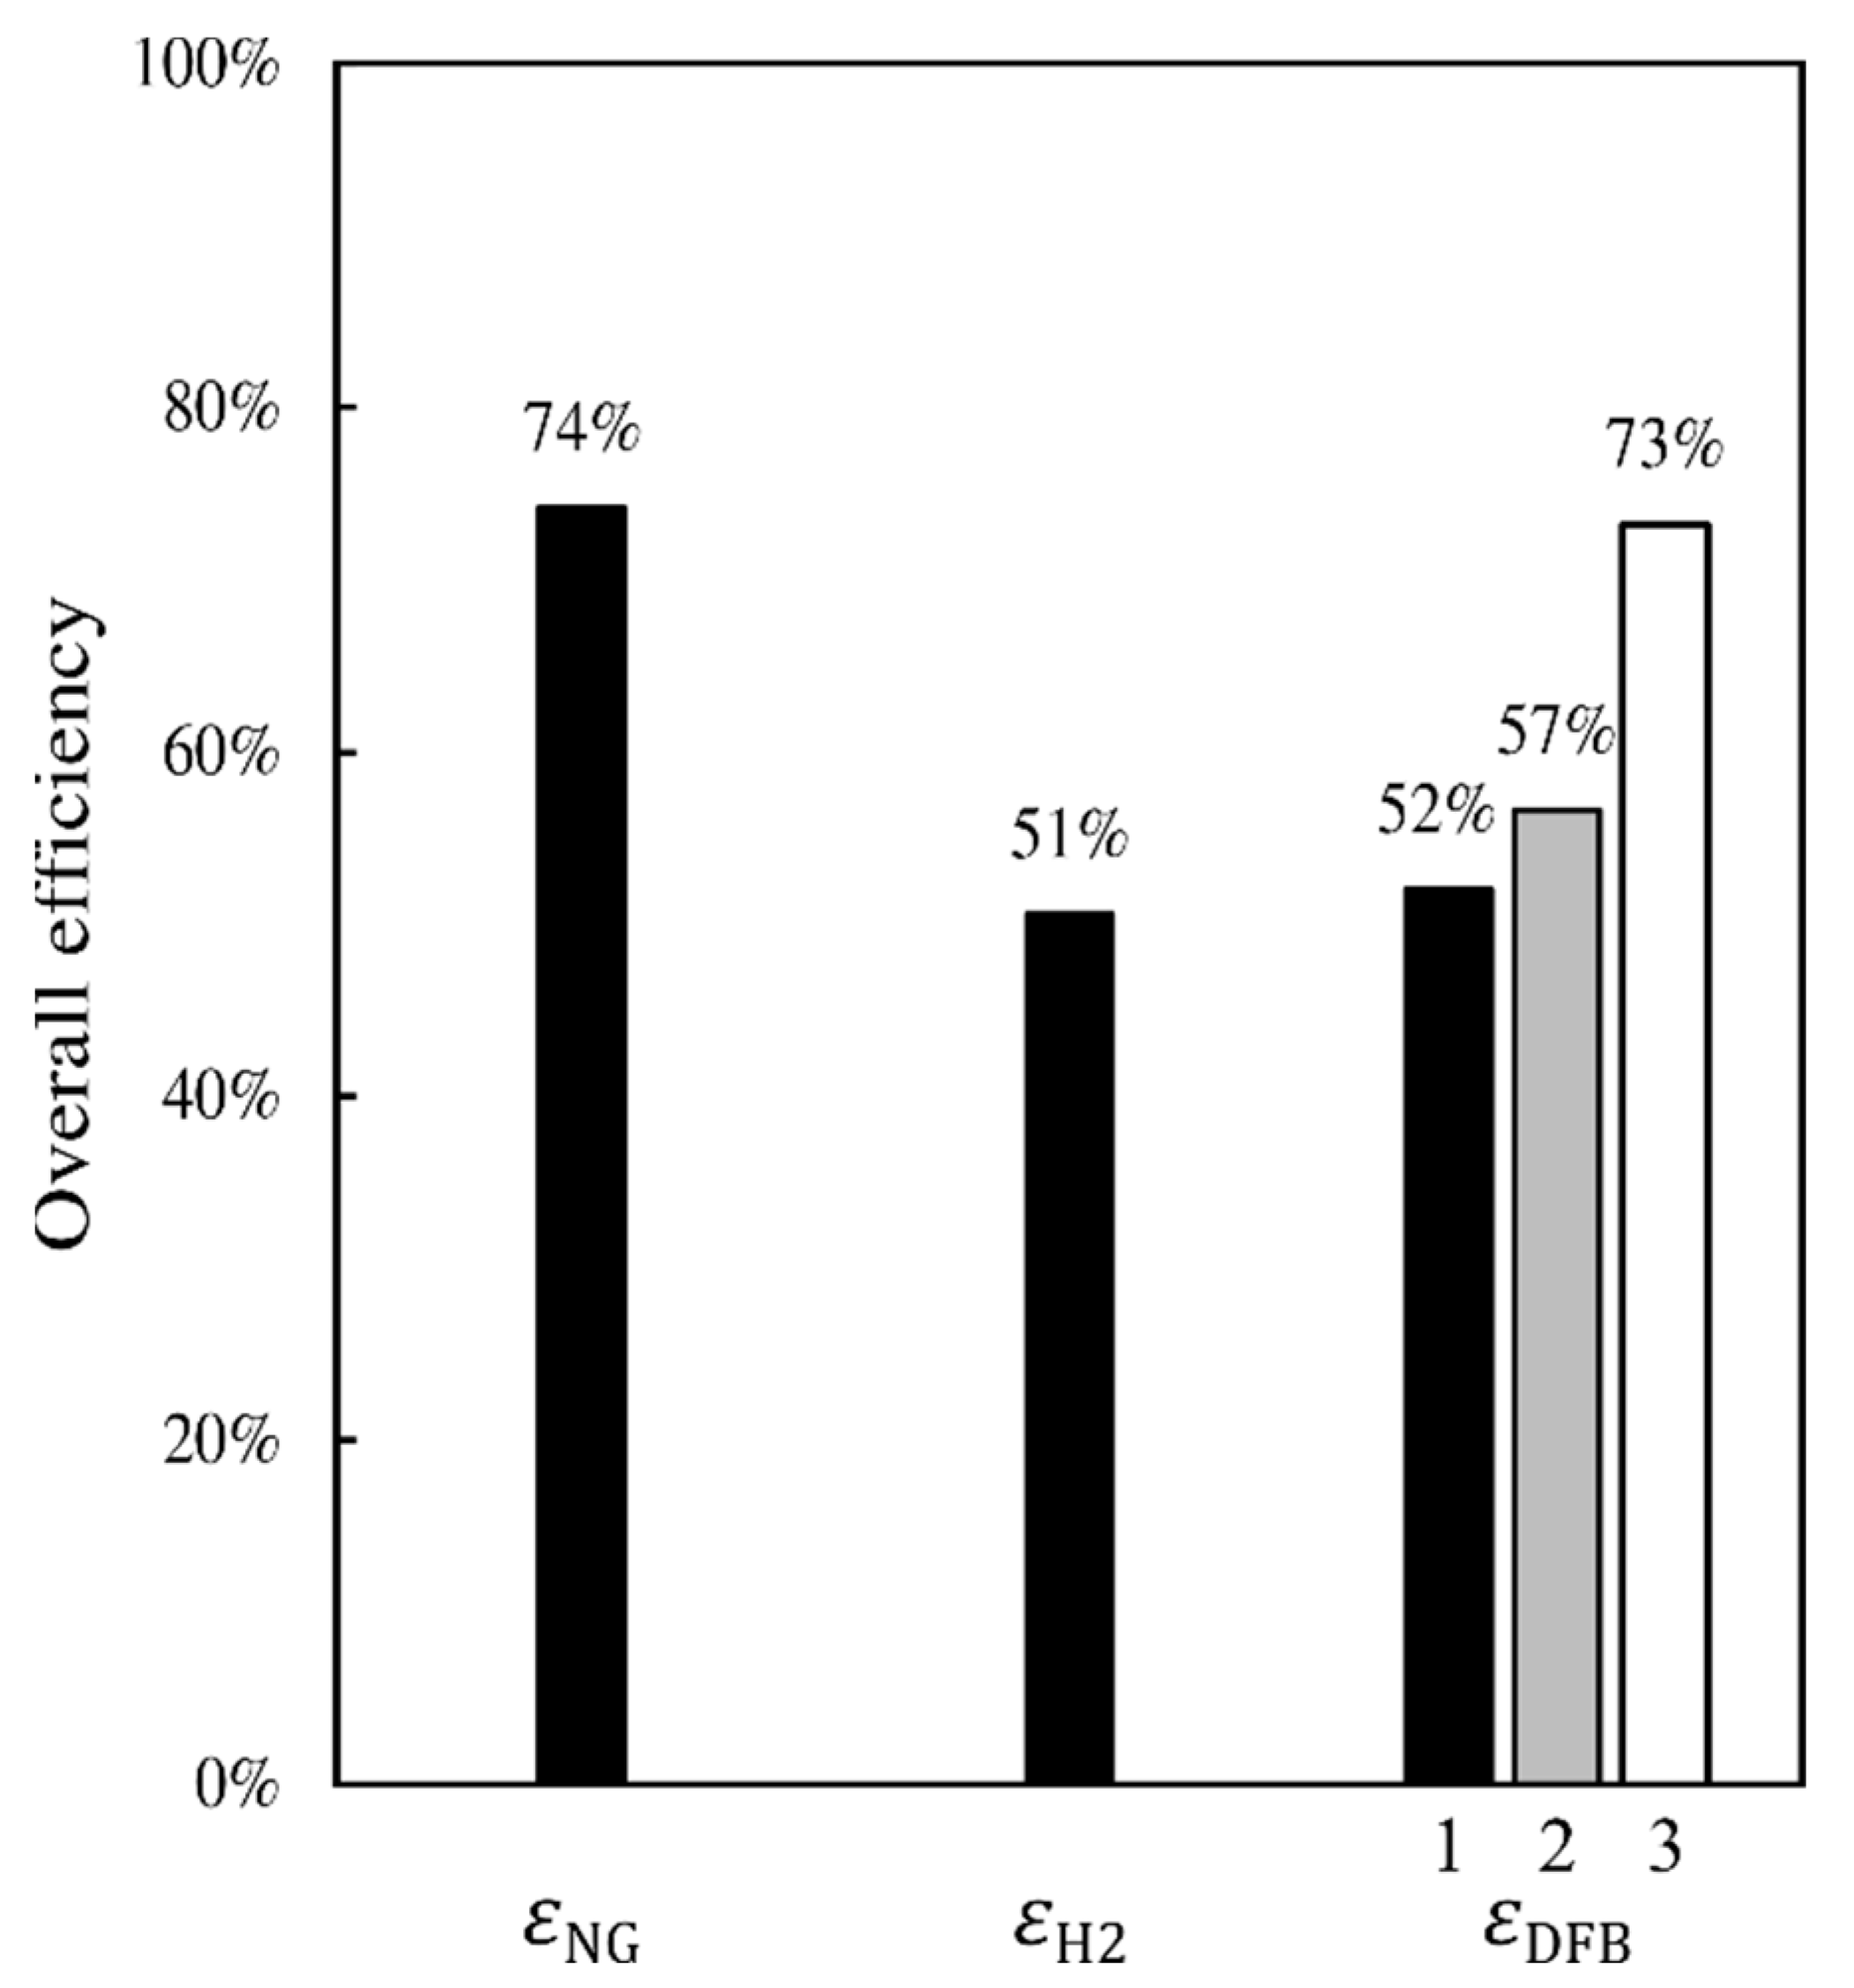
6. Discussion
The results presented in this work reveal that the DFB gasification loop and gas-handling section proposed for the DFB-DR route can provide a reducing gas of quality similar to that of a natural-gas-based MIDREX plant, and whose reduction potential is, therefore, sufficient to achieve a high degree of metallization in the DR reactor. The DFB gasification loop shows an energetic efficiency that is comparable to those of typical DFB gasification systems, such as the GoBiGas plant. Comparing the efficiencies of the three DR routes, the NG-DR route appears to have the highest efficiency and the H
2-DR route has the lowest efficiency. The efficiency of the DFB-DR route is only slightly higher than that of the H
2-DR route, when determined on a dry biomass basis. However, when calculating this efficiency on a wet biomass basis and accounting for the fact that part of the heat produced from the process is used to create pure CO
2 for sequestration, then the efficiency of the DFB-DR route becomes similar to that of the NG-DR route (see
Figure 4).
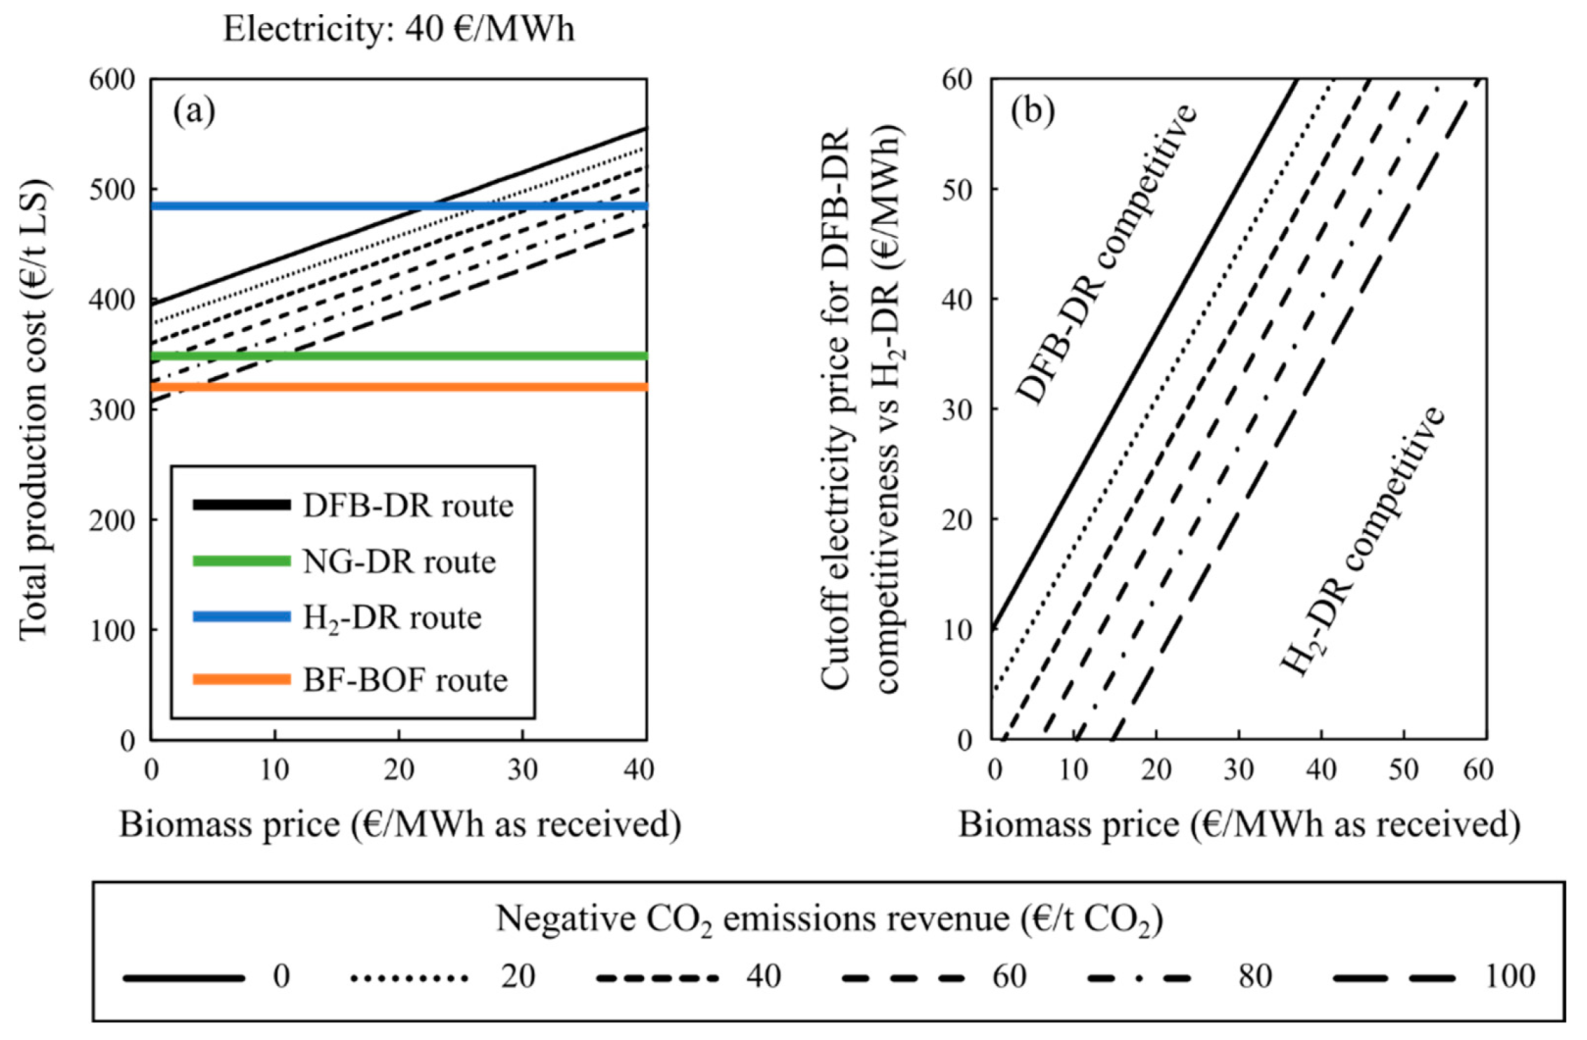
Figure 5 highlights one of the main appeals of the DFB-DR route compared with the other two DR routes: not only does it result in significant reductions in emissions relative to the BF–BOF route, but it also leads to negative emissions, thereby attaching to its produced steel the image of a product that is not just “clean” in itself but actually contributes to “cleaning” the atmosphere.
However, the possibility to produce negative CO
2 emissions, as well as valuable byproducts such as biochar and BTX, comes at a cost. Indeed, the economic analysis shows investment costs for the DFB-DR route that are much higher than those for the NG-DR, H
2-DR, and greenfield BF–BOF routes. This high investment cost, combined with the costs for biomass and electricity, results in an overall high production cost, which means that the DFB-DR route can only be competitive with the other routes if substantial value is assigned to negative emissions. Nonetheless, if CO
2 emissions are penalized to the same extent that negative emissions are rewarded, then the DFB-DR route becomes the most competitive for carbon prices >60 EUR/t CO
2. On the other hand, as stated by Wörtler et al., a full feasibility analysis must account for Europe’s overcapacity with respect to the BF–BOF route, meaning that a technologic switch to the DRI-EAF routes would require massive investment in decommissioning existing BF–BOF plants [
43]. Nonetheless, this is not expected to significantly change the general conclusion drawn from
Figure 8, and it is likely that carbon prices <100 EUR/t CO
2 will be sufficient to make the DFB-DR route the most competitive route for steelmaking.
According to the results shown in
Figure 8, the H
2-DR route never becomes the most economically viable route at current electricity prices. Even if electricity prices decrease, the H
2-DR route cannot compete with the DFB-DR route when revenue from negative emissions is introduced, as shown in
Figure 7b. However, biomass availability, or lack thereof, is likely to limit the potential of the DFB-DR route, such that a combination of the two routes, as well as other low-carbon steelmaking technologies, is likely to constitute the best solution in the future. Note that the H
2-DR route as assessed by Vogl et al. has a lower level of H
2 consumption than the H
2-DR route assessed in the present work, 51 vs. 84 kg H
2/t LS, and thereby a lower reducing gas cost and lower production cost of the liquid steel [
47]. This difference arises from the estimation of the energy consumption of the DR reactor and the possibility for heat recovery from the top-gas. Additionally, in the study of Vogl et al. [
47], the heating demand after heat recovery is provided by electricity. In the present work, the operation of the DR reactor was set to be the same as that for the NG-DR and DFB-DR routes. This might, however, not be the optimal way to operate the DR when using pure hydrogen. Furthermore, the main efficiency loss is related to the combustion of H
2 so as to reach the desired temperature in the DR reactor. This loss could be reduced by using high-temperature electrolysis. Not accounted for in this work is the fact that, as mentioned in
Section 2.3, the H
2-DR route does not provide carburization of the DRI that it produces, which leads to different behaviors in and requirements for the EAF.
The results of this work are consistent with those reported by Hammerschmid et al. for the production of a reducing gas for DR via SER and OxySER [
11]. Those authors estimated a reducing gas cost in the range of 10–15 EUR/GJ, equivalent to 36–54 EUR/MWh, which is comparable to the range of 45–60 EUR/MWh estimated for the “Median” DFB-DR case in
Figure 6. The estimated CO
2 production for carbon capture and utilization (CCU) for a 100-MW OxySER plant is 36,100 kg/h, corresponding to around 360 kg CO
2/MWh reducing gas, which is comparable to the 880 kg CO
2/t LS produced for sequestration in the proposed process, which is equivalent to 320 kg CO
2/MWh reducing gas. The results of the present work are also similar to those of Hammerschmid et al. [
11] when it comes to the economic viability of the DFB process. In both works, the DFB design that produces significant amounts of CO
2 for sequestration or utilization (OxySER for Hammerschmid et al.) only becomes competitive with the natural gas reforming route if value can be derived from the CO
2 via its sequestration or utilization. Apart from the difference in DFB gasification configuration, another major difference between the processes is that the DFB-DR route described herein proposes the use of an electrolysis plant, whereas the OxySER route proposed by Hammerschmid and coworkers is based on the use of an ASU. Hammerschmid and colleagues state that the possibility to use the existing ASU of a DRI-EAF plant is important with respect to the economic viability of the proposed route. Our work, in combination with that of Hammerschmid et al. [
11], further supports the viability of producing steel with potentially negative emissions using DFB gasification and highlights the flexibility of this technology, as it can be operated in various configurations to serve a similar purpose.
The DFB-DR concept presented in this work takes advantage of the flexibility of the DFB gasification technology. The possibility to use an iron-rich, oxygen-carrying bed material allows for low levels of CO2 emissions in the flue gas as well as for the possibility to source this bed from steelmaking slag, which is a byproduct, thereby enhancing the circularity of the proposed process. The presence of a combustor that is separated from the gasifier offers the possibility to easily deal with waste streams. For instance, handling the gas from the EAF has generally been a challenge, due to the presence of CO and N2 and the high dust content. In the proposed process, this gas can be treated in the combustor, where CO is burnt, and the dust is removed in the existing flue gas dust removal step. The presence of the bed reducer in the DFB loop allows simultaneous treatment of the non-recycled top-gas from the DR reactor so as to reduce the bed and limit the undesirable transport of oxygen to the gasifier, as well as to produce a CO2-rich stream that only needs conditioning in order to be transported and sequestered.
The process proposed in this work also represents a good case for the use of a chemical-looping technology, in particular the chemical-looping gasification (CLG) technology to which the DFB loop in this work is analogous. A major challenge with CLG is the oxidation of the raw gas by the oxygen transported from the combustor (referred to as the ‘air reactor’ in the chemical-looping literature). The bed reducer and the non-recirculated top-gas offer an interesting solution to this challenge in that they can limit the transport of oxygen to the gasifier and produce a reduced bed material with high catalytic potential. A consequence of the lower level of oxidation of the raw gas by the bed is that higher levels of H
2 and CO are available for the reducing gas and that the energy demand for CO
2 separation is decreased. In CLG, complete gasification of the biomass is generally the goal to avoid carbon slippage to the air reactor. The transport of oxygen facilitates high gasification rates by removing inhibitors [
54], and reactor temperatures >850 °C are typical. In the proposed process, it is also desirable to avoid char slippage to the combustor, as this represents a loss of negative emissions and thereby a potential loss of revenue. Given the larger amount of char transported out of the gasifier compared with a typical CLG, a higher-efficiency carbon stripper is required.
The choice of operating temperature for the gasifier will emerge from an economic optimization exercise. Higher temperatures will increase the H2 and CO yields in the reducing gas due to enhanced gasification and reforming reactions, which should entail a higher yield of reduced iron. The enhanced gasification reaction will also result in lower char flows to the carbon stripper, thereby reducing both the risk of slippage to the combustor and the risk of loss of negative emissions. However, this reduces the yield of char and the level of associated revenue. Additionally, the higher heat demand of the DFB loop resulting from the higher temperature means that greater uptake of oxygen by the bed is needed. This, in turn, means that more top-gas needs to be diverted to the bed reducer instead of being recirculated to the DR reactor to maintain a low level of oxygen transport to the gasifier. Overall, the gasifier temperature and the degree of recirculation of the top-gas should be optimized by considering the yield and value of all the outputs. Additives can also be used in the DFB loop to increase catalytic activity and contribute to the optimization. The flexibility of the DFB gasification technology ensures that several paths can be considered for this optimization, while accounting for factors other than the production cost and revenues.
Potential issues related to the agglomeration of the ash and the bed will also motivate the choice of operating temperature. Agglomeration tendencies with woody biomass, the fuel proposed in this work, are rather limited but will be significant if biomass rich in silica and alkali is used as the fuel. BOF-slag has been used in a 12-MW
th circulating fluidized bed boiler with woody biomass for two weeks at temperatures ranging 840–870 °C and mixed with silica sand, without any agglomeration issues reported [
25]. This suggests that bed agglomeration issues at the temperatures proposed in this work will be limited. To avoid agglomeration, the accumulation of ash components in the bed can be limited through frequent replacement of the bed material with virgin slag, whose low cost makes this option viable. Controlling the temperature in the DFB loop is another way to limit agglomeration. This can be achieved by increasing the sensible heat demands in the gasifier and combustor by reducing the degree of preheating of inlet gases to the DFB system or by recirculating part of the combustor’s flue gas to its inlet.
The efficiency of the DR step would be increased if a reducing gas with a lower H2/CO ratio could be produced. The H2/CO ratio can be lowered if an ASU is used to produce pure O2 instead of an electrolyzer. However, this decreases the yield of reducing gas and, thereby, the yield of DRI relative to the biomass consumption. The operation of the DFB loop can also be adjusted to lower the H2/CO ratio. Using a less catalytically active bed material is one option. However, the reduced slag bed material contains large fractions of iron and calcium species, both of which are known to catalyze the reforming reactions and the WGS, leading to an increased H2/CO ratio. Diluting the bed with an inert material could be a way to decrease the activity of the bed and, thereby, reduce the proportion of H2. However, this may affect the heat balance, as the oxygen-carrying iron fraction is removed. If, once they are in bed material form, the iron-rich and calcium-rich fractions of the slag are sufficiently differentiated, then the bed could be enriched for iron relative to calcium via magnetic separation, taking advantage of the ferromagnetic property of the iron-rich fraction. This would allow enrichment of the bed with oxygen-carrying particles. Ultimately, a more in-depth study is needed to establish whether a lower H2/CO ratio is desirable from the efficiency and economic perspectives and to establish ways to achieve this lower H2/CO ratio.
7. Conclusions
A DFB gasification process for the production of reducing gas for the direct reduction of iron is proposed and compared with the traditional, natural-gas-based DR route, NG-DR, and the emerging electrolysis-based route, H2-DR. The DFB-DR process is found to be capable of producing a reducing gas that meets the requirement of the MIDREX process, which is the most commonly used DR reactor type. Compared with the other two routes, the DFB-DR route also produces biochar and BTX, which are valuable byproducts. More importantly, it is the only one of the three routes that can generate negative CO2 emissions, promoting a decrease in emissions of 145% compared with the BF–BOF route. The energy efficiency of the DFB-DR route is comparable to the NG-DR route at close to 75%, when determined on a wet biomass basis and accounting for the fact that char, BTX, and CO2 are valuable byproducts in the efficiency definition.
The level of complexity of the DFB gasification loop and associated gas-handling section that produces the reducing gas, as compared with those of the reformer of the NG-DR route and electrolyzer of the H2-DR route, leads to investment costs that are much higher than those of the other routes. Nevertheless, the cost of producing the reducing gas for the DFB-DR route, which is in the range of 45–60 EUR/MWh for the median cost estimate, is lower than that for the H2-DR route, although it is higher than for the NG-DR route. Based on the cost of the reducing gas, the total production costs for the liquid steel are determined and compared for the three DR routes, as well as for the BF–BOF route. In the absence of any revenue from negative CO2 emissions, the DFB-DR route is competitive only with the H2-DR route. When it includes this revenue stream, the DFB-DR route can be competitive with the fossil-fuel-based routes, although it can only really compete with the BF–BOF route when cheap recovered wood is used, electricity prices are low, and negative CO2 emissions revenues are >100 EUR/t CO2. However, when accounting for the cost associated with CO2 emissions and setting its value equal to the revenue for negative CO2 emissions, the DFB-DR route becomes the most competitive route at a carbon price >60 EUR/t CO2. Under the assumptions made in this work, the H2-DR route never becomes economically viable, although these results are mainly applicable to the situation in Sweden. A thorough analysis would need to account for biomass availability and local variability in prices.
The case presented in this work is an example of the flexibility of the DFB gasification technology in providing a range of carbon-neutral or carbon-negative services. The process presented in this work makes use of the slag from BOF and EAF, which is a waste product from steelmaking processes, to separate CO2 from nitrogen. The DFB gasification process could, however, be operated in other configurations. Alternatively, the proposed process could be operated under different conditions of temperature and catalytic activity. Nevertheless, this work shows the technical and economic feasibilities of DFB gasification for producing reducing gas in direct ironmaking and showcases the strong potential for the implementation of DFB gasification in industries other than those concerned with heat and power production and petrochemical processes.


