
A Free-Market Environmentalist Transition toward Renewable Energy: The Cases of Germany, Denmark, and the United Kingdom


1
Department of Applied and Structural Economics & History, Faculty of Economics & Business, Complutense University of Madrid, 28223 Madrid, Spain
2
Department of Applied Economics I, History and Economic Institutions and Moral Philosophy, Social and Legal Sciences Faculty, Rey Juan Carlos University, 28033 Madrid, Spain
3
Department of Applied Economics I, History and Economic Institutions and Moral Philosophy, Social and Legal Sciences Faculty, King Juan Carlos University, 28033 Madrid, Spain
*
Author to whom correspondence should be addressed.
Energies 2021, 14(15), 4659; https://doi.org/10.3390/en14154659
Submission received: 29 June 2021
/
Revised: 21 July 2021
/
Accepted: 29 July 2021
/
Published: 31 July 2021
(This article belongs to the Special Issue Energy Security and the Transition toward Green Energy Production)
Abstract
:Renewable energy (RE) is one of the most popular public policy orientations worldwide. Compared to some other countries and continents, Europe has gained an early awareness of energy and environmental problems in general. At the theoretical level, free-market environmentalism indicates that based on the principle of private property rights, with fewer state interventionist and regulation policies, entrepreneurs, as the driving force of the market economy, can provide better services to meet the necessity of offering RE to protect the environment more effectively. Previous studies have revealed that Germany, Denmark, and the United Kingdom have made some progress in using the market to develop RE. However, this research did not analyze the three countries’ RE conditions from the perspective of free-market environmentalism. Based on our review of the principles of free-market environmentalism, this paper originally provides an empirical study of how Germany, Denmark, and the United Kingdom have partly conducted free-market-oriented policies to successfully achieve their policy goal of RE since the 1990s on a practical level. In particular, compared with Germany and Denmark, the UK has maintained a relatively low energy tax rate and opted for more pro-market measures since the Hayekian-Thatcherism free-market reform of 1979. The paper also discovers that Fredrich A. Hayek’s theories have strongly impacted its energy liberalization reform agenda since then. Low taxes on the energy industry and electricity have alleviated the burden on the electricity enterprises and consumers in the UK. Moreover, the empirical results above show that the energy enterprises play essential roles in providing better and more affordable RE for household and industrial users in the three sampled countries. Based on the above results, the paper also warns that state intervention policies such as taxation, state subsidies, and industrial access restrictions can impede these three countries’ RE targets. Additionally, our research provides reform agendas and policy suggestions to policymakers on the importance of implementing free-market environmentalism to provide more efficient RE in the post-COVID-19 era.
Keywords:
free-market environmentalism; renewable energy; entrepreneurship; public policy; Germany; Denmark; United Kingdom; European Union; EU Green Deal; energy transition; energy production; electricity prices; taxation; state subsidies; industrial access restriction; decision-making; political economy1. Introduction
European countries are the pioneers of perceiving the role of renewable energy (RE) in protecting the environment. That is why European policy programs mainly focus on reversing climate change’s adverse effects. This version is best exemplified in the European Green Deal. It is the roadmap designed by the European Union (EU) to achieve climate neutrality by 2050 [1]. The Deal has become one of the European Commission’s priorities for the 2019–24 period [2]. It involves a vast array of policy actions and a considerable number of resources that amount to at least €1 trillion in investments over ten years [3].
The Commission seeks to transform the RE-oriented economy in a centralized way with a top-down scheme [4,5,6]. Therefore, it resorts to policy actions such as the elaboration of a European Climate Law [7] or to finance the investment plan of the Green Deal through funds managed mainly by government institutions [3]. More concretely, for the energy transition, the Deal aims to transform the current linear and wasteful energy system into a circular, integrated approach in which waste energy can be captured and re-used [8]. With that goal in mind, the Commission mainly resorts to legal tools to set different targets. Moreover, the EU policy also proposes affordable energy prices [9]. These targets are related to the various member states’ environmental performance [10]. Such a centralized policy program ultimately assumes that the political institutions could conduct and implement efficient resource allocation.
Similarly, the above assumption implies that central planning possesses or can acquire the relevant knowledge and prices to design a prosperous economy. However, this assumption was challenged initially one hundred years ago by Ludwig von Mises [11], and later by the 1974 Nobel Prize in Economic Sciences winner Fredrich A. Hayek [12]. He contended that a central body such as the government could not concentrate the relevant knowledge for economic success and the use of resources. In fact, knowledge is scattered among agents in society due to its very local, tacit, subjective, exclusive, and personal nature [13]. Additionally, prices and production are coordinated in the decentralized market economy [11]. This reasoning breaks with any top-down and centralized policy program, advocating a bottom-up and decentralized view of policymaking, which respects entrepreneurs’ role as the driving force providing more RE production. This standpoint is precisely how we look at the European Green Deal and why we doubt it can achieve the system’s effective transformation into a clean, sustainable economy.
Given that knowledge and prices exist as dispersed bits throughout the economy [11,12], we may reconsider the current European environmental policy and provide a different perspective based on the idea that knowledge cannot be concentrated in a central body. In that sense, we support the theory of free-market environmentalism. It certainly takes Hayek’s argument as a premise. Many authors have approached the study of environmental issues based on this Hayekian criterium [14,15,16,17,18,19]. Both theory and empirical evidence have shown how decentralized alternatives succeed in achieving environmental transformations and, conversely, how centralized policies fail to attain the expected and planned policy objectives.
Although the EU does not provide an exact definition of RE, its concepts such as energy efficiency, decarbonization, and other terms appear continuously in its reports. They can thus give us a glimpse into what the European Commission means by clean and renewable energy [20]. It could be said that the European Commission’s notion of clean and renewable energy is “energy derived from renewable, zero-emissions sources, as well as energy saved through energy efficiency measures” [21].
Previous studies concluded that Germany, Denmark, and the United Kingdom (UK) have made some progress in using the market to develop RE [22,23]. However, this research did not analyze the three countries’ RE conditions from the perspective of free-market environmentalism. Based on a review of the theoretical principles of free-market environmentalism, we originally provide an empirical study of how Germany, Denmark, and the UK have partly conducted free-market-oriented policies in order to successfully achieve their policy goals through the broader use of RE since the 1990s. At the same time, we also point out how the interventionist and regulatory policies (taxation, industry subsidies, and industry access restrictions) in the three countries have caused damage to RE development to varying degrees. Section 1 is the introduction. Section 2 initiates the theory of free-market environmentalism. Section 3 is the literature review. Section 4 provides an in-detail analysis of the cases of Germany, Denmark, and the UK. Related empirical data such as the share of RE and electricity prices are provided along with the corresponding analyses. We analyze the three countries’ RE conditions and propose a reform agenda for each country separately. Section 5 is the conclusion.
2. The Theory of Free-Market Environmentalism
Any concrete public policy is ultimately based on a series of assumptions that belong to a specific theory. This condition explains why we must deal with the theoretical level before analyzing the empirical evidence or criticizing a particular policy. For this purpose, we first introduce free-market environmentalism in this section before conducting the empirical analysis.
According to what we have pointed out in the introduction, the European Green Deal, an interventionist program, presupposes that policymakers can design and implement successful policies to achieve their environmental protection plans. However, just as we emphasized before, this assumption weakens or even is invalidated when we consider the abovementioned insights of Hayek’s [12,13]. As knowledge has dispersed, subjective, practical, tacit, exclusive, and creative characteristics, to achieve the ex-ante planned coordination of different actors, the market economy’s price coordination is a better method than central planning. There, economic planning cannot be centrally done by one authority but divided among many individuals due to their verified preferences [24,25,26].
Therefore, the traditional approach to policymaking focuses on a top-down scheme, in which central authority is the main actor. It designs public policies to change or influence a particular aspect. On the contrary, the Hayekian insight focuses on a bottom-up scheme, in which entrepreneurs and organizations interact and make decisions in a decentralized manner based on pricing. Thus, a central authority’s role is to ensure an environment in which decentralized initiatives and price coordination can succeed without state interference. These ideas constitute the principles of free-market environmentalism.
The theory of free-market environmentalism defines environmentalism as the science that studies human beings’ relations with each other and with their environment [17]. Free-market environmentalism considers that the existing decentralized and spontaneous market process propelled by the creative forces of human entrepreneurship coordinates better with and adjusts better for the rest of the species and elements of the natural environment than the centralized planned economy [17].
Free-market environmentalism considers that there are three fundamental problems with any centrally planned environmental policy. The first is the impossibility of economic calculation through centrally planned government policy. The exact identification of private property rights gives the property owner the incentive to protect the environment in which he lives and sue anyone who violates his property’s environment. In contrast, the lack of private property generates the tragedy of the commons, and the environment is polluted without the incentive to protect it [15,27,28,29,30,31,32,33]. When property rights are violated, human beings cannot act rationally, as the necessary information and price signals are disturbed. Therefore, even the most radical environmentalists cannot ensure that their centrally planned proposals would not cause even more environmental damage [17].
Secondly, broadly naming natural resources as public property through government decisions prevents economic calculation and undermines the practice of entrepreneurship [17]. As the market economy’s driving force [34,35], based on price signals, the entrepreneurs make better decisions and allocate resources more efficiently to protect the environment than the central planning of governments.
Thirdly, zero-sum games are created through public policies and legislative decisions, while these problems might be solved or dealt with more efficiently through market coordination. Governmental orders substitute voluntary contracts and actions [17,36,37,38]. As public management creates incomprehensible legislation, it causes the inefficiency of resource allocation. Thus, through government interventionism and regulation policies such as taxation, subsidies, and industry access restrictions, there is no way that the consumers and producers can internalize the costs and benefits of environmental protection-related production.
However, there is not much empirical literature on how property rights and the market process promote RE’s development from free-market environmentalism [39,40,41]. Neither do we have sufficient literature empirically demonstrating how government intervention and regulation measures impede the RE market. Therefore, this paper applies the theory of free-market environmentalism to the empirical analysis of energy issues.
3. Literature Review
In the literature on the history of European energy policy, both top-down and bottom-up approaches are two essential policy elements [42,43,44]. The former focuses on member states’ influence on designing and implementing policies at the EU level. In contrast, the latter relates to the European policies’ performance within the member states at a domestic level [42]. In our paper, the top-down policies refer to those seeking deregulation and a more market-oriented RE approach through political decision-making. Bottom-up processes refer to the market solutions per se. They are no less critical than top-down ones. Implementing a substantial public policy through a top-down scheme or a bottom-up initiative has many consequences at a decentralized level. We regard bottom-up, decentralized initiatives as the essential part of the energy transition where new energies materialize. This initiative is precisely the thesis of free-market environmentalism. It focuses on the role of entrepreneurs and organizations.
3.1. Germany
Germany is considered a successful pioneer of RE transition in the EU with its Energiewende, which started with some first attempts in the 1970s through small incentive programs for wind and solar energy. During the early 1990s, there were more intense efforts to implement innovative domestic policies to increase RE sources’ share (RES). More specifically, the implementation of the feed-in tariffs (FIT) system in 1990 and the liberalization of the electricity market in 1998 through the Energy Industry Act constitute two milestones in the German RE transition’s successful history [45]. As a result, Germany achieved a 9% share of green electricity in 2002, becoming the world leader in terms of installed wind capacity, the second largest in terms of photovoltaic capacity, and the European leader in the sales of biodiesel and solar heating systems by that time [46]. During the 2000s, the Renewable Energy Sources Act (RESA), passed in April 2000, reduced the existing regulation and made market entry possible for other RE such as solar photovoltaics and biomass energy [46]. Since then, this act has been Germany’s main RE transition policy instrument [47], although other policy initiatives such as the RES Export Initiative were established in 2003 to help German enterprises access new markets [46]. As a result of all these policies, RE represented 9.17% of the gross available energy in 2010 compared to 2.61% in 2000. As of 2018, the share of RE in gross available energy was 13.79%, in gross electricity production was 35.97%, but the amount of GHG emissions has barely changed since 2015.
Nevertheless, between 2011 and the present, Germany’s energy policy has changed. The energy industry has become highly regulated [48]. The new approach led to a paradoxical situation. Between 2011 and 2015, the share of RE in gross available energy increased from 10.03 to 12.46%. At that moment, the paradox was: the more Germany invested in the RE transition through state regulation and intervention policies, the more CO2 emissions increased [48]. In addition to that, the electricity price has risen substantially since 2012 after the German government triggered price hikes. The authority guaranteed a fixed price for solar energy for 20 years [48]. From free-market environmentalism, price hikes are viewed as a distorting consequence of government intervention.
Germany’s RE transition is mainly attributed to a FIT system [49]. In general, the German policy is characterized by a combination of two elements: a robust legal policy framework that sustains the funding of a widening set of research institutions and the price-based investment incentives of the RE industry rather than a quota-based one [50].
Moreover, one of the most characteristic elements of the German Energiewende is its civil society’s active involvement [51]. This characteristic has contributed to the decentralization of the system, both for decision-making and energy production. The transition objectives are created through a highly decentralized political structure (ranges from municipalities and regional governments to the central government) [52]. On the one hand, a strong push toward decentralization of the energy system has been led by energy cooperatives. In 2012, citizen energy facilities produced more than 40% of Germany’s RE, compared to the 20% that the traditional big four and municipal companies created [51]. It is estimated that private citizens owned around 50% of the onshore wind energy production’s installed capacity in 2010 [52].
On the other hand, due to civil society’s involvement, the government has prioritized energy policy, focusing on appropriate policies for the RE transition. However, it is striking that the German state opposed the EU liberalization proposal for the electricity and gas market [53]. Although the German state attaches an active role to decentralized projects of all kinds, it made the planning process of RE production more decentralized and democratic, altering the traditional power division. Therefore, large companies dominate the market thanks to the privileges conferred by the government [52].
3.2. Denmark
Denmark’s case is very similar to Germany’s but even more market-oriented and decentralized [52]. Like Germany, the EU’s liberalization and FIT policies were the two milestones in Danish energy policy during the 1990s. However, the most critical aspect of the Danish RE transition lies in its decentralized character. Denmark’s bottom-up approach is regarded as a distinguishing success factor, giving special attention to the influence of social movements and cooperative ownership structures [54].
Until the 1970s, the Danish electricity system was highly centralized in a few large corporations that controlled most of the electricity supply [54]. This situation was challenged by the emergence of many community initiatives organized as energy cooperatives during the late 1970s. An old tradition of energy communities in Denmark, which originated in 1860 with the cooperative movement [54], gained strength even before the first Danish energy transition policies in the 1990s. That explains why numerous RE institutions had been founded before that period, as Denmark had already had a decentralized electricity sector in which municipalities controlled small, local power plants [55].
Since the late 1970s, local authorities and communities have played an equally important role in decision-making to that of the Danish central government [48]. Danish decentralization means that cities (Kommuner) must meet the national goals on a local level by making their own decisions on resource and budget management [48]. The municipal governments have both financial means and independence for policy design, although they are embedded in the central government’s ambitious national plan [48]. Therefore, communities have more space to design their own plans. Additionally, local governments are likely to support them.
It is noteworthy that wind power has been the central element in Denmark’s RE transition [22]. The first wind energy cooperatives emerged in late 1970s. Additionally, until the mid-1990s, wind turbines were mainly owned by individuals and communities in cooperatives. At the end of the 1990s, approximately 175,000 households owned 80% of all wind turbines [54]. The high acceptance of wind turbines has to do with the fact that most of Denmark’s turbines are owned by private households based on neighborhood cooperatives [22]. As a result, wind power became one of the primary energy sources for electricity production, with a share of 42% of the electricity supply in 2015 [54]. As of 2019, wind power accounted for 47% of Denmark’s power usage.
Wind energy was pushed by the FIT system, which was the most crucial factor in the 1990s in matters of energy policy [22,23]. In 2000, these first policies increased the share of RE in gross available energy and gross electricity production compared to 1990: the former increased from 5.74% to 9.02%, while the latter increased from 3.18% to 15.47%. However, it is striking that GHG emissions also increased by 1.37% in that period. After the partial liberalization that replaced the electricity sector’s monopoly with a more market-oriented system in the 2000s, the government replaced the FIT with a resource obligation (RO) system and an emissions trading scheme [52]. However, the literature usually highlights the FIT’s effectiveness in achieving policy targets compared to the RO system [22,52]. The transition to this new interventionist model based on green certificate trading introduced uncertainty for private wind power investors, thereby dropping the installation of new land-based capacity from about 600 MW in 2000 to about 100 MW in 2001 [22]. As a result, in 2010, the RE’s share of gross available energy was 19.16% and of gross electricity production was 31.98%. GHG emissions decreased by 10.34% from 2000. This system was finally replaced by the FIT again in 2009, and since then, energy policy has become much more state-oriented [52].
In general, Denmark is regarded today as having successfully shifted from high dependence on imported fossil fuels to partial self-sufficiency thanks to a high RE share. From the 1990s onwards, Denmark has met almost every goal in terms of RE transitions. At the end of 2003, Denmark had already exceeded the 2005 target regarding installed wind power capacity, although it did not achieve other targets, such as reducing CO2 emissions by 2004 [23]. In 2015, the production of electricity from RE represented 56% of Denmark’s domestic electricity production. Moreover, it became the leading country in wind power generation per capita in that year [54]. In 2018, the percentage of RE among all the energy types raised to 68.4%. The share of RE increased to 35.41% in 2018, up from 5.74% in 1990.
3.3. The UK
According to what we mentioned above, previous research usually studied the UK’s RE transition with Denmark and Germany [22,23]. While Germany and Denmark implemented the FIT, the UK opted for a quota mechanism. It is considered a more pro-free-market policy than the FIT.
Fredrich A. Hayek’s libertarian and free-market proposals have strongly influenced the UK’s energy reform since the 1970s [56]. The country has been a pioneer of free-market-oriented RE research and development (R&D) since 1975. It also started developing domestic RE manufacturing during the oil shocks in the 1970s [22]. The UK initiated its liberalization of the electricity markets in 1989. Its liberalization goal was to achieve higher efficiency and lower consumer prices in electricity by fostering competition [22]. Other European countries later adopted the liberalization approach. In matters of energy policy, while countries such as Germany and Denmark have supported RE through subsiding investment since the 1980s [57], the UK did not start such a policy until the early 1990s [23].
The UK’s first renewable electricity program was the Non-Fossil Fuel Obligation (NFFO), which was initiated in 1990. At that time, the share of RE in gross electricity production (GEP) was 2.44%, and the share of RE in gross available energy (GAE) was 0.48%. The NFFO program consisted of collecting orders (NFFO-1, NFFO-2, NFFO-3, NFFO-4, NFFO-5). The government required the distribution network operators in England and Wales to purchase electricity from the nuclear power and RE sectors [58]. This mechanism proved ineffective at creating diversity, whether technological, in the size of projects, or in terms of generators, investors, or customers. There were two critical problems with the NFFO: (1) a cost cap as price regulation and (2) a lack of penalty for companies that did not take up their contracts [58]. Despite these problems, most of the RE capacity was added with the NFFO. [23] In general, the share of RE on electricity production increased from 2.44% in 1990 to 3.56% in 2002. The share of RE in gross available energy increased from 0.48% to 1.08% during the same period, while GHG emissions decreased by 10.50%. Electricity prices for household consumers increased by 6.44% and for non-household (industrial) consumers decreased by 15.99% in the same period.
The RO system replaced the NFFO mechanism in April 2002. In this case, the suppliers were obligated to purchase and supply not a contract for generation from specific projects but a certain amount of generated electricity [58]. Therefore, the RO is regarded as far more a market mechanism than the NFFO because there is no must-take contract nor price or contract length stipulated. Still, these aspects are determined by the market participants. In that sense, the RO can be considered successful in forcing renewable developers to participate in the electricity market [58]. From 2002 to 2010, the share of RE on electricity production increased from 3.56% to 7.68%, the share of RE in gross available energy rose from 1.0% to 3.42%, GHG emissions decreased by 11.36%, electricity prices for household and non-household consumers increased by 107.30% and 66.52%, respectively, over the same period. Thus, the RO system achieved a higher degree of success in RE transition in a shorter period compared to the previous NFFO policy.
However, among the RO mechanism’s shortfalls, the RO system does not enable smaller players or new entrants into the market. On the contrary, the government RO strategy was aimed at large companies and big electricity technology [58]. Small players were not induced to enter the market, differentiating between Germany-Denmark and the UK. RE did not have nearly the same level of bottom-up enthusiasm and support as it received in Denmark and Germany [23].
From the perspective of free-market environmentalism, this is a central point. We posit above that the bottom-up actions constitute the essential part of any RE transition. Through their different forms, the private entrepreneurial organizations lead the market process, which also encompasses the RE transition. Therefore, the absence of bottom-up enthusiasm in the UK deserves special attention in our analysis, as it may largely explain the differences in its progress compared with Germany and Denmark.
In 2010, the UK introduced the FIT system to complement the RO mechanism [57]. The increase in energy cooperatives in the UK between 2010–2015 coincides with introducing the FIT system [59]. After 2015, due to a regulatory change that removed a vital investment scheme in the UK and tax reliefs, the number of societies newly registered under the UK’s Co-operative and Community Benefit Societies Act 2014 decreased drastically [59]. According to the authors’ own calculations based on Eurostat data, during the same period, the share of RE in gross available energy increased from 3.42% in 2010 to 8.12% in 2015. In contrast, the share of RE in gross electricity production increased from 7.68% in 2010 to 25.23% in 2015. For both variables in the 2010–2015 period, the growth rate experienced a considerable increase compared to the previous and even subsequent years. For their part, GHG emissions also decreased at a faster rate: a reduction of 15.66% in that period, at an annualized rate of −3.13%, compared with the annualized rate of −1.37% from 1990 to 2018. Electricity prices for household and non-household consumers increased by 50.66% and 53.61%, respectively. Thus, the introduction of the FIT system, together with the increase in the number of energy cooperatives, fostered the RE transition in the UK to a greater extent than previous energy policies (NFFO and RO) had done.
4. In-Detailed Analysis
4.1. The Measured Parameters
The parameters on which we evaluate the RE transition are the following. (1) The impact on RE innovation, measured through the increases of the share of RE in total gross available energy, the rise in the share of RE in total gross electricity production, and the number of jobs in RE. (2) The impact on energy prices, measured through the evolution of the electricity prices for household and non-household (industrial) consumers. (3) The impact on greenhouse gas (GHG) emissions, measured as the evolution of the number of emissions over time, (4) The impact of taxation, state subsidies, and state industry access restrictions on the development of RE and electricity markets along with their prices. These four degrees reflect different aspects of any RE transition from the current European environmental policy perspective that we have mentioned above: lower prices, more RE, and less GHG emissions.
Figure 1 comprises five graphs that show the evolution of the five parameters that we propose for analyzing the RE transition in Germany, Denmark, and the UK from 1990 to 2018. These variables include the share of RE in gross electricity production, the percentage of RE in gross available energy, electricity prices for households and electricity prices for non-household consumers (all taxes and levies included), and GHG emissions.
At first glance from the figure, it seems that in 28 years, from 1990 to 2018, all countries have positive features in their respective RE transitions. This tendency is especially evident for the increasing trends in the share of RE in gross electricity production (a) and gross available energy (b) and the decreasing trend in GHG emissions (e). However, as the supply of RE increased, the price of electricity (c, d) in the three countries did not show a corresponding downward trend. This result may alter the traditional view on these countries’ energy transitions, with the UK being more successful in a critical aspect of any energy transition: affordability [9]. Therefore, it is necessary to conduct an in-depth analysis of the three countries’ RE markets, their electricity prices, and their relationships with free-market environmentalism.
Table 1 comprises our analysis of each country’s RE transition from the perspective of free-market environmentalism and the indicators we have selected to measure each transition’s progress. Table 1 contains an overview of each energy system, the key policies implemented by the different countries, and the taxes and subsidies introduced between 1990 and 2018. There is also a quantitative part with data that corresponds to the selected variables. Most of the figures are our calculations based on Eurostat, the European Environment Agency, and EurObserv’ER. The statistics allow us to measure each country’s progress in the RE transition and the impact of their policies and institutional frameworks.
We focus on innovation, GHG emissions, and electricity prices because they reflect three aspects usually addressed in energy policy literature. Additionally, they are priorities for the current European environmental policy. First, the impact on innovation is measured by increasing the share of renewable energy in total gross available energy, the increase of the percentage of renewable energy in total gross electricity production, and the number of jobs in renewable energy in 2018. Second, the increases of the two shares are calculated as the rate of change in renewable energy share in their respective totals between 1990 and 2018.
For their part, jobs are expressed in absolute terms, and we have calculated the ratio of employment/total population to compare the figures between the countries. GHG emissions’ impact is calculated as the rate of change in emissions between 1990 and 2018. The impact on electricity prices is also measured as the change in electricity prices for household and non-household consumers between 1990 and 2018. Finally, we deflate nominal prices to constant 2015 prices to compare data in real terms without price inflation.
4.2. Germany: A State Subsidy RE Institution with a Decentralized Decision-Making Feature
4.2.1. Bottom-Up Infinitives and a Positive GHG Reduction
Looking first at the results of Germany’s policies and institutional design, we can make the following comments. First, regarding the impact on innovation, Germany has considerably increased the share of renewable energy in gross available energy and gross electricity production. As Table 1 shows, the former increased by 15.19% and the latter by 31.5%. Second, the impact on innovation has also resulted in Germany’s job creation, with more than 80 million jobs created by activities related to renewable energies. This figure represents a rate of 0.0031 over the total population. This data places Germany between Denmark and the UK in job creation associated with RE.
Second, from the impact on GHG emissions, Germany’s were reduced by 29.56% from 1990 to 2018. Thus, it evidences the substantial efforts made in reducing GHG emissions. However, despite being a positive result, it seems that Germany is still far from meeting the target set in the Climate Action Plan 2050, of a 40% cut in GHG emissions by 2020, taking 1990 as the base year [61]. Third, both for household consumers and non-household consumers, Germany’s electricity prices have experienced a notable hike in real terms from 1990 to 2018: 38.9% and 17.96%, respectively.
In light of these results, we may affirm that Germany is making the RE transition at a good pace, although it needs to increase the rate to reduce GHG emissions. Moreover, the country also has a problem with an increasing trend of electricity prices. As said before, Germany is not fulfilling one of the objectives of any energy transition, namely, to accomplish it at an affordable cost [9]. Let us explain the successes and failures of this energy transition from a free-market environmentalist viewpoint.
As Table 1 shows, Germany presents several highly relevant features for free-market environmentalism regarding the top-down and bottom-up analysis. Starting from the top-down policy level, although Germany at first opposed the liberalization process introduced by the European institutions due to the pressures of traditional, large energy companies [45], the German government has created an environment in which many decentralized initiatives have flourished, as Table 1 illustrates. Among the three countries, even the policymaking is highly decentralized in Germany, which also needs to be considered. If policy decisions are made decentralized, the local policymakers could possess more information to make pro-market decisions. It also enhances the roles of local energy enterprises in the development of more and better RE. Thus, it reduces the possible distortion from interventionist policies. These top-down reforms have allowed the RE transition in Germany through an entrepreneurship-based, bottom-up process. Therefore, civil society and organizations like cooperatives have played a relevant role. In contrast to this success in the eyes of free-market environmentalism, there are also some obstacles to the energy transition caused by taxes, subsidies, and restrictions.
4.2.2. FIT System as a Distortion of Energy Transition
Besides, although the FIT system has been regarded as a primordial policy for Germany’s success in its energy transition, households bore a large part of the above regulations’ costs [60]. In the case of electricity, due to high FIT, German households pay the third-highest price for electricity among all International Energy Agency (IEA) countries, at USD 353/MHW in 2018 [62]. As mentioned above, the electricity price has risen substantially since 2012 after the German government triggered price hikes. In addition, the authority guaranteed a fixed price for feeding solar energy for 20 years [48]. As we have mentioned, artificially high prices are the opposite of one of the EU’s clean energy goals: lower energy prices.
This EU policy proposal correlates with the free-market environmentalist vision of market price coordination. From free-market environmentalism, price hikes are viewed as a distorting consequence of government intervention. Therefore, this regulation policy hampers the progress of the energy transition, as the introduction of taxes and subsidies alters economic calculation and distorts price signals. Thus, the FIT policy negatively affects the resource-allocation efficiency and, ultimately, the RE transition itself. In that sense, knowing that the FIT system is based on taxes and subsidies, we can understand why it has caused some distortions in energy production [48].
As stated previously, the FIT system is a state subsidy mechanism. It is not coherent with free-market environmentalism. Any efficient resource allocation cannot be achieved without the mechanism of economic calculation. The entrepreneurs need to compare current prices with anticipated future prices to allocate their resources [34,35]. Without prices as signals, the entrepreneurs would not know which resources are necessary to produce more and better RE. Neither would they know which kind of energy could meet industrial production and household consumer demands.
However, the prices of the FIT system are set by political decision-making instead of market price coordination. It distorts economic calculation for the production of RE services. Therefore, although as we have mentioned, the FIT system is always treated in the literature as a successful mechanism compared to other means, mainly the RO (Resource Obligation) quota-based system, the claim is challenged by free-market environmentalism. Despite both systems being a mixture of market features and state intervention and regulation [22], in the RO method, while the government fixes the quantity of energy production, the price is determined by the market. On the contrary, the FIT system distorts prices through taxation and state subsidies [48].
4.2.3. High Electricity Prices and High Taxes
Therefore, as one previous study highlighted [48], perceiving that the FIT system is based on taxes and subsidies, it is easier to understand how it has caused some distortions in energy production. In taxation, the German government adopted an active role in the RE transition. As Table 1 above shows, the German government has imposed energy taxes (on oil products, natural gas, coal, coke products at different rates) and a carbon tax (for emissions in non-ETS sectors) [60]. Although energy taxes could reduce GHG emissions, previous research also admitted the taxation could distort price signals for energy production [60], which might not be healthy for the long-term development of Germany’s RE industry.
Apart from the above tax components on the energy industry, Germany’s hike in electricity prices was also due to the government’s general taxation policy. Figure 2 shows the taxation components of non-household and household electricity consumers in Germany, Denmark, and the UK in 2016. The data in 2016 is an example of the energy policies of the three countries in recent years. The taxation level in Germany in 2016 was only a little lower than those of Denmark. The German taxation components of non-household and household electricity consumers in 2016 were 47% and 53%, respectively. This data means that around half of what German households and companies pay is taxation to the government, which naturally leads to artificially high electricity prices.
Such a high tax cannot help entrepreneurs in the renewable energy industry find the actual market prices as signals for energy development. This situation increases the uncertainty that the RE entrepreneurs have to face, as they cannot know which prices the electricity consumers want to pay, as price signals are distorted by heavy taxation. Similarly, high taxes are bound to curb household consumption and entrepreneurial production. The current high taxation could also reduce the economy’s gross output and reduce the incentives for renewable energy adopted by households and enterprises.
Further analysis of Germany’s general taxation situation in the past few decades could help us perceive the general taxation burden on its RE industry. Our analysis finds that the overall taxation of the German electricity market is higher than its VAT. Table 2 shows the VAT of Germany from 1970 to 2020. Figure 3 shows the evolution of the tax burden on electricity prices in Germany from 1991 to 2019. Although the German VAT rose from 12% in January 1978 to 16% in June 2020, the highest rate did not exceed the 19% level from January 2007 to June 2020. However, Table 2 and Figure 3 together show that since 1990, Germany’s electricity tax has been much higher than its VAT level. From the comparison of electricity tax and VAT, consumers in the German electricity market have paid a relatively heavier tax than VAT. According to Figure 3, Germany’s taxation on electricity has formulized artificially higher electricity prices. Previous research also indicated that in the case of electricity, due to high FIT and taxation, German households pay the third-highest price for electricity among all IEA countries, at USD 353/MHW in 2018 [62]. From the perspective of free-market environmentalism, as taxation distorts the essential role of entrepreneurship and economic calculation, the electricity tax should not only be reduced to a level no higher than VAT, but should be eliminated as much as possible.
4.2.4. High Electricity Prices and State Subsidies
Apart from heavy taxation on the energy industry and electricity, Germany has a severe problem of state subsidies in energy production. It distorts the entrepreneurial production of RE. Moreover, it also partly causes high electricity prices. Table 1 has shown some of the German government’s subsidies to the energy industry. Biofuels have been subsidized through the EU biofuels targets in recent years [60]. Data from 2019 shows that the German government provides a 64% subsidy (premium) to gasoline, which is in the middle reaches of the IEA countries [60]. Previous studies also indicated that a surcharge for consumer electricity bills paid for renewables subsidies, as a high share of the costs were paid by households [60]. From the free-market environmentalism perspective, state subsidies not only distort price signals, but also causes a zero-sum game among energy enterprises. The energy companies that did not receive the state subsidies can not compete equally with those that acquired the state subsidies. The latter group gets its capital and benefit not from exploring the market signals and what the energy consumers want, but from the state.
4.2.5. Industrial Access Restrictions and Government Auctions
Therefore, taxation and state subsidies also naturally cause industrial access restrictions. The energy companies that were taxed heavily or did not receive the state subsidies could not compete equally with those that acquired the state subsidies. The case of fuel energy vs. RE is a concrete example of this type of industrial access restriction. Although fuel is not considered clear energy, ironically, Germany does not have fuel price regulation while it regulates RE prices. As a kind of RE for electricity, heat pumps represent only 2.5% of energy consumption for heating and cooling. In comparison, fuel oil heating supplied more than 25% of the total consumption prior to 2020 [60]. The higher taxation causes the situation of low consumption of heat pumps. Previous research indicated that the fuel costs (excluding tax) associated with heat pumps with a seasonal performance factor of 3.5 or higher are lower than oil and gas boiler costs [60]. Apart from free-market environmentalism, previous research also suggested that the German government should remove sector coupling barriers, making competition in the energy industry possible [60]. Positively, the removal of industrial access restrictions is also under consideration by the German government [60].
German government auctions have become a new way to enhance RE’s market competition. The 2014 German Renewable Energy Sources Act (RESA, as the central instrument for expanding RE in Germany’s electricity sector) proposed auctions for determining the level of financial support for RE by 2017 at the latest. The first auctions took place in 2015 for ground-mounted PV as a pilot scheme. In the following years, similar auctions continued [60]. Although the auction is still organized by the German government and artificially sets the basic prices, it is, after all, less interference in the market than direct government subsidies. Auctions under the German government’s guidance should be encouraged as a transition plan until the market ultimately determines the RE prices.
4.2.6. Reform Agenda: Deregulation
However, the situation may change. As we have indicated, previous research also suggested that the German government should remove energy taxes, reduce state subsidies, and remove sector coupling barriers, making competition in the energy industry possible [60]. It is also under the German government’s consideration [60]. Although the RESA as the central instrument for expanding RE in Germany’s electricity sector suggested executing FIT and feed-in premiums (state subsidized fixed prices) in the next 20 years, the German government is considering removing the state subsidies, taxation, and the other regulations [60]. It has made several tax concessions (e.g., heating fuels, electricity in manufacturing industries, and agriculture) [60]. Additionally, the German government has been experimenting in recent years and adopted some policies to reduce subsidies and taxes. As we have mentioned, the RE auction is one of the first steps towards deregulation. The 2014 RESA introduced subsidy prices based on its estimation of market prices for new RE source installations above a minimum threshold. It has also set auctions for determining the level of financial support for RE by 2017 at the latest. These policies could enhance the essential role of entrepreneurship to provide better and more RE.
As the German government has a plan to phase out coal-based power by 2030 [60], its attitude of zero tax but high state subsidies are not compatible with the perspective of free-market environmentalism either. Any infringement on private property rights, entrepreneurship, and prices should be minimized. Therefore, the problem here is not to adopt any interventionist policies such as tax increases for fuel, but to reduce their access to RE, and as much as possible to remove all other restrictions on electricity and renewable taxes, subsidies, industry access restrictions, etc. The best means to achieve less GHG emissions and more RE should be through free-market environmentalism, entrepreneurship, and market price signals, rather than the government’s central planning.
4.3. Denmark: Part-Liberalization with a Decentralized Community-Based RE Transition
4.3.1. Decentralization, Entrepreneurship, and Public Awareness
As stated, the case of Denmark is very similar to Germany but with an even more decentralized initiative for local communities and local energy firms. This approach has led to the Danish decentralization policy, and has had a considerable impact on innovation (see Table 1). From 1990 to 2018, the country’s shares of RE in gross available energy and gross electricity production have increased significantly, reaching 68.4% in electricity production. Moreover, jobs created by activities related to RE production amount to almost 6 million during the same period. The number represents the highest job/population rate in comparison with Germany and the UK. Moreover, Denmark has reduced GHG emissions at the same proportion as Germany, roughly −29%. This reduction since 1990 is striking if we consider that until 1996 GHG emissions did not stop increasing. Denmark has changed the trend and has accelerated the rate of emissions reduction since 1996.
It is necessary to emphasize that the Danish policy approach is supported by an alignment between the part-liberalization of energy, the participation of energy enterprises, and the public’s environmental concerns [55]. The policy measures were aimed at local communities, being a successful decentralized community-based approach [52]. This policy trend has created a favorable environment and public awareness for bottom-up entrepreneurship initiatives. It has also led the RE transition in Denmark through the RE cooperative figure (see Table 1). Previous research recognized that both policymaking and energy production have been relatively decentralized in Denmark [52,55]. Therefore, compared to Germany, Denmark can be considered a less intervention-based system from the decentralization perspective, albeit maintaining strong government involvement.
4.3.2. High Electricity Prices and State Subsidies
Despite the correct decentralization policy approach, state interventions (government subsidies, taxation, and state industry access) have caused high electricity prices in Denmark. The Danish government has continuously provided subsidies to RE production. The Danish 2012 Energy Agreement aims to provide “subsidies to promote efficient use of RE including heat and power in enterprises” [64]. The foregone research has indicated that the increasing prices in RE were partly caused by the state subsidies [64]. The Danish government subsidizes RE both directly (i.e., feed-in premium, subsidized grid connections, and reinforcement of the grid to connect RE plants) and indirectly (i.e., high taxation on residential electricity while having tax exemptions on biomass) [61].
Table 3 shows the state has subsidized premium prices of large-scale offshore wind tenders from 2005 to 2016. The divergence between the winning bid normal price and fixed 2016-price in Danish krone shows that due to the state subsidy, the fixed (premium) prices were higher than the original nominal prices (except the prices in September 2015 and November 2015, where there was no subsidy). From the data [61,65], we also calculated the percentage difference between the subsidized price and the original prices from February 2005 to February 2015, which were 23.6%, 12.2%, 8.1%, 8.1%, and 1.6%. It is worth noting that after the subsidy ceased, the prices of winning bids of large-scale offshore wind tenders have declined since September 2016 [61].
Apart from wind energy, subsidies also cause higher prices in other RE. One example is solar energy. From November 2012 to June 2013, eligible solar photovoltaic plants received a variable fit-in premium up to DKK 1450/MWh (€195.1/MWh in 2021 exchange rate) for ten years [61]. In 2016, all solar energy was supported by direct subsidy such as premium prices [61]. Moreover, biogas and solid biomass were all supported by direct state subsidy. All these state subsidies severely distorted the role of entrepreneurship and the price coordination of the Danish RE market.
Positively, the Danish government has recognized the problem that state subsidy artificially increases electricity prices. In 2017, the new Energy Agreement for the years 2020–30 suggested that Denmark reduce subsidies and take market-driven instruments to lower prices and minimize distortion in the electricity market [61,68]. Thus, the Danish government realized that electricity prices were distorted at a higher level due to state subsidies and proposed to let the market per se adjust prices in the upcoming years. Thus, the cessation of subsidies in large-scale offshore wind tenders by the Danish government from 2015 was a sign of the policy shift towards less government intervention in RE.
4.3.3. High Electricity Prices and High Taxes
In addition to the subsidy issues, previous research indicated that Denmark has high electricity prices also due to the significant tax component [61,66]. Figure 2 above shows industry and household electricity prices in Germany, Denmark, and the UK in 2016. Among the IEA countries, as of 2016, Denmark has the highest electricity prices for households and the highest taxes on household electricity [66]. The proportion of taxation in industry and household electricity prices in 2016 were 35% (industrial electricity prices were at least USD 98/MWh) and 64% (household electricity prices were USD 300/MWh on average). The data of the two items in two other Nordic countries were 1% and 39% in Sweden, and 20% and 38% in Norway, respectively [61,65].
Table 4 shows the VAT taxation of Denmark from 1978 to the present. VAT applies to all energy products. As the Danish VAT is refunded for commercial purposes, it is not included in prices shown for the industrial and electricity generation sectors and automotive fuels for commercial use [63]. Therefore, Danish taxes related to the RE and electricity need to be calculated separately. Figure 4 shows Denmark’s household electricity taxation from 2009 to 2019 (data of electricity prices for non-household consumers was not available). Since 2009, the proportion of household electricity taxation in Denmark has been higher than 55%. It has been on a gradual upward trend since then. In 2019, the proportion of household electricity taxation was as high as 88.4%. This ratio is much higher than Denmark’s VAT ratio (25%) in recent years. Moreover, Denmark has other energy-related taxes such as mineral oil tax, CO2 tax, nitrogen oxide tax, sulfur tax, natural gas tax, and coal tax [63]. Taxes have become a heavy burden on Danish electricity consumers.
Another sharp contrast indicated that the Danish consumers pay the highest prices among the IEA countries, while Norwegian consumers, who are connected to the same electricity market, pay the lowest prices in the IEA comparison [61]. Denmark’s geographic condition has already made hydro inexpensive in Norway and thermal generation more expensive in the rest of the Nordic region [61].
As a result, the country fails at one of the RE transition’s fundamental aims, namely achieving the transformation at a low cost to consumers [9]. Electricity prices for household consumers have increased by 46.42% from 1990 to 2018, whereas electricity prices for non-household consumers have increased by 137.34% in real terms (see Table 1). Among the IEA countries, as of 2016, Denmark has the highest electricity prices for households and the highest taxes on household electricity [66]. The proportion of taxation in industry and household electricity prices in 2016 were 35% (industrial electricity prices were at least USD 98/MWh) and 64% (household electricity prices were USD 300/MWh on average), respectively, while the data of the two items in two other Nordic countries were 1% and 39% in Sweden, 20% and 38% in Norway, respectively [61,65].
Therefore, excessive taxation is one of the causes of the high price of electricity in Denmark. Previous research indicated that Denmark’s high electricity prices are due to high production costs and high taxes [61]. They also suggested that Denmark should conduct a tax reduction for its RE industry [61,63,66]. This policy suggestion matches the free-market environmentalist proposal of tax reduction.
4.3.4. State Industrial Access Restrictions
Besides, the Danish government almost forbade consumers from switching their energy suppliers, shaping the state regulation of access to the energy industry [61,67]. Therefore, the high electricity prices have been caused by government subsidies, taxation, and state industry access. However, the regulation of switching energy suppliers became loosened on 1 October 2014, as the Danish government allowed customers who had not chosen to switch their energy suppliers to move to non-regulated energy products automatically [67]. At the end of 2015, more than 90% of energy customers were on a non-regulated product [67]. The numbers of energy retailers that were active in the various distribution territories have also increased since 2013. At the end of 2013, on average, 23 energy retailers were active in each service territory, while by the end of 2016, the numbers increased to 32 [61].
4.3.5. The Danish Reform Agenda: Tax Reduction and Price Control Abolition
Given this situation, the Danish government realized around 2013 that intervention policies are detrimental to RE’s development. The Danish Energy Commission further suggested that market prices should be adopted to enhance the competitiveness of the RE industry, adopting a “flexible consumption” policy to let energy consumers have more freedom to make choices [61,68]. Since 1 April 2016, the Danish Energy Regulatory Authority started to manage a price comparison to give consumers an overview of all energy retail products available to them [67]. Moreover, previous research indicated that Denmark’s high electricity prices are due to high production costs and high taxes [61]. They also suggested that Denmark should conduct a tax reduction for its RE industry [61,63,66]. This policy suggestion matches the free-market environmentalist proposal of tax reduction.
As we have argued, government intervention could distort the market-based economic calculation and price coordination. The above empirical studies also show that the Danish government’s subsidies, taxes, price controls, industry access, and other interventionist policies have negatively impacted Danish consumers’ choices and competition in the RE industry. Insofar as the Danish government no longer intervenes in the energy industry, it will be easier for entrepreneurs to specify RE prices and types of indicators according to energy consumers’ needs. Therefore, from the perspective of free-market environmentalism, the Danish government should abolish all price intervention and control measures.
4.4. The UK: Coexistence of RE Liberalization and Government Interventions
4.4.1. RE Liberalization, More GHG Reduction, and Low Electricity Prices
As we have demonstrated, traditional research usually compares the UK to Denmark and Germany as a relatively market-based alternative policy. In addition, they usually make comparative analyses to observe the RO system’s effectiveness (which has been more predominant in the UK) compared to the FIT system (as the primary energy institution in Denmark and Germany). Other research considers that the UK government has limited itself to liberalizing the markets as a top-down policy approach. Further, they believe the UK has not progressed in the energy transition as Germany and Denmark promote many intervention policies but not a comprehensive market liberalization. However, these studies have not comprehensively analyzed the UK’s RE-related policies from the perspective of free-market environmentalism. Additionally, our parameters show a very different reality than other articles on the present matter.
Table 1 above shows the increasing tendency of British RE use. Its RE share in gross available energy has grown from 0.48% in 1990 to 11.14% in 2018. The RE in gross electricity production also increased from 2.44% to 11.14% in the same period. The UK’s increase of RE in gross electricity production is proportional (31.5%) to the rise in Germany (30.46%) but is lower than that of Denmark (65.22%). Danish RE innovation’s contribution to the power industry is more significant than that of the UK and Germany. Many factors affect industrial innovation. The entire market process behind the innovation action cannot be inferred from the simple empirical figures themselves. Therefore, it cannot be concluded arbitrarily that the relatively low taxes in the UK lead to a relatively small RE innovation proportion.
Besides, the UK’s RE supply has shown a significant increase since 2007. The share of RE in the total energy supply has grown from 2% in 2007 to 10% in 2017. Additionally, its share in electricity generation increased from 5% to 30% during the same time period [62]. Similarly, the UK’s RE is also continually creating jobs. The number of jobs created by renewable activities amounts to almost 76 million in the UK, which has a lower jobs/population rate than Denmark and Germany (see Table 1). Therefore, although the UK’s impact on innovation has been slightly lower than in Denmark and Germany, RE-related jobs are still growing in the UK.
Regarding GHG emissions and electricity prices, the UK has more environmentally friendly figures than Denmark and Germany (see Table 1). On the one hand, as of 2018, the UK had reduced its GHG emissions by 38.41% since 1990, a considerably higher figure than Denmark and Germany. On the other hand, the analyses above have pointed out that the Danish government’s policies on RE-related subsidies and taxations have been more severe than those in the UK. The innovation brought about by Denmark’s relatively high government subsidies and taxations did not positively impact GHG emissions compared to the UK. Therefore, without considering other variables’ influence, the UK has somewhat less government intervention in RE.
The UK’s result of GHG emissions is consistent with the theory supported by free-market environmentalism. It can be said that the relatively few government regulations in the UK have had a positive impact on the development of its RE and environmental protection. Statistics in Table 1 and Figure 1 also show that the UK has been the only one of the three that has managed to prevent electricity prices from soaring in real terms, with electricity prices for household consumers experiencing a rise of only 6.75%, and that for non-household consumers by merely 5.38%, since 1990.
4.4.2. Public Support and a Hayekian-Thatcherism Free-Market Energy Reform Since the 1970s
Fredrich A. Hayek’s libertarian and free-market proposals have strongly influenced the UK’s energy reform since the 1970s. Senior-level policymakers and energy-related advisors have been listening to Hayek’s free-market reform suggestions and discussing how to liberalize the energy market since then [56]. As a result, the UK became the first European country to liberalize its electricity market in 1989, followed by other countries a few years later. Thirteen years before that, in 1975, the UK implemented its first national program to support R&D of RE. After that, and through different policy programs (NFFO, RO, and FIT), the UK has managed the RE transition [22].
It is also worth mentioning that the UK’s liberalization top-down policies have created a relatively free environment for entrepreneurship-based initiatives, guaranteeing competition in line with its comparatively market-based orientation to keep prices low and increase efficiency [62]. Some studies suggest that the UK has not had the same support, enthusiasm, or involvement in decentralized initiatives such as the RE cooperatives in Germany and Denmark [23]. However, these analyses ignored the relevant historical background. Since 1979, the Thatcherism free-market reform [70] has been a significant background for British economic policy transition. Behind this policy is the support of the pro-liberalization of public opinion. Therefore, driven by public opinion and policies, the market’s spontaneous order and coordination have guided the energy industry in developing RE and related fields.
4.4.3. Low Electricity Prices and Low Taxes
As both Table 1 and Figure 1 have shown, among the three sample countries, the UK has been the only one that has managed to prevent electricity prices from soaring in real terms, with electricity prices for household consumers experiencing a rise of 6.75% and non-household consumers seeing a rise of 5.38% since 1990. Table 5 shows the situation of VAT and reduced energy taxation in the UK since 1994. The UK’s VAT is refunded for purchases for commercial purposes [63]. Thus, it is not included in the prices shown for the industrial and electricity generation sectors. A reduced UK VAT rate applies to the energy industry, including traditional energy and RE (i.e., light fuel oil, natural gas, coal, and electricity sold to domestic users, etc.) [63]. Table 5 shows that from 1994 to 2010, the UK’s VAT remained in the range of 15−17.5%, although it has risen to 20% since 2011. The VAT for energy was 8% from 1994 to 1997, and from 1997 it dropped to 5% until now. Compared with the taxation of the energy industry in Denmark and Germany that we have demonstrated in the previous sections, the UK’s taxation ratio has been relatively low and stable since the 1990s.
Therefore, compared with the taxation of the energy industry in Denmark and Germany, the UK’s taxation ratio has been relatively low and stable since the 1990s. Additionally, as Figure 2 shows, to take the example of the year 2016, the proportion of taxation in the UK electricity price was significantly lower than Denmark and Germany. The tax ratios of non-household prices and household electricity prices in Denmark were 35% and 64%, respectively. The tax ratios of these two indicators in Germany were 47% and 53%, respectively. In contrast, in the UK, the proportion of taxes on non-household prices and household prices in 2016 was only 4% and 5%.
The relatively low VAT and VAT for energy since the 1990s inherited Margaret Thatcher’s libertarian free-market reforms that began in 1979. It went through the John Major government (1990–1997, Conservative Party), the Tony Blair and Gordon Brown governments (1997–2010, Labor Party), and the Conservative government after 2010. From 1994 to 2010, the UK’s VAT remained in the range of 15−17.5%, although it has risen to 20% since 2011. It is worth mentioning that Tony Blair’s Labor government, which implemented his “Third Way” proposal, further reduced the VAT on energy after winning the general election in 1997 from 8% to 5% [63].
4.4.4. State Subsidies, Price Control, and Tariffs
Like the situation in Denmark and Germany, the UK also has subsidies and tariffs for RE-related fields. However, the UK’s policy direction has moved from a relatively market-oriented approach to a more subsidies and tariff-oriented path. These policies are a retrogression. As of 2019, the UK has around 5 million households on regulated prices with several types of price caps in place. [62]. These price caps have harmed the energy market’s price coordination. Take the example of the carbon price floor (CPF). It is a means of subsidy by the UK government through price control. Through the CPF, the UK government artificially makes the profit of coal lower than gas for power generation. Through such measures, people are encouraged to use non-coal energy. The CPS was set at GBP£ 4.94 per ton of carbon dioxide-equivalent (GBP/tCO2) for 2013/14. In the subsequent years, the price of CPF increased year by year. Since 2016, due to competitiveness concerns (despite the initial intention to raise the CPF to 30 GBP/tCO2 in 2020 and 70 GBP/tCO2 in 2030), the UK government has frozen the CPS rate at 18.08 GBP/tCO2 until 2020/21 [62].
Although the artificially set CPF means that the UK government is aware to a certain extent that the regulation of energy prices will distort the price coordination of the market, it still implemented a new price freeze in recent years. Since April 2017, a price cap for customers on prepayment meters (PPMs), the so-called safeguard tariff, was put in place. The PPMs covered around 4 million customers. It was extended by Ofgem (Office of Gas and Electricity Markets) in February 2018 to include another million customers defined as “vulnerable” as they were below the official poverty line. Eight months later, the UK government increased the tariff. From October 2018, the so-called safeguard tariff level was raised by GBP£ 47 per year for dual fuel customers to GBP£ 1136. In 2019, 11 million households were under a price cap [62]. In 2019, there were a total of 27.9 million households in the UK [71].
Therefore, British households receiving PPMs accounted for nearly 40% of the total number of households in the UK. From the perspective of the number of households, PPMs have a wide-ranging impact on the intervention of British household energy prices. However, even though the British government is aware of the distortions of PPMs on the energy market price coordination, its position remains fragile. Although the planned temporary tariff cap was designed to expire in 2020, it also maintained the possibility of a one-year extension period for up to three years [62]. In other words, the UK government’s plan for the abolition of PPMs is just an ex-ante soft constraint. The UK government can continue the distortion of energy prices by PPMs for various reasons at any time.
4.4.5. State Industrial Access Restrictions: A Severe Problem
State industrial access restrictions might be one of the most severe problems of the UK’s RE policies. For example, before 2014, due to state regulations, only eight major electricity power generators had been providing three-quarters of the metered volume in the UK [62]. Therefore, it is difficult for small companies to enter the power generation industry.
Comparing the situation in Germany and Nordic countries, the liquidity of energy companies in the UK is worse than in Germany but better than in Nordic countries. In the case of the electricity industry, in 2018, there were 170 licensed electricity generators and 73 active suppliers active in the UK’s electricity market. Previous research calculated the liquid rates of licensed energy companies in the UK, Germany, and the Nordic countries as 3.7, 14.6, and 3.9, respectively [62,72]. Therefore, the industrial access restrictions make the UK’s energy market less competitive than the German and = Nordic markets. The high liquidity of the German electricity industry is due to fewer industry access restrictions. In contrast, the industry access restrictions in the UK and Nordic countries are similar (i.e., license, government industry access review, etc.). As we have demonstrated above, Nordic countries, such as Denmark, have higher taxes on the energy retail industry. The average tax rate for households and non-households in 2016 is 49.5% (see Figure 2). In contrast, since 1994, the British energy tax rate has been maintained at the range of 5–8%. Therefore, in terms of taxation and licenses, licenses rather than taxes on the energy industry have a more significant negative impact on access to the UK energy industry.
The UK government has been aware of the negative impacts of industry access restrictions on electricity generators’ market competition. In 2014, the UK government introduced a policy requiring the eight large generators to provide better access to hedging products for smaller energy companies to enter the market. [62]. This policy reduced the state industrial access restrictions. However, because the market was not fully liberalized, the entry of small businesses is still not high. After Ofgem introduced a simplified “License Lite” in 2015 to reduce the market entry barriers, as of 2020, no small energy suppler has reached a 5% market share [62]. In addition, several new entrants have not sustained their business and exited the market [62]. In 2018, seven small suppliers only had a wholesale market share of between 1% and 5%, and another 60 small suppliers have a share below 1% [73].
In terms of electricity consumers, households and industrial consumers in the UK face a high cost for switching electricity suppliers. As of 2019, the UK has around 5 million households on state regulated prices with several types of price regulations [62]. To solve the high-cost problem, the UK Competition and Markets Authority (CMA) asked electricity suppliers to stop locking firms into auto-renewable rollover contracts from June 2017 to improve small businesses’ retail market [62]. Hence, suppliers can no longer charge exit fees or include no-exit clauses in automatic rollovers. Previous switching arrangements that developed in the late 1990s were complex [62]. They took around 20 days to apply and can lead to delays, errors, and costs [62]. The reformed UK electricity retail market has been delivering faster, more reliable switching for consumers [62]. As the current switching rates of 20% are relatively high by international comparison, it is very promising for the future [62].
As a result, an abrupt increase in the number of RE cooperatives occurred from 2010 to 2015. It is crucial to highlight the market institution’s appropriate functioning through the UK’s instruments. Although the energy institutions have some bloated and centralized bureaucratic decision-making structures, the RE transition participants operate in an entrepreneurship-based, decentralized manner. As an example, the use of CFDs (Contract for Difference) since 2016 through competitive auctions have proven to be very positive as a market instrument in reducing prices and costs [62] (p. 105).
Further, the UK government started seeking companies willing and able to provide RE supplies to enter the UK through auctions internationally. Thus, despite the state-regulated auction, price coordination still functioned in a limited space. The British energy enterprises have demonstrated their willingness through bidding instead of the government’s direct operation or monopoly grant. Therefore, it benefited consumers with more and innovative services at a relatively low price [62].
4.4.6. Policy Defects and Reform Agenda
From the perspective of free-market environmentalism, the above reforms are still insufficient as the administrative monopoly threshold for consumer access exists. If the UK wants to increase competition in the electricity industry, it must eliminate any government-set costs for consumers to switch electricity suppliers. Even state intervened auctions should be transferred to pure market-based institutions. The government’s bidding process is still an infringement on private property rights. As a form of industry access restriction, it excludes other potential companies from entering, leading to a mandatory reduction in consumer choice. When the British government completely removes price restrictions, energy entrepreneurs can interact more directly with household consumers and industrial consumers. Under consumer sovereignty, both energy suppliers and demanders can find acceptable prices for both parties. Any administrative monopoly is an infringement on consumer sovereignty [74,75,76,77,78,79,80]. Only when consumers can fully play a role will the electricity industry be able to focus on serving consumers to improve their energy products, especially the services of RE products increasingly being valued by consumers. It is the sovereignty of consumers, not the government’s administrative monopoly, that determines the dynamic efficiency of the power industry in RE development.
Moreover, since the second decade of the 21st century, the UK government has increased subsidies and tariffs in the energy industry. From the perspective of free-market environmentalism, this is a policy retrogression. Policymakers in the UK should strengthen their understanding of free-market environmentalism. They should abolish CPF, PPMs, and any other kind of subsidies or tariffs as soon as possible. This way, entrepreneurship and market price coordination can take effect more sufficiently.
In general, as the UK government has recognized the role of the market in RE development [81], any inefficient and redundant regulatory state institution like the CMA should be eliminated. Further, no more government regulatory agencies should be added by concocting various pretexts. They obstruct the energy market’s coordination, especially between electricity suppliers and RE.
5. Conclusions
Based on the review of the theoretical principles of free-market environmentalism, this paper has originally provided an empirical study of how Germany, Denmark, and the UK partly conduct free-market-oriented policies to successfully achieve their policy goal of broader use of RE since the 1990s.
The paper’s empirical results show that in 28 years, from 1990 to 2018, all three countries have shown positive features in their respective RE transitions. This tendency is especially evident for the increasing trend in the share of RE in gross electricity production and gross available energy and the decreasing trend in GHG emissions. However, as the supply of RE increased, the prices of electricity in the three countries did not show the same downward trend. This result alters the traditional view on these countries’ energy transitions, with the UK being more successful in a critical aspect of any energy transition: affordability.
Simultaneously, by measuring the specific data on taxation, state subsidies, and industrial access restrictions in the three sampled countries, we pointed out how these interventionist and regulation policies have caused damage to the three countries’ RE transition goals. Given free-market environmentalism, the cases of Germany and Denmark serve to illustrate how vital the entrepreneurship-based bottom-up forces (led by organizations and entrepreneurs in the form of RE cooperatives) are for the relative success of an energy transition. The German experience emphasizes political decentralization for decision-making and a certain freedom in the RE market. Inside this framework, a wide range of decentralized initiatives still thrive. This policy is the reason for the country’s energy transition success. However, there are distorting effects of government intervention, such as high electricity prices. They are caused by taxes, subsidies, and industry access restrictions. In general, Germany’s energy prices are not entirely market-oriented but are taxed and subsidized by the German government. As we have pointed out above, Germany’s energy prices are artificially high due to the FIT system. Therefore, Germany cannot be considered an ideal sample of free-market environmentalism. As previous research indicated, we also suggest Germany reduce the degrees of the above three interventionist policies as best as possible to enhance RE production and reduce electricity and RE prices.
Like the German case, the Danish energy policy has not wholly followed the principles of free-market environmentalism due to taxes, subsidies, and industry access restrictions. Denmark’s high electricity prices are due to high production costs and high taxes. As a result, Denmark faces a tough challenge to achieve an efficient and affordable RE transition concerning electricity prices. As previous research indicated, we also suggest Denmark should conduct tax reduction for its RE industry and eliminate state subsidies and industry access restrictions. However, despite the above policy deficiencies, Denmark is managing a RE transition due to the essential roles of decentralized local organizations and entrepreneurial activities. Moreover, more market-based RE innovation has created more jobs and reduced more GHG emissions since 1990. Even the literature that was not in favor of free-market environmentalism also acknowledged the Danish success in RE transition and its community and entrepreneurship-based characters [23].
On the other hand, compared with Germany and Denmark, the UK has maintained a relatively low energy tax rate and opted for more pro-market measures since the Hayekian-Thatcherism free-market reform of 1979. Fredrich A. Hayek’s theories have strongly impacted its energy liberalization reform agenda since then. Low taxes on the energy industry and electricity have alleviated the burden on electricity enterprises and consumers. Electricity prices have remained relatively low since 1990. However, interventionist policies such as state-regulated auctions and industry access restrictions have obstructed its energy transition. Moreover, RE policies are not as decentralized as Germany and Denmark, although RE innovation has increased in the three countries. Despite not having a purely free-market environmentalist energy policy, the UK has come closer to free-market environmentalism than the other two countries. Contrary to what some literature posits, the UK is achieving energy transition at a good pace, even beating Germany and Denmark by containing the rise in electricity prices. Therefore, with less intervention in the future, a better conducted RE market process could provide better conditions for British RE development.
Thus, during the post-COVID-19 era, to attain economic recovery and achieve a more advanced level of RE and protect the environment, it is essential to respect the principles of private property rights and free-market price coordination to acquire more and better RE. Hence, EU policymakers should adopt its RE policy from the perspective of free-market environmentalism to conduct better entrepreneurship for RE. Government RE’s intervention-regulation policies such as taxation, subsidies, and industry restrictions infringe on private property rights and cause economic discoordination and zero-sum games. Moreover, although the UK has not been an EU member since Brexit, its precious and successful experience of energy liberalization since the 1979 Hayekian-Thatcherism free-market energy reform could help other European countries to achieve better RE production and affordable energy prices. The UK experience and the free-market environmentalist policies that Germany and Denmark conduct could help other countries globally. Additionally, the empirical results in this paper show that the result of free-market environmentalism should be implemented over a long period. Policymakers should perceive that the free-market environmentalist policy approach and the entrepreneurial production of RE take time. Any interventionist eager for quick success may reverse the policy results. Hence, respecting entrepreneurship and reducing state intervention or regulation as much as possible is what global policymakers should execute during the post-COVID-19 era for a better energy transition.
Author Contributions
Conceptualization, W.H.W., V.M.-C. and J.H.d.S.; methodology, W.H.W., V.M.-C. and J.H.d.S.; software, W.H.W. and V.M.-C.; validation, W.H.W. and V.M.-C.; formal analysis, W.H.W. and V.M.-C.; investigation, W.H.W. and V.M.-C.; resources, W.H.W. and V.M.-C.; data curation, W.H.W. and V.M.-C.; writing—original draft preparation, W.H.W. and V.M.-C.; writing—review and editing, W.H.W., V.M.-C. and J.H.d.S.; visualization, W.H.W. and V.M.-C.; supervision, W.H.W. and J.H.d.S.; project administration, W.H.W.; funding acquisition, J.H.d.S. All authors have read and agreed to the published version of the manuscript.
Funding
This research received no external funding.
Data Availability Statement
The data presented in this study are openly available in Mendeley Data at doi reference number 10.17632/9p667yzdg9.1.
Acknowledgments
We thank Ariel Palomino for providing some initial information on the UK’s electricity liberalization.
Conflicts of Interest
The authors declare no conflict of interest.
References
- European Commission. A European Green Deal. Available online: https://ec.europa.eu/info/strategy/priorities-2019-2024/european-green-deal_en (accessed on 1 January 2021).
- European Commission. The European Commission’s Priorities. Available online: https://ec.europa.eu/info/sites/default/files/brexit_files/info_site/energy_origin_en.pdf (accessed on 1 January 2021).
- European Commission. Investing in a Climate-Neutral and Circular Economy: The European Green Deal; European Union: Brussels, Belgium, 2020. [Google Scholar]
- Brooks, E.; Bürgin, A. Political steering in the European Commission: A comparison of the energy and health sectors. J. Eur. Integr. 2020. [Google Scholar] [CrossRef]
- Bürgin, A. The impact of Juncker’s reorganization of the European Commission on the internal policy-making process: Evidence from the Energy Union project. In Proceedings of the Public Administration; John Wiley & Sons, Ltd.: Hoboken, NJ, USA, 2020; Volume 98, pp. 378–391. [Google Scholar]
- Oberthür, S. Hard or Soft Governance? The EU’s Climate and Energy Policy Framework for 2030. Polit. Gov. 2019, 7, 17–27. [Google Scholar] [CrossRef] [Green Version]
- Regulation of the European Parliament and of the Council Establishing the Framework for Achieving Climate Neutrality and Amending Regulation (EU) 2018/1999 (European Climate Law); European Parliament: Brussels, Belgium, 2020.
- European Commission. Powering a Climate-Neutral Economy: An EU Strategy for Energy System Integration; European Commission: Brussels, Belgium, 2020. [Google Scholar]
- Energy Union|Energy. Available online: https://ec.europa.eu/energy/topics/energy-strategy/energy-union_en (accessed on 18 July 2021).
- European Commission. Impact Assessment: Stepping up Europe’s 2030 Climate Ambition. Investing in a Climate-Neutral Future for the Benefit of Our People; European Commission: Brussels, Belgium, 2020. [Google Scholar]
- von Mises, L. Socialism: An Economic and Sociological Analysis; Liberty Fund: Indianapolis, IN, USA, 2012. [Google Scholar]
- Hayek, F.A. The Use of Knowledge in Society. Am. Econ. Rev. 1945, 35, 519–530. [Google Scholar]
- Huerta de Soto, J. Socialism, Economic Calculation and Entrepreneurship; Edward Elgar Publishing: Cheltenham, UK, 2010. [Google Scholar]
- Block, W. Environmentalism and economic freedom: The case for private property rights. J. Bus. Ethics 1998, 17, 1887–1899. [Google Scholar] [CrossRef]
- Anderson, T.L.; Baden, J.; Block, W.; Borcherding, T.; Chant, J.; Dolan, E.; McFetridge, D.; Rothbard, M.N.; Smith, D.; Shaw, J.; et al. Economics and the Environment: A Reconciliation; Block, W., Ed.; The Fraser Institute: Vancouver, BC, Canada, 1990. [Google Scholar]
- Anderson, T.L.; Leal, D.R. Free Market Environmentalism Revised Edition; Palgrave Macmillan: New York, NY, USA, 2001. [Google Scholar]
- Huerta de Soto, J. Entrepreneurship and the theory of free market environmentalism. In The Theory of Dynamic Efficiency; Routledge: New York, NY, USA, 2009; pp. 94–99. [Google Scholar]
- Cordato, R. Toward an austrian theory of environmental economics. Q. J. Austrian Econ. 2004, 7, 3–16. [Google Scholar] [CrossRef]
- Bradley, R.L. Resourceship: An Austrian theory of mineral resources. Rev. Austrian Econ. 2007, 20, 63–90. [Google Scholar] [CrossRef]
- European Commission. Clean Energy. The European Green Deal; European Commission: Brussels, Belgium, 2019. [Google Scholar]
- NC Sustainable Energy Association What Is Clean Energy. Available online: https://energync.org/what-is-clean-energy (accessed on 1 January 2021).
- Meyer, N.I. Renewable energy policy in Denmark. Energy Sustain. Dev. 2004, 8, 25–35. [Google Scholar] [CrossRef]
- Lipp, J. Lessons for effective renewable electricity policy from Denmark, Germany and the United Kingdom. Energy Policy 2007, 35, 5481–5495. [Google Scholar] [CrossRef]
- Kirzner, I.M. Competition and Entrepreneurship; Boettke, P.J., Sautet, F., Eds.; Liberty Fund: Indianapolis, IN, USA, 2013. [Google Scholar]
- Langlois, R.N. The Austrian theory of the firm: Retrospect and prospect. Rev. Austrian Econ. 2013, 26, 247–258. [Google Scholar] [CrossRef]
- Klein, P.G. The Capitalist & the Entrepreneur: Essays on Organizations & Markets; Ludwig von Mises Institute: Auburn, AL, USA, 2010. [Google Scholar]
- Rothbard, M.N. Law, Property Rights, and Air Pollution. Cato J. 1982, 2, 55–99. [Google Scholar]
- Reimers, P. Monarchy, Democracy and Private Property Order How Human Rights Have Been Violated and How to Protect Them a Response to Hans H Hoppe, F A Hayek, and Elinor Ostrom. Rev. Procesos Merc. 2019, 16, 177–212. [Google Scholar] [CrossRef]
- Fuller, E.W. The Non-Aggression Principle: A Short History. Rev. Procesos Merc. 2019, 16, 31–88. [Google Scholar] [CrossRef]
- Reimers, P. An Austrian School View on Eucken’s Ordoliberalism. Analyzing the Roots and Concept of German Ordoliberalism from the Perspective of Austrian School Economics. Rev. Procesos Merc. 2020, 17, 13–53. [Google Scholar] [CrossRef]
- Espinosa, V.I.; Wang, W.H.; Zhu, H. Israel Kirzner on Dynamic Efficiency and Economic Development. Procesos Merc. Rev. Eur. Econ. Política 2020, 17, 283–310. [Google Scholar]
- Kämpe, J. Individual secession and extraterritoriality. Rev. Procesos Merc. 2013, 10, 195–239. [Google Scholar] [CrossRef]
- Hoppe, H.-H. A Realistic Libertarianism. Rev. Procesos Merc. 2015, 12, 203–229. [Google Scholar] [CrossRef]
- Mises, L. von Human Action: A Treatise on Economics; Ludwig von Mises Institute: Auburn, AL, USA, 1998. [Google Scholar]
- Foss, N.J.; Klein, P.G. Organizing Entrepreneurial Judgment: A New Approach to the Firm; Cambridge University Press: Cambridge, UK, 2012; ISBN 9781139021173. [Google Scholar]
- Merino, J.B. Teoría del intercambio. Propuesta de una nueva teoría de los cambios interpersonales basada en tres elementos más simples. Rev. Procesos Merc. 2015, 12, 143–176. [Google Scholar] [CrossRef]
- Boettke, P.J.; Coyne, C.J.; Leeson, P.T. Institutional Stickiness and the New Development Economics. Am. J. Econ. Sociol. 2008, 67, 331–358. [Google Scholar] [CrossRef] [Green Version]
- Boettke, P. Economics and Public Administration. South. Econ. J. 2018, 84, 938–959. [Google Scholar] [CrossRef]
- Contreras, A.E. Una aproximación praxeológica a la energía. Rev. Procesos Merc. 2011, 8, 113–149. [Google Scholar] [CrossRef]
- Álvarez, G.C.; Jara, R.M.J.; Julián, J.R.R.; Bielsa, J.I.G. Study of the effects on employment of public aid to renewable energy sources. Rev. Procesos Merc. 2010, 7, 13–70. [Google Scholar] [CrossRef]
- Peña-Ramos, J.A.; del Pino-García, M.; Sánchez-Bayón, A. The Spanish Energy Transition into the EU Green Deal: Alignments and Paradoxes. Energies 2021, 14, 2535. [Google Scholar] [CrossRef]
- Solorio, I.; Jörgens, H. The EU and the promotion of renewable energy: An analytical framework. In A Guide to EU Renewable Energy Policy: Comparing Europeanization and Domestic Policy Change in EU Member States; Edward Elgar Publishing: Cheltenham, UK, 2017. [Google Scholar]
- Börzel, T.A.; Risse, T. When Europe Hits Home: Europeanization and Domestic Change. Eur. Integr. Online Pap. 2000, 4. [Google Scholar] [CrossRef] [Green Version]
- Hoppe, T.; van Bueren, E. From frontrunner to laggard: The Netherlands and Europeanization in the cases of RES-E and biofuel stimulation. In A Guide to EU Renewable Energy Policy: Comparing Europeanization and Domestic Policy Change in EU Member States; Solorio, I., Jörgens, H., Eds.; Edward Elgar Publishing: Cheltenham, UK, 2017; pp. 65–84. [Google Scholar]
- Bechberger, M.; Hirschl, B.; Ohlhorst, D.; Vogelpohl, T. German renewable energy policy—Independent pioneering versus creeping Europeanization? In A guide to EU Renewable Energy Policy: Comparing Europeanization and Domestic Policy Change in EU Member States; Solorio, I., Jörgens, H., Eds.; Edward Elgar Publishing: Cheltenham, UK, 2017; pp. 45–64. ISBN 978-1-78347-1553. [Google Scholar]
- Bechberger, M.; Reiche, D. Renewable energy policy in Germany: Pioneering and exemplary regulations. Energy Sustain. Dev. 2004, 8, 47–57. [Google Scholar] [CrossRef]
- Gawel, E.; Lehmann, P.; Korte, K.; Strunz, S.; Bovet, J.; Köck, W.; Massier, P.; Löschel, A.; Schober, D.; Ohlhorst, D.; et al. Energy, Sustainability and Society; Springer: Berlin/Heidelberg, Germany, 2014; pp. 1–9. [Google Scholar]
- Renn, O.; Marshall, J.P. Coal, nuclear and renewable energy policies in Germany: From the 1950s to the “Energiewende”. Energy Policy 2016, 99, 224–232. [Google Scholar] [CrossRef]
- Rahman, M.M.; Saat, A.; Wahid, M.A. Renewable energy policy in Germany and Malasya: Success factors. In Proceedings of the 2016 Internacional Conference on Industrial Engineering and Operations Management, Kuala Lumpur, Malaysia, 8–10 March 2016. [Google Scholar]
- Pegels, A.; Lütkenhorst, W. Is Germany’s energy transition a case of successful green industrial policy? Contrasting wind and solar PV. Energy Policy 2014, 74, 522–534. [Google Scholar] [CrossRef] [Green Version]
- Haas, T. Comparing energy transitions in Germany and Spain using a political economy perspective. Environ. Innov. Soc. Transit. 2019, 31, 200–210. [Google Scholar] [CrossRef]
- Oteman, M.; Wiering, M.; Helderman, J.K. The institutional space of community initiatives for renewable energy: A comparative case study of the Netherlands, Germany and Denmark. Energy. Sustain. Soc. 2014, 4, 1–17. [Google Scholar] [CrossRef] [Green Version]
- Matthes, F.C. Energy transition in Germany: A case study on a policy-driven structural change of the energy system. Evol. Inst. Econ. Rev. 2017, 14, 141–169. [Google Scholar] [CrossRef]
- Mey, F.; Diesendorf, M. Who owns an energy transition? Strategic action fields and community wind energy in Denmark. Energy Res. Soc. Sci. 2018, 35, 108–117. [Google Scholar] [CrossRef]
- Dyrhauge, H. Denmark: A wind powered forerunner. In A Guide to EU Renewable Energy Policy: Comparing Europeanization and Domestic Policy Change in EU Member States; Solorio, I., Jörgens, H., Eds.; Edward Elgar Publishing: Cheltenham, UK, 2017; p. 103. ISBN 978-1783471553. [Google Scholar]
- Pearson, P.J.G.; Watson, J. UK Energy Policy 1980–2010: A history and lessons to be learned. The Parliamentary Group of Energy Studies: London, UK, 2012. [Google Scholar]
- Essletzbichler, J. Renewable Energy Technology and Path Creation: A Multi-scalar Approach to Energy Transition in the UK. Eur. Plan. Stud. 2012, 20, 791–816. [Google Scholar] [CrossRef]
- Mitchell, C.; Connor, P. Renewable energy policy in the UK 1990–2003. Energy Policy 2004, 32, 1935–1947. [Google Scholar] [CrossRef]
- Wierling, A.; Schwanitz, V.; Zeiß, J.; Bout, C.; Candelise, C.; Gilcrease, W.; Gregg, J. Statistical Evidence on the Role of Energy Cooperatives for the Energy Transition in European Countries. Sustainability 2018, 10, 3339. [Google Scholar] [CrossRef] [Green Version]
- IEA. Germany 2020; IEA: Paris, France, 2020. [Google Scholar]
- OECD; IEA. Energy Policies of IEA Countries: Denmark 2017 Review; IEA: Paris, France, 2017. [Google Scholar]
- IEA. Energy Policies of IEA Countries: United Kingdom 2019 Review; IEA: Paris, France, 2019. [Google Scholar]
- IEA. Energy Prices and Taxes for OECD Countries: Country Notes (4th Quarter 2020); IEA: Paris, France, 2020. [Google Scholar]
- Ministry of Climate Energy and Building. Accelerating Green Energy towards 2020: The Danish Energy Agreement of March 2012; Ministry of Climate Energy and Building: Copenhagen, Denmark, 2012.
- IEA. Energy Prices and Taxes, Third Quarter 2017; IEA: Paris, France, 2017. [Google Scholar]
- IEA. Next-Generation Wind and Solar Power: From Cost to Value; IEA: Paris, France, 2016. [Google Scholar]
- Danish Energy Regulatory Authority. National Report Denmark 2016; Danish Energy Regulatory Authority: Copenhagen, Denmark, 2016.
- Energy Commission. Energikommissionens Anbefalinger til Fremtidens Energipolitik. Afsluttende RAPPORT; Energy Commission: Copenhagen, Denmark, 2017. [Google Scholar]
- Statista Household Electricity Tax in Denmark 2009–2019. Available online: https://www.statista.com/statistics/1020870/household-electricity-tax-in-denmark (accessed on 1 January 2021).
- Huerta de Soto, J. A Hayekian strategy to implement free market reforms. In The Theory of Dynamic Efficiency; Routledge: New York, NY, USA, 2009; pp. 182–199. [Google Scholar]
- Families and Households in the UK. Available online: https://www.ons.gov.uk/peoplepopulationandcommunity/birthsdeathsandmarriages/families/bulletins/familiesandhouseholds/2019 (accessed on 1 January 2021).
- European Commission Notice to Stakeholders: Withdrawal of the United Kingdom and EU Rules in the Field of Guarantees of Origin of Electricity from Renewable Energy Sources. Available online: https://ec.europa.eu/energy/sites/ener/files/documents/notice_to_stakeholders_brexit_energy_origin_final.pdf (accessed on 1 January 2021).
- Office of Gas and Electricity Markets. State of the Energy Market; Office of Gas and Electricity Markets: London, UK, 2018.
- Rothbard, M.N. Man, Economy, and State with Power and Market; Ludwig von Mises Institute: Auburn, AL, USA, 2009. [Google Scholar]
- Cachanosky, I. En defensa del monopolio competitivo. Rev. Procesos Merc. 2020, 17, 233–264. [Google Scholar] [CrossRef]
- Cabrera, J.H. La desafiante idea de molinari: La defensa en régimen de libre competencia. Rev. Procesos Merc. 2015, 12, 199–235. [Google Scholar] [CrossRef]
- Boubeta, M.; Carreiro, Ó. El Debate Sobre La Inevitabilidad Del Estado: Notas Críticas Sobre Los Argumentos De Randall Holcombe. Rev. Procesos Merc. 2020, 17, 95–116. [Google Scholar] [CrossRef]
- González, F.H. Análisis de la regulación sectorial de telecomunicaciones desde la perspectiva de la Escuela Económica Austriaca. Rev. Procesos Merc. 2008, 5, 199–226. [Google Scholar] [CrossRef]
- Taboada, A.A. El papel del Estado en las guerras de cuarta generación bajo la óptica de la teoría de la eficiencia dinámica. Rev. Procesos Merc. 2017, 14, 13–50. [Google Scholar] [CrossRef]
- Cabrera, J.H. El papel económico del Estado: Una crítica. Rev. Procesos Merc. 2016, 13, 41–86. [Google Scholar] [CrossRef]
- Competition and Markets Authority. Energy Market Investigation: Final Report; Competition and Markets Authority: London, UK, 2016.
Figure 1.
Evolution of variables related to the RE transition in Germany, Denmark, and the UK in 1990–2018.
Figure 1.
Evolution of variables related to the RE transition in Germany, Denmark, and the UK in 1990–2018.

Figure 2.
Industry and household electricity prices and their taxation component in Germany, Denmark, and the UK, 2016. Source: our own elaboration from IEA [61].
Figure 2.
Industry and household electricity prices and their taxation component in Germany, Denmark, and the UK, 2016. Source: our own elaboration from IEA [61].

Figure 3.
Evolution of the tax burden on electricity prices in Germany from 1991 to 2019. Source: own calculations based on data from Eurostat.
Figure 3.
Evolution of the tax burden on electricity prices in Germany from 1991 to 2019. Source: own calculations based on data from Eurostat.

Figure 4.
Denmark’s household electricity taxation, 2009–2019. Source: Statista [69]. Notes: tax in DKK per kilowatt hour.
Figure 4.
Denmark’s household electricity taxation, 2009–2019. Source: Statista [69]. Notes: tax in DKK per kilowatt hour.


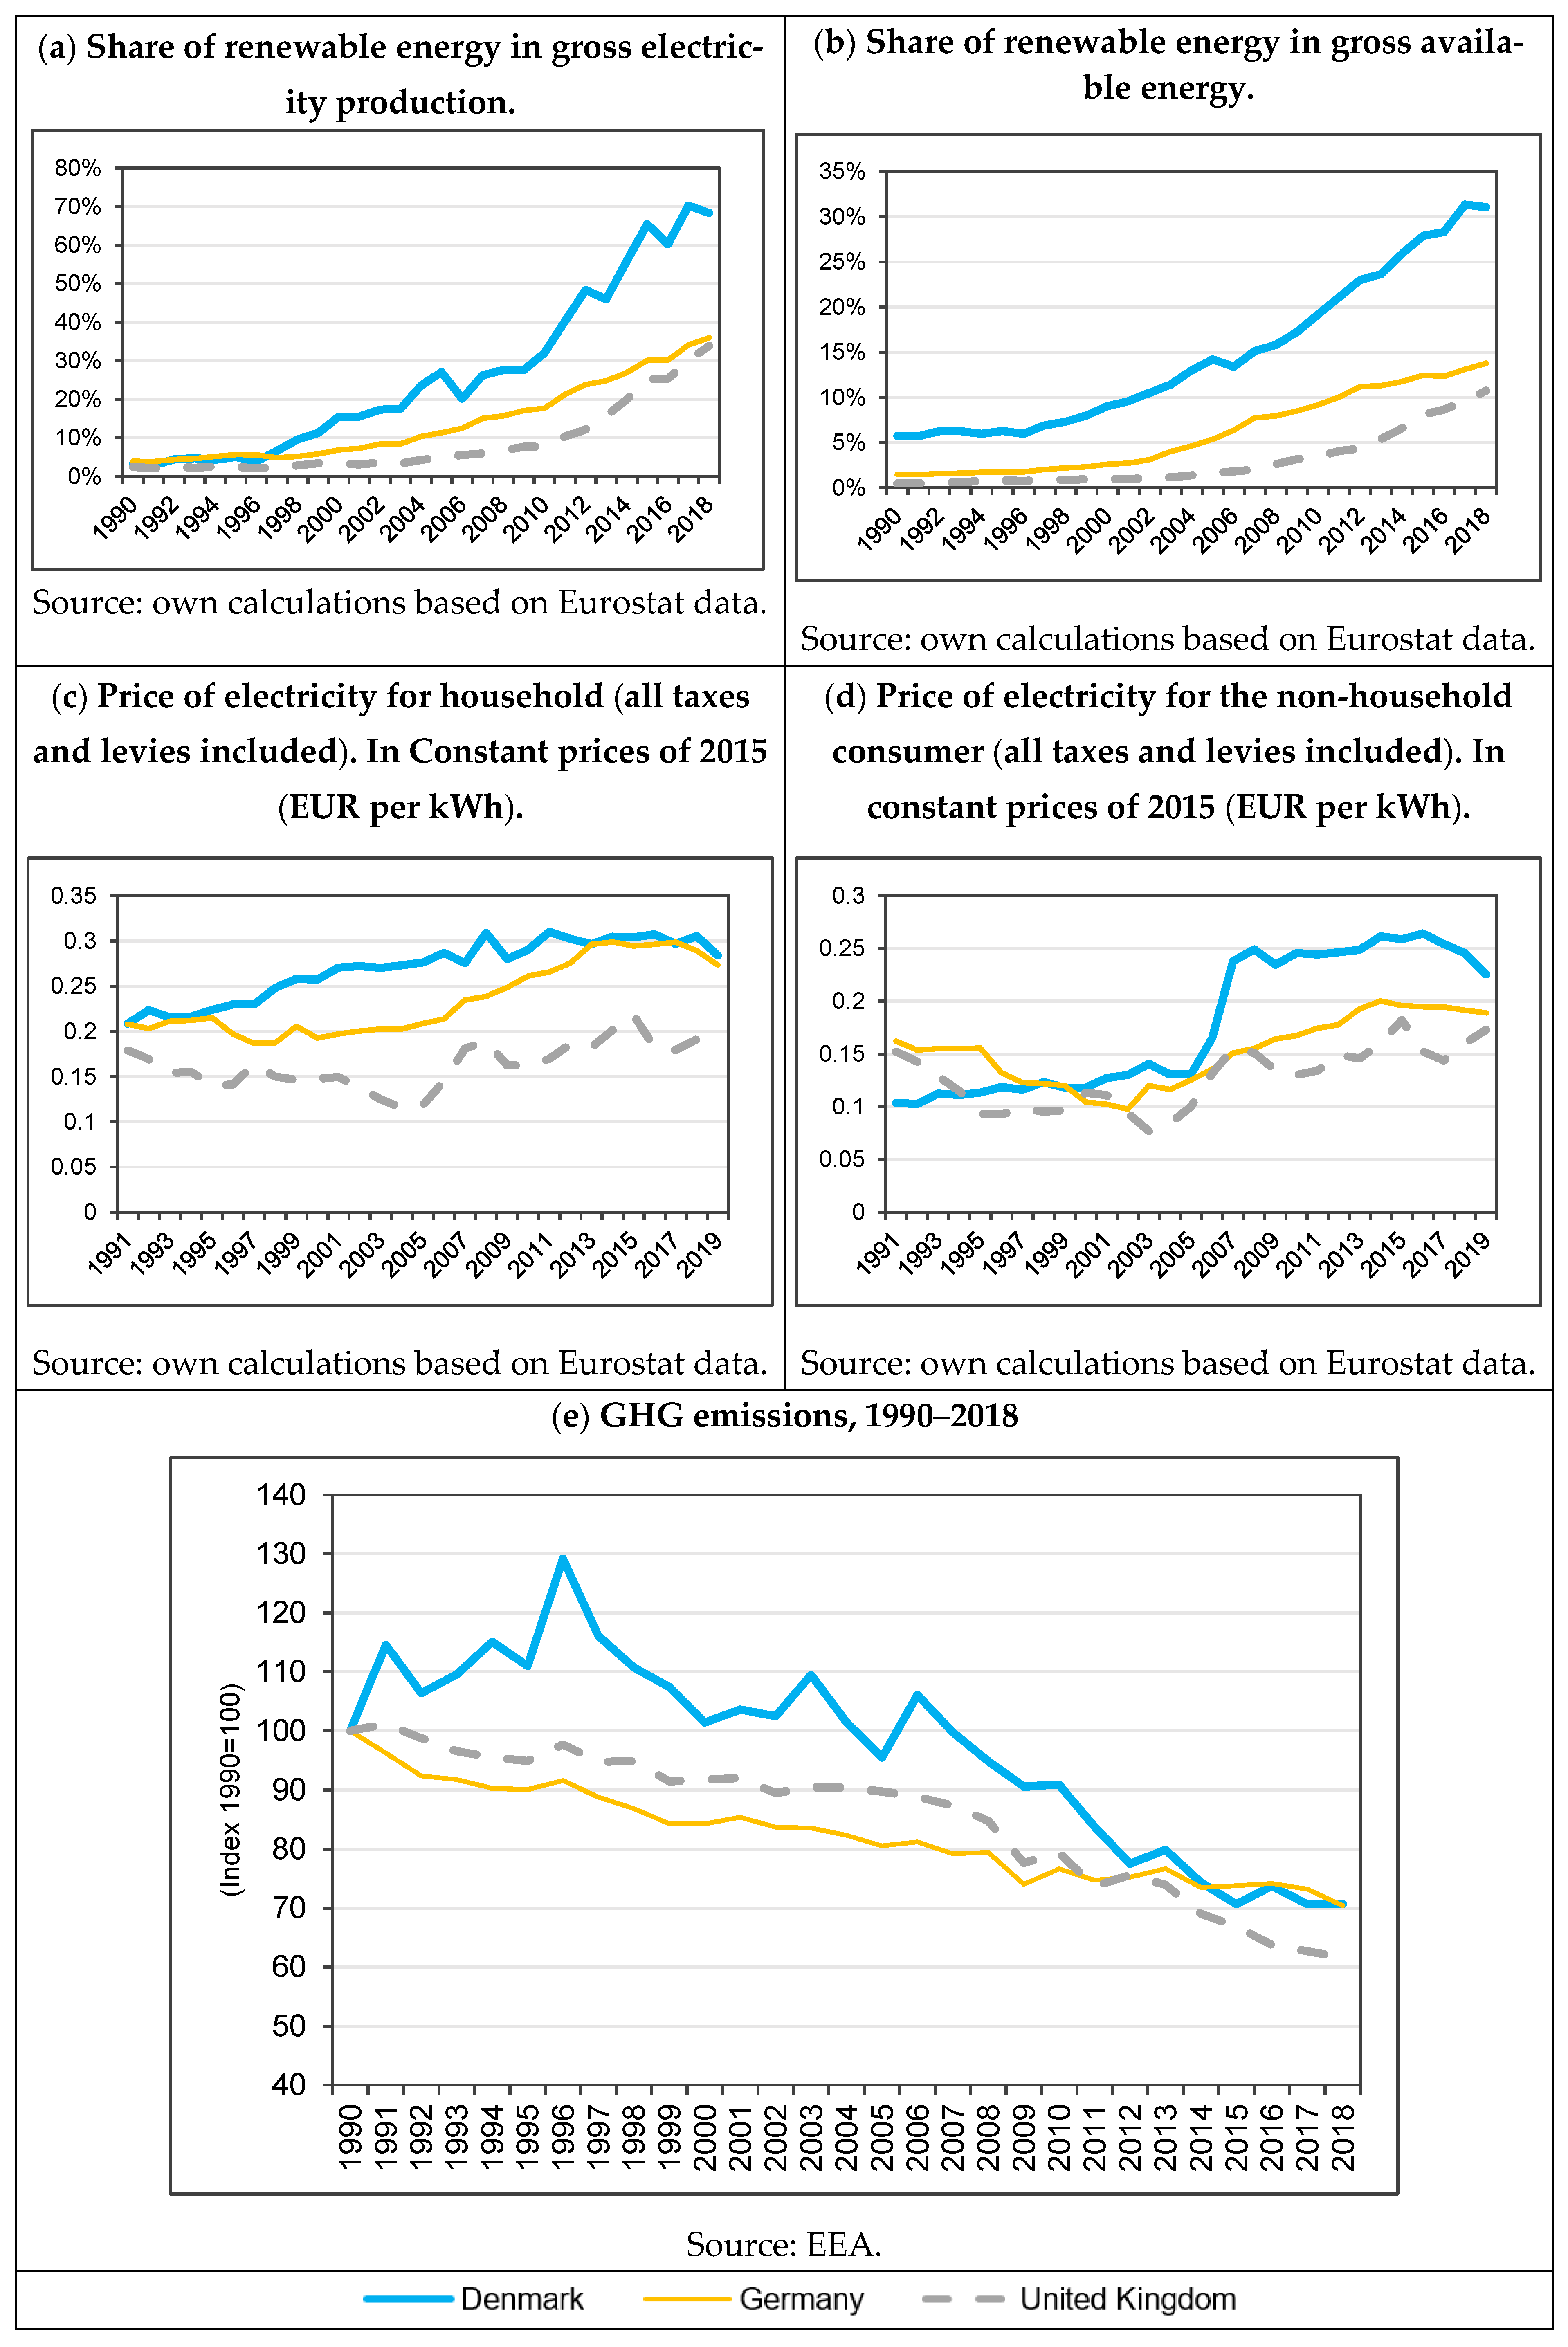
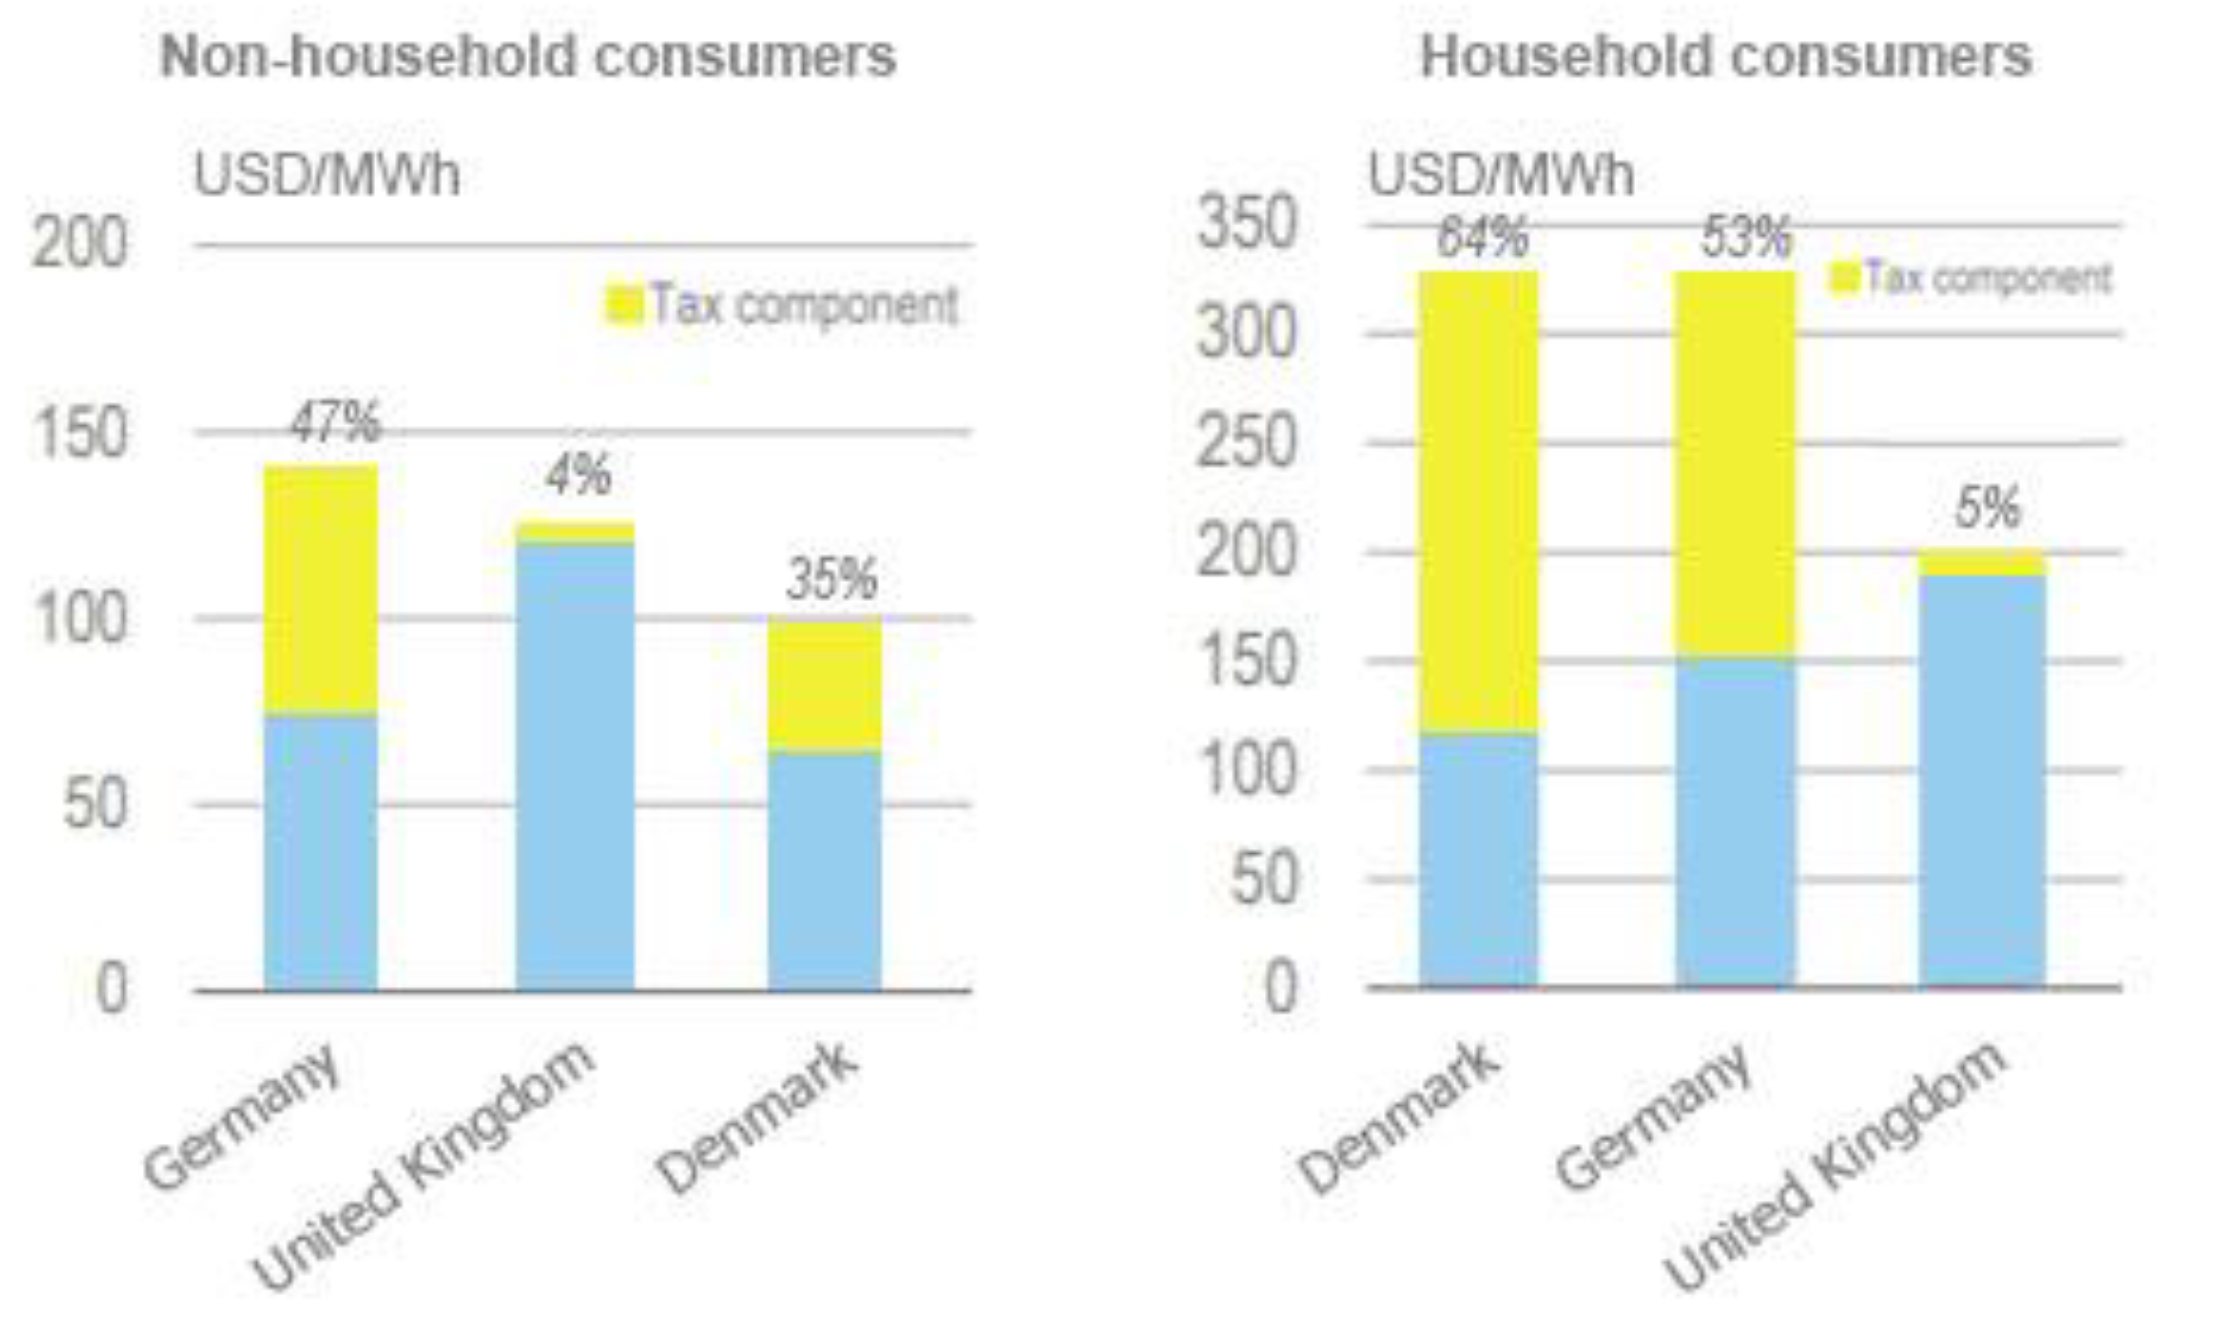
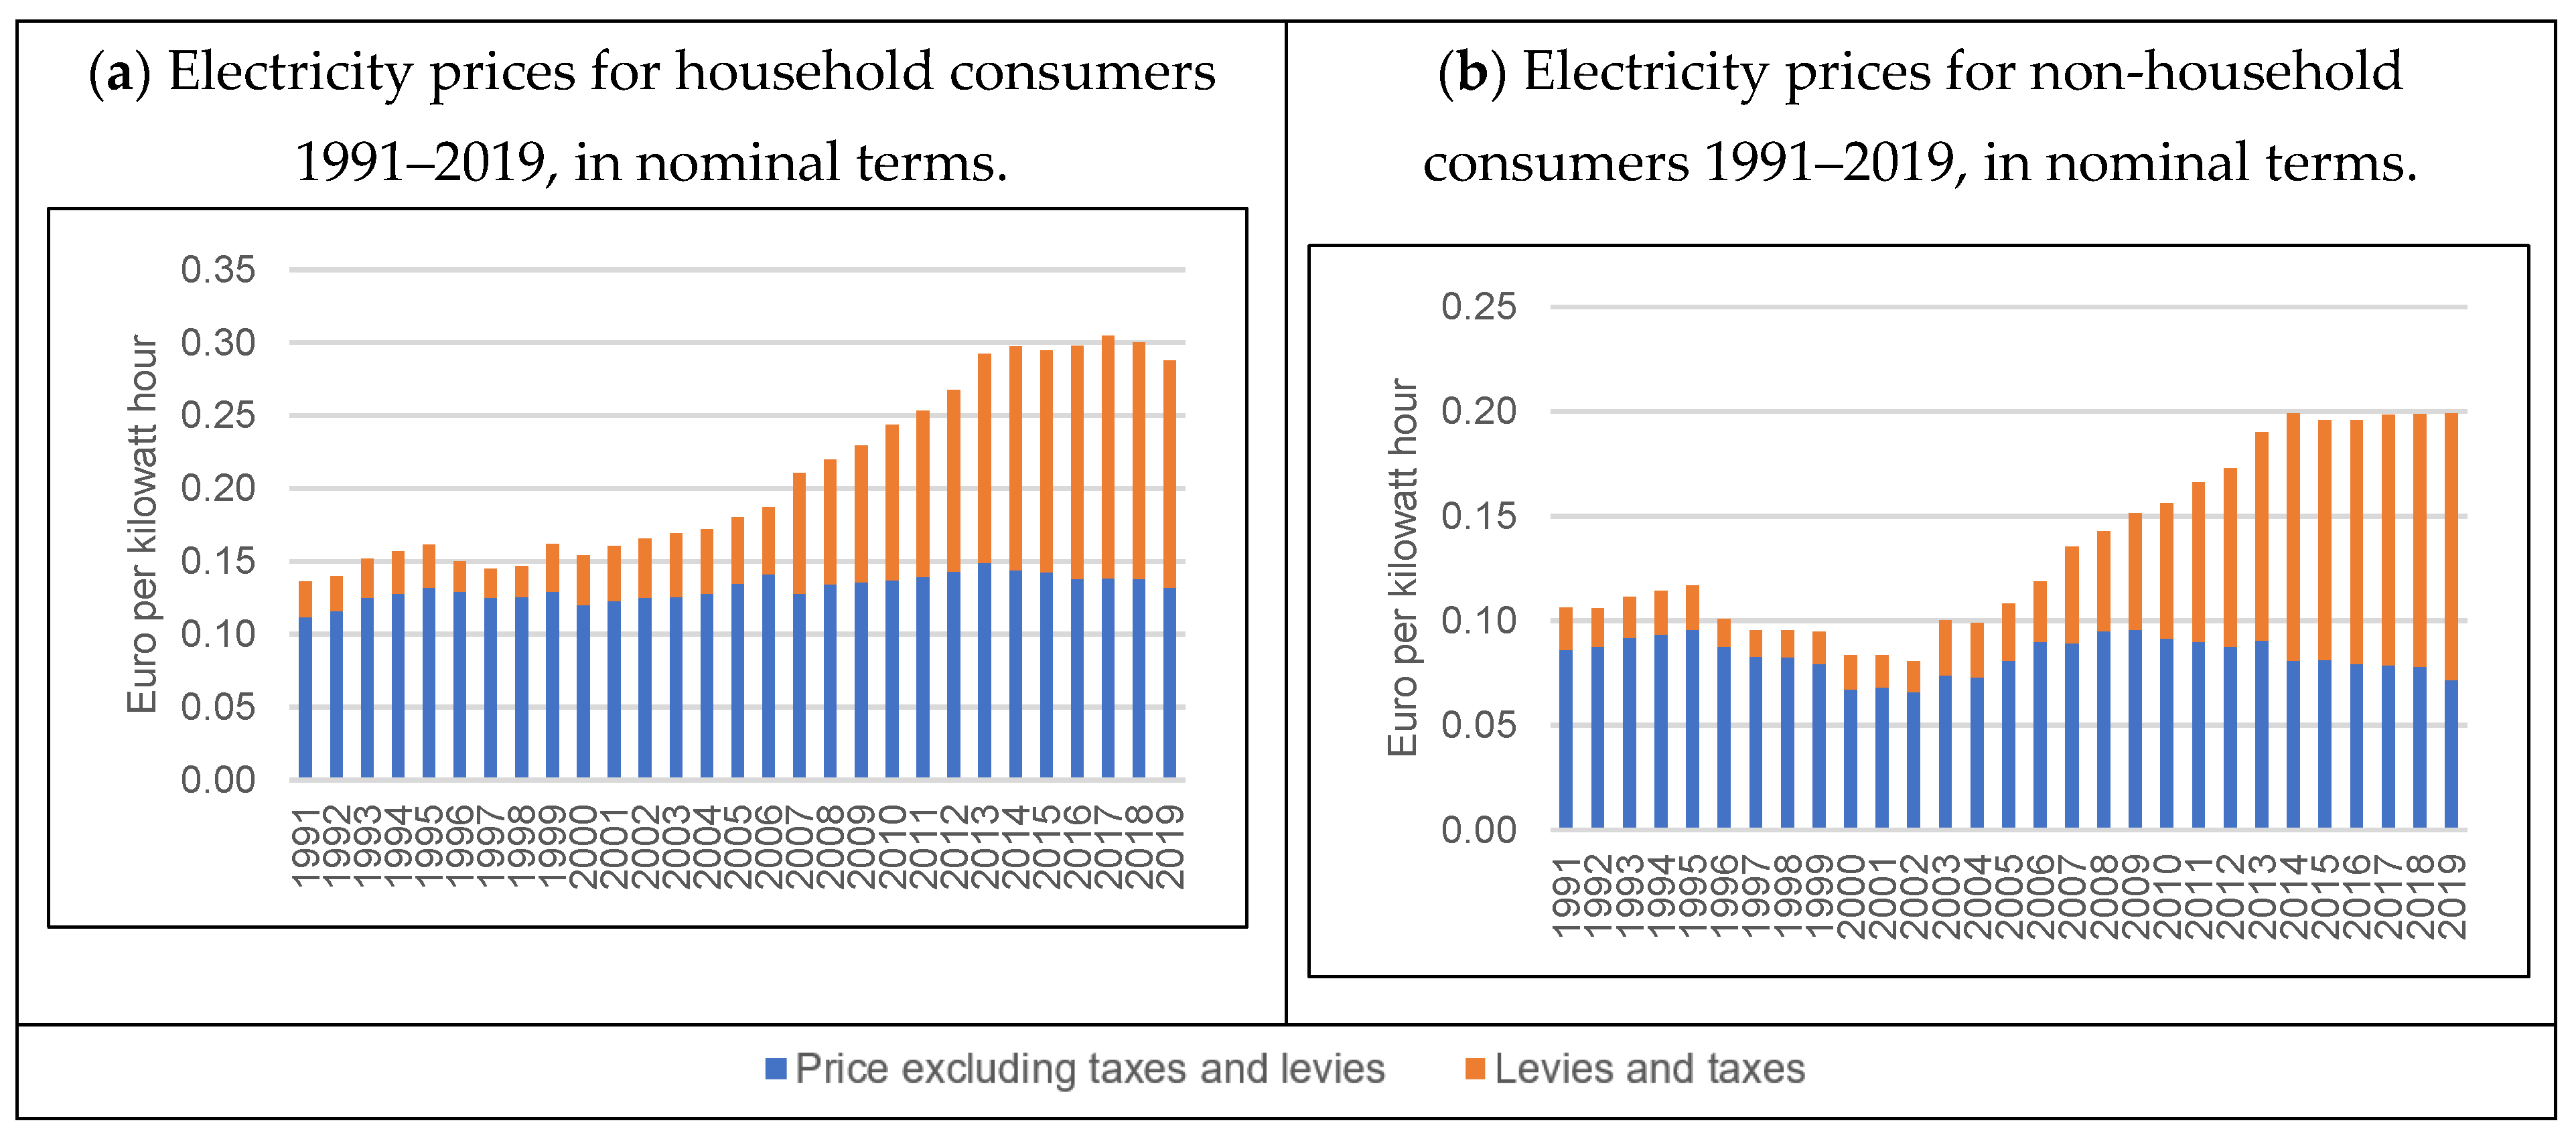
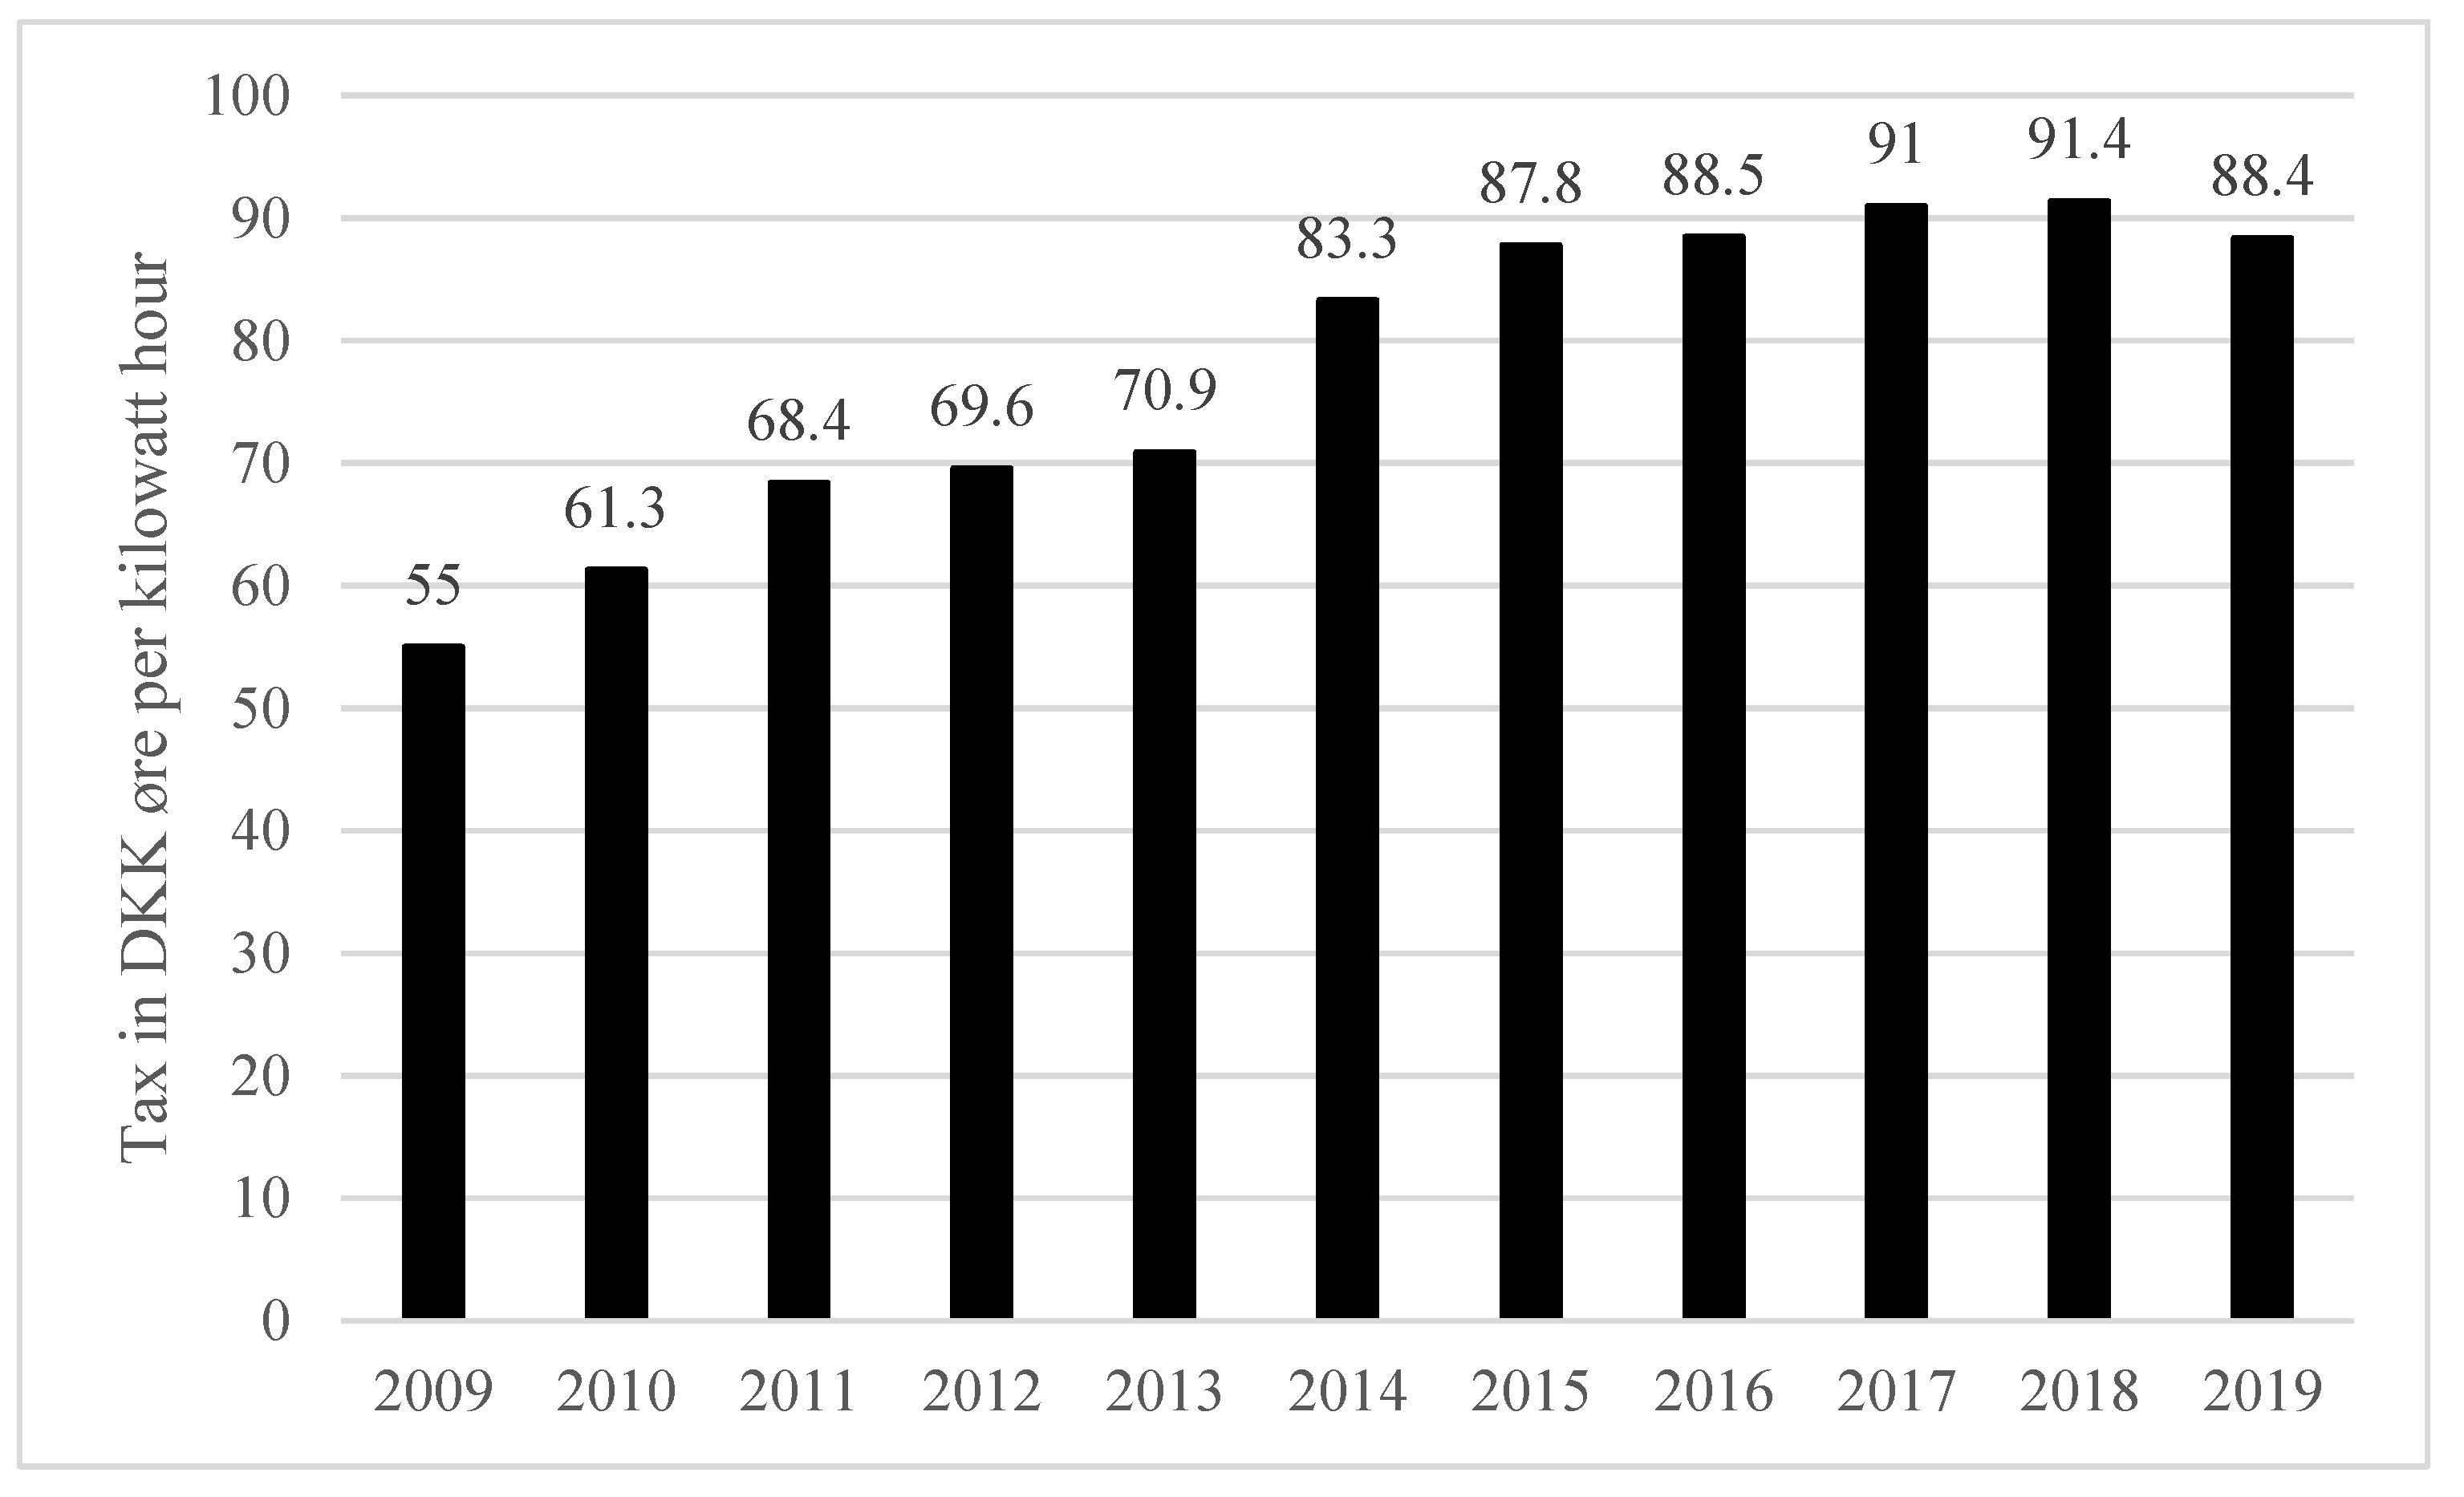
Table 1.
Energy industry systems and energy policies of Germany, Denmark, and the UK, 1990–2018.
| Germany | Denmark | The UK | |
|---|---|---|---|
| Energy system | A decentralized system with considerable involvement of the government and civil society in the energy transition. A combination of top-down and bottom-up actions. | A highly decentralized system both for energy production and policymaking. A considerable involvement of civil society, while the government is not as interventionist as in Germany. The bottom-up processes play a relevant role. | Hypothetically the most market-oriented policymaking but lacks bottom-up initiatives. Instead, the top-down processes play an essential role through market-oriented policies—more government intervention over time. |
| Essential energy policies | Support for wind energy through FIT and tax breaks. Support for solar PV through investment subsidies, low-interest loans, and FIT [57]. FIT system (1992–present). The liberalization of the electricity market (1998). | Support for wind energy since the 1970s through investment subsidies, tax refunds, and R&D support. FIT system (1992–2002, 2009–present). The liberalization of the electricity market (1996). RO system (2002–2009). | A national program to support R&D started in 1975 [22]. Liberalization of the electricity market (1989). Tendering system NFFO (1990–2002). RO system, green certificates (2002–present). FIT system (2010–present). |
| Taxation, state industry access restrictions, and state subsidies | Energy tax on oil products, natural gas, and coal and coke products at different rates. Several tax concessions (e.g., heating fuels, electricity in manufacturing industries, and agriculture). Biofuels are subsidized through the EU biofuels targets. Carbon tax for emissions in non-ETS sectors. Surcharge for consumer electricity bills to pay for renewables subsidies. The high share of costs onto households [60]. | Investment subsidies employed in promoting wind power energy since the 1970s [57]. Very high electricity tax for households, public institutions, and small businesses; a lower level for electricity used in heating; and the lowest level for industry [61]. | Levy control framework (LFC) for low-carbon electricity costs levied on consumers’ bills (it covers electricity only). In 2017, the Control for Low Carbon Levies replaced the LFC. Climate Change Levy (2001) levied energy supply to business and public sector consumers [62]. |
| Impact on innovation | |||
| Share of renewables in gross electricity production | 3.9% (1990) 35.4% (2018) Δ% = 31.5% | 3.18% (1990) 68.4% (2018) Δ% = 65.22% | 2.44% (1990) 32.9% (2018) Δ% = 30.46% |
| Share of renewables in gross available energy | 1.48% (1990) 16.67% (2018) Δ = 15.19% | 5.74% (1990) 35.41% (2018) Δ = 29.67% | 0.48% (1990) 11.14% (2018) Δ = 10.66% |
| Total jobs created (as of 2018) | 83,019,213 | 5,806,081 | 66,647,112 |
| Total jobs created/pop (as of 2018) | 0.0031 | 0.0081 | 0.0019 |
| Impact on GHG emissions (1990–2018) | −29.56% | −29.31% | −38.41% |
| Impact on electricity prices | |||
| Non-household consumer prices | 17.96% | 137.34% | 5.38% |
| Household consumer prices | 38.9% | 46.42% | 6.75% |
Source: own calculations based on IEA, Eurostat, European Environment Agency (EEA), and EurObserv’ER.
Table 2.
VAT of Germany, 1978 to 2020.
| Period | General VAT % |
|---|---|
| January 1978–June 1979 | 12 |
| July 1979–June 1983 | 13 |
| July 1983–December 1992 | 14 |
| January 1993–March 1998 | 15 |
| April 1998–December 2006 | 16 |
| January 2007–June 2020 | 19 |
| June 2020–present (as of 2020) | 16 |
Source: own elaboration from IEA [63].
Table 3.
State subsidy (price premium) of large-scale offshore wind tenders, 2005–2016.
| Auction Held | Size (MW) | Winning Nominal Bid Price, øre/kWh (USD/kWh) | Winning Bid Fixed 2016-Price | The Percentage Difference between the Subsidized Price and the Original Prices |
|---|---|---|---|---|
| February 2005 | 209 | 51.8 (8.6) | 64 (9.6) | 23.6% |
| April 2008 | 207 | 62.9 (12.3) | 70.6 (10.6) | 12.2% |
| April 2010 | 400 | 105.1 (18.7) | 113.6 (17) | 8.1% |
| February 2015 | 406.7 | 77 (11.4) | 78.2 (11.7) | 1.6% |
| September 2015 | 350 | 47.5 (8.0) | 47.5 (8) | 0% |
| November 2016 | 600 | 37.2 (5.6) | 37.2 (5.6) | 0% |
Table 4.
VAT of Denmark, 1978 to 2020.
| Period | General VAT % |
|---|---|
| January 1978–October 1997 | 18 |
| October 1978–June 1980 | 20 |
| July 1980–December 1991 | 22 |
| January 1991–present (as of 2020) | 25 |
Source: Own elaboration from IEA [63].
Table 5.
VAT and energy taxation of the UK, 1994 to 2011.
| Period | General VAT % | Reduced VAT for Energy % |
|---|---|---|
| April 1994–August 1997 | 17.5 | 8 |
| September 1997–November 2008 | 17.5 | 5 |
| December 2008–December 2009 | 15 | 5 |
| January 2010–January 2011 | 17.5 | 5 |
| January 2011–present (as of 2020) | 20 | 5 |
Source: International Energy Agency, Energy Prices and Taxes for OECD Countries: Country Notes (4th Quarter 2020), p. 134.
Publisher’s Note: MDPI stays neutral with regard to jurisdictional claims in published maps and institutional affiliations. |
© 2021 by the authors. Licensee MDPI, Basel, Switzerland. This article is an open access article distributed under the terms and conditions of the Creative Commons Attribution (CC BY) license (https://creativecommons.org/licenses/by/4.0/).
Share and Cite
MDPI and ACS Style
Wang, W.H.; Moreno-Casas, V.; Huerta de Soto, J. A Free-Market Environmentalist Transition toward Renewable Energy: The Cases of Germany, Denmark, and the United Kingdom. Energies 2021, 14, 4659. https://doi.org/10.3390/en14154659
AMA Style
Wang WH, Moreno-Casas V, Huerta de Soto J. A Free-Market Environmentalist Transition toward Renewable Energy: The Cases of Germany, Denmark, and the United Kingdom. Energies. 2021; 14(15):4659. https://doi.org/10.3390/en14154659
Chicago/Turabian StyleWang, William Hongsong, Vicente Moreno-Casas, and Jesús Huerta de Soto. 2021. "A Free-Market Environmentalist Transition toward Renewable Energy: The Cases of Germany, Denmark, and the United Kingdom" Energies 14, no. 15: 4659. https://doi.org/10.3390/en14154659
Note that from the first issue of 2016, this journal uses article numbers instead of page numbers. See further details here.