
Comparative TCO Analysis of Battery Electric and Hydrogen Fuel Cell Buses for Public Transport System in Small to Midsize Cities


Abstract
:1. Introduction
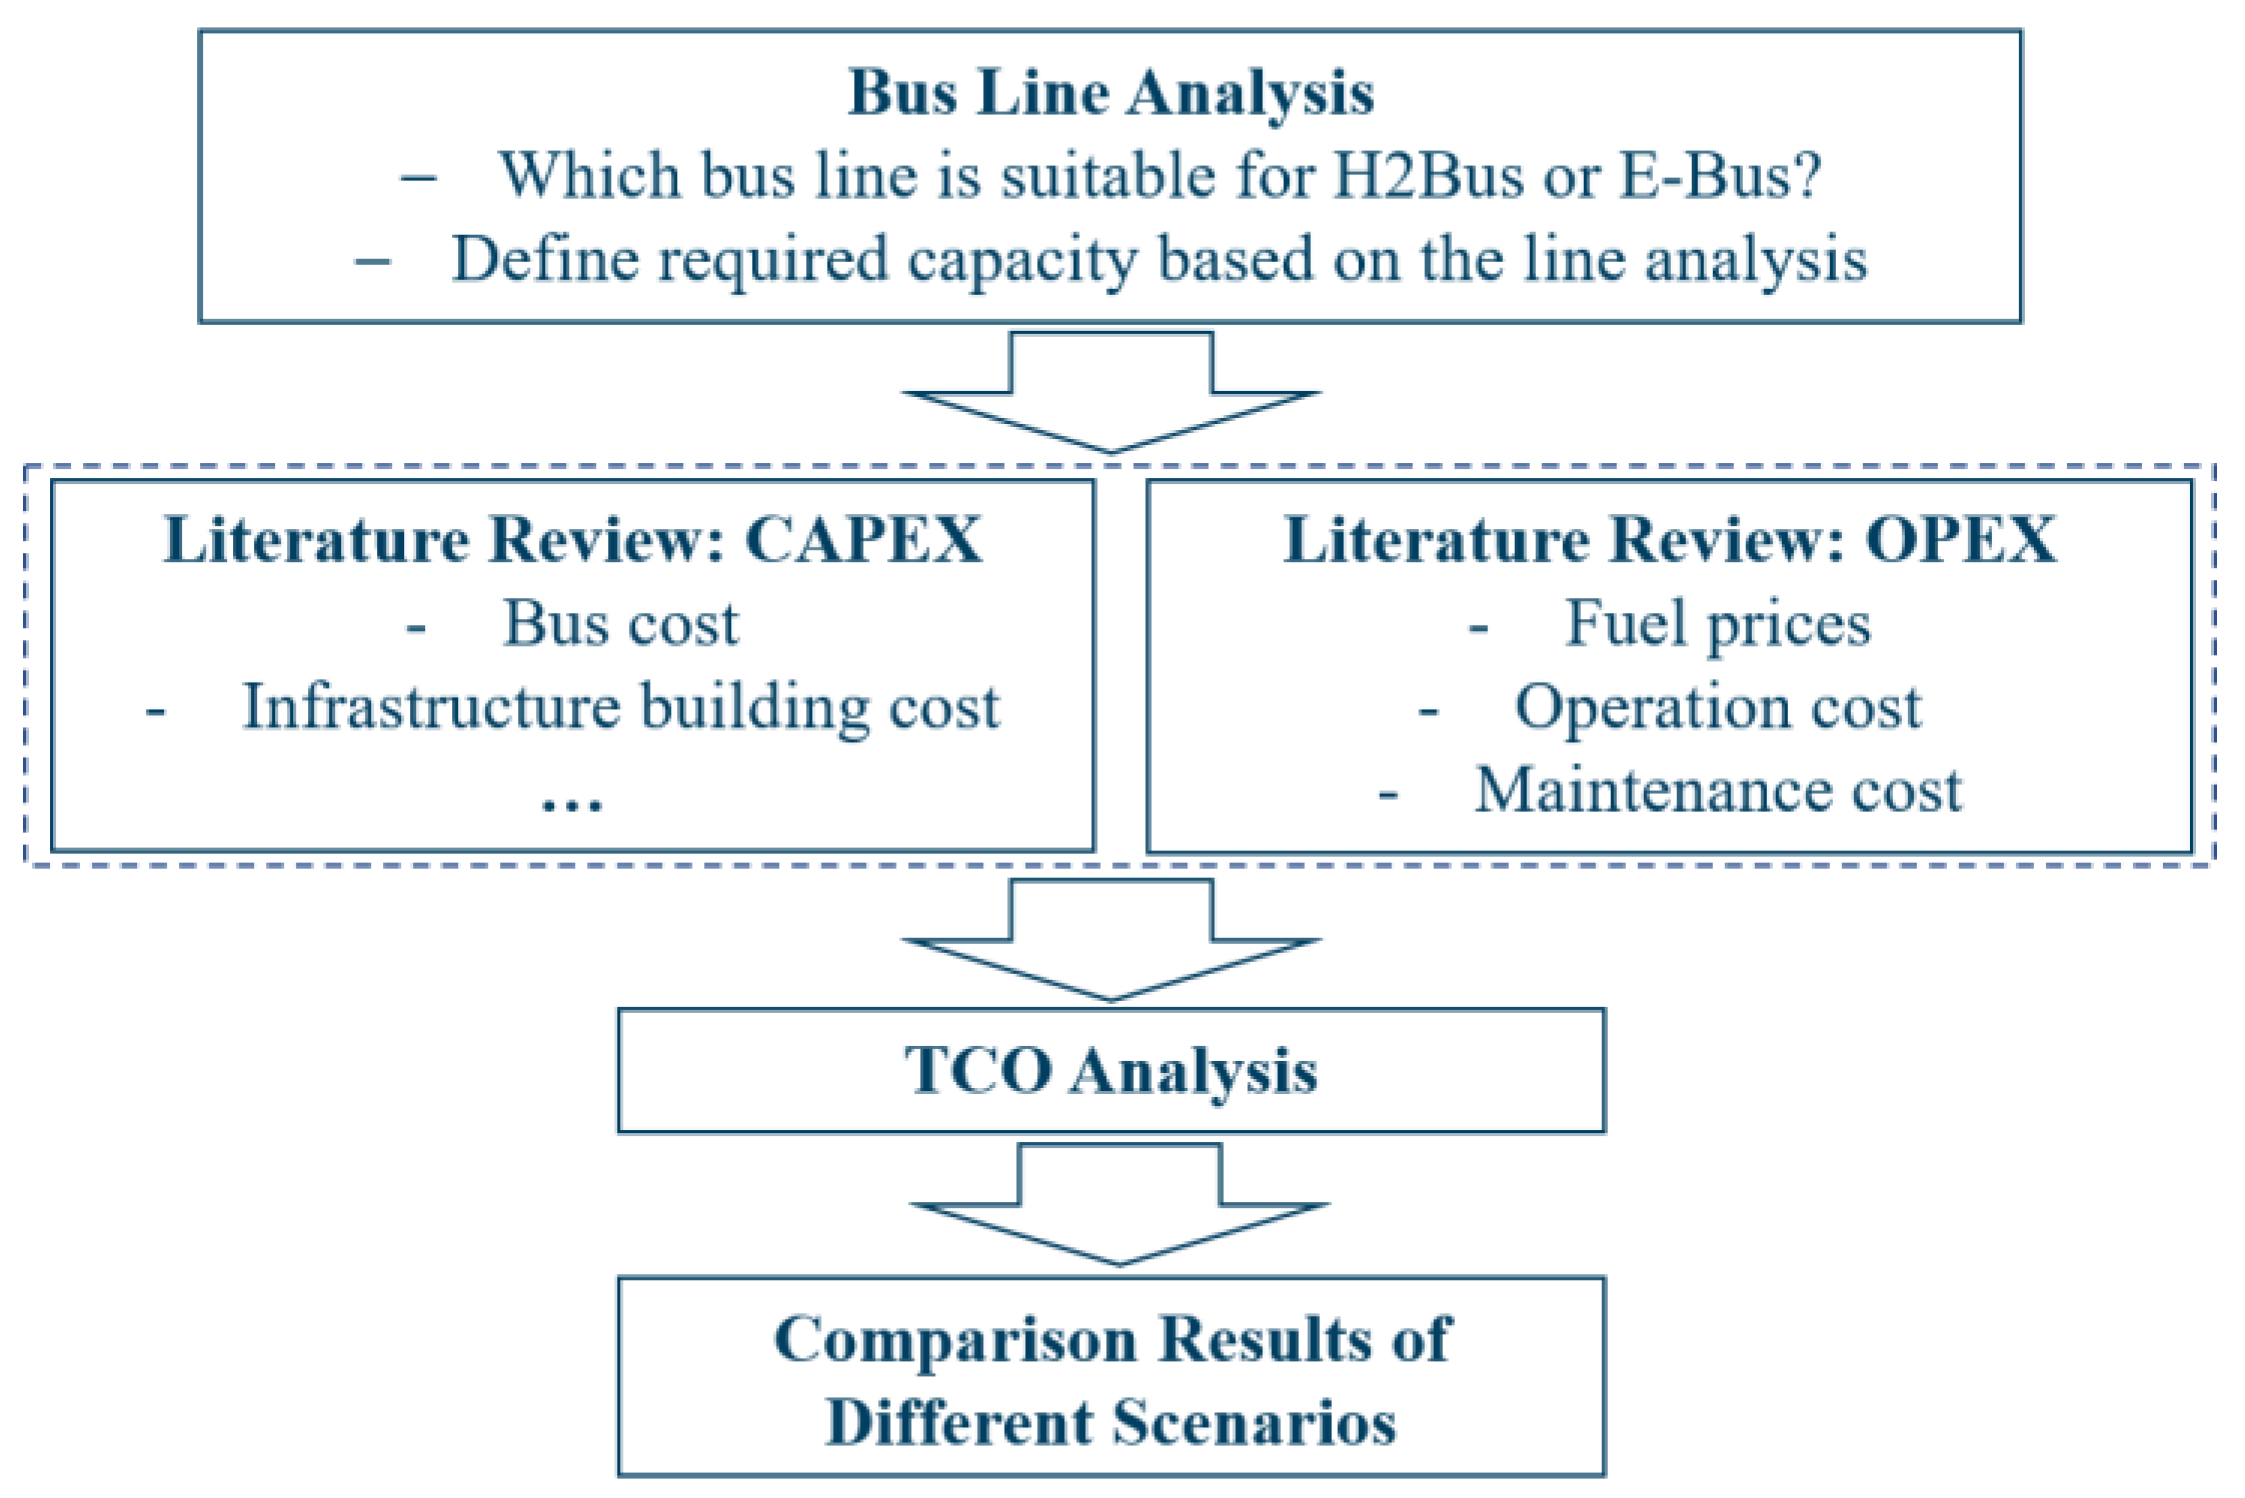
2. Methodology
3. Bus System in Small to Midsize Cities
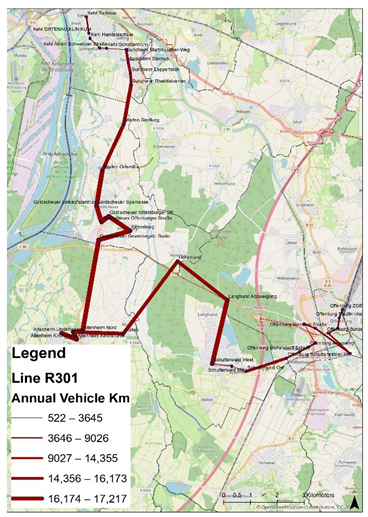
3.1. Structural Analysis in a Small to Midsize City in Germany: Offenburg
- -
- an attributed network model of the main road network,
- -
- the traffic volumes and thus the demand (typical working day demand matrices Tuesday–Thursday) for cars and trucks and
- -
- the assignment of the demand to the network.
- Processing of data from zHV
- ○
- Conversion of csv tables (information about stops regarding coordinates, operator, name…) into GIS format.
- Digitization of the existing timetables
- ○
- Conversion of pdf tables into table format
- Merging of the stops and timetables in GIS
- ○
- Assignment of the stops or lines to the respective timetables
- -
- Accessibility
- -
- Potential of modal shift
- -
- Quality of infrastructure
3.2. Acceptance Study in a Small to Midsize City in Germany: Offenburg
4. Electric Bus Implementation
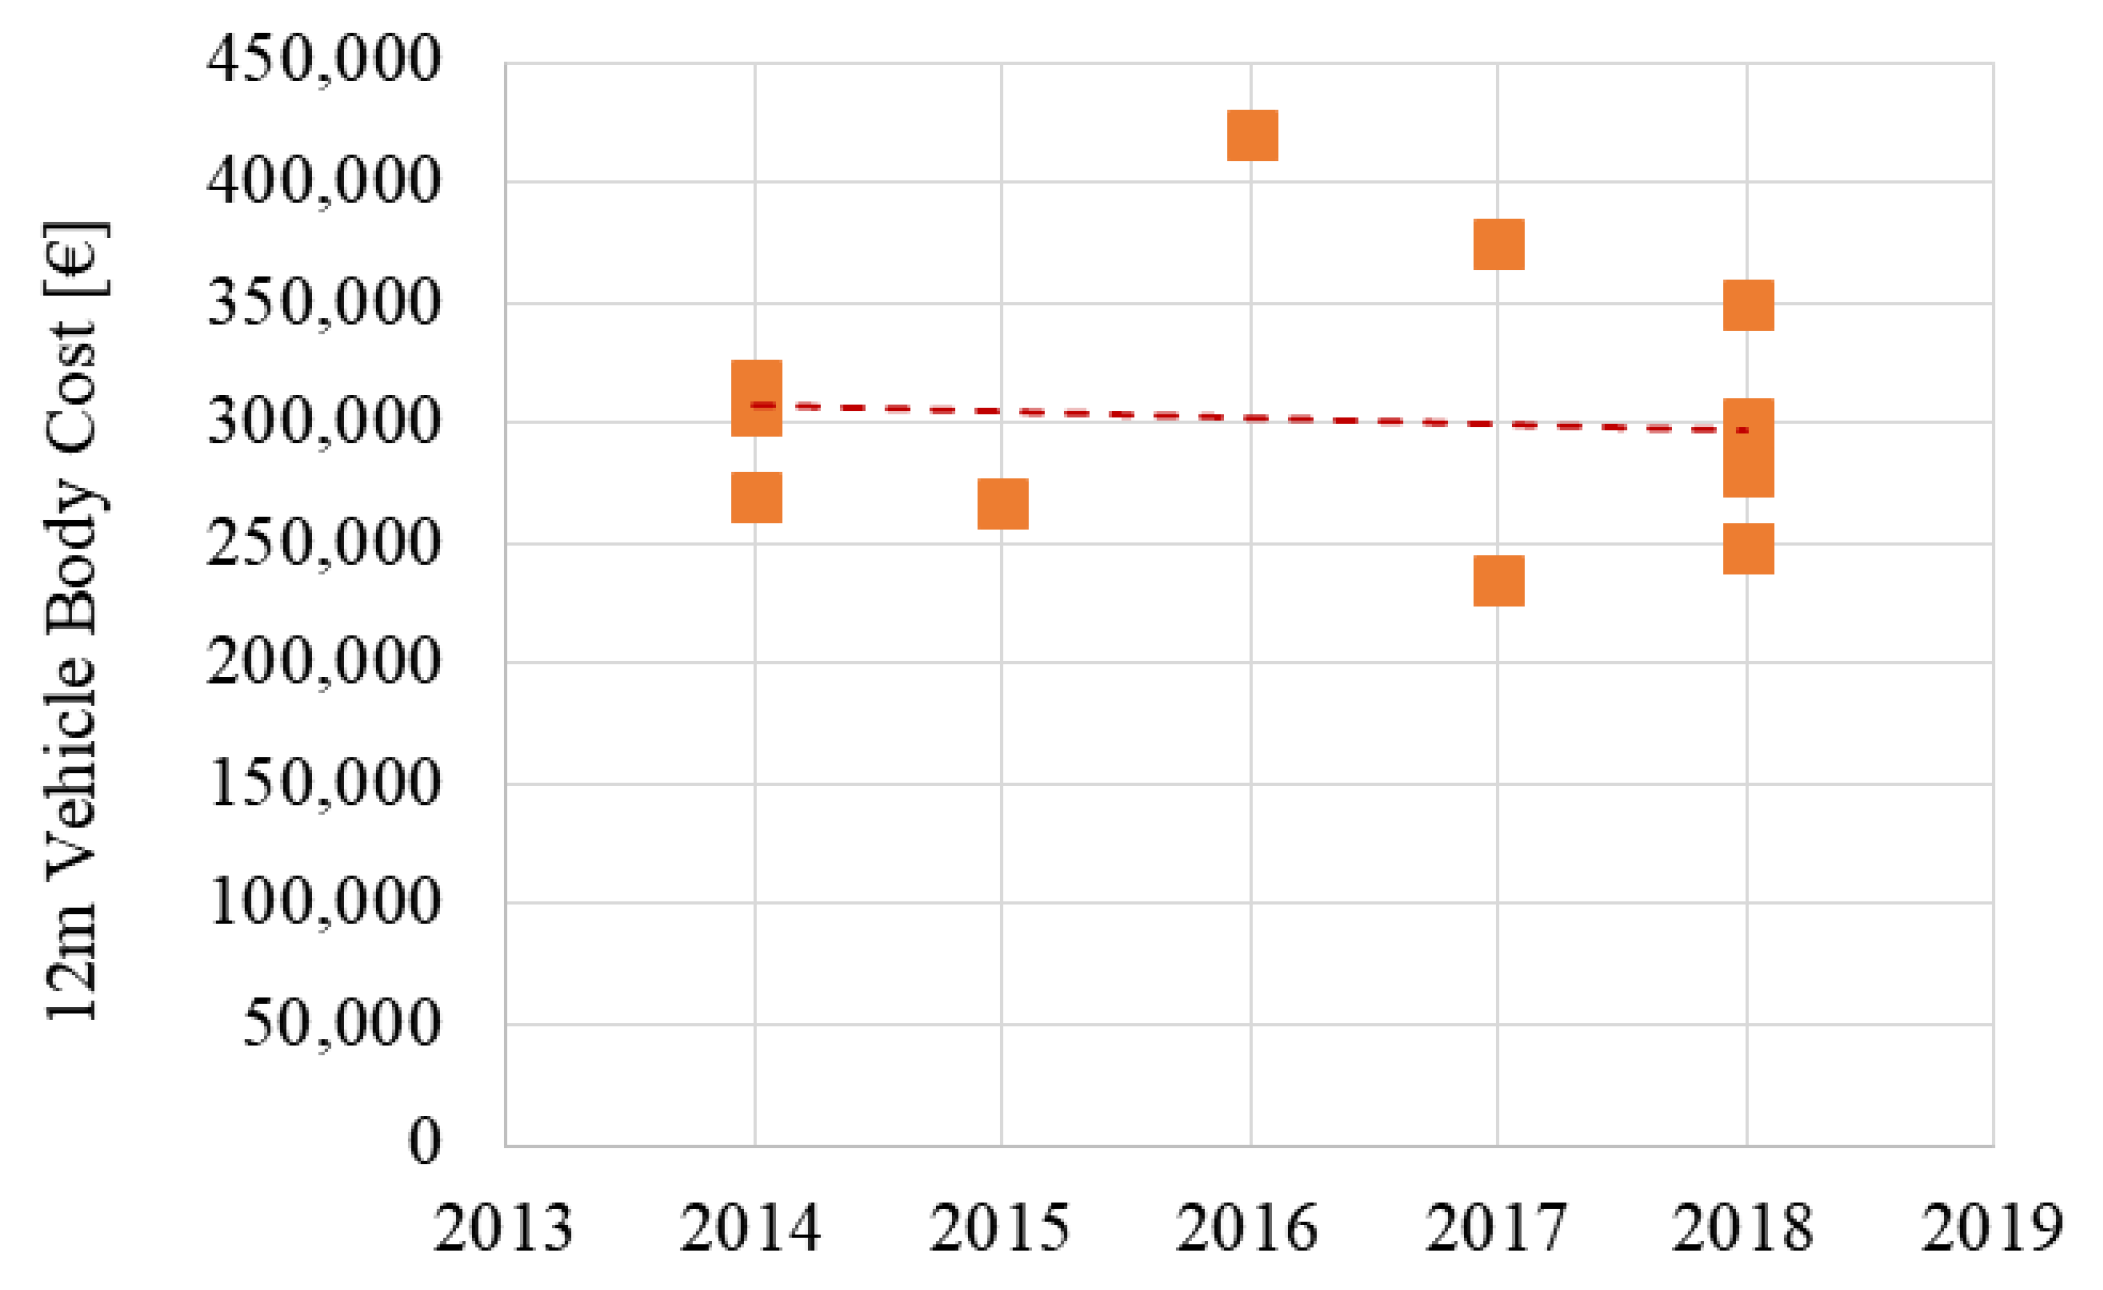
4.1. Vehicles Costs
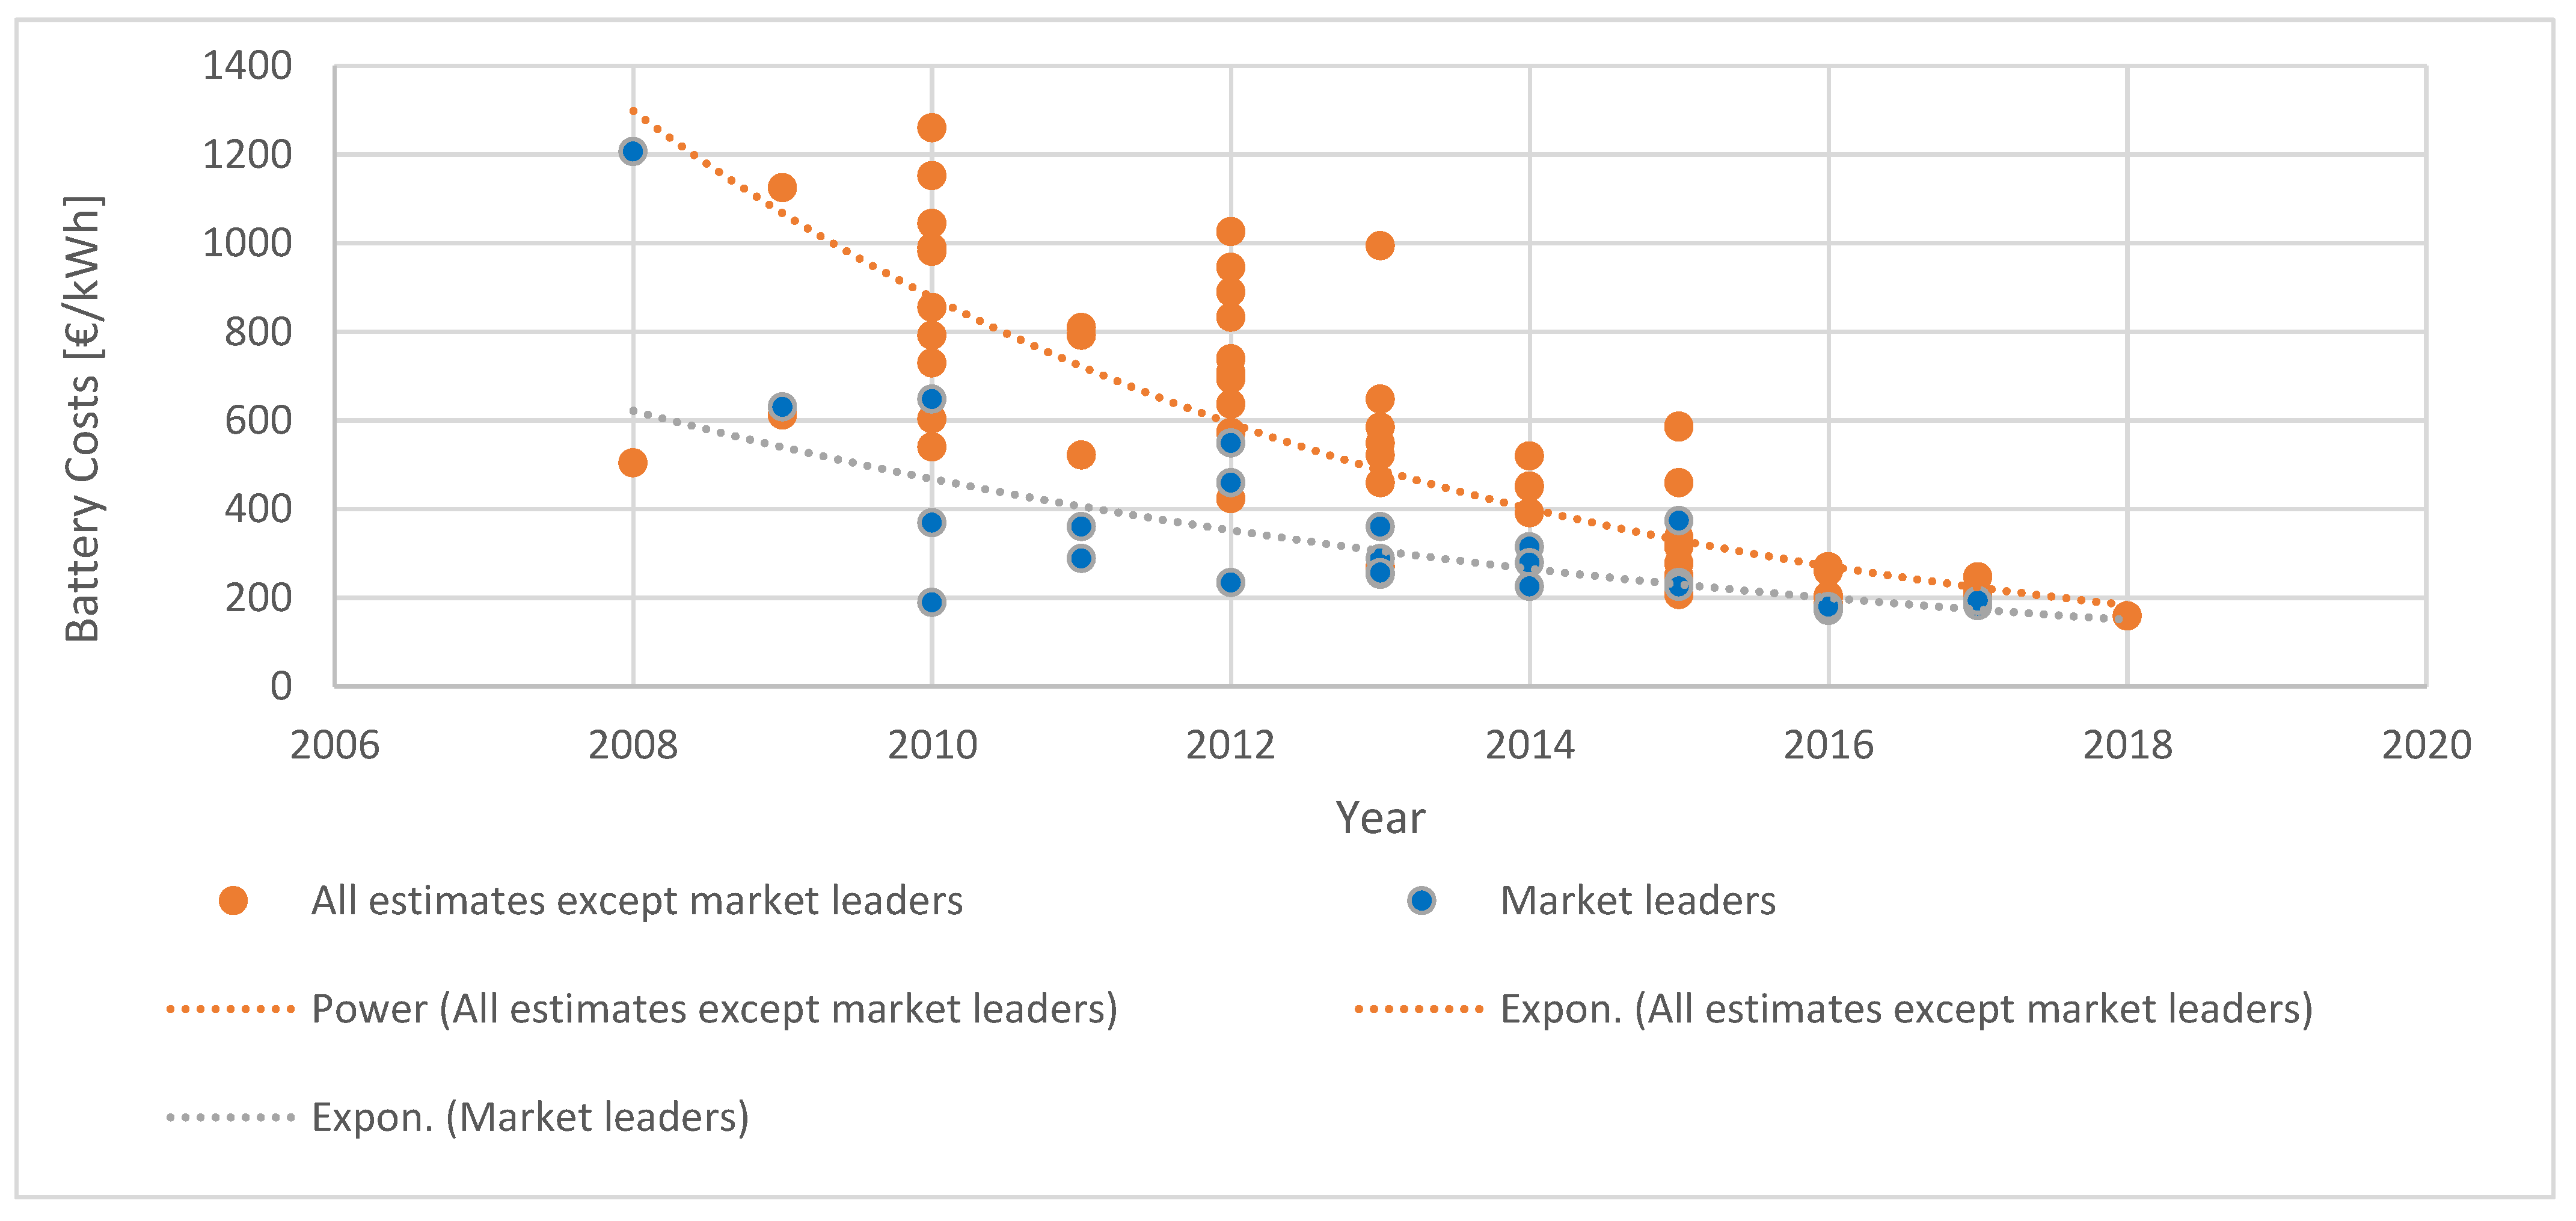
4.2. Battery Prices
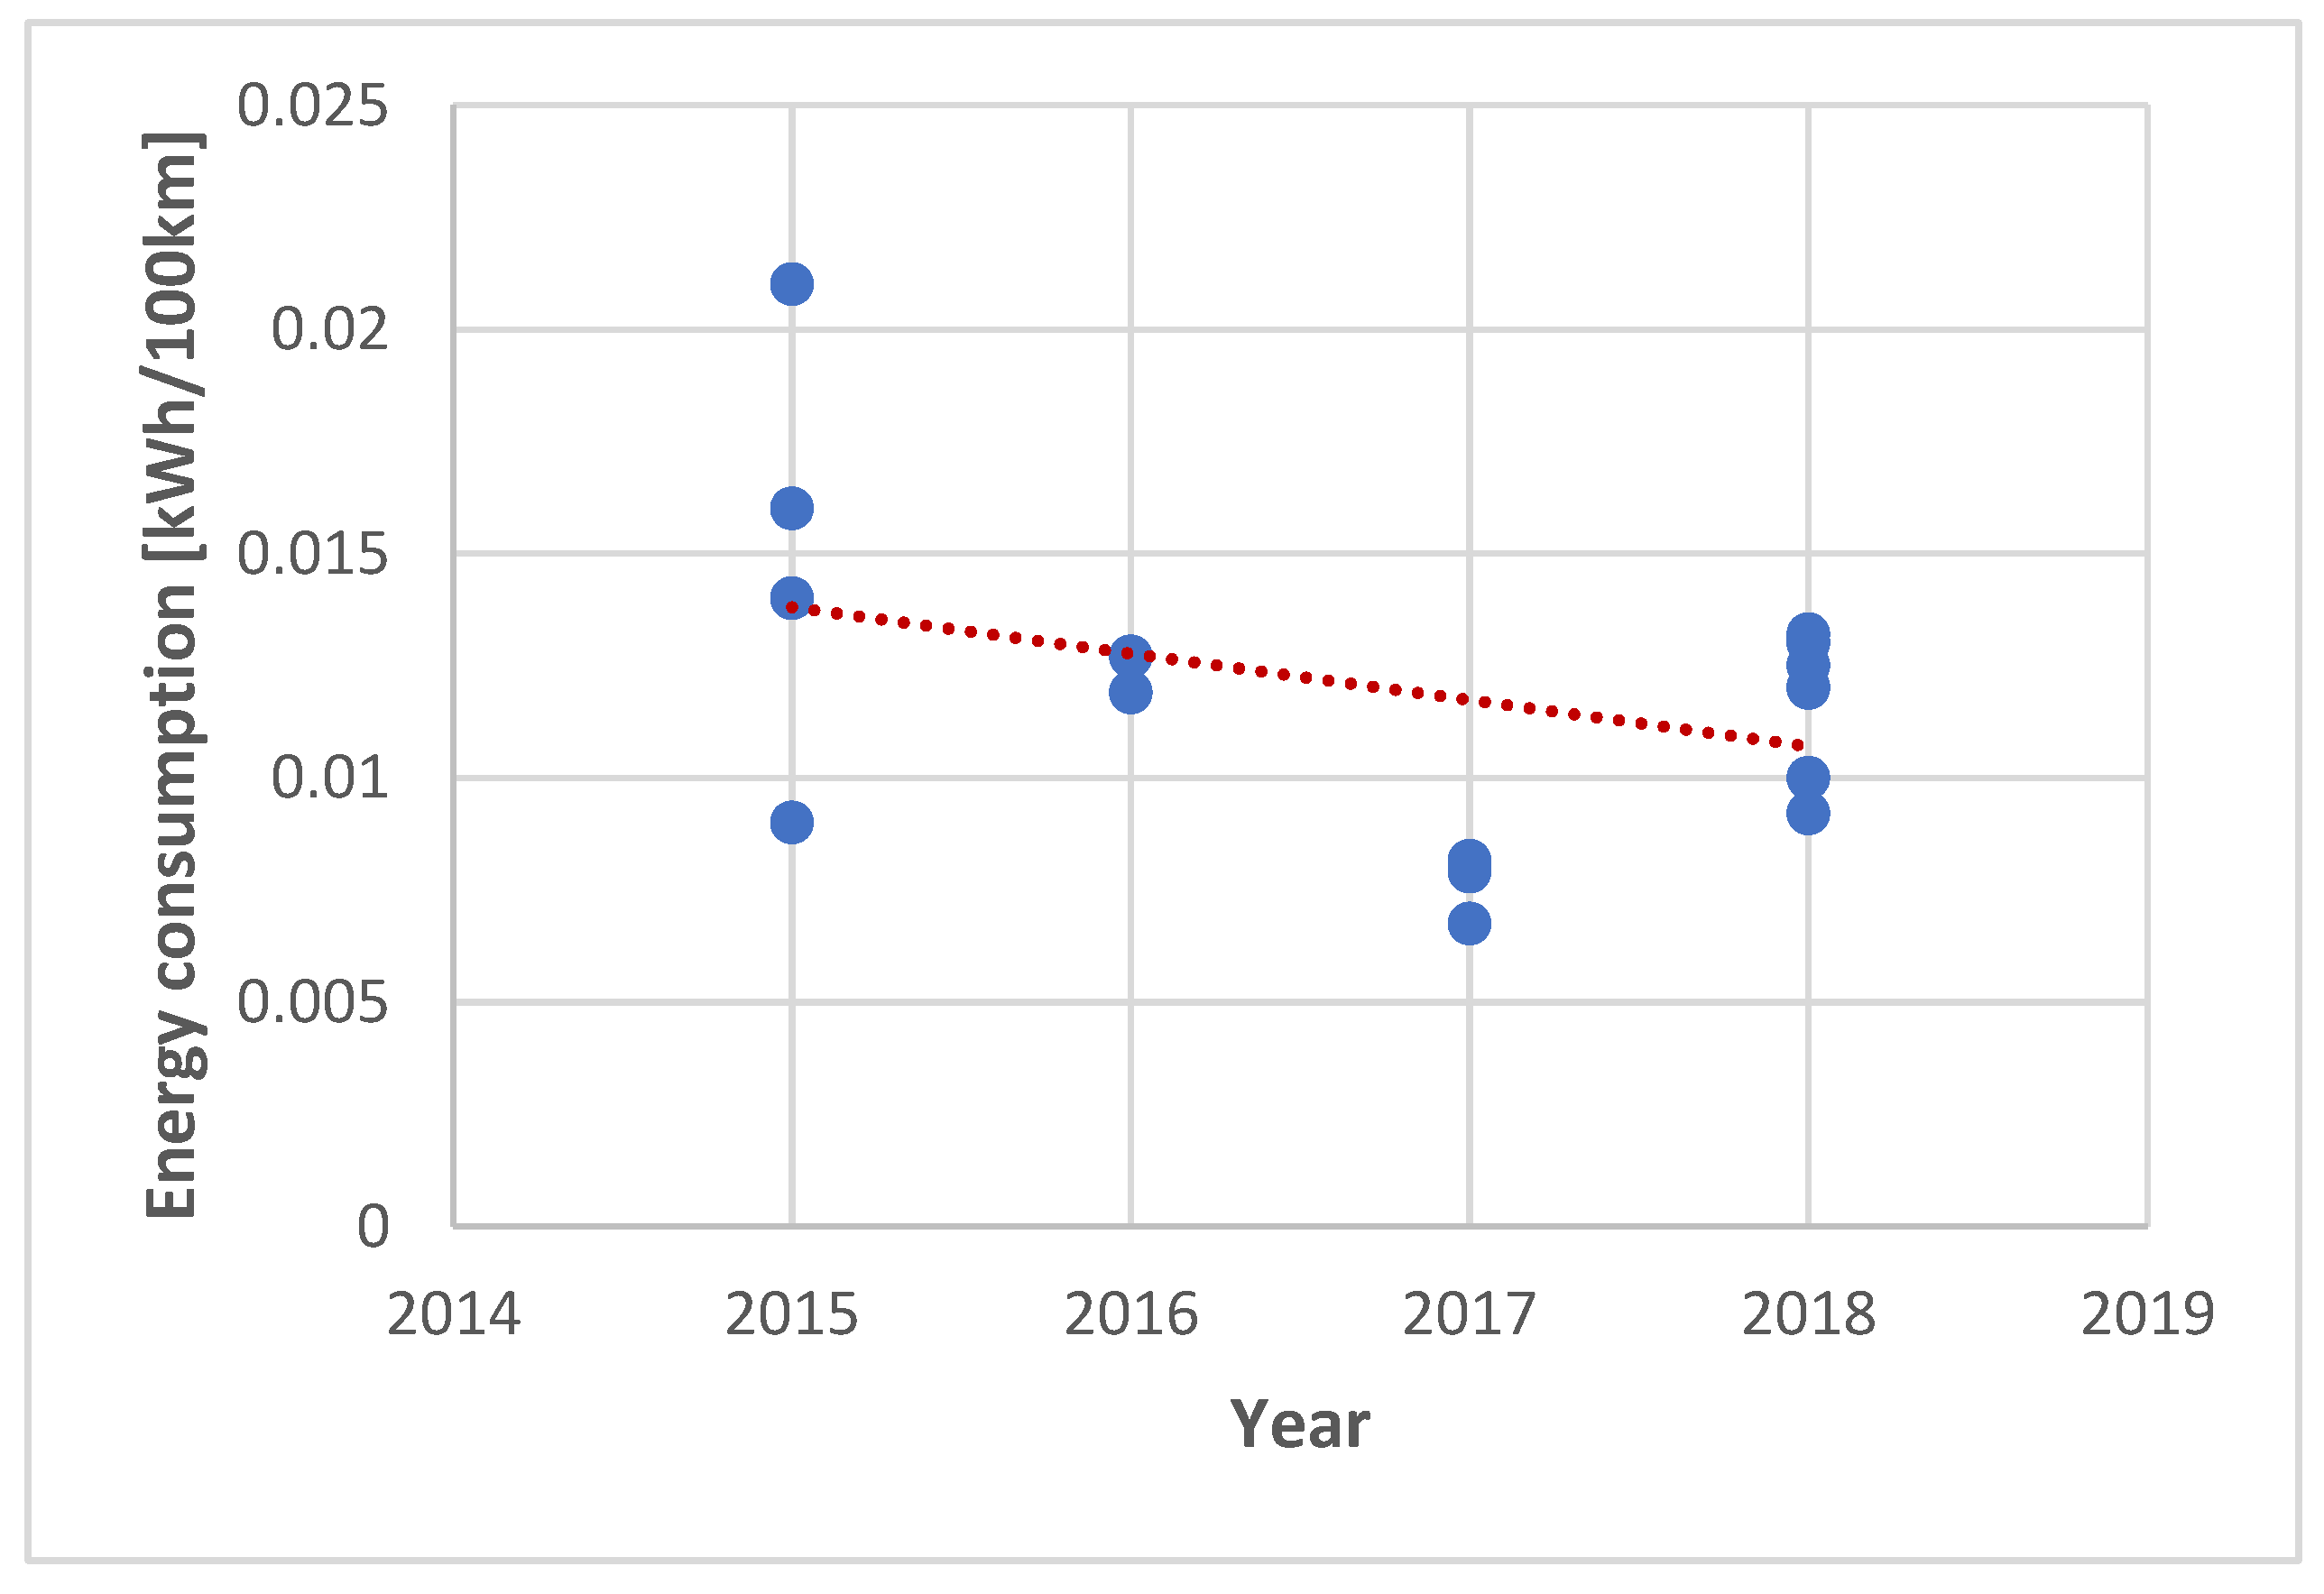
4.3. Energy Consumption
4.4. Electricity Price in Germany
4.5. Electric Bus Operation Conditions for Two Scenarios
- -
- In the first scenario, only one depot charging station is placed for 2 electric buses.
- -
- In the second scenario, 5 depot or 1 pantograph charging stations are considered for 11 electric buses.
4.5.1. Depot Charging: 2 Buses Scenario
4.5.2. Pantograph Charging: 11 Buses Scenario
4.6. Economic Parameters for E-Bus Scenarios
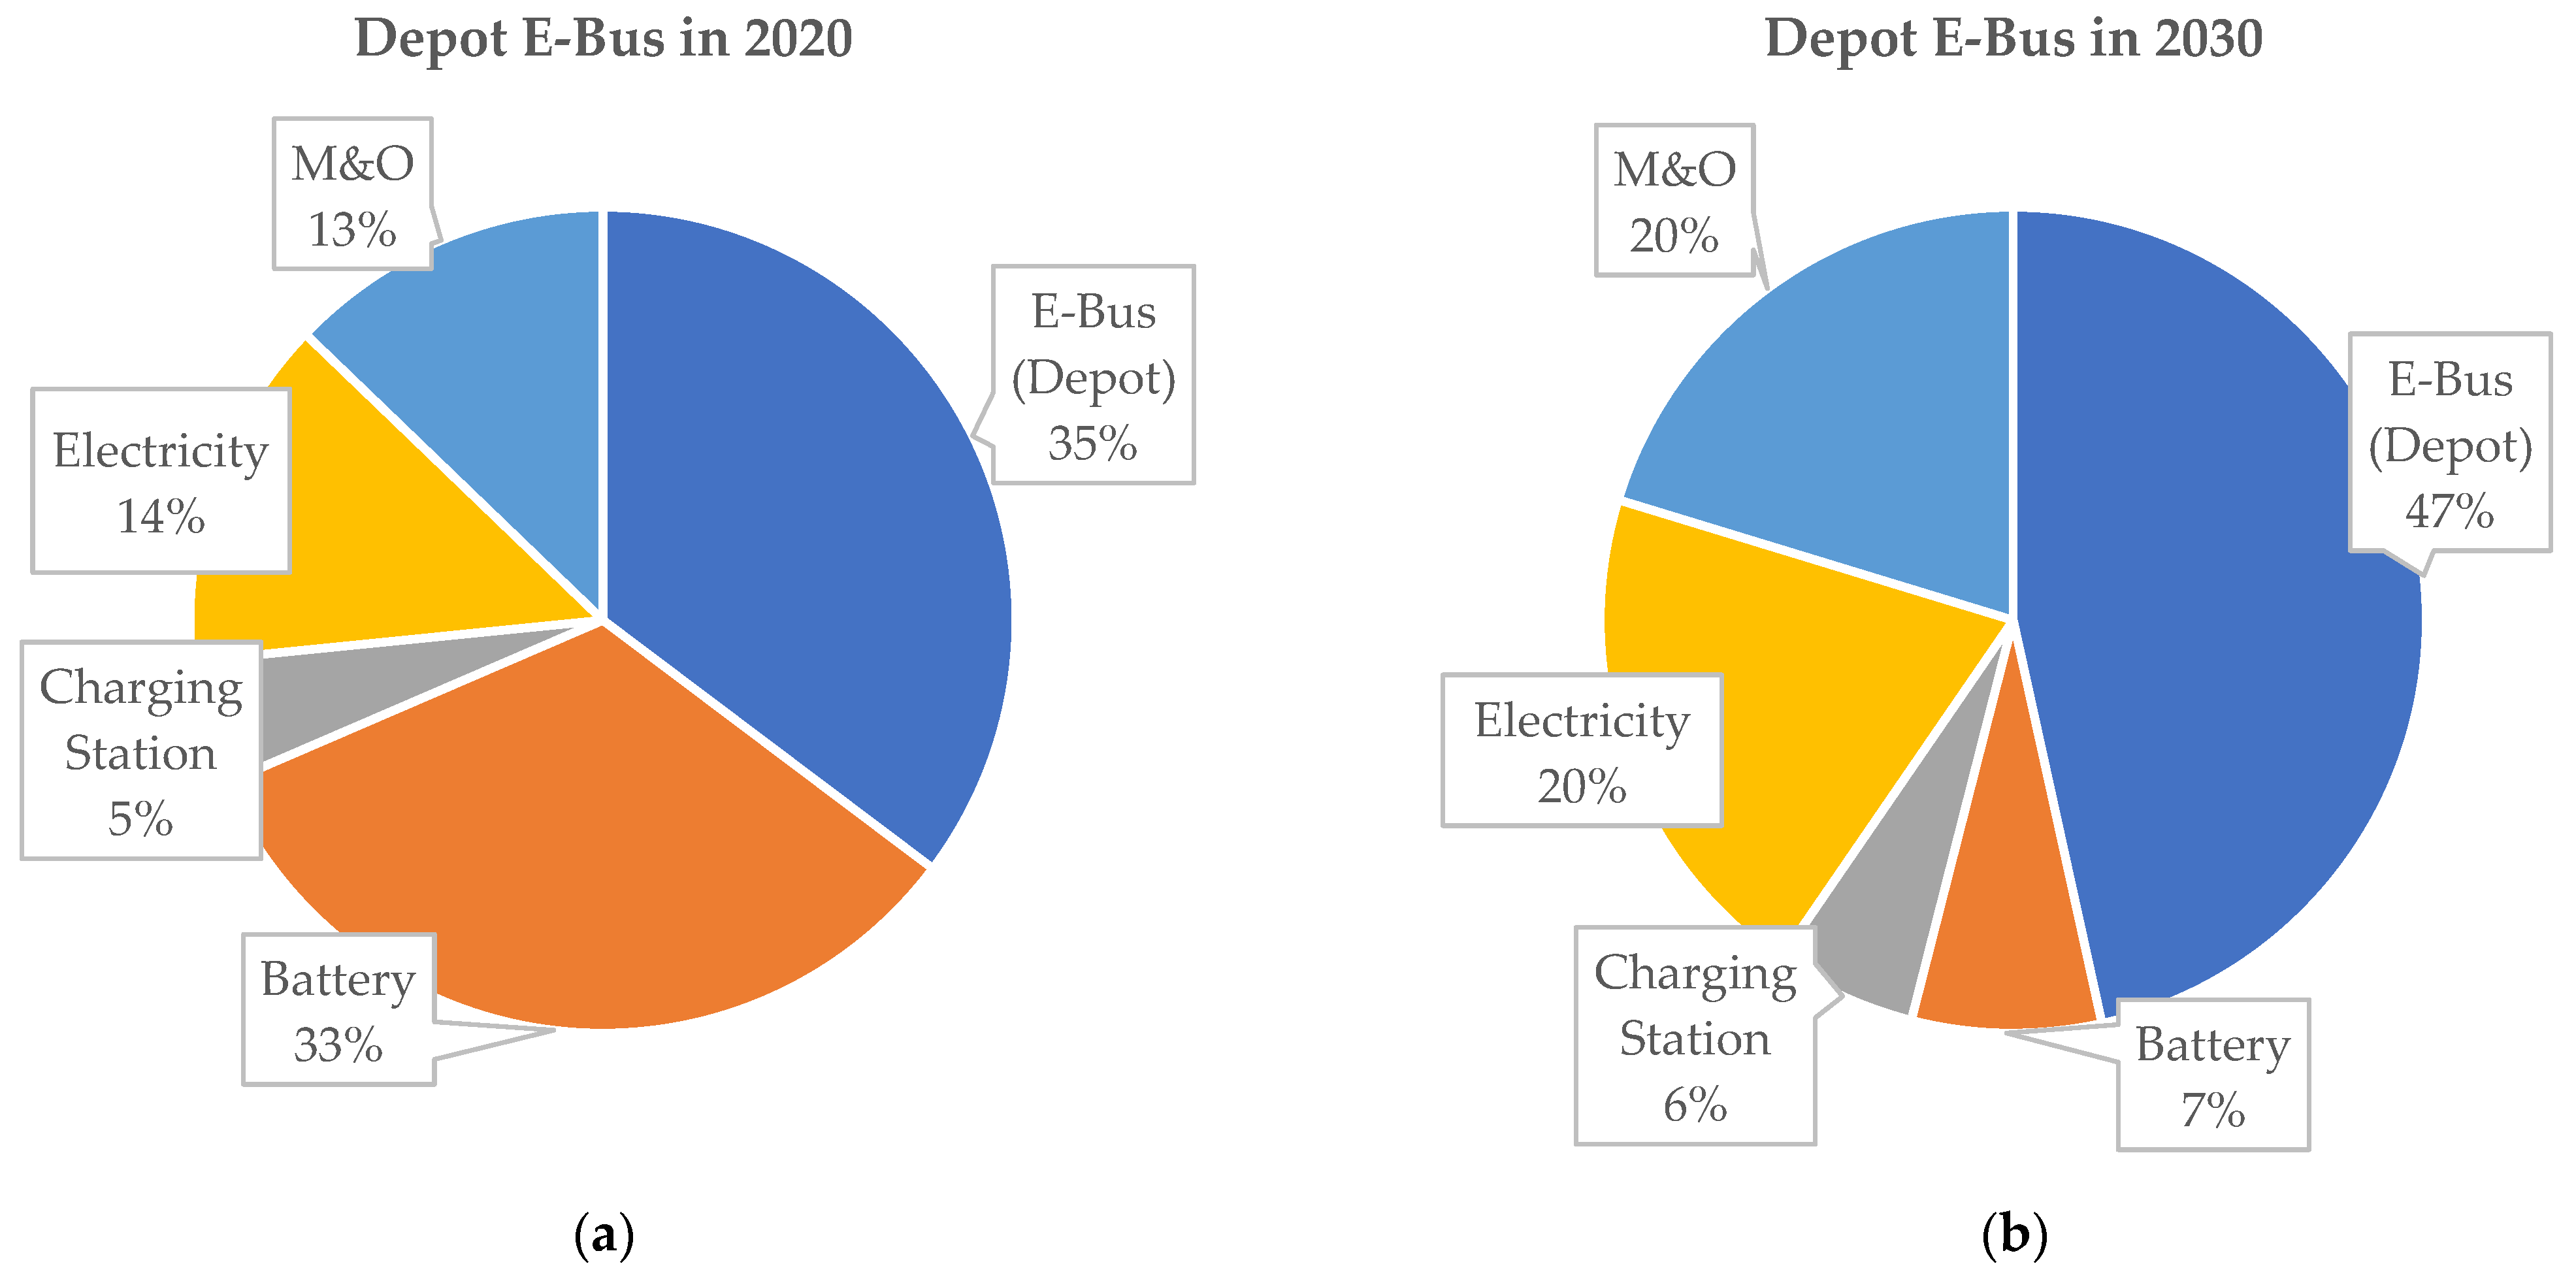
4.6.1. Depot Charging Scenario
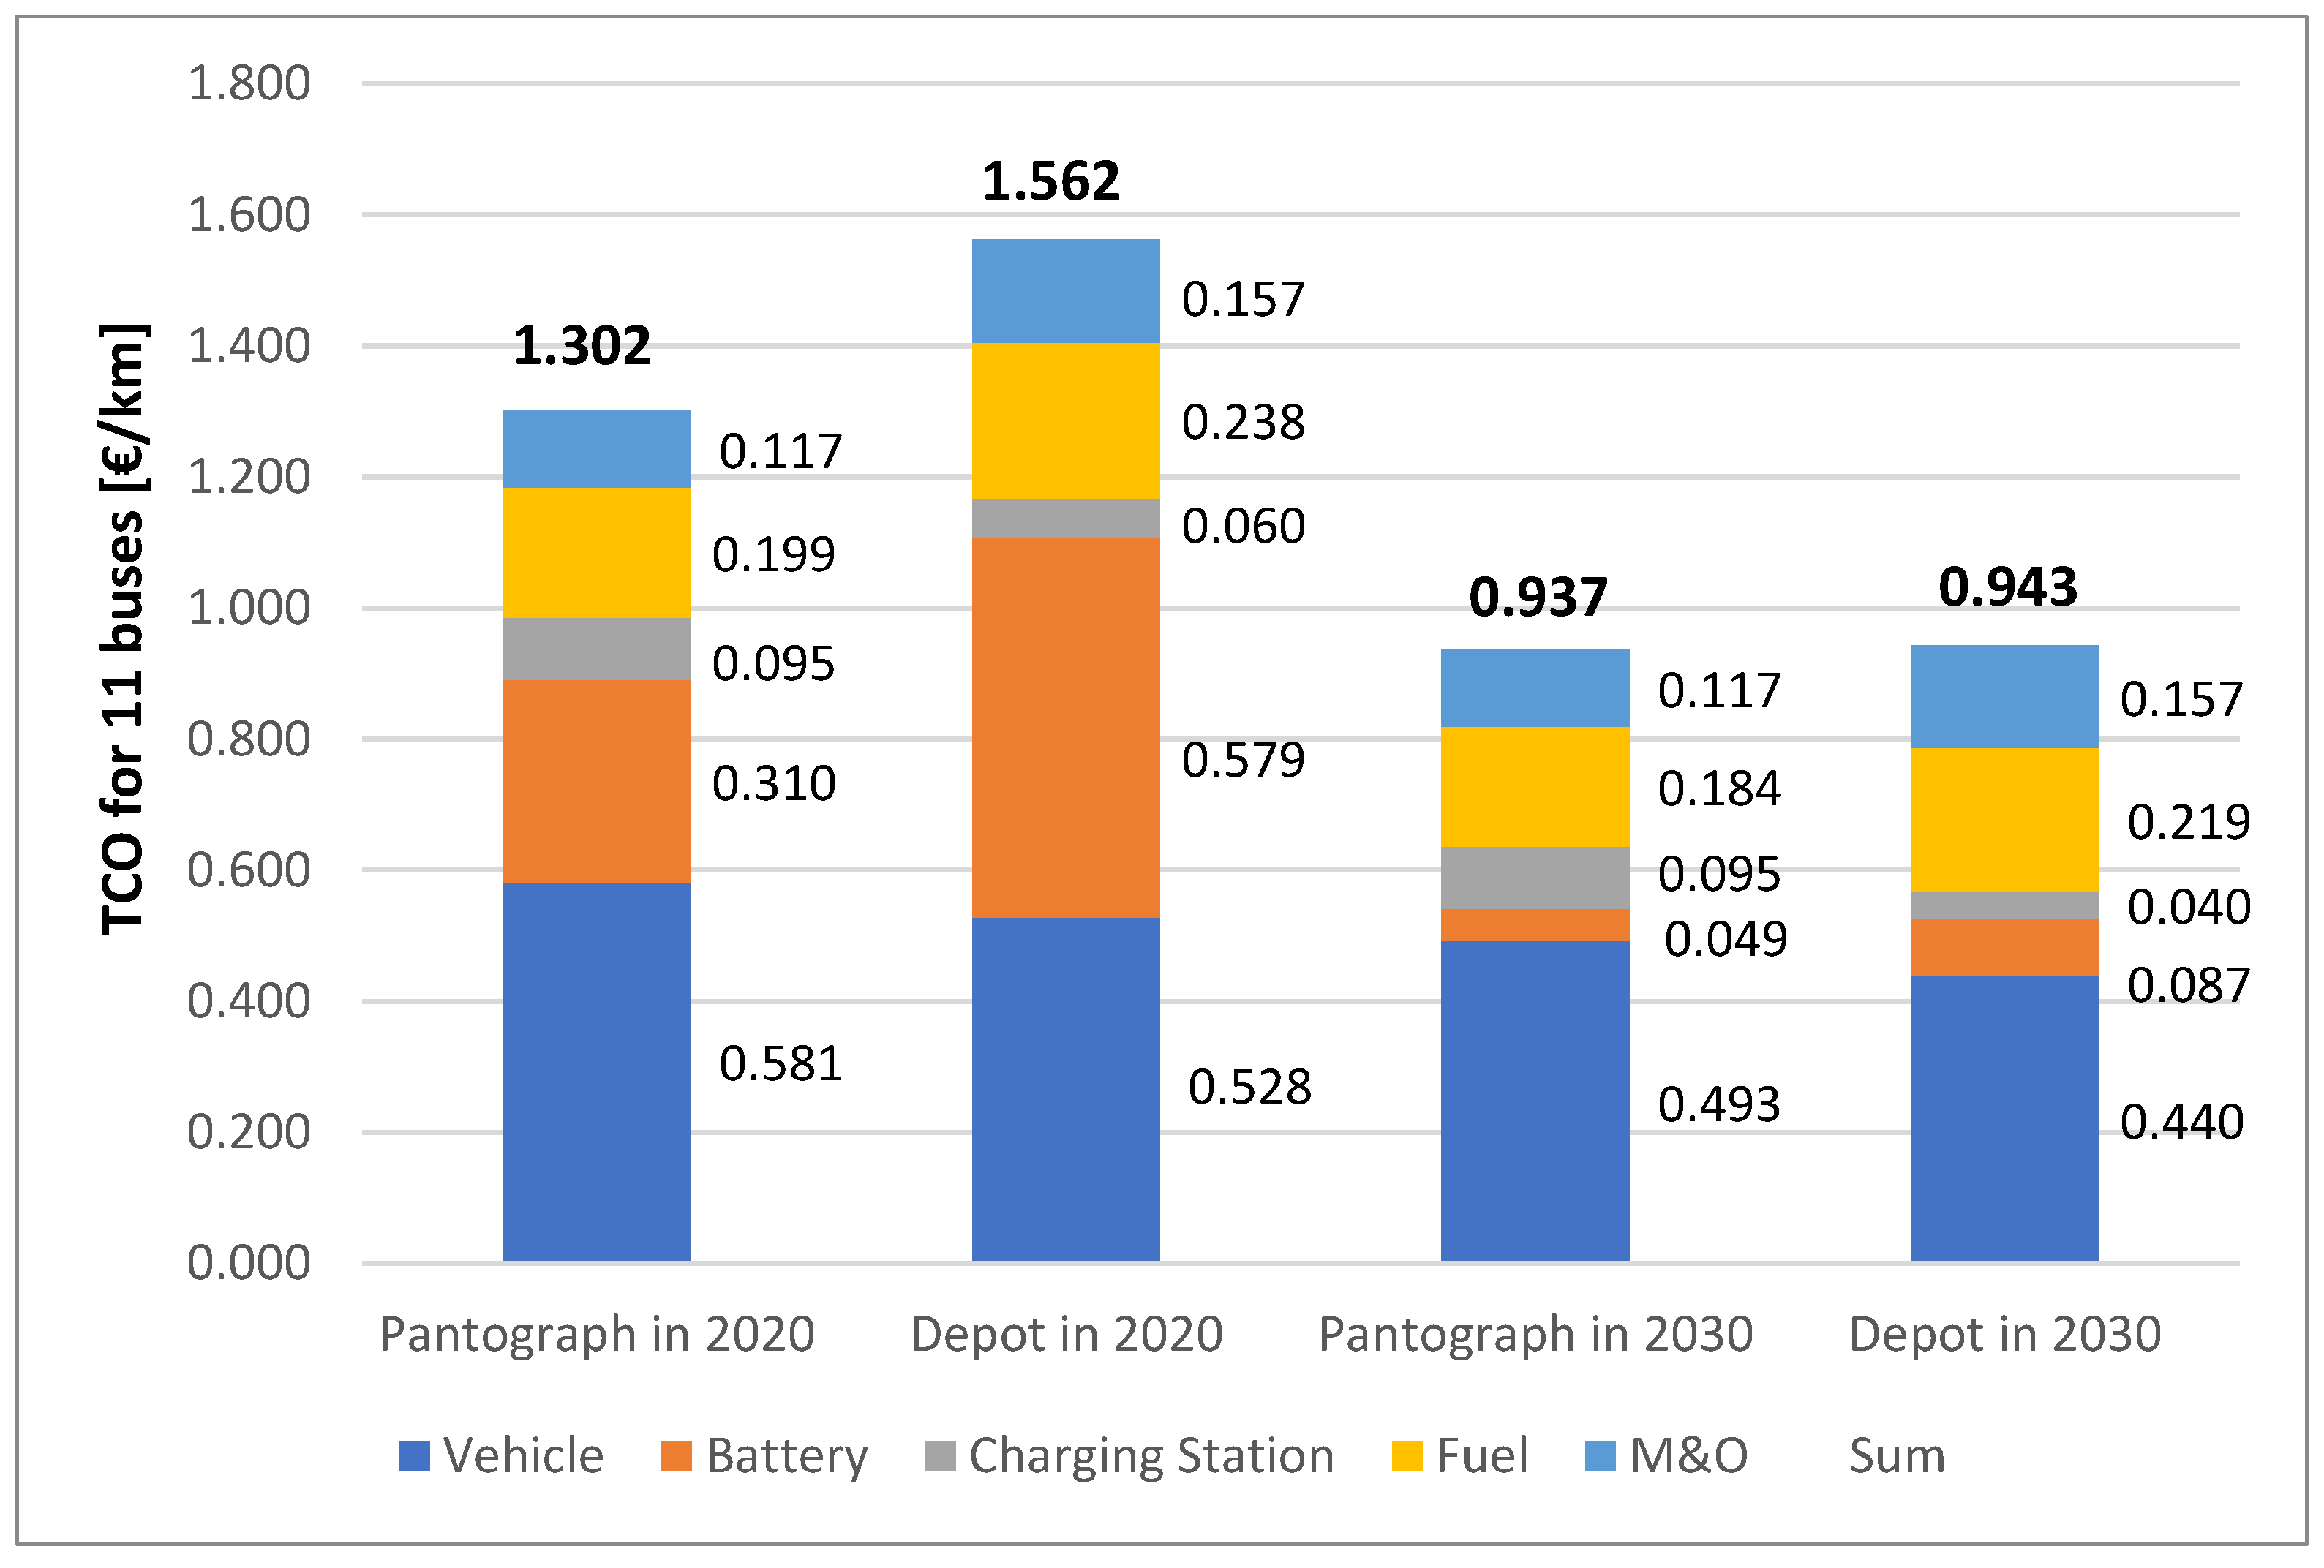
4.6.2. Pantograph Charging Scenario
5. Hydrogen Bus Implementation
5.1. Bus Fleet Sizing
5.2. Vehicles Costs
5.2.1. Specific Consumption
5.2.2. Maintenance Costs
5.3. Fuel Costs: Hydrogen Onsite Production through Electrolysis
6. Diesel Bus Implementation
7. Results and Discussion
7.1. Battery Electric Bus
7.1.1. 2 Buses Scenario
7.1.2. 11 Buses Scenario
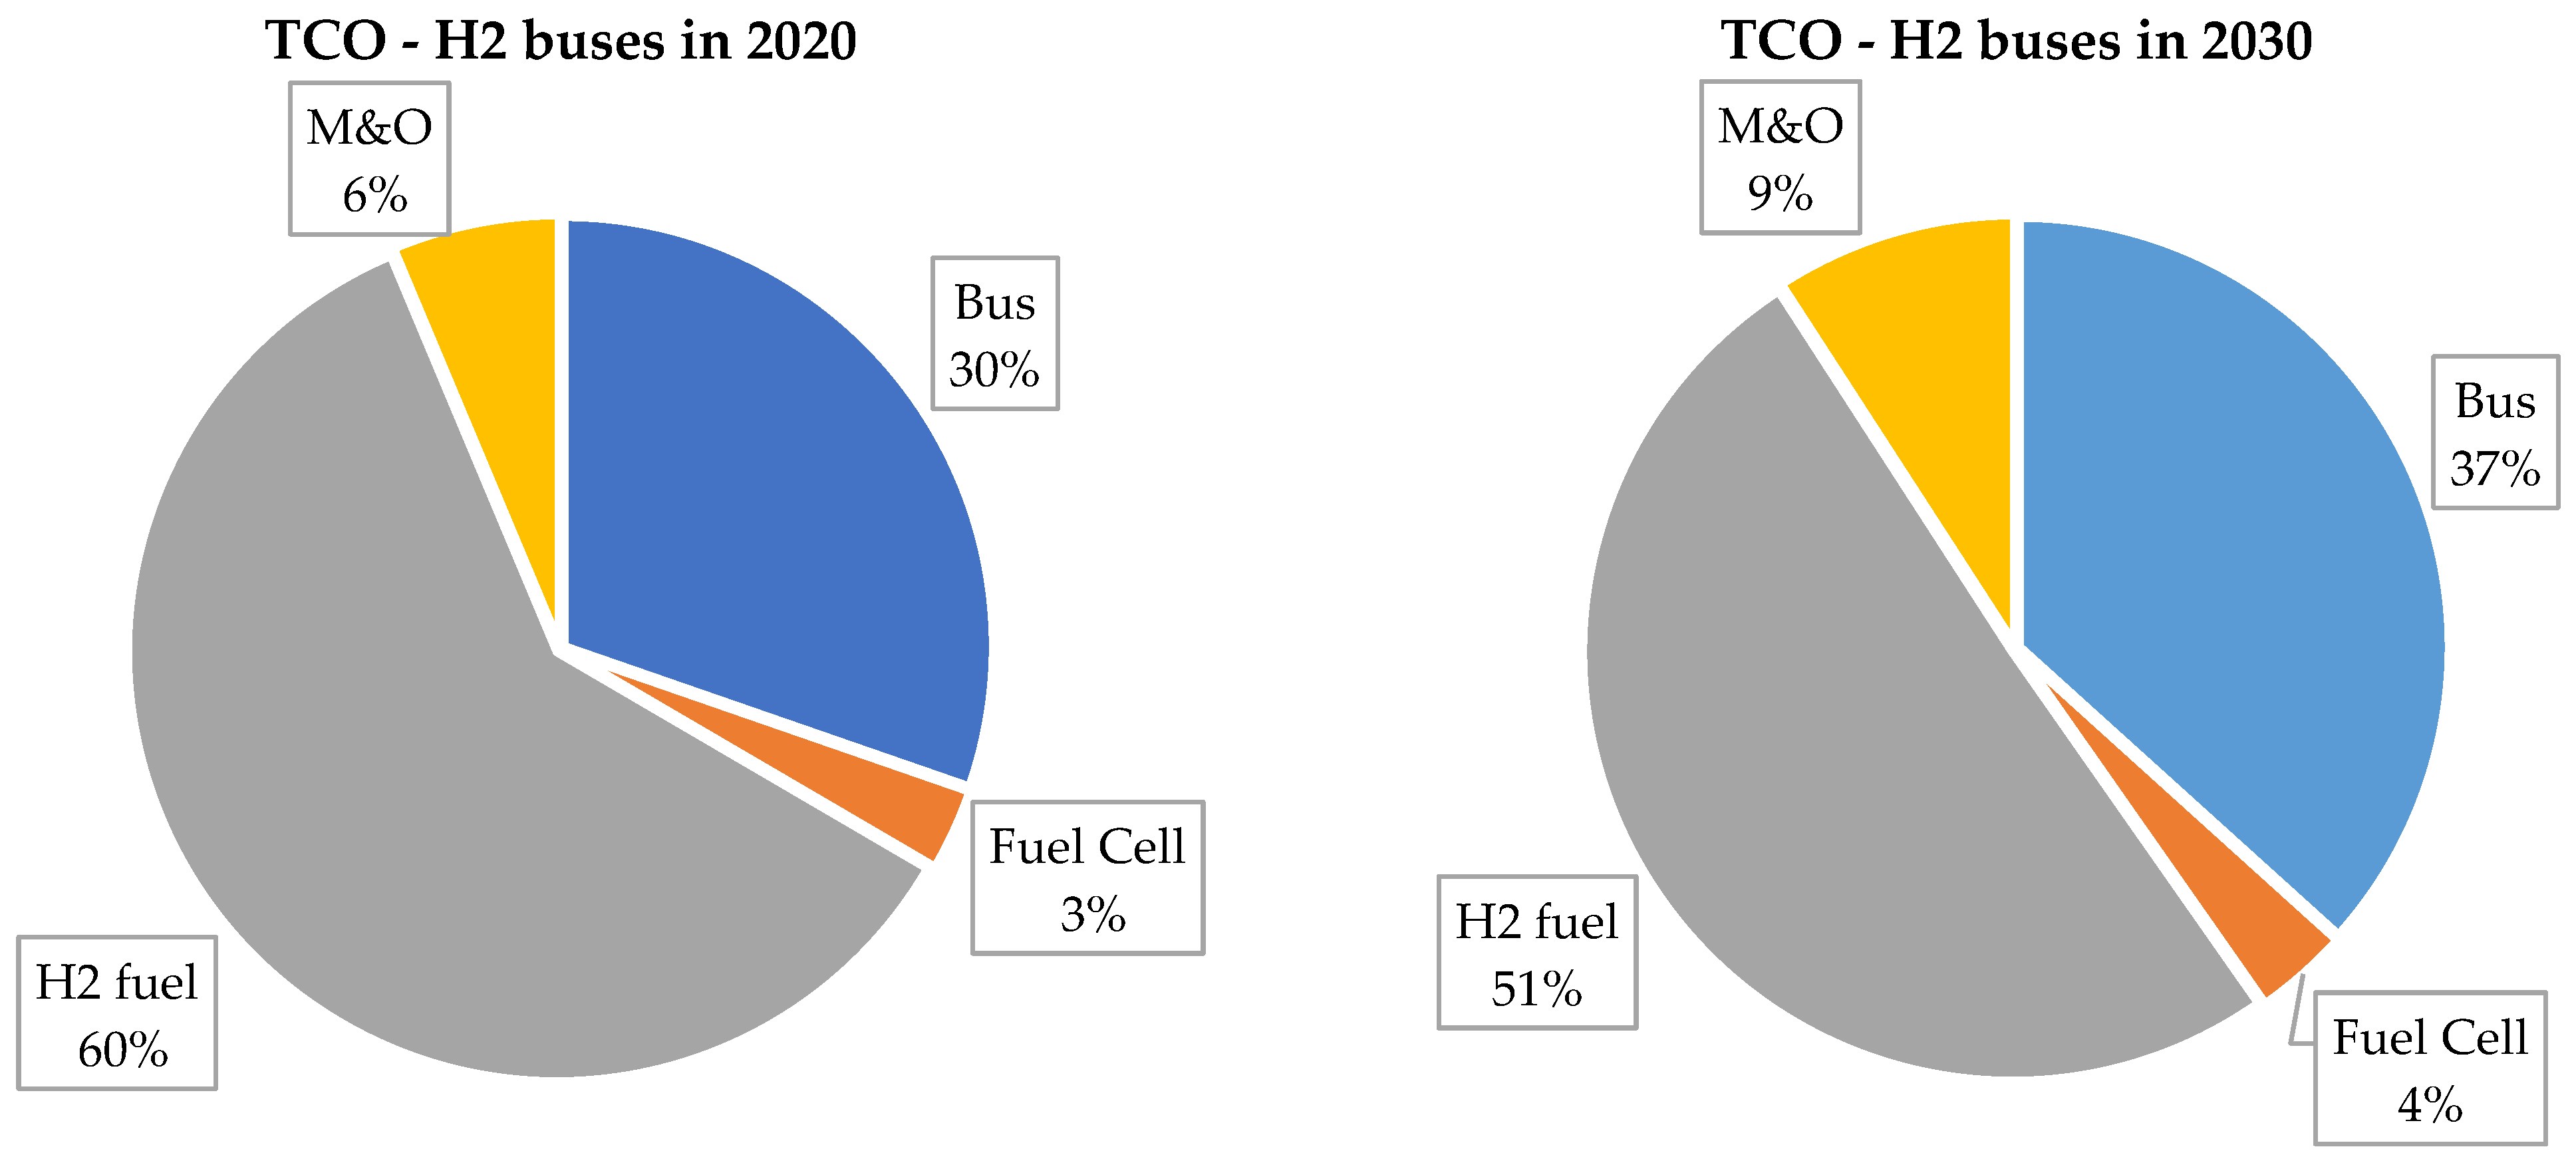
7.2. Hydrogen Fuel Cell Bus
7.3. Comparison between Electric and Hydrogen Bus
8. Conclusions and Outlook
Author Contributions
Funding
Institutional Review Board Statement
Informed Consent Statement
Data Availability Statement
Conflicts of Interest
Appendix A

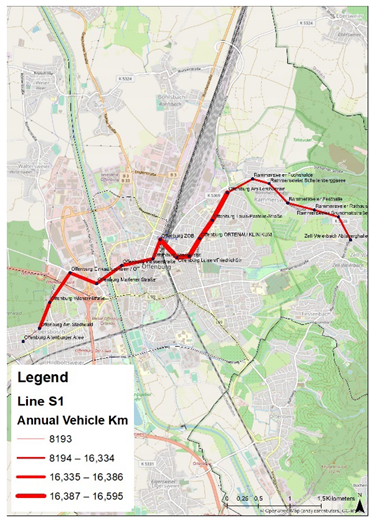
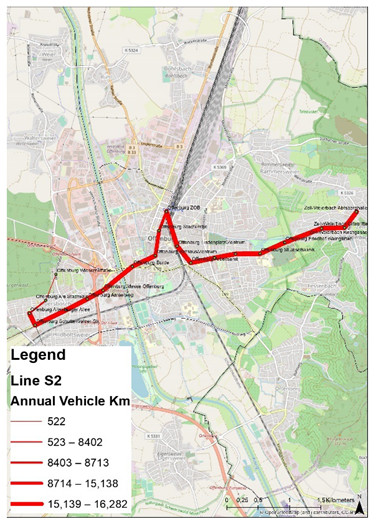
| Line S1: Albersbösch–Einkaufszentren/OT–Bahnhof/ZOB–Ortenau Klinikum–Rammersweier–Zell-Weierbach Abtsberghalle | Line S2: Alberbösch–Messe–Zentrum–Bahnhof-ZOB–Kulturforum–Zell Weierbach–Abstberghalle |
 |  |
| Line S3: Hildboltsweier–Messe–Zentrum–Bahnhof/ZOB–Waltersweier–Weier | Line S4: Windschläg–Bohlsbach–Bahnhof/ZOB–Landratsamt |
 |  |
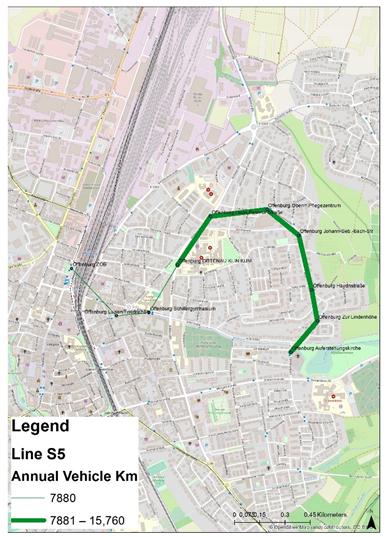
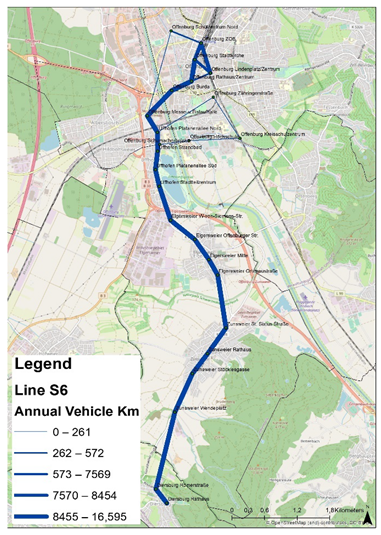
| Line S5: Bahnhof/ZOB–Ortenau Klinikum–Oberrh. Pflege-Therapiezentrum–Aufstehungskirche | Line S6: Bahnhof/ZOB–Zentrum–Messe–Uffhofen–Eigersweier–Zunsweier–Diersburg |
 |  |
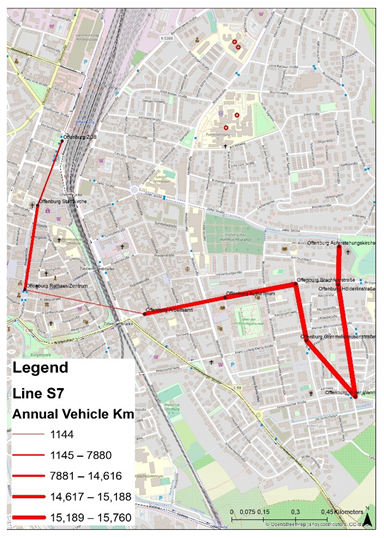
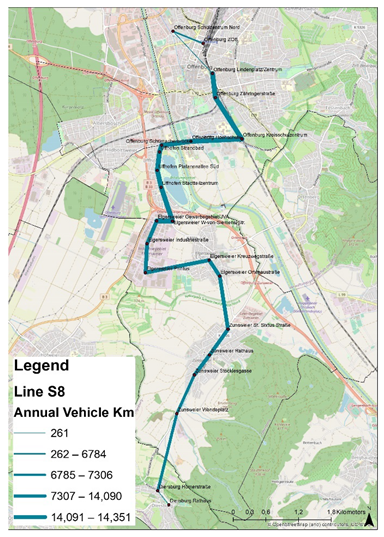
| Line S7: Bahnhof/ZOB–Zentrum–Kulturforum–Auferstehungskirche | Line S8: Bahnhof/ZOB–Zentrum–Kreisschulzentrum–Hochschule–Uffhofen–Eigersweier |
 |  |
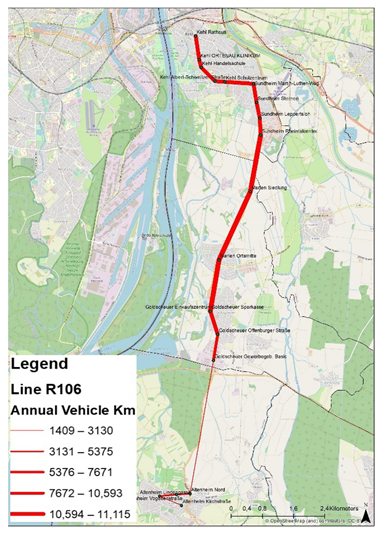
| Line S9: Schulzentrum Nord–Bahnhof/ZOB–Zentrum–Fessenbach–Zell-Weierbach Riedle | Line R106: (Lahr–Offenburg-) Altenheim–Kehl |
 |  |
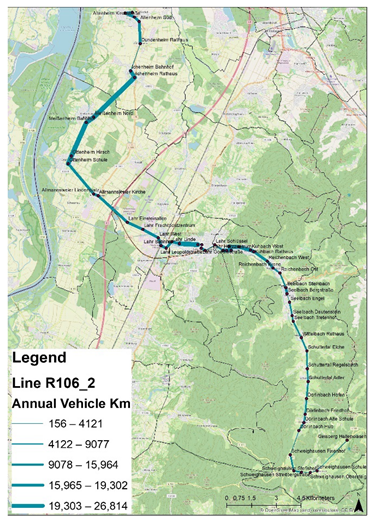
| Linie 106_2: Schweighausen–Seelbach–Lahr–Altenheim (-Offenburg–Kehl) | Line R301: Offenburg–Altenheim–Kehl |
 |  |
References
- Kunith, A.; Mendelevitch, R.; Goehlich, D. Electrification of a city bus network—An optimization model for cost-effective placing of charging infrastructure and battery sizing of fast-charging electric bus systems. Int. J. Sustain. Transp. 2017, 11, 707–720. [Google Scholar] [CrossRef] [Green Version]
- ZeEUS. ZeEUS eBus Report—An Overview of Electric Buses in Europe. Available online: https://zeeus.eu/uploads/publications/documents/zeeus-ebus-report-internet.pdf (accessed on 14 April 2019).
- Offer, G.J.; Howey, D.; Contestabile, M.; Clague, R.; Brandon, N.P. Comparative analysis of battery electric, hydrogen fuel cell and hybrid vehicles in a future sustainable road transport system. Energy Policy 2010, 38, 24–29. [Google Scholar] [CrossRef] [Green Version]
- Lozanovski, A.; Whitehouse, N.; Ko, N.; Whitehouse, S. Sustainability Assessment of Fuel Cell Buses in Public Transport. Sustainability 2018, 10, 1480. [Google Scholar] [CrossRef] [Green Version]
- Quarles, N.; Kockelman, K.M.; Mohamed, M. Costs and Benefits of Electrifying and Automating Bus Transit Fleets. Sustainability 2020, 12, 3977. [Google Scholar] [CrossRef]
- Brdulak, A.; Chaberek, G.; Jagodziński, J. Development Forecasts for the Zero-Emission Bus Fleet in Servicing Public Transport in Chosen EU Member Countries. Energies 2020, 13, 4239. [Google Scholar] [CrossRef]
- Yan, Y.; Wang, H.; Jiang, J.; Zhang, W.; Bao, Y.; Huang, M. Research on Configuration Methods of Battery Energy Storage System for Pure Electric Bus Fast Charging Station. Energies 2019, 12, 558. [Google Scholar] [CrossRef] [Green Version]
- Chen, G.; Hu, D.; Chien, S.; Guo, L.; Liu, M. Optimizing Wireless Charging Locations for Battery Electric Bus Transit with a Genetic Algorithm. Sustainability 2020, 12, 8971. [Google Scholar] [CrossRef]
- Połom, M.; Wiśniewski, P. Implementing Electromobility in Public Transport in Poland in 1990–2020. A Review of Experiences and Evaluation of the Current Development Directions. Sustainability 2021, 13, 4009. [Google Scholar] [CrossRef]
- Ammenberg, J.; Dahlgren, S. Sustainability Assessment of Public Transport, Part I—A Multi-Criteria Assessment Method to Compare Different Bus Technologies. Sustainability 2021, 13, 825. [Google Scholar] [CrossRef]
- Barraza, O.; Estrada, M. Battery Electric Bus Network: Efficient Design and Cost Comparison of Different Powertrains. Sustainability 2021, 13, 4745. [Google Scholar] [CrossRef]
- Díez, A.; Restrepo, M. A Planning Method for Partially Grid-Connected Bus Rapid Transit Systems Operating with In-Motion Charging Batteries. Energies 2021, 14, 2550. [Google Scholar] [CrossRef]
- Kivekäs, K.; Lajunen, A.; Vepsäläinen, J.; Tammi, K. City Bus Powertrain Comparison: Driving Cycle Variation and Passenger Load Sensitivity Analysis. Energies 2018, 11, 1755. [Google Scholar] [CrossRef] [Green Version]
- Choi, U.-D.; Jeong, H.-K.; Jeong, S.-K. Commercial operation of ultra low floor electric bus for Seoul city route. In Proceedings of the IEEE Vehicle Power and Propulsion Conference (VPPC), Seoul, Korea, 9–12 October 2012. [Google Scholar]
- Lajunen, A. Energy consumption and cost-benefit analysis of hybrid and electric city buses. Transp. Res. Part C: Emerg. Technol. 2014, 38, 1–15. [Google Scholar] [CrossRef]
- Stempien, J.; Chan, S.; Stempien, J.; Chan, S. Comparative study of fuel cell, battery and hybrid buses for renewable energy constrained areas. J. Power Sources 2017, 340, 347–355. [Google Scholar] [CrossRef]
- Ajanovic, A.; Haas, R.; Ajanovic, A.; Haas, R. Prospects and impediments for hydrogen and fuel cell vehicles in the transport sector. Int. J. Hydrogen Energy 2021, 46, 10049–10058. [Google Scholar] [CrossRef]
- Meishner, F.; Sauer, D.U. Introduction of Battery Electric Buses in European Cities. In Proceedings of the 7th Transport Research Arena TRA 2018, Vienna, Austria, 16–19 April 2018. [Google Scholar]
- Nurhadi, L.; Borén, S.; Ny, H. A Sensitivity Analysis of Total Cost of Ownership for Electric Public Bus Transport Systems in Swedish Medium Sized Cities. Transp. Res. Procedia 2014, 3, 818–827. [Google Scholar] [CrossRef] [Green Version]
- Pihlatie, M.; Kukkonen, S.; Halmeaho, T.; Karvonen, V.; Nylund, N.-O. Fully Electric City Buses—The Viable Option. In Proceedings of the 2014 IEEE International Electric Vehicle Conference (IEVC), Florence, Italy, 17–19 December 2014. [Google Scholar]
- Vepsäläinen, J.; Baldi, F.; Lajunen, A.; Kivekäs, K.; Tammi, K. Cost-Benefit Analysis of Electric Bus Fleet with Various Oper-ation Intervals. In Proceedings of the 21st International Conference on Intelligent Transportation Systems (ITSC), Maui, HI, USA, 4–7 November 2018. [Google Scholar]
- Wang, G.; Xie, X.; Zhang, F.; Liu, Y.; Zhang, D. bCharge: Data-Driven Real-Time Charging Scheduling for Large-Scale Electric Bus Fleets. In Proceedings of the 2018 IEEE Real-Time Systems Symposium (RTSS), Nashville, TE, USA, 11–14 December 2018; pp. 45–55. [Google Scholar] [CrossRef]
- Briñas Gorosabel, O.L. Assessing the Construction of Charging Stations for Electric Buses—A Case Study for Stockholm Inner City. Master’s Thesis, KTH Royal Institute of Technology, Stockholm, Sweden, 2017. [Google Scholar]
- Babin, A.; Rizoug, N.; Mesbahi, T.; Boscher, D.; Hamdoun, Z.; Larouci, C. Total Cost of Ownership Improvement of Commercial Electric Vehicles Using Battery Sizing and Intelligent Charge Method. IEEE Trans. Ind. Appl. 2018, 54, 1691–1700. [Google Scholar] [CrossRef]
- FCH-JU. Urban Buses: Alternative Powertrains for Europe. Available online: https://www.fch.europa.eu/sites/default/files/20121029%20Urban%20buses%2C%20alternative%20powertrains%20for%20Europe%20-%20Final%20report_0_0.pdf (accessed on 30 June 2019).
- Bundesministerium für Verkehr und digitale Infrastruktur BMVI (2008): Mobilität in Deutschland (MiD). 2018. Available online: https://www.bmvi.de/SharedDocs/DE/Artikel/G/mobilitaet-in-deutschland.html (accessed on 30 June 2019).
- DELFI e.V. (2018): Zentrales Haltestellenverzeichnis-zHV. Hg. v. WVI Prof. Dr. Wermuth Verkehrsforschung und Infrastrukturplanung GmbH. Available online: https://zhv.wvigmbh.de/ (accessed on 19 April 2021).
- VALIDATE. Karlsruhe: PTV Group. Available online: https://www.ptvgroup.com/de/loesungen/produkte/ptv-karten-daten/verkehrsplanung/validate/ (accessed on 18 April 2021).
- Bloomberg New Energy Finance: Electric Buses in Cities: Driving towards Cleaner Air and Lower CO2. 2018. Available online: https://about.bnef.com/blog/electric-buses-cities-driving-towards-cleaner-air-lower-co2/ (accessed on 5 July 2019).
- Kunith, A.W. Elektrifizierung des Urbanen Öffentlichen Busverkehrs; Springer: Wiesbaden, Germany, 2017; p. 146. [Google Scholar]
- Mathieu, L. Electric Buses Arrive on Time. Available online: https://www.transportenvironment.org/sites/te/files/publications/Electric%20buses%20arrive%20on%20time.pdf (accessed on 5 July 2019).
- Grütter, J.M. Real World Performance of Hybrid and Electric Buses; Grütter Consulting AG: Reinach, Switzerland, 2015. [Google Scholar]
- Mohamed, M.; Higgins, C.; Ferguson, M.; Requia, W. The influence of vehicle body type in shaping behavioural intention to acquire electric vehicles: A multi-group structural equation approach. Transp. Res. Part A Policy Pract. 2018, 116, 54–72. [Google Scholar] [CrossRef]
- Eudy, L.; Prohaska, R.; Kelly, K.; Post, M. Foothill Transit Battery Electric Bus Demonstration Results. National Renewable Energy Laboratory, Jan. 2016. Available online: https://www.nrel.gov/docs/fy16osti/65274.pdf (accessed on 5 July 2019).
- Maria, Ö. Information om Genomförd Behovsanalys av Övergång till Eldriven Busstrafik 2015. Available online: https://docplayer.se/788872-Information-om-genomford-behovsanalys-av-overgang-till-eldriven-busstrafik.html (accessed on 16 July 2019).
- Lajunen, A.; Lipman, T. Lifecycle cost assessment and carbon dioxide emissions of diesel, natural gas, hybrid electric, fuel cell hybrid and electric transit buses. Energy 2016, 106, 329–342. [Google Scholar] [CrossRef]
- Hoerold, S.; Breitkopf, M. Städteübergreifendes Konzept für Elektrisch Angetriebene Busse in Theringer Mittelstaedten; Fraunhofer IVI: Dresden, Germany, 2015. [Google Scholar]
- Nykvist, B.; Sprei, F.; Nilsson, M. Assessing the progress toward lower priced long range battery electric vehicles. Energy Policy 2019, 124, 144–155. [Google Scholar] [CrossRef]
- Bus2bus, e-Buses: Manufacturers Are Delivering. Available online: https://www.bus2bus.berlin/en/blog/e-buses-manufacturers-are-delivering/ (accessed on 16 July 2019).
- Oeko-Institut. Projected EEG Costs up to 2035. A Study Commissioned by Agora Energiewende. 2016. Available online: https://static.agora-energiewende.de/fileadmin/Projekte/2015/EEG-Kosten-bis-2035/Agora_EEG-Kosten_bis_2035_EN_WEB.pdf (accessed on 16 July 2019).
- International Energy Agency. Global EV Outlook 2018. Available online: https://www.connaissancedesenergies.org/sites/default/files/pdf-actualites/globalevoutlook2018.pdf (accessed on 16 July 2019).
- Potkány, M.; Technical University in Zvolen Faculty of Wood Sciences and Technology Department of Business Economics Slovak Republic; Hlatká, M.; Debnár, M.; Hanzl, J. Comparison of the Lifecycle Cost Structure of Electric and Diesel Buses. Naše More 2018, 65, 270–275. [Google Scholar] [CrossRef]
- Rendimiento Real de Buses. Available online: https://www.yutong.com/products/E12%EF%BC%88ZK6128BEVG%EF%BC%89-EuropeNA.shtml (accessed on 16 July 2019).
- Barnitt, R. NREL Case Study: Ebus Hybrid Electric Buses and Trolleys. Technical Report, July 2006. Available online: https://www.nrel.gov/docs/fy06osti/38749.pdf (accessed on 10 July 2020).
- Laver, R.; Schneck, D.; Skorupski, D.; Brady, S.; Cham, L.; Hamilton, B.A. Useful Life of Transit Buses and Vans. Federal Transit Administration. Springfield, U.S. April 2007. Available online: https://www.transitwiki.org/TransitWiki/images/6/64/Useful_Life_of_Buses.pdf (accessed on 9 August 2020).
- Vilppo, O.; Markkula, J. Feasibility of Electric Buses in Public Transport. World Electr. Veh. J. 2015, 7, 357–365. [Google Scholar] [CrossRef] [Green Version]
- Regional Transportation Commission of Washoe County. Electric Bus Initiative Benefit-Cost Analysis Supplementary Documentation. TIGER Discretionary Grant Program. 29 April 2016. Available online: https://www.rtcwashoe.com/wp-content/uploads/2017/04/2016-Tiger-Grant-BCA.pdf (accessed on 29 September 2020).
- Conti, V.; Orchi, S.; Valentini, M.P.; Nigro, M.; Calò, R. Design and evaluation of electric solutions for public transport. Transp. Res. Procedia 2017, 27, 117–124. [Google Scholar] [CrossRef]
- Johnson, C.; Nobler, E.; Eudy, L.; Jeffers, M. Financial Analysis of Battery Electric Transit Buses; National Renewable Energy Laboratory: Golden, CO, USA, 2020.
- NREL/TP-5400-74832. Available online: https://www.nrel.gov/docs/fy20osti/74832.pdf (accessed on 23 October 2020).
- EMCEL. Wie Entwickeln Sich Die Preise für Brennstoffzellenbusse? EMCEL. 2018. Available online: https://emcel.com/de/preise-fuer-brennstoffzellenbusse/ (accessed on 5 March 2021).
- Berger, R. Fuel Cell Electric Buses—Potential for Sustainable Public Transport in Europe; FCH-JU: Munchen, Germany, 2015. [Google Scholar]
- Element Energy Limited. Strategies for Joint Procurement of Fuel Cell Buses; FCH-JU: Munchen, Germany, 2018; Available online: https://www.fch.europa.eu/sites/default/files/Strategies_%20for_joint_procurement_of_FCbuses_final_report.pdf (accessed on 5 March 2021).
- Torregrossa, M. UGAP: Une Commande Groupée pour 1000 Bus à Hydrogène d’ici 2024, 2019. Available online: https://www.h2-mobile.fr/actus/ugap-commande-groupee-1000-bus-hydrogene-2024/ (accessed on 10 March 2021).
- Reuter, D.B. New Bus ReFuelling for European Hydrogen Bus Depots. FCH JU. 2017. Available online: http://newbusfuel.eu/wp-content/uploads/2017/03/NewBusFuel_D4.3_Guidance-document-for-large-scale-hydrogen-refuelling_final.pdf (accessed on 10 March 2021).
- Ballard. FUEL CELL ELECTRIC BUSES, Proven Performance and the Way Forward. 2019. Available online: https://www.ballard.com/docs/default-source/web-pdf’s/white-paper_fuel-cell-buses-for-france_final-english-web.pdf?sfvrsn=939bc280_0 (accessed on 16 March 2021).
- Lajunen, A.; Tammi, K. Evaluation of Energy Consumption and Carbon Dioxide Emissions of Electric City Buses; Electric Commercial Vehicles (ECV); VTT Technical Research Centre of Finland: Espoo, Finland, 2019; pp. 104–120. [Google Scholar]
- Hacker, F.; Waldenfels, R.; Mottschall, M. Wirtschaftlichkeit von Elektromobilität in gewerblichen Anwendungen: Betrachtung von Gesamtnutzungskosten, ökonomischen Potenzialen und möglicher CO2-Minderung. IKT für Elektromo-bilität, Berlin, Germany, April 2015. Available online: https://www.digitale-technologien.de/DT/Redaktion/DE/Downloads/Publikation/IKT-EM/ikt2-studie-wirtschaftlichkeit-ikt-elektromobilitaet-2.pdf?__blob=publicationFile&v=4 (accessed on 20 March 2021).
- Energy Efficiency in Transport from Wikipedia. Available online: https://en.wikipedia.org/wiki/Energy_efficiency_in_transport#Buses (accessed on 20 March 2020).


| Category | Overnight Charging E-Bus | Pantograph Charging E-Bus | Unit |
|---|---|---|---|
| Vehicle body | 210 | 210 | k€ |
| Drive system and power electronics | 105 | 105 | k€ |
| Bus side charging components | 5 | 15 | k€ |
| Total costs | 320 | 330 | k€ |
| Category | Mon.–Fri. | Sat. | Unit |
|---|---|---|---|
| Daily distance | 169 | 125 | km/day/vehicle |
| Required capacity, energy consumption: 1.1 kWh/km | 185.9 | 137.5 | kWh/day/vehicle |
| Required battery capacity | 260 | 200 | kWh/day/vehicle |
| Number of days per year | 261 | 52 | day |
| Required number of bus | 2 | 1 | vehicle |
| Line | Required No. of Bus | Route [km] | Duration [min] | Required Capacity [kWh] | Charging Time [min] |
|---|---|---|---|---|---|
| S1 | 2 | 7.5 | 29 | 8.25 | 1 |
| S2 | 2 | 7.7 | 26 | 8.47 | 1 |
| S3 | 2 | 8.9 | 27 | 9.79 | 1 |
| S4 | 2 | 7.3 | 32 | 8.03 | 1 |
| S5 | 1 | 2.6 | 12 | 2.86 | 0.5 |
| S6 | 2 | 34 | 50 | 37.4 | 6 |
| S7 | 1 | 3.4 | 14 | 3.74 | 0.5 |
| S8 | 2 | 16.6 | 52 | 18.26 | 2 |
| S9 | 1 | 10.2 | 40 | 11.11 | 1.5 |
| Parameter | Value | Unit |
|---|---|---|
| Vehicle cost in 2020 | 300,000 | € |
| Vehicle cost in 2030 | 250,000 | € |
| Battery cost in 2020 | 667 | €/kWh |
| Battery cost in 2030 | 100 | €/kWh |
| Depot charging station cost in 2020 | 28,500 | € |
| Depot charging station cost in 2030 | 18,500 | € |
| Grid connection & Planning & Transformer cost | 15,500 | € |
| Electricity cost in 2020 | 0.181 | €/kWh |
| Electricity cost in 2030 | 0.167 | €/kWh |
| Maintenance & Operation cost (Bus) | 0.11 | €/km |
| Maintenance & Operation cost (Charger) | 0.14 | €/kWh |
| Interest rate | 5 | % |
| Discount Rate, % | Year | Source |
|---|---|---|
| 7 | 2007 | [45] |
| 3 | 2015 | [46] |
| 3 | 2016 | [47] |
| 7 | 2016 | [47] |
| 5 | 2017 | [48] |
| 2.5 | 2018 | [43] |
| 4 | 2018 | [18] |
| 5 | 2018 | [21] |
| 3.6 | 2020 | [49] |
| Parameter | Value | Unit |
|---|---|---|
| Vehicle cost in 2020 | 330,000 | € |
| Vehicle cost in 2030 | 280,000 | € |
| Battery cost in 2020 | 1200 | €/kWh |
| Battery cost in 2030 | 200 | €/kWh |
| Pantograph charging station cost | 457,000 | € |
| Coupling system and transformer cost | 58,500 | € |
| Maintenance and operation cost (charger) | 5000 | €/year |
| Line | S1/S2 | S3 | S4 | S5/S7 | S6 | S8 | S9 |
|---|---|---|---|---|---|---|---|
| Annual mileage [km p.a.] | 256,500 | 161,000 | 148,000 | 95,000 | 205,500 | 184,000 | 43,500 |
| Number of buses required | 4 | 2 | 2 | 2 | 3 | 2 | 1 |
| Max Daily mileage per bus [km] | 246 | 308 | 283 | 181 | 262 | 327 | 166 |
| Annual H2 consumption [T/y] | 20.5 | 12.9 | 11.9 | 7.6 | 16.5 | 14.7 | 3.5 |
| Parameter | Hypothesis |
|---|---|
| Bus-acquisition costs | Current: 430 k€ Prospective 2030: 360 k€ |
| Lifetime bus | 12 years |
| Lifetime power train | 6 years |
| Replacement power train | Current: 50 k€ Prospective: 40 k€ |
| Yearly bus maintenance costs (regular maintenance)) | 0.11 €/km |
| Hydrogen specific consumption | 8 kg/100 km |
| H2 Refueling Station | Value | Unit |
|---|---|---|
| Electrolyzer nominal power | 800 | kW |
| Specific energy consumption | 55 | kWh/kg |
| Nominal production rate | 14 | kg/h |
| Investment costs—electrolyzer | 720,000 | € |
| Maintenance costs—electrolyzer | 3% | % of investment costs |
| Investment costs—stack (2 replacements in 20 y lifetime) | 30% | % of investment costs |
| Storage nominal pressure | 440 | bar |
| Storage nominal capacity | 500 | kg |
| Investment costs—storage | 500,000 | € |
| Maintenance costs—storage | 3% | % of investment costs |
| Buffer storage nominal pressure | 20 | bar |
| Buffer storage nominal capacity | 5 | kg |
| Investment costs—buffer storage | 7500 | € |
| Maintenance costs—buffer storage | 3% | % of investment costs |
| Compressor nominal power | 50 | kW |
| Investment costs—compressor | 136,500 | € |
| Maintenance costs—compressor | 5% | % of investment costs |
| Number of compressors | 2 | - |
| Parameter | Value | Unit | Source |
|---|---|---|---|
| Vehicle cost | 250,000 | € | [56] |
| Diesel cost in 2020 | 1.24 | €/L | [57] |
| Diesel cost in 2030 | 1.37 | €/L | [57] |
| Vehicle efficiency | 0.3904 | L/km | [58] |
| Maintenance and operation cost | 0.25 | €/km | [59] |
| S1/S2 | S3 | S4 | S5/S7 | S6 | S8 | S9 | |
|---|---|---|---|---|---|---|---|
| Bus €/km | 0.757 | 0.603 | 0.656 | 1.021 | 0.708 | 0.527 | 1.115 |
| FC €/km | 0.077 | 0.061 | 0.067 | 0.104 | 0.072 | 0.054 | 0.113 |
| H2 fuel €/km | 1.048 | 1.048 | 1.048 | 1.048 | 1.048 | 1.048 | 1.048 |
| M&O €/km | 0.11 | 0.11 | 0.11 | 0.11 | 0.11 | 0.11 | 0.11 |
| TOTAL €/km | 1.992 | 1.822 | 1.881 | 2.283 | 1.938 | 1.739 | 2.386 |
| S1/S2 | S3 | S4 | S5/S7 | S6 | S8 | S9 | |
|---|---|---|---|---|---|---|---|
| Bus €/km | 0.633 | 0.505 | 0.549 | 0.855 | 0.593 | 0.441 | 0.934 |
| FC €/km | 0.061 | 0.049 | 0.053 | 0.083 | 0.058 | 0.043 | 0.091 |
| H2 fuel €/km | 0.608 | 0.608 | 0.608 | 0.608 | 0.608 | 0.608 | 0.608 |
| M&O €/km | 0.11 | 0.11 | 0.11 | 0.11 | 0.11 | 0.11 | 0.11 |
| TOTAL €/km | 1.412 | 1.272 | 1.32 | 1.656 | 1.369 | 1.202 | 1.743 |
| Parameter | Battery Prices for Depot Buses [€/kWh] | Battery Prices for Pantograph Buses [€/kWh] | Hydrogen Costs for Pantograph Buses [€/kg] |
|---|---|---|---|
| Optimistic | 50 | 100 | 5 |
| Base | 100 | 200 | 7.6 |
| Pessimistic | 150 | 300 | 10.2 |
| Parameter | Vehicle Body Prices [k€] | Lifetime of a Vehicle Body [Year] | Lifetime of a Battery [Year] |
|---|---|---|---|
| Optimistic | 196 | 15.6 | 9.75 |
| Base | 280 | 12 | 6.5 |
| Pessimistic | 364 | 8.4 | 3.25 |
Publisher’s Note: MDPI stays neutral with regard to jurisdictional claims in published maps and institutional affiliations. |
© 2021 by the authors. Licensee MDPI, Basel, Switzerland. This article is an open access article distributed under the terms and conditions of the Creative Commons Attribution (CC BY) license (https://creativecommons.org/licenses/by/4.0/).
Share and Cite
Kim, H.; Hartmann, N.; Zeller, M.; Luise, R.; Soylu, T. Comparative TCO Analysis of Battery Electric and Hydrogen Fuel Cell Buses for Public Transport System in Small to Midsize Cities. Energies 2021, 14, 4384. https://doi.org/10.3390/en14144384
Kim H, Hartmann N, Zeller M, Luise R, Soylu T. Comparative TCO Analysis of Battery Electric and Hydrogen Fuel Cell Buses for Public Transport System in Small to Midsize Cities. Energies. 2021; 14(14):4384. https://doi.org/10.3390/en14144384
Chicago/Turabian StyleKim, Hanhee, Niklas Hartmann, Maxime Zeller, Renato Luise, and Tamer Soylu. 2021. "Comparative TCO Analysis of Battery Electric and Hydrogen Fuel Cell Buses for Public Transport System in Small to Midsize Cities" Energies 14, no. 14: 4384. https://doi.org/10.3390/en14144384