Article

Cryptocurrency Mining from an Economic and Environmental Perspective. Analysis of the Most and Least Sustainable Countries

by
Sergio Luis Náñez Alonso
*,
Javier Jorge-Vázquez
*,
Miguel Ángel Echarte Fernández
and
Ricardo Francisco Reier Forradellas
DEKIS Research Group, Department of Economics, Catholic University of Avila, 05005 Ávila, Spain
*
Authors to whom correspondence should be addressed.
Energies 2021, 14(14), 4254; https://doi.org/10.3390/en14144254
Submission received: 15 June 2021 / Revised: 12 July 2021 / Accepted: 12 July 2021 / Published: 14 July 2021
(This article belongs to the Special Issue Energy Security and the Transition toward Green Energy Production)

Abstract

:
There are different studies that point out that the price of electricity is a fundamental factor that will influence the mining decision, due to the cost it represents. There is also an ongoing debate about the pollution generated by cryptocurrency mining, and whether or not the use of renewable energies will solve the problem of its sustainability. In our study, starting from the Environmental Performance Index (EPI), we have considered several determinants of cryptocurrency mining: energy price, how that energy is generated, temperature, legal constraints, human capital, and R&D&I. From this, via linear regression, we recalculated this EPI by including the above factors that affect cryptocurrency mining in a sustainable way. The study determines, once the EPI has been readjusted, that the most sustainable countries to perform cryptocurrency mining are Denmark and Germany. In fact, of the top ten countries eight of them are European (Denmark, Germany, Sweden, Switzerland, Finland, Austria, and the United Kingdom); and the remaining two are Asian (South Korea and Japan).

1. Introduction

The accelerated development of new technologies is transforming the traditional forms and balances of economic and social organization [1]. In particular, the confluence of technological, economic, and socio-cultural factors is changing the conventional ways in which commercial exchanges take place [2] and by extension, payment systems [3]. In recent years, a diverse set of virtual or digital currencies known as cryptocurrencies have emerged strongly that act as means of exchange and adopt the functions of money in this sense, but “unlike traditional currency, is untethered to, and independent from, national borders, central banks, sovereigns, or fiats” [4]. The phenomenon of cryptocurrencies is a controversial reality that has been analyzed from multiple approaches and disciplines ranging from economics, sociology, engineering or political science, among others [5]. One of the aspects that are part of the debate around cryptocurrencies is the significant electrical energy needs required by mining processes and the consequent potential environmental impact [6], which has led some cryptocurrency mining powers such as China to raise the possibility of banning them [7]. On 1 November 2008, few could have imagined the impact and importance that the submission made by “Satoshi Nakamoto” would have. That day, a new “peer-to-peer” [8] electronic payment system was announced on the Metzworld cryptography mailing list, where its operation and features were explained; thus Bitcoin (hereinafter BTC) was born [9]. Its growth over time has increased: both users, price, and also detractors. However, the fact we want to focus on in this article is how the price of Bitcoin was first set with respect to a traditional currency, the US Dollar. This price was set at the now defunct online exchange house New Liberty Standard in 2015. The aforementioned online exchange house sold 5050 BTC for 5.02 US Dollars, which is equivalent to one dollar for every 1006 BTC [10]. The Bitcoin mining process is always the same: the “miners” receive a new mathematical problem every ten minutes and the fastest to solve it gets the new coins that are put into circulation [11,12]. This mathematical problem is based on random calculations that aim to find the solution and thus obtain the validation of the block [13]. Whoever deciphers this will get the reward, provided that the rest of the members of the network confirm that the answer is correct. Currently, 6.25 Bitcoins are obtained for each new block validated; this is due to the third Bitcoin halving that took place on 11 May 2020 [14]. We must consider that to this fixed amount of Bitcoins are added the commissions for each of the transactions. The generation of these types of virtual currencies involves the use of a large number of computers working simultaneously, so it implies a large energy expenditure [15,16]. Despite the popularization of this problem, the existing literature on this issue is still scarce.
In this context, this article aims to respond to the challenge of ensuring a higher sustainability factor for mining tasks. To this end, it examines, among a very broad set of countries, the profile of those countries that are optimal for carrying out such tasks, giving priority to the sustainability factor. The original contribution of this article is that the analysis is not only limited to the analysis of the economic viability quantified through the different energy costs, but also incorporates a particularly relevant factor in our day, namely, environmental sustainability, into the analysis.
For this purpose, the study adopts a mainly empirical analytical method, through the analysis of frequencies and correlations; 144 countries were considered as the study population, of which 133 finally made up the study sample.

2. Literature Review

There is currently a great debate in the scientific community about the impact that mining Bitcoin and other cryptocurrencies can have on the environment; and to what extent this exponential growth in mining can have on the objectives established to mitigate climate change [17]. The authors [18,19] point out in their study that “energy-derived emissions from mining could drive global warming above 2 °C”. Very illustrative of the above, for the purpose of economically quantifying this impact, is what is collected by [20] in his study that points out that “the results illustrate a scenario where each 1 USD of cryptocurrency coin value created would be responsible for 0.66 UDS in health and climate damages”. On the other hand, other authors such as [21] defend that implausible projections are being made, which are overestimating Bitcoin CO2 emissions in the short term; who are joined by [22] who likewise criticizes “the inclusion of unprofitable mining platforms […], thus greatly overestimating emissions”. However, despite the results reported by [18,19,20], there is currently a great debate in the scientific community about the real impact of cryptocurrency mining on the environment, as other authors, such as [21,22], argue that this impact is overestimated. Furthermore, [23] indicate that in addition to Bitcoin, the expansion of the entire blockchain-based industry must be taken into account when calculating the environmental impact, and they put forward six scenarios. Thus, the authors [24] advocate that “a site regulation policy that induces changes in the energy consumption structure of mining activities is more effective in limiting carbon emissions” arising from cryptocurrency and blockchain mining. All this, referring to China, which as we indicate below currently accounts for 72% of the global hash rate. What is undeniable, beyond the estimates made, is that the mining of cryptocurrencies and the use of blockchain means an increase in energy demand, and that depending on how it is produced, it will have a greater or lesser impact on the environment. It is an indisputable fact that the lack of official statistics on the number of miners and the energy efficiency of their platforms makes it difficult to accurately estimate the environmental impact of mining processes. Despite this, some authors have made an effort to estimate the associated energy consumption. Thus, [25] points out that Bitcoin mining “is responsible for 13,000 kg of CO2 emissions for each bitcoin mined, and 40,000 kg of CO2 per hour” and also at a global level involves an “annual electricity consumption for bitcoin production that is currently equivalent to 32.56 tera-watts per hour (TWh), this being greater than the aggregate consumption of Ireland or Denmark”. It was estimated by [26] that “From 1 January 2016 to 30 June 2018, we estimate that mining Bitcoin, Ethereum, Litecoin and Monero consumed an average of 17, 7, 7 and 14 MJ to generate one USD, respectively”; during this period the authors estimate that “mining for all 4 cryptocurrencies was responsible for 3–15 million tonnes of CO2 emissions”. Other estimates can be found in the Cambridge Bitcoin Electricity Consumption Index, prepared by the Cambridge Centre for Alternative Finance (UK), in May 2021 where they estimate, under a model that incorporates hash rates, payouts to miners, the efficiency of mining rigs, among other variables, that Bitcoin mining consumes 124.6 TWh per year, surpassing the electricity consumption of Pakistan and Norway (120.56 and 124.13 TWh per year, respectively) and is about to surpass countries such as Argentina and Ukraine whose consumption is 125.03 and 128.81 TWh per year, respectively [
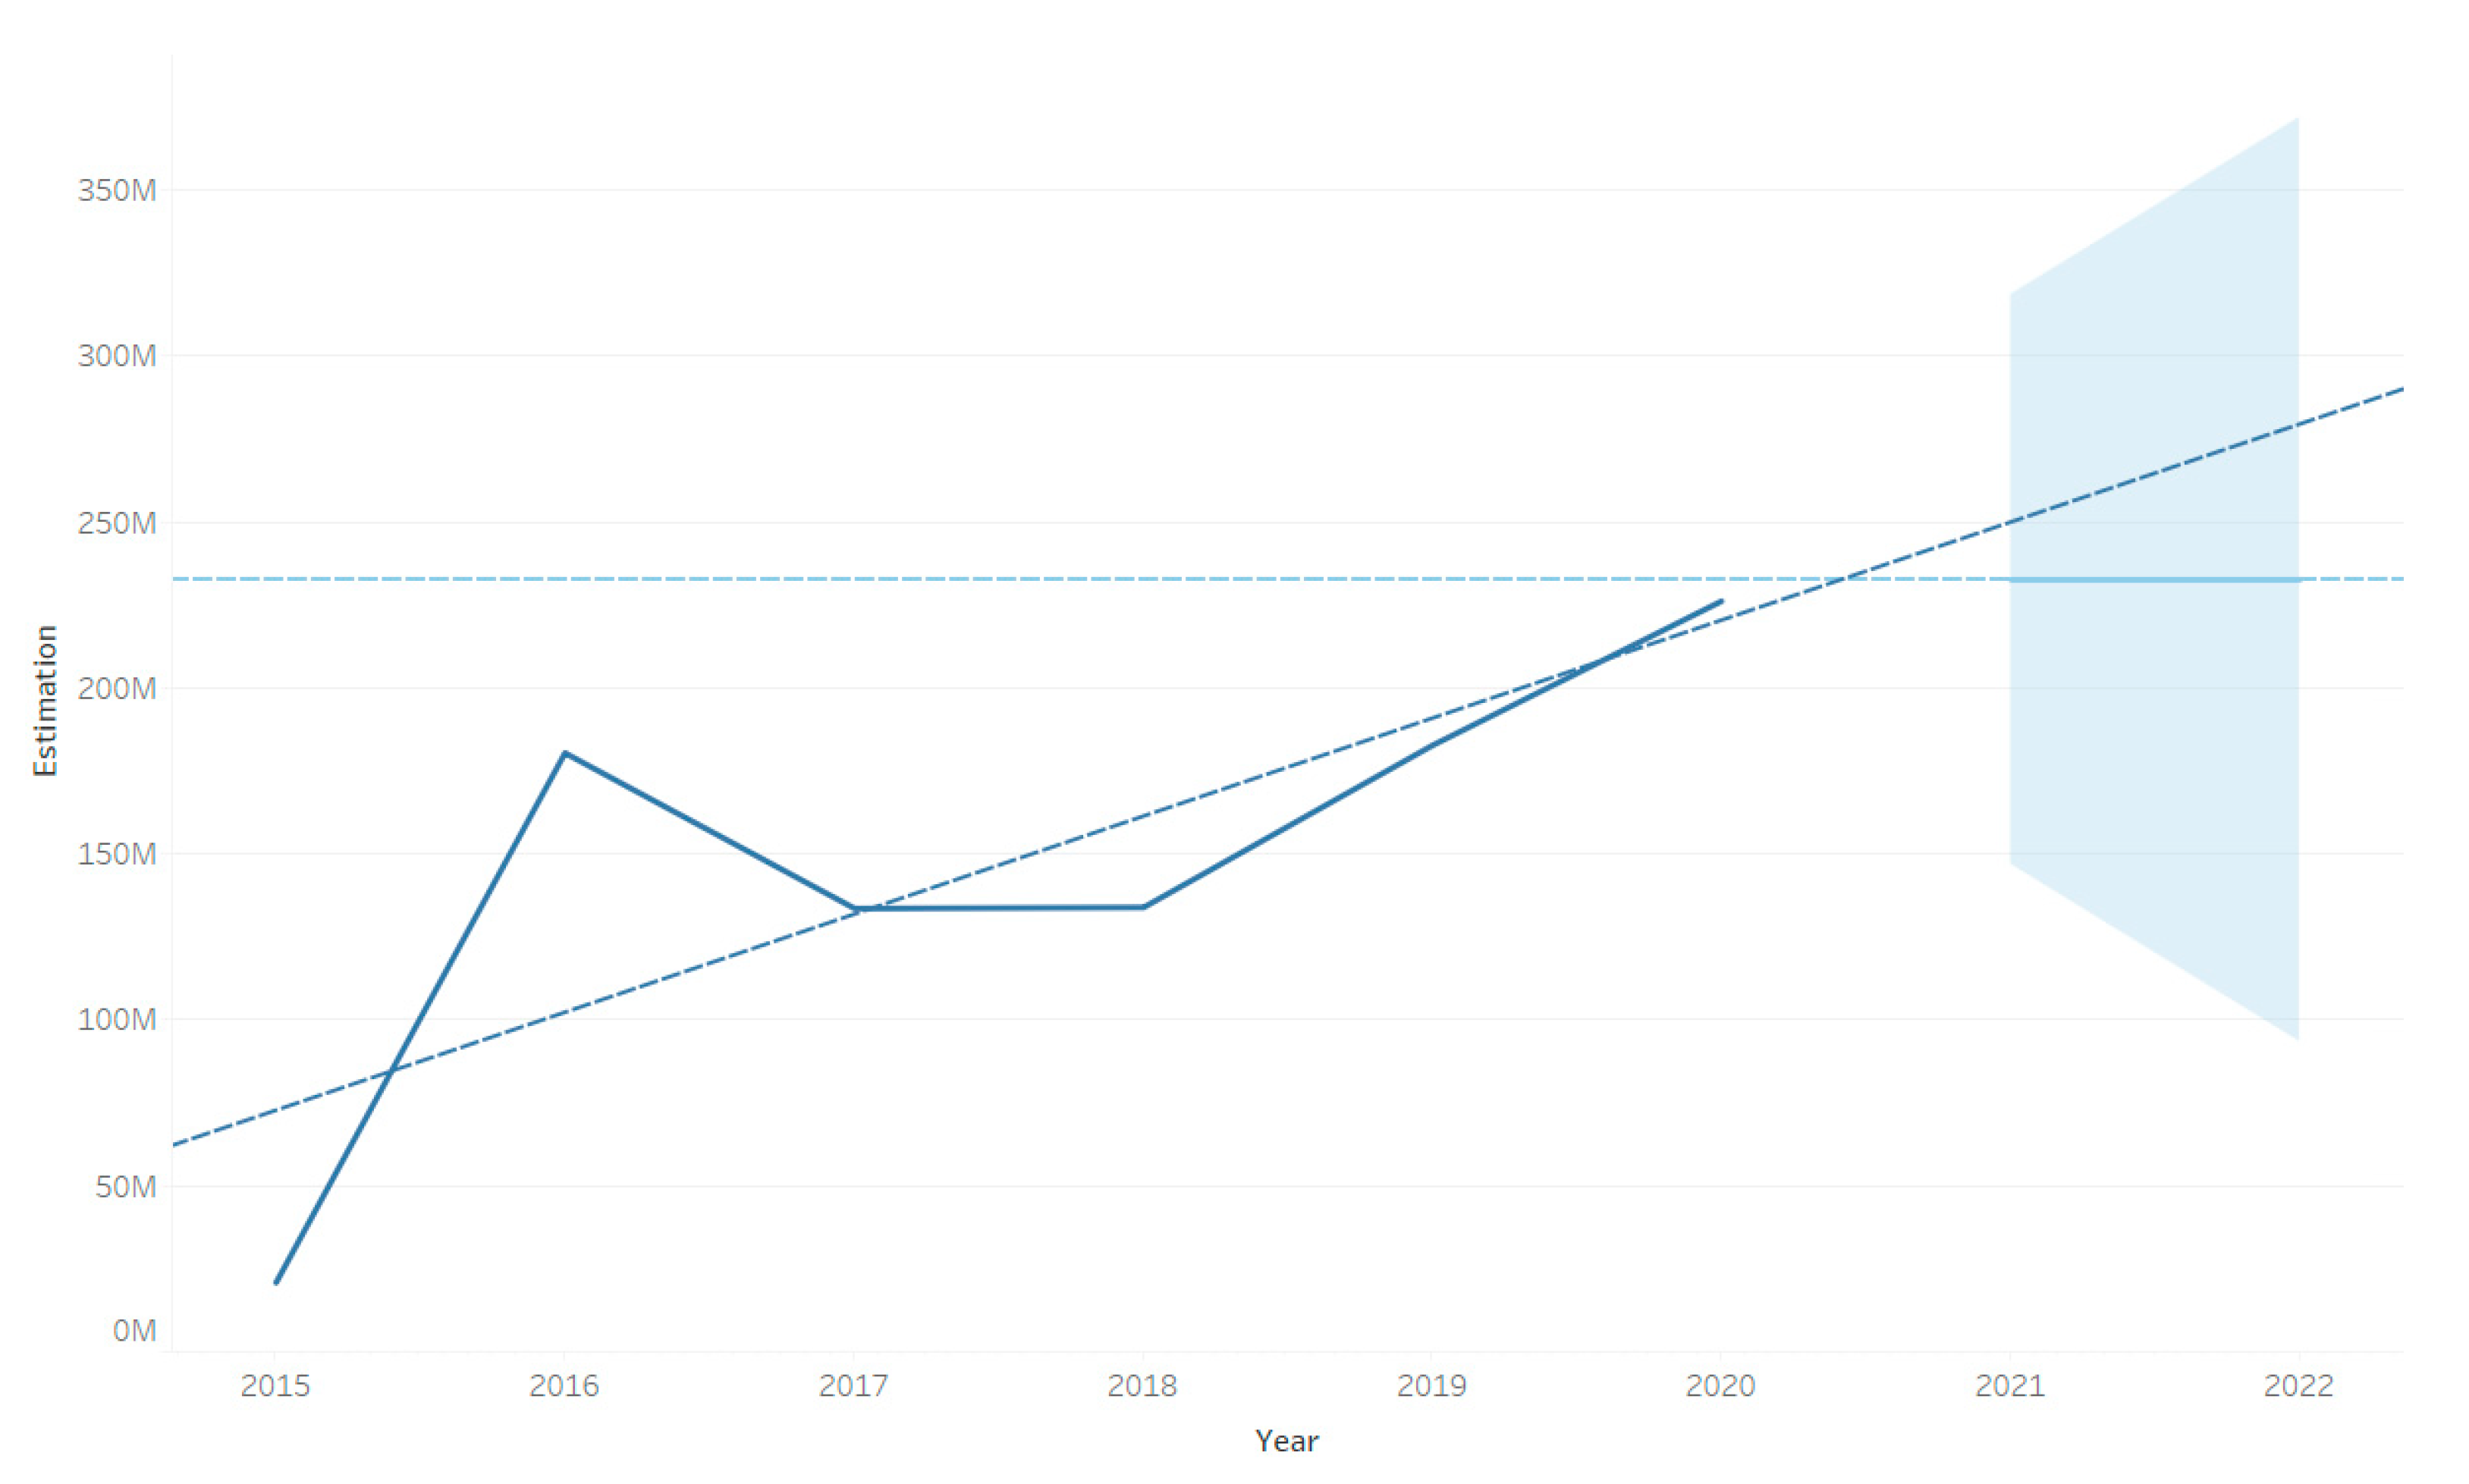
27]. Therefore, this increasing energy consumption brings with it potential environmental problems as a consequence of the boom in cryptocurrency mining and trading [28]; “empirical results show a positive correlation between crypto-currencies trading volumes and the energy consumption”. In addition, the prediction shown in Figure 1 shows that consumption will continue to grow.
Depending on how such energy is being generated, it can cause an increase in pollution, air pollution being one of them [29,30]. There are several studies on this issue such as [31] “the impact derived from increased energy generation (by mining); does not clearly generate socioeconomic benefits for the county and brings environmental implications”; or also [32] when they point out that “the Bitcoin blockchain validation process requires specialized hardware and large amounts of electricity, which translates into a significant carbon footprint”. In addition to the energy consumption directly linked to mining processes, there are other associated factors that directly impact environmental sustainability. In particular, some authors [7] point to the increase in e-waste and the additional energy needs to counteract the heat released from the rigs. For all of the above, new (and sustainable) solutions should be devised to mitigate or eliminate the adverse effects derived from Bitcoin mining. Examples of this can be found in [33] who propose the reuse of waste heat derived from cryptocurrency mining in Finland, to heat a multifamily dwelling; similar solutions were proposed by [34] in Russia as well as [35] in the case of Canada; or even to design a heat generator (stove), based on the mining of cryptocurrencies, as recently proposed by [36]. Other alternatives proposed to reduce electricity demand consist of incorporating new algorithms that can ensure digital transactions that require reduced energy consumption [6]. Along the same lines, [37] argue that there is a direct relationship between the amount of energy required for proof-of-work and its design. These authors present a proposal consisting of eliminating the nonce and therefore the burden of the proof-of-work as “the main cause of the energy waste in cryptocurrencies such as Bitcoin.”
However, the purpose of this article is not to find a solution to the high energy consumption derived from Bitcoin mining as advocated by some authors, nor to propose a solution to the heat given off by computer equipment while solving problems; generating higher electricity consumption and therefore higher CO2 emissions, ultimately affecting climate change. In this article we seek to apply a method that allows us to detect those countries that would be optimal for mining cryptocurrencies, taking into account a number of factors that could contribute to more sustainable mining. To do this, we considered the price of electricity (the lower the cost, the better), the amount of energy generated in a sustainable way (country with more % of clean energy generated), the temperature (assuming that a lower temperature is better, as it implies less consumption for cooling), the legal regulations (not prohibited or incentives), and finally, the development of new mining systems (countries with more R+D+I advantage). According to [24], 75% of BTC mining occurs in China due to the proximity to hardware manufacturers and lower electricity costs. Recently, the Chinese government has banned financial institutions in the country from trading cryptocurrencies. Behind this decision is the attempt to prevent competition with the digital yuan project headed by the People’s Bank of China. This fact, together with the announcement of Tesla’s president not to accept these decentralized digital assets as a means of payment has caused a fall in the quotation during the month of May. One of the arguments used by the car company is the high environmental impact generated by mining, which compromises environmental sustainability. However, from an economic sustainability point of view (i.e., the capacity of this activity to generate profits in the future) it can be indicated that the activity will continue to be profitable in the short term because the volume of transactions is high, but it will tend to decrease because the rewards decrease every few years and as the creation of certain cryptocurrencies progresses it is closer to the established limit.

3. Materials and Methods

3.1. Materials

As pointed out by [38], “energy consumption is not the main concern in many blockchain applications”, furthermore, [28] points out about blockchain and mining that “this technology could generate a risk of concentration in the mining industry thus affecting nature”. When determining which would be the best countries in which to carry out cryptocurrency mining in a sustainable way (or at least in the least environmentally damaging way), it is necessary to take into account those countries that are more sustainable. For this purpose, the Environmental Performance Index [39] has been used as a starting point, which provides a quantitative basis for comparing, analyzing, and understanding the environmental performance of 180 countries; from the point of view of which is the most sustainable and environmentally friendly. As material for analysis, the electricity price of the countries in the sample were taken, as the electricity price is a fundamental factor that will influence the mining decision, derived from the cost it represents [15,16,40]. Energy price data were extracted from the GlobalPetrolPrices consortium database, who, for electricity prices, follow the national averages of 150 countries. For each country, they calculate several data points for different levels of electricity consumption, as prices per kWh vary with consumption [41]. Therefore, mining cryptocurrencies in a country based on the price per kWh will be considered as deterministic [42,43]. For our purpose, it is also necessary to know whether that energy is being produced sustainably. To measure this variable, we took each country’s data on electricity production from renewable sources. For this purpose, we extracted the data provided by the World Bank, which are elaborated on the basis of the International Energy Agency (IEA) and Organisation for Economic Co-operation and Development (OECD)statistics [44]. The next factor taken into account was the average temperature of the country where cryptocurrency mining is intended to be performed as this process gives off a large amount of heat [18,19] and if mining is performed in a country with mild or low temperatures, the climate itself can help to decrease electricity consumption and pollution as less cooling is needed. To measure this parameter, we took the data related to the annual average temperature (average of daily minimum and maximum temperatures of the country), averaged for the years 1961–1990, from the data provided by the Climatic Research Unit [45]. The next variable used and taken into account when determining an optimal location for the establishment and mining of cryptocurrencies is the legal regulations of the country in question. For this purpose, the legality or illegality of operating with these virtual currencies was consulted. We have only added those countries that have reliably prohibited its operation, while we have taken as “legal operation” those that have not pronounced against it (in spite of a situation of illegality); it is not prohibited, but it is not regulated either. Data on this legal issue were extracted from Cointelegraph [46] and Bit2Me [47]. We also used data related to the development of new mining systems through the relationship between countries that invest more in R&D&I will have an advantage when using more advanced and sustainable mining systems. For this purpose, we used the expenditure on research and development variable (% of GDP) provided by the World Bank [48]. To the above, we added a final variable to take into account and from which data was taken: the human development index. We started from the assumption that those countries that combine a high HDI together with a high investment in R&D&I analyzed above, will be a better place to perform cryptocurrency mining tasks. The analyzed data (human capital index on 0–1 scale) were extracted from [49].
All the above data allowed us to generate Table 1, which includes the selection of variables, as well as to elaborate the dataset included in the appendix as Table A1.
Where Y, would be our dependent variable (most sustainable country), Pe would be the price of electricity, Er would be the production of energy from renewable sources, T would be the temperature of the country in question, N would be the regulation (whether or not mining cryptocurrencies is prohibited), Id would be the R&D&I expenditure variable, and finally Dh would be the human capital index variable.

3.2. Methodology

Once all the necessary information was compiled in the database that we generated, which appears in the appendix as Table A1, we proceeded to readjust the Environmental Performance Index (EPI) through linear regression, to approximate the dependency relationship between our dependent variable Y (which in our case will be the most sustainable country according to its score in the readjusted EPI); m independent variables Xi (which in our case are the six first variables as listed in Table 1) with m ∈ Z +, and a random term ε [50,51].
Y = β0 + β1X1 + β2X2 + … + βnXn + ε
Since the parameters β0, β1… are unknown constants, these must be estimated using the sample data we collected [51,52]. For this purpose, starting from the linear regression model and applying it to the data contained in Table A1 of the appendix, we obtained the descriptive statistics contained in Table A2 of the appendix where our statistical analysis sample (N) consists of 133 countries for which complete data are available, despite the fact that 144 countries appear in the initial dataset. The difference is due to the lack of data on the human capital index variable in several countries. After the application of linear regression to refit the EPI with our new variables, we obtained the model summary and the estimation of the β parameters of the model in Table 2 and Table 3.
As predictors, we used: (Constant); HDI; ban mining/operation with cryptocurrencies; electricity production from renewable sources, excluding hydroelectric (% of total); average temperature per country in degrees; R&D&I; research and development expenditure (% of GDP); electricity prices for households, September 2020 (kWh, USD); and being our dependent variable, the most sustainable country. After applying the above model, we managed to estimate the β0, β1… parameters using the sample data we collected and processed with SPSS [51]; and they are listed in Table 3.
If we therefore take the data obtained from the previous table on the unstandardized β coefficients, we obtain that our new adjusted sustainability index (adjusted EPI) is represented by the following equation:
ASi = 13.769 + (28.63 × Pe) + (0.142 × Er) + (−0.294 × T) + (2.515 × N) + (4.164 × Id) + (51.519 × Dh).

4. Results

As we can see in Table 2, our R-squared coefficient yields a result of 0.787. The result obtained shows that our new EPI is explained by 78.7% of our new independent variables that we introduced. [52,53,54]. Moreover, in the same table we can observe the result yielded by the Durbin–Watson test for our proposed model. The value reached is 2.074 that is very close to the value of 2, which according to the Durbin–Watson test indicates that there is an absence of autocorrelation in the regression model used [55]. Therefore, as can be seen in the Table 2, our regression shows a high R-squared value and the adjusted R-squared result, and also highlights the absence of endogeneity.
On the other hand, as shown in Table 4, after performing the ANOVA test the p-value (Sig.) is less than 0.05. Therefore, the hypothesis presented can be accepted, which means that at least one of the parameters is statistically different from “zero”, hence the model is valid as a whole [51,53].
Where the following were used as new predictors in the adjusted EPI: HDI; mining ban/operation with cryptocurrencies; electricity production from renewable sources, excluding hydroelectric (% of total); average temperature per country in degrees; R&D&I research and development expenditure (% of GDP); and electricity prices for households, September 2020 (kWh, U.S. Dollar). Finally, if we review the p-value (Sig.) in Table 3, they are statistically different from zero (Sig < 0.05), so they can remain in the model [51,52]. 
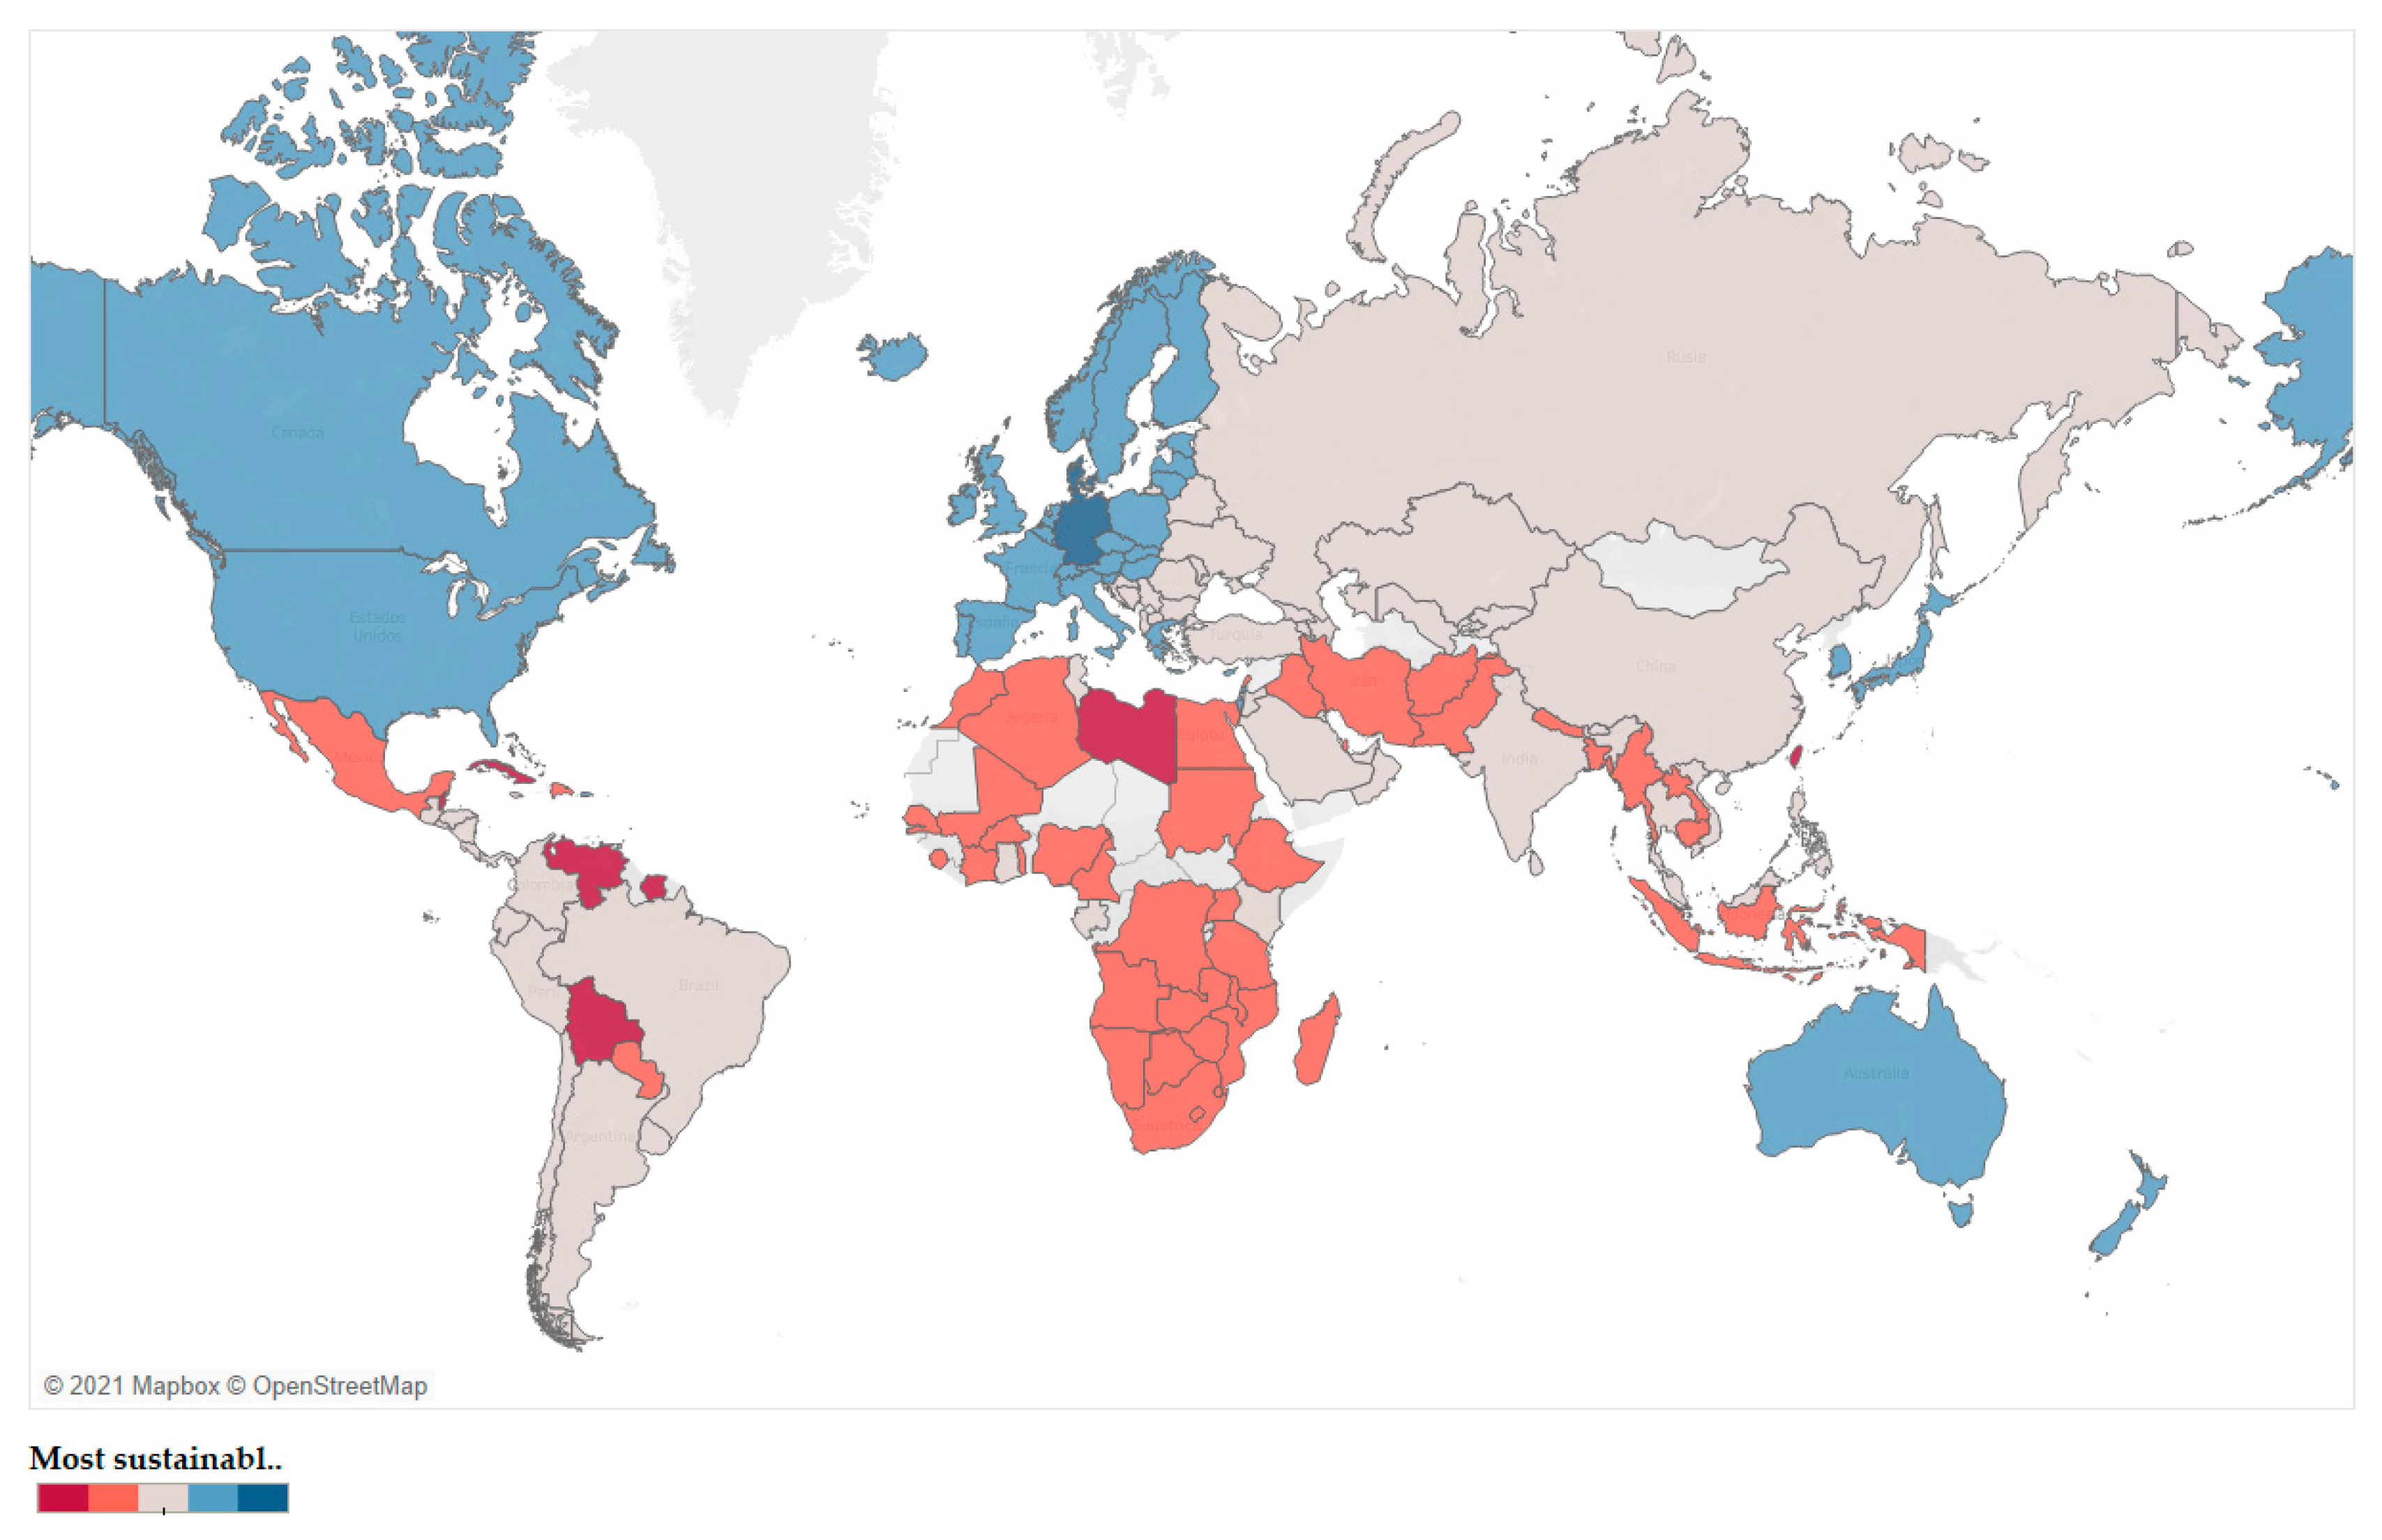
Table A3 in the appendix contains the statistics of the residuals. If we apply the equation obtained from the linear regression to the data contained in Table A1 in the appendix in each country, we can obtain a visual ranking of those countries in which cryptocurrency mining would be more sustainable. Considering the price of energy, but also weighting the production of energy from clean or renewable sources of that country, the existing legal restrictions on cryptocurrency mining, the human development index, and the investment in R&D&I made, and last but not least, the average temperature of the country under study. The average temperature is important, since in hot countries energy will be needed for mining cryptocurrencies, but also much more energy will be needed to cool the computer equipment while performing the mathematical calculations necessary for mining. This is shown in Figure 2.
Therefore, once we adjusted the new index of the most sustainable countries, in this case considering variables related to cryptocurrency mining, we can establish a composite index. Table 5 shows the 15 most and least sustainable countries for cryptocurrency mining derived from the index we have constructed. Table A4 in the appendix shows the new complete EPI with all the countries in the sample.
We therefore see that the most sustainable countries for mining cryptocurrencies are Denmark and Germany, followed by some distance by Sweden, South Korea, and Switzerland. It is worth noting that within the top 10 most sustainable countries for mining cryptocurrencies, eight of them are European (Denmark, Germany, Sweden, Switzerland, Finland, Austria, and the United Kingdom), and the remaining two are Asian countries (South Korea and Japan). In Europe, the trend seems clear: these are advanced countries in clean energy production, where the price of electricity is average and there are no legal obstacles. In addition, these are countries that invest in R&D&I, and human capital. In Asia, the European pattern is repeated, as South Korea and Japan coincide with the above characteristics.
In both cases (European and Asian) there is another parallelism: they are all countries in the northern hemisphere, and within the northern hemisphere, most of them are located in the northern part of the northern hemisphere. In addition to their location in the northern hemisphere, all the countries at the top of the ranking share a common characteristic: they have a high or very high GDP and GDP per capita. Additionally, according to several studies [56,57,58] there is a strong relationship between economic growth and environmental quality and concern for the sustainability of their citizens. If we extend the list of analysis to fifteen countries, only one non-European country appears on the list, partially breaking with the previous trend: Israel. The remaining countries to complete the list of fifteen countries are the Czech Republic, Ireland, the Netherlands, Portugal, and France. This list can be consulted in the appendix, in Table A4.
On the contrasting side we would find those countries in which mining cryptocurrencies would not be sustainable. In this case, the worst places for environmental impact in mining are South American countries (Bolivia, Venezuela, and Suriname) and the Caribbean (Cuba). Furthermore, on the African continent, Libya, Sudan, and Nigeria stand out, and in the Middle East, Pakistan, and Iraq. This list can be found in Table 5 and Table A4 in Appendix A.
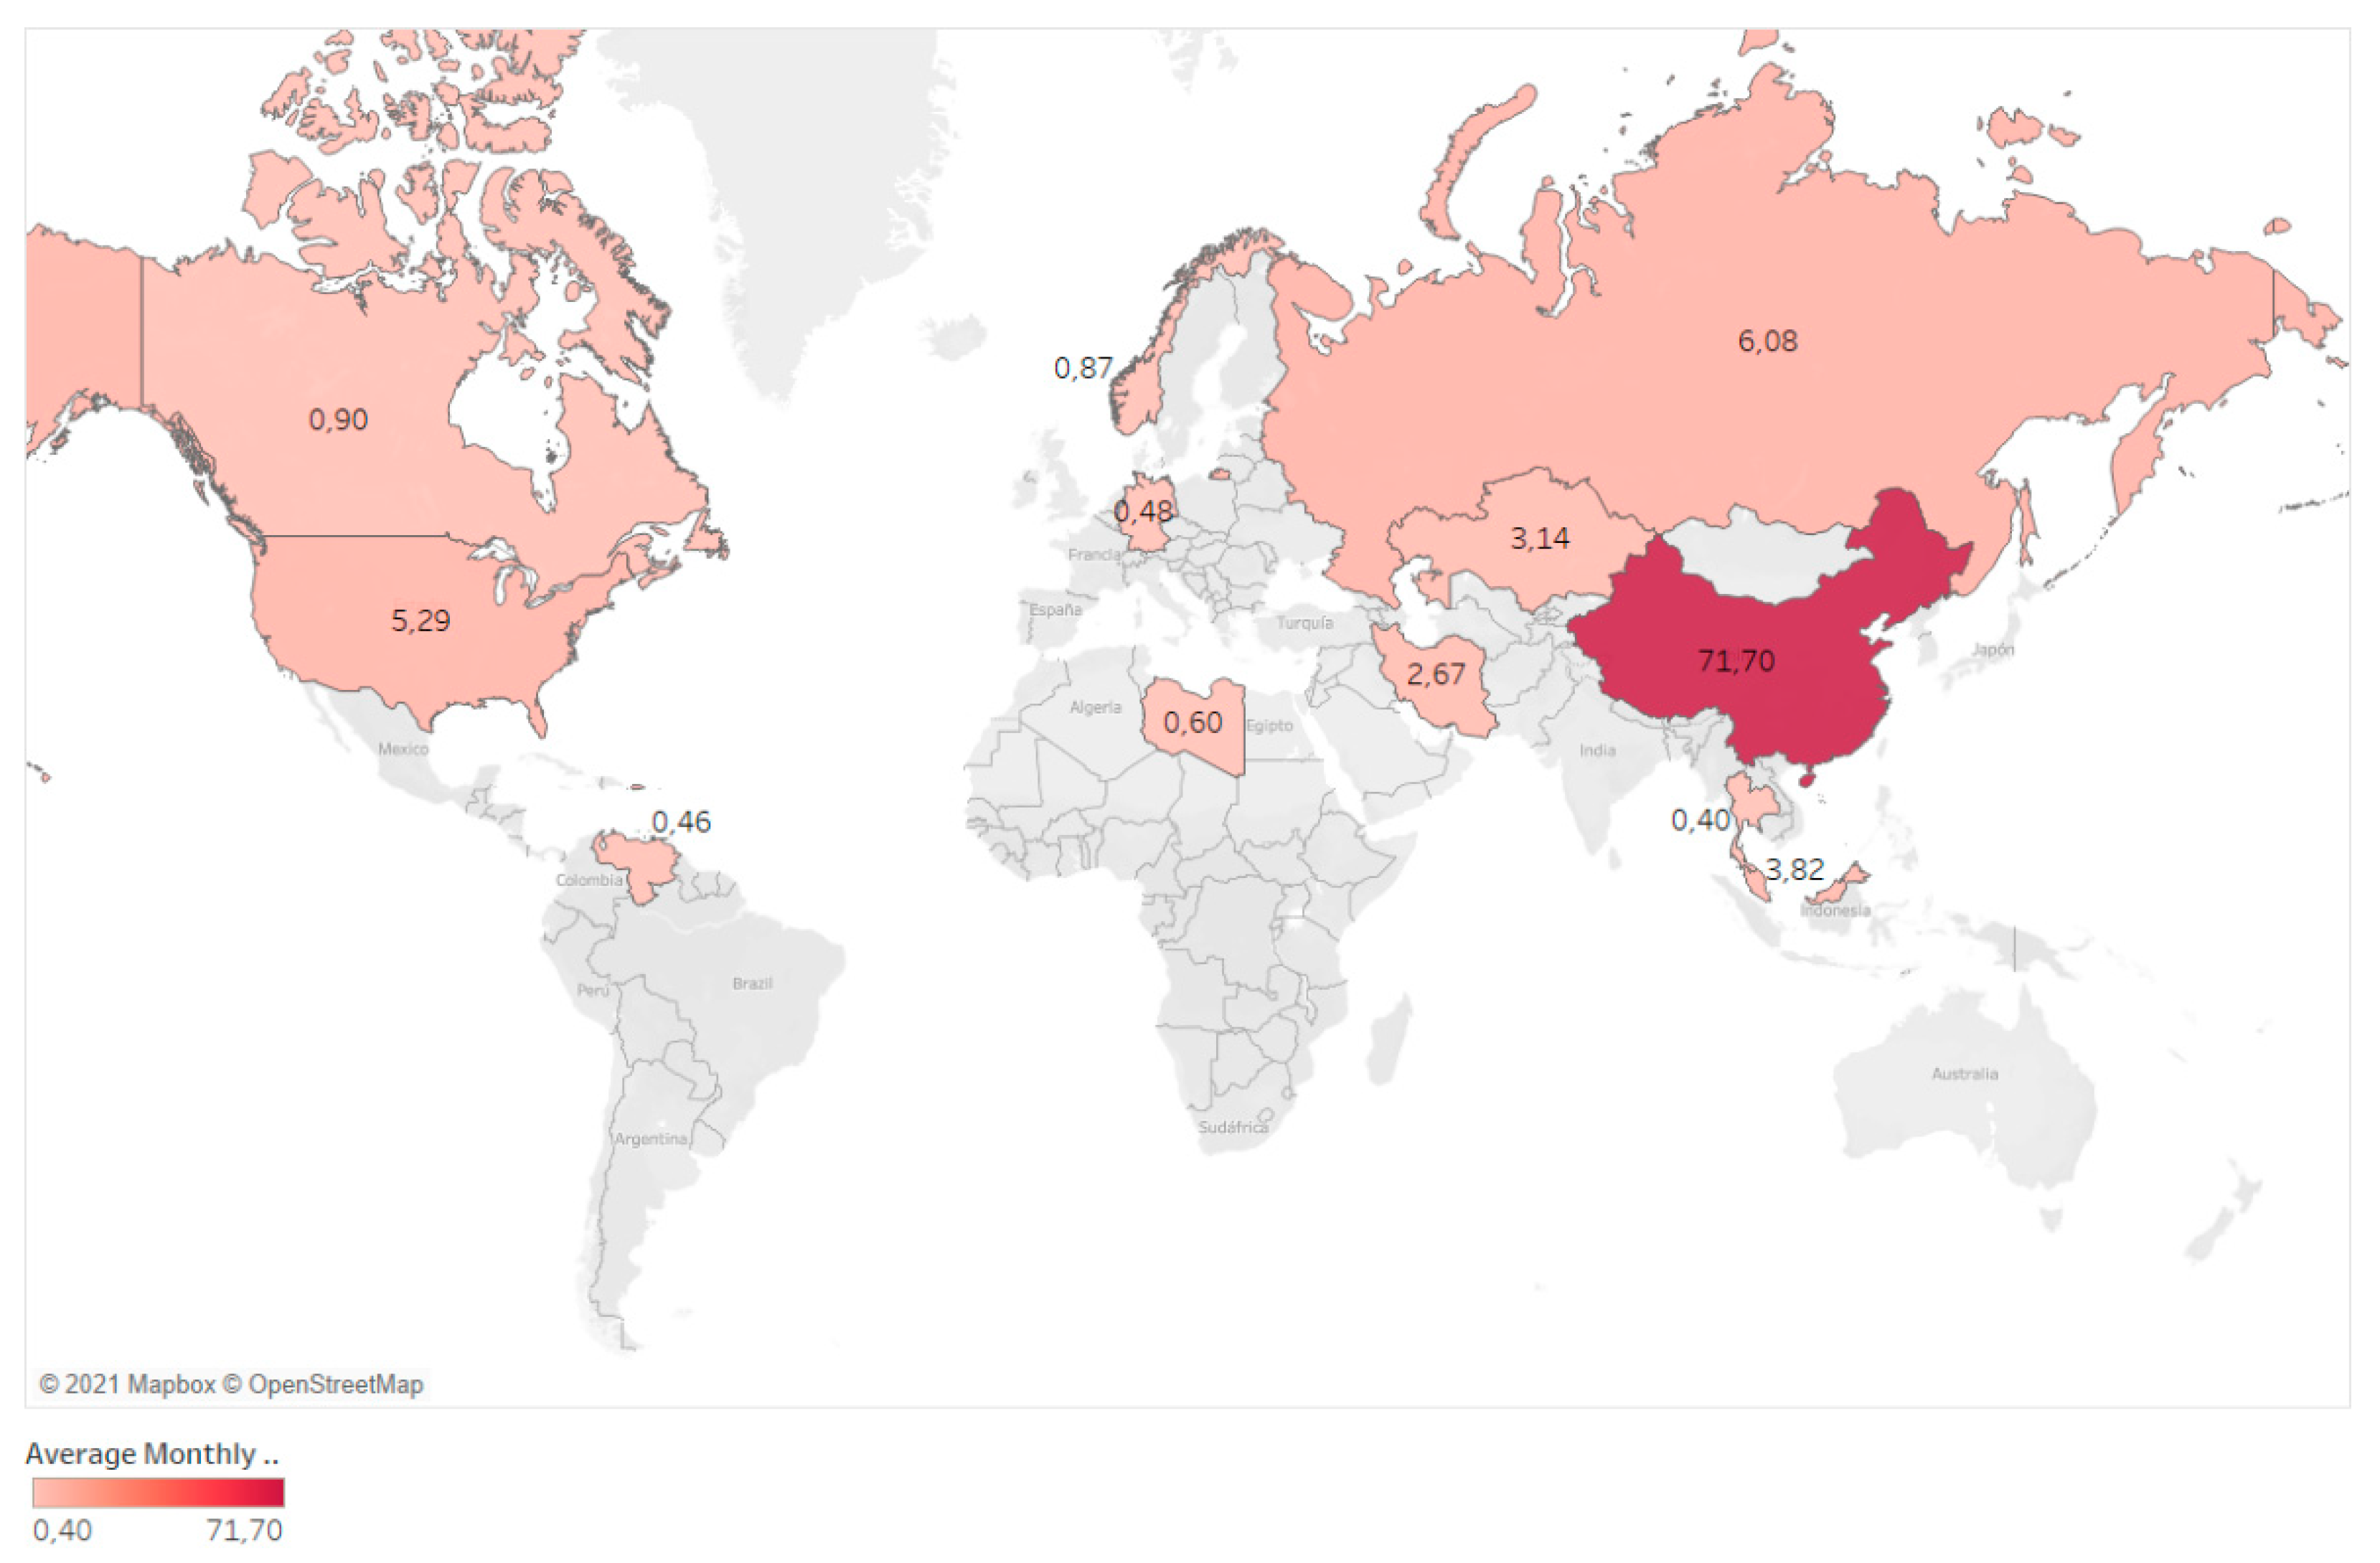
However, if we compare these results with Figure 3, which shows the average monthly hash rate by country, we can see that cryptocurrency mining is not currently taking place in those countries that would be more sustainable. The hash rate refers to the numerical value within each cryptocurrency used by the proof-of-work. The value indicates the number of computational operations that a miner (or the network of miners as a whole) is capable of performing. All this in order to solve cryptographic puzzles derived from the cryptographic function used by the cryptocurrency. So, the higher the hash rate, the more cryptocurrency mining is taking place in that geographic area.
As we can see, China is undoubtedly the center of the world as far as cryptocurrency mining is concerned, since with the data collected in the previous figure, we can see that almost 72% of the world hash rate is carried out in China [27]. China is not one of the most sustainable countries for cryptocurrency mining, in fact, it is in the 41st position in our calculation of the most sustainable countries (see Table A4 in Appendix A). This implies that if some of this mining were to be done in another more sustainable country (from our economic-environmental point of view), the benefits for the environment would be remarkable. Leaving China aside, we focus on other striking places on the map. Firstly, Venezuela, which although it is among the countries with the highest hash rate (even at 0.46) [27], is the fourth least recommendable country according to our model for mining activity (from the point of view of sustainability). Furthermore, noteworthy in Africa is Libya, which is also among the countries with the highest global hash rate (even with 0.6) and is the third least recommendable country according to our model for mining activity (again from the perspective of sustainability). Finally, two other parts of the world should be highlighted: Iran, with a hash rate of 2.67 and Malaysia with 3.82 [27]. These are places where consistent cryptocurrency mining activity is taking place. However, neither are countries that are well positioned according to our model in terms of sustainable mining. In fact, Iran is ranked 116th out of 145 countries and Malaysia is ranked 63rd out of 145.

5. Discussion

Electricity demand linked to cryptocurrency transactions has grown immensely in recent years. Several factors have driven this energy consumption. Among them are “the increasing difficulty in mining” and “the large number of new market participants that have been attracted by the elevated prices of this developing financial asset” [59].
There are different studies such as the one by [60] that have tried to calculate “an aggregate price of electricity derived from Bitcoin as a function of the mining locations and the prices in these locations”, others such as [15,16] point out that the price of electricity is a fundamental factor that will influence the mining decision, derived from the cost it represents. In the same vein, [61] argue that mining activities will only be profitable in those countries where the cost of electricity is lower than 0.14 USD/kWh and have the most efficient mining technology.
In our study we proposed a study in which, taking into account several determinants of cryptocurrency mining, we detected those countries that would be optimal from the point of view of environmental sustainability, to carry out this activity. However, there are authors such as [15] who point out that “renewable energies will not solve the problem of Bitcoin sustainability”; and although this is possible in the long term, at least in the short or medium term, cryptocurrency mining in countries where energy is generated in a sustainable way instead of more polluting sources such as coal, will be a relief for the environment. Thus, studies such as that of [62] point out that Bitcoin mining and the potential profits derived from it can incentivize the development of wind farms or renewable and sustainable energy sources. Furthermore, [63] point out that “a sustainable energy strategy focused on the penetration of renewable energy power sources, together with the use of energy efficient mining hardware, will alleviate Bitcoin’s carbon footprint”; and according to [64], cryptocurrency mining is an opportunity for renewable energy. Along the same lines, [16] indicate that “Blockchain applications are expected to reshape the renewable energy market”.
In our study to detect the most sustainable countries to carry out cryptocurrency mining activity, we used the following as variables:
First, electricity prices (kWh, U.S. Dollar). These data, present the limitation that they refer to the year 2020, possibly having suffered some variation in the average price during the period until 2021.
Secondly, we took the production of electricity from renewable sources (% of total) as a variable. This variable has the same limitation, and that is that it refers to the closest data, which is the year 2020, and differences may have occurred in some countries.
The third variable we used was the average temperature per country in degrees Celsius. The limitation of this variable is that the 1961–1990 series was used, as we had not obtained more recent data to cover the selected sample of countries. Regarding the prohibition of mining/operation with cryptocurrencies by country, the limitation of this variable is given by the following; and that is that we have only taken as negative those countries that have “reliably” banned cryptocurrencies in their territory, but most of them have not made any pronouncement. This generates a de facto situation of illegality: it is not forbidden to operate with cryptocurrencies, but there is no clear regulatory framework either.
Of the variables R&D&I research and development expenditure (% of GDP), human capital index, and most sustainable countries, we did not detect any significant limitations.
Our statistical analysis sample (N) consists of 133 countries for which complete data are available, despite the fact that 144 countries appear in the initial dataset. The difference is due to missing data on the human capital index variable in several countries. After applying the regression, R-squared yields a result of 0.787. In addition, the Durbin–Watson test on our proposed model is 2.074, is very close to the value of 2, which according to this test indicates that there is absence of autocorrelation in the regression model used. Furthermore, after performing the ANOVA test, the p-value (Sig.) is less than 0.05. Therefore, the hypothesis presented can be accepted. Based on the Environmental Performance Index (EPI), we considered several determinants of cryptocurrency mining: energy price, how this energy is generated, temperature, legal constraints, human capital, and R&D&I. From this, via linear regression, we recalculated this EPI by including the above factors that affect cryptocurrency mining in a sustainable way. The study determines, once the EPI has been readjusted, that the most sustainable countries for mining cryptocurrency are Denmark and Germany. In fact, out of the top ten, eight of them are European (Denmark, Germany, Sweden, Switzerland, Finland, Austria, and the United Kingdom); and the remaining two are Asian (South Korea and Japan). On the opposite side we would find those countries in which performing cryptocurrency mining activity would not be sustainable. In this case, the worst places in terms of environmental impact in mining are South America (Bolivia, Venezuela, and Suriname) and the Caribbean (Cuba). Furthermore, on the African continent, Libya, Sudan, and Nigeria stand out, and in the Middle East, Pakistan and Iraq. Similar techniques to find optimal countries have already been used by [65,66], but in this case applicable to CBDCs. In addition, it must be taken into account that the possible implementation of a CBDC will reduce the demand for cryptocurrencies (even though they are very antagonistic systems), since one is centralized and the other decentralized [67]. In future, cryptocurrencies will become stronger and more usable in everyday life but once CBDCs (central bank digital currencies) are implemented these could overtake cryptocurrencies and weigh down the use and popularity of digital currencies such as Bitcoin. It will depend on whether the central banks finally decide to bet on CBDCs, following in the wake of the leading countries in this implementation (such as Bahamas or China); or not [68]; in the latter scenario having a greater demand for cryptocurrencies. Additionally, it is that as noted by [69] “Bitcoin is still in an embryonic stage and needs to evolve over time especially keeping pace with technological advances”; or also [70] “we refute the hypothesis that cryptocurrencies are sought as an alternative to fiat currencies or regulated finance.” Notwithstanding the above, [71] in their study point out that “the findings show that these technologies are evolving, and organizations are adopting them to gain a competitive advantage; so there does not seem to be a clear trend about their future”. In addition, “The vertiginous development of digital infrastructures together with the globalization of an increasingly agile and reliable network access and interconnection is causing a global digital ecosystem. Its configuration drives the concurrence of multiple disruptive processes” [72].
The study by [40] points out that, using grid electricity, Iran, Russia, and China are the best countries to mine BTC, while using natural gas for power generation, Iran, Canada, and Russia are the best countries to mine BTC. In our study, we took into account sustainable production as a determining factor.
Realistically, however, it is unlikely that without incentives this change can be realized. Although difficult, [24] point out that “a site regulation policy that induces changes in the energy consumption structure of mining activities is more effective in limiting carbon emissions”. Along the same lines, the study by [17] analyzes the possible public policies to de-socialize the environmental externalities associated with blockchain technology designs and their excessive energy consumption, identifying for this purpose different fiscal policy options. Furthermore, [73] point out that incentive policies can be a determining factor, “cryptocurrencies offer an additional incentive to electric vehicle users”. One option could be the one pointed out by [74,75] in which tax incentives could play an important role in determining the cryptocurrency mining location, together with favorable legislation [76]. However, in closing, reference should be made to the disciplining effect that cryptocurrencies may have on governments if it becomes a widespread means of payment. As pointed out by [77], “the ability of governments to conduct monetary, fiscal and drug policies would be undermined […] and this would be an ethically desirable outcome from both a private property rights and utilitarian perspective”. Furthermore, bearing in mind the possible adverse effects that public aid policies for renewable energies can bring, as the study by [78] points out precisely this negative experience from the experience of Spain. This situation could be used to try to attract cryptocurrency mining, for example, as we can see, this public aid policy brought adverse results. Finally, as indicated by [79], the classical belief that technological advances do not contribute to increasing social welfare must be abandoned, because “the more technological advances occur, the more suitable work is for human beings, as they can devote themselves to exploiting their personal talents”; and here responsible and sustainable mining can help to ensure the latter statement. Another factor to take into account that may affect miners’ decision making is the possible profit or gain derived from this activity in such a volatile market, with smaller cryptocurrencies being particularly affected, as shown by [80]; or also the possible changes in the profile of people interested in these cryptocurrencies, as pointed out by [81]. It should be noted, as indicated by [82,83], that in a competitive free market environment, the cost of energy would tend to reduce due to business innovation, and therefore this will positively affect cryptocurrency mining as well.

6. Conclusions

Led by the success of Bitcoin, other cryptocurrencies such as Ethereum, Ripple, or Dogecoin, to name a few, have emerged and have experienced rapid growth and expansion. Mining is necessary for the operation of these decentralized virtual currencies. To do this, the necessary computer equipment consumes a large amount of energy. In our article, we showed that cryptocurrency mining is not currently being carried out in a sustainable manner, although this could be intuited. We started from the Environmental Performance Index (EPI). From the EPI, we considered several determinants of cryptocurrency mining: energy price, how this energy is generated, temperature, legal constraints, human capital, and R&D. From this, via linear regression we recalculated this EPI by including the above factors that affect cryptocurrency mining in a sustainable way. We detected, based on the new adjusted EPI, that sustainable cryptocurrency mining would currently only be possible if the mining capacity was moved from countries that have scored poorly in our index such as (Venezuela, Libya, Iran, or Malaysia) to other countries where although cryptocurrency is currently mined (Germany or Denmark), if done there, this activity would have a lower impact for the environment and the activity would be more sustainable as the energy needed for mining and cooling of the equipment comes from energy generated in a clean and planet-friendly way. While this seems difficult without a public policy of awareness, accompanied by regulation, recent bans on cryptocurrency mining in China open a window of hope for change. However, awareness policies are needed especially in countries where electric power is cheaper, and legislation is more lax. All this to raise awareness of the environmental damage that this cryptocurrency mining can cause. This brings with it another necessary issue, and that is the firm commitment of the countries, for the sake of a greater production of energy in an environmentally friendly way.

Author Contributions

Conceptualization, S.L.N.A.; Data curation, S.L.N.A., J.J.-V. and M.Á.E.F.; Formal analysis, S.L.N.A. and J.J.-V.; Funding acquisition, J.J.-V. and R.F.R.F.; Investigation, S.L.N.A. and J.J.-V.; Methodology, S.L.N.A. and M.Á.E.F.; Project administration, S.L.N.A. and R.F.R.F.; Software, S.L.N.A., M.Á.E.F. and R.F.R.F.; Supervision, J.J.-V. and R.F.R.F.; Validation, M.Á.E.F. and R.F.R.F.; Visualization, R.F.R.F.; Writing—original draft, S.L.N.A.; Writing—review & editing, J.J.-V. and M.Á.E.F. All authors have read and agreed on the final version of this manuscript.

Funding

The APC was partially funded by the incentive granted to the authors by the Catholic University of Ávila.

Data Availability Statement

Not applicable.

Acknowledgments

We want to thank Tableu Inc. for allowing us to use Tableau Desktop Professional Edition free of charge for scientific purposes.

Conflicts of Interest

The authors declare no conflict of interest.

Appendix A

Table A1. Dataset.
Table A1. Dataset.
CountryElectricity Prices (kWh, USD)Electricity Production from Renewable Sources (% of Total)Average Temperature by Country in DegreesCryptocurrency Mining/Trading BanR&D&I Expenditure on Research and Development (% of GDP)Human Capital Index Scale 0–1Sustainable Countries
Afghanistan0.048012.6100.425.5
Albania0.112011.410.154120.649
Germany0.37226.38.413.090.877.2
Angola0.018018.7910.032290.429.7
Saudi Arabia0.0480.000321.5510.820.644
Algeria0.040.124.65−10.540.544.8
Argentina0.0631.914.810.540.652.2
Armenia0.0770.17.1510.190.652.3
Australia0.2598.3421.6511.870.874.9
Austria0.24416.496.3513.170.779.6
Azerbaijan0.0410.4111.9510.180.646.5
Bahamas0.262024.8510 43.5
Bahrain0.048027.1510.10.751
Bangladesh0.0660.2725−100.529
Barbados0.24602610 45.6
Belarus0.0740.506.1510.610.753
Belgium0.3120.349.55100.873.3
Belize0.227025.310 41.9
Bhutan0.01707.4100.539.3
Bolivia0.1172.5221.55−10.16 44.3
Bosnia and Herz.0.10809.8510.20.645.4
Botswana0.1120.0321.510.540.440.4
Brazil0.12812.1224.9511.260.651.2
Bulgaria0.1416.3710.5510.770.657
Burkina Faso0.227028.2910.70.438.3
Cape Verde0.3023.310.07 32.8
Cambodia0.1510.9326.810.120.533.6
Cameroon0.0921.1224.6100.433.6
Canada0.1136.27−5.3511.570.871
Chile0.211.938.4510.360.755.3
China0.0844.866.95−12.190.737.3
Cyprus0.2198.7819.4510.560.864.8
Colombia0.1523.2824.510.240.652.9
Congo Democratic 0.0610.112410.410.436.4
South Korea0.0981.5011.514.810.866.5
Costa Rica0.14924.3924.810.420.652.5
Côte d’Ivoire0.1341.2126.3510.10.425.8
Croatia0.1649.9610.910.970.763.1
Cuba0.0083.7125.210.43 48.4
Denmark0.33765.447.513.060.882.5
Ecuador0.0962.1021.85−10.440.651
Egypt0.0450.8822.1−10.720.543.3
El Salvador0.17635.2324.4510.180.543.1
United Arab Emir.0.0810.232711.30.755.6
Slovakia0.218.166.810.830.768.3
Slovenia0.2163.698.911.940.872
Spain0.24324.8213.311.240.774.3
United States of America0.157.398.5512.840.769.3
Estonia0.17114.165.111.430.865.3
Ethiopia0.0087.2722.210.270.434.4
Philippines0.17514.9025.8510.160.538.4
Finland0.1920.051.712.770.878.9
France0.226.2010.712.20.880
Gabon0.2260.5625.0510.580.545.8
Georgia0.053027.510.30.641.3
Ghana0.0640.035.810.380.527.6
Greece0.22516.8914.4411.180.769.1
Guatemala0.24925.3523.4510.030.531.8
Honduras0.18616.1723.510.040.537.8
Hong Kong0.1470.286.9510.860.837.3
Hungary0.1249.819.7511.550.763.7
India0.0775.3623.6510.650.527.6
Indonesia0.1014.7825.85−10.230.637.8
Iran0.0050.0818.2510.830.448
Iraq0.024021.410.040.439.5
Ireland0.27625.099.311.150.872.8
Iceland0.1426.671.7512.030.772.3
Israel0.1751.8520.214.950.765.8
Italy0.26222.5113.4511.40.771
Jamaica0.2897.1324.9510.060.548.2
Japan0.2677.7611.1513.260.875.1
Jordan0.10.6919.310.710.653.4
Kazakhstan0.0410.176.410.120.644.7
Kenya0.20848.2724.7510.790.534.7
Kyrgyzstan0.01025.3510.110.639.8
Kuwait0.0301.5510.060.653.6
Laos0.055022.810.040.534.8
Lesotho0.109011.8510.050.428
Latvia0.19616.65.610.630.761.6
Lebanon0.077017.4100.545.4
Libya0.004021.810 044.8
Liechtenstein0.26505.6510 079.6
Lithuania0.16831.26.210.940.762.9
Luxembourg0.25224.98.6511.240.782.3
Macao0.14606.9510.20.837.3
North Macedonia0.0942.99.810.360.655.4
Madagascar0.119022.6510.010.426.5
Malaysia0.060.725.411.440.647.9
Malawi0.12021.9100.438.3
Mali0.241028.2510.290.329.4
Malta0.1627.6720.210.570.770.7
Morocco0.1328.1918.1−10.710.542.3
Mauritius0.14918.6522.410.350.645.1
Mexico0.0845.492110.310.452.6
Moldova0.1060.319.4510.250.644.4
Mozambique0.159023.810.340.433.9
Myanmar0.039013.0510.030.525.1
Namibia0.131020.9510.340.440.2
Nepal0.0690.208.1−10.30.5327
Nicaragua0.21443.6124.910.110.539.2
Nigeria0.059026.810.130.431
Norway0.1051.881.512.070.877.7
New Zealand0.24724.5810.5511.370.871.3
Oman0.026025.610.220.638.5
Netherlands0.18812.369.2512.160.875.3
Pakistan0.0610.7621−10.240.433.1
Panama0.1614.5625.410.150.547.3
Paraguay0.062023.5510.150.546.4
Peru0.193.5920.610.130.644
Poland0.19812.697.8511.210.860.9
Portugal0.2830.6415.1511.370.867
Qatar0.032027.15−10.510.637.1
United Kingdom0.26422.978.4811.720.881.3
Dominican Rep.0.095.2724.55100.546.3
Czech Republic0.2489.237.5511.930.871
Romania0.17514.528.810.510.664.7
Russia0.0620.09−5.1−10.990.750.5
Rwanda0.252018.8510.670.433.8
Senegal0.191.7727.8510.580.430.7
Serbia0.0970.0910.5510.920.755.2
Sierra Leone0.159026.05100.425.7
Singapore0.1581.8226.4511.940.958.1
Sri Lanka0.0763.1926.9510.110.639
South Africa0.1521.9318.7510.830.443.1
Sudan0.0010.6126.910.30.434.8
Sweden0.17916.752.113.340.878.7
Switzerland0.2264.325.513.370.881.5
Suriname0.023025.7100.45.2
Swaziland0.123021.410.270.433.8
Thailand0.1225.8726.3110.645.4
Taiwan0.10506.95100 57.2
Tanzania0.0990.6722.3510.510.431.1
Togo0.213027.1510.270.429.5
Trinidad and Tobago0.052025.7510.090.647.5
Tunisia0.0772.4916.310.60.546.7
Turkey0.0866.319.9−10.960.642.6
Uganda0.1881.0522.810.170.435.6
Ukraine0.04608.310.470.649.5
Uruguay0.19828.4018.5510.480449.1
Uzbekistan0.028012.0510.130.644.3
Venezuela0025.3510.34 050.3
Vietnam0.0810.1224.4510.530.733.4
Zambia0.031021.410.280.434.7
Zimbabwe0.0141.3321100.537
Source: Own elaboration based on data from The World Bank, University of Yale, Cointelegraph, Bit2Me, and Climatic Research Unit.
Table A2. Descriptive statistics.
AverageDeviationN
More sustainable countries49.63715.9961133
Household electricity prices, September 2020 (kWh, USD)0.134920.080834133
Electricity production from renewable sources (% of total)7.35195036555870911.183543226861056133
Average temperature per country in degrees16.67748.35650133
Ban on cryptocurrency mining/trading0.820.575133
R&D spending on research and development (% of GDP)0.81501060.96746730133
Human Capital Index0.5900.1445133
Source: Authors’ elaboration based on data from Table A2 and IBM SPSS Statistics 27.
Table A3. Waste statistics.
MinimumMaximumAverageDeviationN
Predicted value28.54486.96449.63714.1912133
Residual−25.988117.40550.00007.3815133
Variance Predicted value−1.4862.6300.0001.000133
Variance residual−3.4402.3040.0000.977133
Source: Authors’ elaboration based on data from Table A2 and IBM SPSS Statistics 27.
Table A4. Most and least sustainable countries for cryptocurrency mining index based on readjusted EPI.
RankingCountryCryptocurrency Mining IndexRankingCountryCryptocurrency Mining IndexRankingCountryCryptocurrency Mining Index
1Denmark87.049Brazil50.597Indonesia39.1
2Germany82.350Vietnam49.798Dominican Rep.38.2
3Sweden78.351Costa Rica49.499Burkina Faso38,0
4South Korea77.252Mauritius49.0100Nepal37.9
5Switzerland77.053North Macedonia48.9101Paraguay37.5
6Finland76.854Moldova48.5102Qatar37.2
7Japan76.555Bosnia and Herz.48.2103Laos37.1
8Austria73.056Armenia48.1104Senegal36.8
9United Kingdom73.057Ukraine48.0105Lesotho36.7
10Israel72.358Thailand48.0106Zimbabwe36.5
11Czech Republic71.759Kuwait47.8107Uganda36.4
12Portugal71.160Albania47.7108Togo36.1
13Ireland71.061Peru47.6109Botswana36.0
14Ireland70.962Malaysia47.5110Namibia35.9
15France70.763Nicaragua47.5111Mozambique35.9
16New Zealand70.764Jordan47.4112Tanzania35.4
17Canada69.765Argentina47.2113Swaziland35.2
18Slovenia69.766Kazakhstan47.0114Mexico35.2
19Norway69.067Turkey46.6115Iran35.1
20Estonia68.968Bahrain46.2116Egypt34.9
21Iceland68.169Guatemala46.0117Afghanistan34.6
22Singapore67.770Colombia45.8118Malawi33.9
23Poland67.771Azerbaijan45.7119Sierra Leone33.8
24Australia67.572Saudi Arabia45.6120Madagascar33.7
25United States67.073El Salvador45.6121Côte d’Ivoire33.6
26Belgium66.574Uzbekistan45.0122Congo, Democratic Republic of the33.3
27Luxembourg65.775Jamaica44.2123Algeria33.2
28Italy64.976Ghana43.8124Ethiopia32.8
29Spain64.177Gabon43.6125Zambia32.7
30Lithuania63.778Uruguay43.1126Cameroon32.5
31Hong Kong63.379Honduras42.9127Angola32.0
32Greece61.980Sri Lanka42.4128Bangladesh31.6
33Cyprus61.681Tunisia42.3129Mali31.5
34Latvia61.382Philippines42.2130Iraq31.5
35Slovakia61,083Georgia41.9131Nigeria31.2
36Hungary60.984Trinidad and Tobago41.5132Sudan30.3
37Macao60.585Rwanda41.4133Pakistan28.5
38Croatia59.386Oman41.3134Liechtenstein22.2
39Chile58.887India40.8135Cape Verde18.3
40China57.588Ecuador40.6136Taiwan17.2
41Serbia55.989Kyrgyzstan40.5137Bahamas16.5
42Belarus55.390Panama40.5138Barbados15.7
43Russia54.791Bhutan40.4139Belize15.3
44Malta54.592Morocco39.6140Cuba11.4
45Romania53.893South Africa39.5141Venezuela10.2
46Bulgaria52.294Myanmar39.4142Libya10.0
47United Arab United Arab Emir.52.295Lebanon39.1143Suriname9.4
48Kenya50.996Cambodia39.1144Bolivia9.3
Source: Own elaboration derived from the new adjusted EPI index and IBM SPSS Statistics 27.

References

  1. Vázquez, J.J.; Cebolla, M.P.C.; Ramos, F.S. La transformación digital en el sector cooperativo agroalimentario español: Situación y perspectivas. CIRIEC 2019, 95, 39–70. [Google Scholar] [CrossRef] [Green Version]
  2. Ertz, M.; Hallegatte, D.; Bousquet, J. La Reconfiguration de L’Échange Marchand. Tour D’horizon, Enjeux et Per-Spectives; Les Presses de l’Université du Québec: Quebec, QC, Canada, 2019. [Google Scholar]
  3. Patil, P.P.; Dwivedi, Y.K.; Rana, N.P.; Kar, A.K.; Ilavarasan, P.V.; Gupta, M.; Mäntymäki, M.; Janssen, M.; Simintiras, A.; Al-Sharhan, S. Digital Payments Adoption: An Analysis of Literature. In Transactions on Petri Nets and Other Models of Concurrency XV; Springer Science and Business Media LLC: Berlin/Heidelberg, Germany, 2017; pp. 61–70. [Google Scholar]
  4. Maese, V.A.; Avery, A.W.; Naftalis, B.A.; Wink, S.P.; Valdez, Y.D. Cryptocurrency: A primer. Bank. Law J. 2016, 133, 468–471. [Google Scholar]
  5. Huckle, S.; Bhattacharya, R.; White, M.; Beloff, N. Internet of Things, Blockchain and Shared Economy Applications. Procedia Comput. Sci. 2016, 98, 461–466. [Google Scholar] [CrossRef] [Green Version]
  6. Zheng, Z.B.; Xie, S.A.; Dai, H.N.; Chen, X.P.; Wang, H.M. An Overview of Blockchain Technology: Architecture, Consensus, and Future Trends. In Proceedings of the 2017 IEEE International Congress on Big Data (BigData Congress), Honolulu, HI, USA, 25–30 June 2017; pp. 557–564. [Google Scholar] [CrossRef]
  7. Leslie, M. Will Cryptocurrencies Break the Energy Bank? Engineering 2020, 6, 489–490. [Google Scholar] [CrossRef]
  8. Nakamoto, S. Bitcoin: A Peer-to-Peer Electronic Cash System. 2008. Available online: http://bitcoin.org (accessed on 10 March 2021).
  9. Ammous, S. The Bitcoin Standard: The Decentralized Alternative to Central Banking; John Wiley & Sons: Hoboken, NJ, USA, 2018; p. 16. [Google Scholar]
  10. Luther, W.J. Getting off the ground: The case of bitcoin. J. Institutional Econ. 2018, 15, 189–205. [Google Scholar] [CrossRef]
  11. Houy, N. The Bitcoin Mining Game. SSRN Electron. J. 2014. [Google Scholar] [CrossRef] [Green Version]
  12. Dimitri, N. Bitcoin Mining as a Contest. Ledger 2017, 2, 31–37. [Google Scholar] [CrossRef] [Green Version]
  13. Aste, T. The fair cost of bitcoin proof of work. SSRN Electron. J. 2016. [Google Scholar] [CrossRef]
  14. El Mahdy, D. The Economic Effect of Bitcoin Halving Events on the U.S. Capital Market. In 21st Century Approaches to Management and Accounting Research; InTech: London, UK, 2021. [Google Scholar]
  15. De Vries, A. Bitcoin’s Growing Energy Problem. Joule 2018, 2, 801–805. [Google Scholar] [CrossRef] [Green Version]
  16. Li, J.; Li, N.; Peng, J.; Cui, H.; Wu, Z. Energy consumption of cryptocurrency mining: A study of electricity consumption in mining cryptocurrencies. Energy 2019, 168, 160–168. [Google Scholar] [CrossRef]
  17. Truby, J. Decarbonizing Bitcoin: Law and policy choices for reducing the energy consumption of Blockchain technologies and digital currencies. Energy Res. Soc. Sci. 2018, 44, 399–410. [Google Scholar] [CrossRef]
  18. Mora, C.; Rollins, R.L.; Taladay, K.; Kantar, M.B.; Chock, M.K.; Shimada, M.; Franklin, E.C. Bitcoin emissions alone could push global warming above 2 °C. Nat. Clim. Chang. 2018, 8, 931–933. [Google Scholar] [CrossRef]
  19. Dittmar, L.; Praktiknjo, A. Could Bitcoin emissions push global warming above 2 °C? Nat. Clim. Chang. 2019, 9, 656–657. [Google Scholar] [CrossRef]
  20. Martynov, O. Sustainability Analysis of Cryptocurrencies Based on Projected Return on Investment and Environmental Impact. Harvard Library; Harvard Extension School. Available online: https://nrs.harvard.edu/URN-3:HUL.INSTREPOS:37365412 (accessed on 1 January 2020).
  21. Masanet, E.; Shehabi, A.; Lei, N.; Vranken, H.; Koomey, J.; Malmodin, J. Implausible projections overestimate near-term Bitcoin CO2 emissions. Nat. Clim. Chang. 2019, 9, 653–654. [Google Scholar] [CrossRef]
  22. Houy, N. Rational mining limits Bitcoin emissions. Nat. Clim. Chang. 2019, 9, 655. [Google Scholar] [CrossRef]
  23. Zade, M.; Myklebost, J.; Tzscheutschler, P.; Wagner, U. Is Bitcoin the Only Problem? A Scenario Model for the Power Demand of Blockchains. Front. Energy Res. 2019. [Google Scholar] [CrossRef]
  24. Jiang, S.; Li, Y.; Lu, Q.; Hong, Y.; Guan, D.; Xiong, Y.; Wang, S. Policy assessments for the carbon emission flows and sustainability of Bitcoin blockchain operation in China. Nat. Commun. 2021, 12, 1–10. [Google Scholar] [CrossRef] [PubMed]
  25. Cano, J.E.S. El bitcoin y su demanda exponencial de energía. Panorama Econ. 2019, 14, 85–110. [Google Scholar] [CrossRef]
  26. Krause, M.J.; Tolaymat, T. Quantification of energy and carbon costs for mining cryptocurrencies. Nat. Sustain. 2018, 1, 711–718. [Google Scholar] [CrossRef]
  27. University of Cambridge. Cambridge Bitcoin Electricity Consumption Index (CBECI). Cambridge Centre for Alternative Finance. Available online: https://cbeci.org/cbeci/comparisons (accessed on 26 April 2021).
  28. Schinckus, C.; Nguyen, C.P.; Ling, F.C.H. Crypto-currencies trading and energy consumption. Int. J. Energy Econ. Policy 2020, 10, 355–364. [Google Scholar] [CrossRef]
  29. Fadeyi, O.; Krejcar, O.; Maresova, P.; Kuca, K.; Brida, P.; Selamat, A. Opinions on Sustainability of Smart Cities in the Context of Energy Challenges Posed by Cryptocurrency Mining. Sustainability 2020, 12, 169. [Google Scholar] [CrossRef] [Green Version]
  30. Goodkind, A.L.; Jones, B.A.; Berrens, R.P. Cryptodamages: Monetary value estimates of the air pollution and human health impacts of cryptocurrency mining. Energy Res. Soc. Sci. 2020, 59, 101281. [Google Scholar] [CrossRef]
  31. Greenberg, P.; Bugden, D. Energy consumption boomtowns in the United States: Community responses to a cryptocurrency boom. Energy Res. Soc. Sci. 2019, 50, 162–167. [Google Scholar] [CrossRef]
  32. Stoll, C.; Klaaßen, L.; Gallersdörfer, U. The Carbon Footprint of Bitcoin. Joule 2019, 3, 1647–1661. [Google Scholar] [CrossRef]
  33. Hoang, A.; Nguyen, T. Theseus: Reusing Waste Heat from Cryptocurrency Mining to Heat Multi-Family House. Theseus. Available online: https://www.theseus.fi/handle/10024/149939 (accessed on 1 January 2018).
  34. Meynkhard, A. Energy efficient development model for regions of the Russian federation: Evidence of crypto mining. Int. J. Energy Econ. Policy 2019, 9, 16–21. [Google Scholar] [CrossRef]
  35. Morris, D. Burning down the house: Bitcoin, carbon-capitalism, and the problem of trustless systems. AI Soc. 2018, 34, 161–162. [Google Scholar] [CrossRef] [Green Version]
  36. Love, D. Cryptocurrency Heat Generator. Digital Commons-IMSA; Illinois Mathematics and Science Academy. Available online: https://digitalcommons.imsa.edu/slx/2021/socent/4/ (accessed on 28 April 2021).
  37. Jacquet, P.; Mans, B. Blockchain moderated by empty blocks to reduce the energetic impact of crypto-moneys. Comput. Commun. 2020, 152, 126–136. [Google Scholar] [CrossRef] [Green Version]
  38. Vranken, H. Sustainability of bitcoin and blockchains. Curr. Opin. Environ. Sustain. 2017, 28, 1–9. [Google Scholar] [CrossRef] [Green Version]
  39. University of Yale. Environmental Performance Index. Environmental Performance Index; Yale Center for Environmental Law & Policy. 2021. Available online: https://epi.yale.edu/epi-results/2020/component/epi (accessed on 4 April 2021).
  40. Malfuzi, A.; Mehr, A.; Rosen, M.A.; Alharthi, M.; Kurilova, A. Economic viability of bitcoin mining using a renewable-based SOFC power system to supply the electrical power demand. Energy 2020, 203, 117843. [Google Scholar] [CrossRef]
  41. Globalpetrolprices. Electricity Prices Around the World. GlobalPetrolPrices.Com. 2021. Available online: https://www.globalpetrolprices.com/electricity_prices/ (accessed on 5 April 2021).
  42. Hayes, A. Cryptocurrency value formation: An empirical study leading to a cost of production model for valuing bitcoin. Telemat. Inform. 2017, 34, 1308–1321. [Google Scholar] [CrossRef]
  43. Rehman, M.U.; Kang, S.H. A time–frequency comovement and causality relationship between Bitcoin hashrate and energy commodity markets. Glob. Finance J. 2020, 100576, 100576. [Google Scholar] [CrossRef]
  44. The World Bank. Electricity Production from Renewable Sources, Excluding Hydroelectric (% of total). The World Bank Data; IEA Statistics-OECD/IEA. 2021. Available online: https://data.worldbank.org/indicator/EG.ELC.RNWX.ZS (accessed on 5 April 2021).
  45. Climatic Research Unit. HadCRUT-Global Temperature Dataset. Climatic Research Unit-Data; University of East Anglia. 2021. Available online: https://sites.uea.ac.uk/cru/data (accessed on 5 April 2021).
  46. Jimenez, D. Bolivia y Ecuador Entre los Países que prohíben el comercio de criptomonedas en el mundo. Cointelegraph. Available online: https://es.cointelegraph.com/news/bolivia-and-ecuador-among-countries-that-ban-cryptocurrency-trading-in-the-world (accessed on 29 February 2020).
  47. Bit2Me Academy. Legality in Bitcoin. Bit2Me Academy. Available online: https://academy.bit2me.com/en/legalidad-en-bitcoin/ (accessed on 5 February 2021).
  48. The World Bank. Research and Development Expenditure (% of GDP). The World Bank-Data; The World Bank Based on UNESCO Institute for Statistics. 2021. Available online: https://data.worldbank.org/indicator/GB.XPD.RSDV.GD.ZS (accessed on 12 March 2021).
  49. The World Bank. The World Bank Human Capital Index (HCI) (Scale 0–1). 2021. Available online: https://data.worldbank.org/indicator/HD.HCI.OVRL (accessed on 14 March 2021).
  50. Análisis de regresión lineal múltiple con SPSS: Un ejemplo práctico. Reire 2019, 12, 2. [CrossRef] [Green Version]
  51. Abu-Bader, S.H. Using Statistical Methods in Social Science Research: With a Complete SPSS Guide; Oxford University Press: Oxford, UK, USA, 2021. [Google Scholar]
  52. Denis, D.J. SPSS Data Analysis for Univariate, Bivariate, and Multivariate Statistics; Wiley: Hoboken, NJ, USA, 2018. [Google Scholar]
  53. Aljandali, A. Quantitative Analysis and IBM® SPSS® Statistics: A Guide for Business and Finance; Springer: Berlin/Heidelberg, Germany, 2016. [Google Scholar]
  54. Aljandali, A. Multivariate Methods and Forecasting with IBM® SPSS® Statistics; Springer: Berlin/Heidelberg, Germany, 2017. [Google Scholar]
  55. Turner, P. Critical values for the Durbin-Watson test in large samples. Appl. Econ. Lett. 2020, 27, 1495–1499. [Google Scholar] [CrossRef]
  56. Neagu, O.; Ardelean, D.I.; Lazăr, V. How is environmental performance associated with economic growth? A world cross-country analysis. Stud. Univ. Vasile Goldis Arad. Econ. Ser. 2017, 27, 15–32. [Google Scholar] [CrossRef] [Green Version]
  57. De Angelis, E.M.; Di Giacomo, M.; Vannoni, D. Climate Change and Economic Growth: The Role of Environmental Policy Stringency. Sustainability 2019, 11, 2273. [Google Scholar] [CrossRef] [Green Version]
  58. Cosma, I.G.; David, K.G.; Antonescu, D.; Dumiter, F.C.; Jimon, Ș.A. The Correlation Between CO2 Emissions and GDP in a Sustainable Development Framework Using Kuznets Environment Curve. Stud. Univ. Vasile Goldis Arad. Econ. Ser. 2020, 30, 1–23. [Google Scholar] [CrossRef]
  59. Corbet, S.; Lucey, B.; Yarovaya, L. Bitcoin-energy markets interrelationships—New evidence. Resour. Policy 2021, 70, 101916. [Google Scholar] [CrossRef]
  60. Küfeoğlu, S.; Özkuran, M. Bitcoin mining: A global review of energy and power demand. Energy Res. Soc. Sci. 2019, 58, 101273. [Google Scholar] [CrossRef]
  61. Delgado-Mohatar, O.; Felis-Rota, M.; Fernández-Herraiz, C. The Bitcoin mining breakdown: Is mining still profitable? Econ. Lett. 2019, 184, 108492. [Google Scholar] [CrossRef]
  62. Bastian-Pinto, C.L.; Araujo, F.V.D.S.; Brandão, L.E.; Gomes, L.L. Hedging renewable energy investments with Bitcoin mining. Renew. Sustain. Energy Rev. 2021, 138, 110520. [Google Scholar] [CrossRef]
  63. Polemis, M.L.; Tsionas, M.G. The environmental consequences of blockchain technology: A Bayesian quantile cointegration analysis for Bitcoin. Int. J. Finance Econ. 2021. [Google Scholar] [CrossRef]
  64. Rusovs, D.; Jaundalders, S.; Stanka, P. Blockchain mining of cryptocurrencies as challenge and opportunity for renewable energy. In Proceedings of the 2018 IEEE 59th International Scientific Conference on Power and Electrical Engineering of Riga Technical University (RTUCON); Institute of Electrical and Electronics Engineers (IEEE), Riga, Latvia, 12–14 November 2018; pp. 1–5. [Google Scholar]
  65. Alonso, S.N.; Jorge-Vazquez, J.; Forradellas, R.R. Detection of Financial Inclusion Vulnerable Rural Areas through an Access to Cash Index: Solutions Based on the Pharmacy Network and a CBDC. Evidence Based on Ávila (Spain). Sustainability 2020, 12, 7480. [Google Scholar] [CrossRef]
  66. Alonso, S.N.; Jorge-Vazquez, J.; Forradellas, R.R. Central Banks Digital Currency: Detection of Optimal Countries for the Implementation of a CBDC and the Implication for Payment Industry Open Innovation. J. Open Innov. Technol. Mark. Complex. 2021, 7, 72. [Google Scholar] [CrossRef]
  67. Fernández, M.E.; Alonso, S.N.; Jorge-Vázquez, J.; Forradellas, R.R. Central Banks’ Monetary Policy in the Face of the COVID-19 Economic Crisis: Monetary Stimulus and the Emergence of CBDCs. Sustainability 2021, 13, 4242. [Google Scholar] [CrossRef]
  68. Alonso, S.L.N.; Fernández, M.; Ángel, E.; Bas, D.S.; Kaczmarek, J. Reasons Fostering or Discouraging the Implementation of Central Bank-Backed Digital Currency: A Review. Economies 2020, 8, 41. [Google Scholar] [CrossRef]
  69. Kayal, P.; Rohilla, P. Bitcoin in the economics and finance literature: A survey. SN Bus. Econ. 2021, 1, 1–21. [Google Scholar] [CrossRef]
  70. Auer, R.; Tercero-Lucas, D. Distrust or Speculation? the Socioeconomic Drivers of U.S. Cryptocurrency Investments. In BIS Website (p. 29). Bank for International Settlements (BIS). 2021. Available online: https://www.bis.org/publ/work951.pdf (accessed on 5 March 2021).
  71. Wamba, S.F.; Kamdjoug, J.R.K.; Bawack, R.E.; Keogh, J.G. Bitcoin, Blockchain and Fintech: A systematic review and case studies in the supply chain. Prod. Plan. Control. 2020, 31, 115–142. [Google Scholar] [CrossRef]
  72. Jorge-Vázquez, J.; Chivite-Cebolla, M.; Salinas-Ramos, F. The Digitalization of the European Agri-Food Cooperative Sector. Determining Factors to Embrace Information and Communication Technologies. Agriculture 2021, 11, 514. [Google Scholar] [CrossRef]
  73. Zhang, T.; Pota, H.; Chu, C.-C.; Gadh, R. Real-time renewable energy incentive system for electric vehicles using prioritization and cryptocurrency. Appl. Energy 2018, 226, 582–594. [Google Scholar] [CrossRef]
  74. Alonso, S.L.N. Activities and Operations with Cryptocurrencies and Their Taxation Implications: The Spanish Case. Laws 2019, 8, 16. [Google Scholar] [CrossRef] [Green Version]
  75. Sanz-Bas, D.; del Rosal, C.; Alonso, S.N.; Fernández, M.E. Cryptocurrencies and Fraudulent Transactions: Risks, Practices, and Legislation for Their Prevention in Europe and Spain. Laws 2021, 10, 57. [Google Scholar] [CrossRef]
  76. Solodan, K. Legal Regulation Of Cryptocurrency Taxation in European Countries. Eur. J. Law Public Adm. 2019, 6, 64–74. [Google Scholar] [CrossRef]
  77. Bagus, P.; de la Horra, L.P. An ethical defense of cryptocurrencies. Bus. Ethic Environ. Responsib. 2021, 30, 423–431. [Google Scholar] [CrossRef]
  78. Álvarez, G.C.; Jara, R.M.J.; Julián, J.R.R.; Bielsa, J.I.G. Study of the effects on employment of public aid to renewable energy sources. Rev. Procesos Merc. 2021. [Google Scholar] [CrossRef]
  79. Sánchez-Bayón, A.; García-Ramos, M.A. How to undertake with digital currencies as CSR 3.0 practices in wellbeing economics? J. Entrep. Educ. 2020, 23, 153–164. [Google Scholar]
  80. Vidal-Tomás, D.; Ibáñez, A.M.; Farinós, J.E. Herding in the cryptocurrency market: CSSD and CSAD approaches. Finance Res. Lett. 2019, 30, 181–186. [Google Scholar] [CrossRef]
  81. Yelowitz, A.; Wilson, M. Characteristics of Bitcoin users: An analysis of Google search data. Appl. Econ. Lett. 2015, 22, 1–7. [Google Scholar] [CrossRef] [Green Version]
  82. Huerta De Soto, J. The Theory of Dynamic Efficiency; Taylor & Francis: Abingdon, UK, 2009. [Google Scholar]
  83. Huerta De Soto, J. La teoría de la eficiencia dinámica. Rev. Procesos Mercado 2021, 1, 11–71. [Google Scholar] [CrossRef]
Figure 1. Estimated energy consumption from Bitcoin mining (annualized TWh). Source: Own elaboration using Tableau Desktop Professional Edition and data extracted in May 2021 from the University of Cambridge.
Energies 14 04254 g001
Figure 2. Most sustainable countries for cryptocurrency mining. Source: Own elaboration using Tableau Desktop Professional Edition.
Energies 14 04254 g002
Figure 3. Breakdown of average monthly hash rate by country. Source: Own elaboration using Tableau Desktop Professional Edition and data extracted from University of Cambridge: Cambridge Bitcoin electricity consumption index. Data from May 2021.
Energies 14 04254 g003
Table 1. Selection of variables.
VariableDescriptionSource
Renewable energy production (Er)Electricity production from renewable sources (% of total)Environmental Performance Index [39]
Electricity price (Pe)Household electricity prices, September 2020 (kWh, USD)GlobalPetrolPrices consortium database
Average annual temperature (T)Average daily minimum and maximum temperatures for the countryClimatic Research Unit [45]
Legal regulations regarding the cryptocurrency mining process (N)legality or illegality of trading in these virtual currenciesCointelegraph [46] y Bit2Me [47]
R&D expenditure (Id)R&D expenditure as a % of GDPThe World Bank, 2021
Human capital index (Dh)Scale 0–1The World Bank, 2021
Most Sustainable countries (Msc)Scale 0–100University of Yale. Environmental Performance Index (EPI) 2020
Source: Own elaboration.
Table 2. Model summary.
ModelRR-SquaredAdjusted R-SquaredStandard Error of the EstimateDurbin–Watson
10.8870.7870.7777.55522.074
Source: Own elaboration based on data from Table A2 and IBM SPSS Statistics 27.
Table 3. Estimation of the parameters β of the model. Dependent variable: most sustainable country.
ModelUnstandardized CoefficientsStandardized CoefficientsTSig.95.0% Confidence Interval for β
βDeviation ErrorβLower LimitUpper Limit
1(Constant)13.7694.743 2.9030.0044.38323.156
Electricity prices (kWh, USD)28.64311.3620.1452.5210.0136.15951.128
Electricity production from renewable sources, (% of total)0.1420.0760.0991.8600.0450.0090.292
Average temperature per country in degrees−0.2940.098−0.154−2.9870.003−0.489−0.099
Ban on cryptocurrency mining/operation2.5151.1800.0902.1310.0350.1794.851
R&D expenditure on research and development (% of GDP)4.1640.9080.2524.5830.0002.3665.962
HDI51.5196.7990.4657.5770.00038.06464.975
Source: Authors’ elaboration based on data from Table A2 and IBM SPSS Statistics 27.
Table 4. ANOVA.
Table 4. ANOVA.
ModelSum of SquaresglQuadratic AverageFSig.
1Regression26,583.48164430.58077.6190.000
Residual7192.22912657.081
Total33,775.709132
Source: Authors’ elaboration based on data from Table A2 and IBM SPSS Statistics 27.
Table 5. Most and least sustainable countries for cryptocurrency mining index.
CountryMost Sustainable Country for Cryptocurrency Mining IndexCountryLeast Sustainable Country for Cryptocurrency Mining Index
Denmark87.0Bolivia9.3
Germany82.3Suriname9.4
Sweden78.3Libya10.0
South Korea77.2Venezuela10.2
Switzerland77.0Cuba11.4
Finland76.8Belize15.3
Japan76.5Barbados15.7
Austria73.0Bahamas16.5
United Kingdom73.0Taiwan17.2
Israel72.3Cape Verde18.3
Czech Republic71.7Liechtenstein22.2
Portugal71.1Pakistan28.5
Ireland71.0Sudan30.3
Netherlands70.9Nigeria31.2
France70.7Iraq31.5
Source: Own elaboration derived from the new adjusted EPI index and IBM SPSS Statistics 27.
Publisher’s Note: MDPI stays neutral with regard to jurisdictional claims in published maps and institutional affiliations.

