Impact Analysis of Transmission Congestion on Power System Flexibility in Korea

Department of Electrical and Electronic Engineering, Joongbu University, 305 Dongheon-ro, Deogyang-gu, Goyang-si, Gyeonggi-do 10279, Korea
Energies 2020, 13(9), 2191; https://doi.org/10.3390/en13092191
Submission received: 27 February 2020
/
Revised: 28 April 2020
/
Accepted: 29 April 2020
/
Published: 1 May 2020
(This article belongs to the Special Issue Storages and Power Plant Flexibility for Improving Renewable Energy Penetration)
Abstract
:This study proposes a method to evaluate the impact of transmission congestion on the flexibility of a power system, based on the ramping capability shortage expectation (RSE). Here, flexibility refers to the ability to retain a power balance in response to changes in the net load. The flexibility issue arises due to the extensive integration of renewable energy resources; specifically, the higher the degree of integration, and the greater the variability and uncertainty in the power system. Flexibility is further limited by the net transfer capacity (NTC) of transmission lines. Here, we propose a method capable of capturing the extent to which transmission congestion affects the power system, to identify transmission reinforcement options for improved flexibility. In Korea, transmission congestion occurs frequently in regions to the north and southeast. A case study for a Korean power system in 2030 was conducted. Simulation results showed that the impact of transmission reinforcement in flexibility tends to be proportional to the NTC and is greater when the penetration level is low.
1. Introduction
In South Korea, according to the 8th Basic Plan for Electricity Supply and Demand (8th BPE), newly installed wind and photovoltaic (PV) systems coming online in 2030 will increase the total capacity of renewable energy resources by five-fold compared with 2019 levels [1]. The planned installed renewable capacity of wind and solar in 2030 is 54%, which is approximately 2.45 times higher than that proposed by the previous plan, the 7th BPE. However, the plans raise concerns regarding the flexibility of power systems, specifically, the ability to respond to changes in the net load (the load minus the power output of renewable energy resources) [2]. Large-scale integration of renewable energy resources may reduce the flexibility of power systems due to an increase in the variability and uncertainty of the net load [3]. This is a known issue that has been closely studied over the past decade [4].
Power system operators and planners require efficient, low-cost methods to maintain an adequate level of flexibility; several such methods have been applied to Korean power systems [5,6]. Flexibility-based methods are a good option for power system planning. In most studies, resources such as a conventional generating unit, demand response, and an energy storage system were used to promote system flexibility [7,8,9,10,11,12]. Sensitivity analysis has been applied to determine the impact of load variability and uncertainty on flexibility [7]. The effects of penetration level and the related phenomenon of variable generation (VG) on system [8], as well as load forecast error and failure rate [9], have also been considered.
However, previous studies have not addressed network constraints. In practice, the flexibility of a power system depends on its transmission limits [13]. A transmission system operator manages these limits based on the net transfer capacity (NTC), which is defined as the maximum power available for transfer between two interconnected areas that is compatible with security standards for these areas, taking into account the uncertainties of future network conditions [14]. The NTC is used as a basis for transmission congestion management; specifically, the power flow in each transmission line should be kept below its NTC. The ramping capability of every generating unit is also restricted by the NTC of its connected line. Hence, NTC must be considered when evaluating the flexibility of power transmission systems.
Extensive integration of renewable energy resources may lead to the requirement for a larger NTC [15]. The introduction of renewable energy to an existing system increases the variability and uncertainty of the line flow, and ultimately the net load, thereby making it difficult to ensure flexibility. Thus, the impact of renewable energy resources on the NTC must be considered in flexibility evaluations, in addition to the penetration level of the renewable energy resource.
In South Korea, most generation facilities are located in regions to the east and south; however, 40% of the demand is concentrated in the north, which includes the capital city (Seoul). This asymmetric arrangement leads to transmission line congestion throughout the country [16]. Plans to expand current transmission networks between regions are being met with civil complaints. Large installations of renewable energy resources in nearby generation areas are currently underway; however, this would likely worsen transmission congestion, because the NTC would become insufficient. Additionally, the division of generation and demand areas, as well as the high rate of integration of renewable energy resources, may further reduce flexibility [17]. A method for quantifying the effect of transmission congestion on power system flexibility is necessary to better prepare for future power demands and the increasing incorporation of renewable energy resources. Studies have proposed various indices for this purpose [18]. The performances of flexible resources have been evaluated with indices system flexibility index (SFI) and alpha (α) in a day-ahead scheduling [19]. Insufficient Ramping Resource Expectation (IRRE) and Periods of Flexibility Deficit (PFD) have been applied to quantify flexibility [20]; however, they did not explicitly capture the effect of transmission congestion.
This study introduces a method for measuring the impact of transmission congestion on flexibility using the ramping capability shortage expectation (RSE) index [21]. This method can identify the most appropriate transmission reinforcement strategy (i.e., the option for increase in transmission capacity) to restore system flexibility, according to the NTC range and penetration level of renewable energy resources. A procedure for scenario generation and the evaluation of transmission congestion is proposed, in which the NTC range and penetration level are used as input parameters. The proposed approach is demonstrated via a case study of a Korean power system. Simulation results showed that the effect of transmission reinforcement is proportional to the NTC and is greater at lower penetration levels.
The remainder of this paper is organized as follows. In Section 2, the RSE is introduced as a way to quantify flexibility in association with transmission congestion. In Section 3, the proposed method is used to assess the effect of transmission congestion on flexibility. In Section 4, a case study for a Korean power system in 2030 is presented. Conclusions and directions for future work are discussed in Section 5.
2. Flexibility Index: Ramping Capability Shortage Expectation
The extent to which transmission congestion affects the flexibility of a power system can be quantified using the RSE index, which helps power system operators to respond quickly and efficiently to transmission congestion. The RSE calculations are provided in the following subsections.
2.1. Ramping Capability Requirement and System Ramping Capability
The ramping capability (RC) is defined as the power increase/decrease of a generation resource over a given period of time. The RC required for power generation, accounting for load variability, is referred to as the RC requirement (RCR), which is given by
where
RCRt represents the RC required against unpredicted load changes and outages of load generating units from t−∆t to t. In Equation (2), NLFEt, LFEt, and VGFEt are random variables representing forecast error. In equation 3, FNLt, FLt, and FVGt are deterministic variables representing load and variable generation. Here, NTC relates to RCRt because Pi,t2212∆t can be limited by NTC in each line.
RCRt is covered by the system RC (SRC), which can be represented as the sum of the RCs of all generating units in the system, as follows:
SRCt reflects the ability of the power system to provide the RC within the interval Δt; the larger the SRC, the greater the flexibility. Ai,t-Δt is a random variable indicating outages of generating units over the period from t−∆t to t.; the calculation of Ai,t-Δt is described in reference [22]. Likewise, SRCt is also affected by transmission congestion, as Pi,t-∆t is subject to the NTCl.
2.2. Ramping Capability Shortage Probability and Ramping Capability Shortage Expectation
If RCRt is covered by the SRCt, then load curtailment is enforced; this is referred to as an RC shortage. The probability that an RC shortage will occur at time t is defined as the RC shortage probability (RSPt), given by
The worst-case scenario is considered for the RSPt calculation; specifically, uncertainties that occur just before a given time are considered [21]. This is useful for reducing the computational time in large power networks. Ct-Δt and Et represent the set of possible cases for Ai,t-Δt and NLFEt, respectively. RSE is simply the sum of the RSPt over the entire period, as follows:
3. Scenario Generation and Evaluation for Transmission Congestion
3.1. Flexibility Restriction Due to Transmission Congestion
Flexibility can be provided by various operational resources, such as conventional generation units, energy storage systems, and demand-side resources. Ancillary services and design improvements represent additional options to enhance structural flexibility [23,24,25,26]. However, the limited capacity of the transmission network may reduce the utility of these options by restricting line flows. In order to explain the limitation of flexibility due to transmission congestion, a simple example is provided in Figure 1. A three-bus system is composed of two generating units, Gen A and Gen B, and a load. It is assumed that the reactance of all lines is the same, and that a sudden load change from 20 to 50 MW occurs within a 1-min time frame. All generating units have an RC of 25 MW/min. Any uncertainty is ignored for simplicity.
Case (a) shows the base case of the example. In (b), a 20-MW load is applied (a); operating points of Gen A and Gen B become 10 MW, respectively. The calculation for the line flow in transmission line 1 (TL1) is denoted by ①, i.e., 10/3 MW (produced by Gen B) minus 10/3 MW (produced by Gen A); there is no line flow in TL1. Meanwhile, the line flow in TL2 is given by ②, i.e., 10/3 MW (produced by Gen B) plus 20/3 MW (produced by Gen A); there is a 10 MW line flow in TL2. In a similar way, a line flow in TL3 can be calculated. In (c), the load suddenly varies (within 1 min) from 25 to 50 MW. All generating units increase their power. If uncertainty is ignored, the RCR is 25 MW/min. The RC of each generating unit is 15 MW/min, because the operating point of each unit is 10 MW. The total SRC is thus 30 MW/min. However, it should be noted that if the operating point of each unit is increased to 25 MW, a violation occurs, i.e., the line flow in TL3 (i.e., 25 MW) exceeds NTC3 (i.e., 20 MW) in (c). Therefore, as shown in (d), line flows must be adjusted below NTC3. One of the ways to solve this problem is to change operating point of Gen B to 105/6 MW; then, the line flow on TL3 does not exceed NTC3. However, the RC of Gen B is limited, so the SRC is reduced. The RC and load requirements are not satisfied. (e) shows the NTC-reinforced case. If NTC3 increases to 25 MW through transmission reinforcement, then the RC of Gen B is not restricted, and the RC and load requirements are satisfied. Thus, this example illustrates the reduction in system flexibility with transmission congestion that must be mitigated by reinforcement measures.
3.2. Scenario Generation and Evaluation of Transmission Congestion
A scenario-based analysis was used in this study. The procedure for scenario generation is described below. First, congested lines are identified using empirical data; considering all lines reduces the computational efficiency of large networks. Second, the NTC of the selected lines and penetration level of renewable energy resources are used as input parameters for the different scenarios. The scenarios for NTC and penetration levels of renewable energy resources are listed in Table 1. Penetration level is classified into three types: high, medium, and low. The medium type corresponds to the base scenario, represented as S2. The high (low) type of penetration level is larger (smaller) than that of the base scenario given by S1 and S3; these represent uncertainties in the future system. An NTC range is applied to each penetration level. The planned NTC corresponds to the NTC of the base scenario. If the transmission lines are reinforced (degraded), then the NTC is larger (smaller) than the NTC of the base scenario. Here, the congestion mitigation degree (CMD) index is introduced to represent the extent to which transmission reinforcement affects flexibility, where a negative value indicates that the NTC is more degraded than the planned NTC. The CMD index for each scenario is calculated as follows:
where RSEb is the RSE of the base scenario and RSEs is the RSE of the scenario of interest.
Flexibility can be affected not only by the net load but also by the correlations among the outputs of the renewable energy resources [7,8]. This study focused on the impact of penetration level and NTC on the flexibility of a power system. The net load and correlation among outputs were the same in each scenario. The scenario generation and evaluation procedure is summarized in Figure 2. Although the penetration level and NTC range may differ according to the system conditions, the effects of these parameters on flexibility can still be analyzed.
4. Case Study
4.1. Base Scenario
The purpose of the case study was not only to evaluate the effects of transmission congestion on flexibility in Korean power systems for 2030, but also to compare the transmission reinforcement options. The target year (2030) was based on the “Renewable Energy 3020 Implementation Plan” [1]. To obtain the net load forecast of a typical peak day, the net load of a peak day in 2016 was used; the net load referred to here is the power system loads minus the renewable energy resource. Renewable energy resources can be separated into VG and non-VG types. VG is a nondispatchable unit, whereas non-VG and conventional units are dispatchable units. This classification is used to forecast the net load profile and generation scheduling in 2030. Figure 3 shows output profiles of VG and non-VG resources in 2016. For reference, convex profiles from hours 8–18 were selected, based on the output profiles of the PV systems. By upscaling the profiles, the forecast VG and non-VG in 2030 can be estimated and applied to determine the net load profile of a peak day in 2030, in which a peak net load of 85,206 MW occurred during hour 18, as shown in Figure 4. The detailed steps in obtaining net load profile can be found in reference [5]. Note that this profile is used to generate the base scenario. A Gaussian distribution was assumed for the NLFE, with a standard deviation of 5%.
Assuming that the nondispatchable units show an increase at the same rate as in 2016, the installed capacity of nondispatchable units in 2030 can be calculated. The dispatchable units comprise combined-cycle units (e.g., gas and steam turbines), cogeneration units, hydraulic units, nuclear power units, and steam turbine units. Information on the generating units in 2030 can be found in reference [1]. To evaluate flexibility, the information on failure/repair rates of each generating unit is required, along with the hourly generation schedule. The former is referred to in reference [22] and the latter is obtained using M-CoreS, which is a commercial simulator for Korean power systems [27]. The RSE was then computed with MATLAB software (version R2014b; MathWorks, Natick, MA, USA) [28].
4.2. Scenario Generation and Evaluation
Scenario generation and evaluation were performed as follows, based on the procedure outlined in Figure 2.:
Step 1. Congested line selection. In the example Korean power system, four 345-kV lines and two 765-kV lines between the east/south area and northern areas are the most frequently congested lines. These six congested lines were selected for the evaluation.
Step 2. Determination of NTC range for selected lines. The total planned NTC of the selected lines in 2030 is 18,000 MW. Transmission expansion has been limited due to civil complaints. Thus, it is reasonable to assume a narrow NTC range; as such, an NTC range of 16,000–20,000 MW was chosen for the evaluation.
Step 3. Penetration levels of renewables. The planned penetration level of renewable energy resources is 54%. A high (low) type is assumed to have a value of 64% (54%), but in reality, 64% is almost impossible; nevertheless, the high type is useful for investigating the extent to which the system is flexible. Steps 2 and 3 are summarized in Table 2.
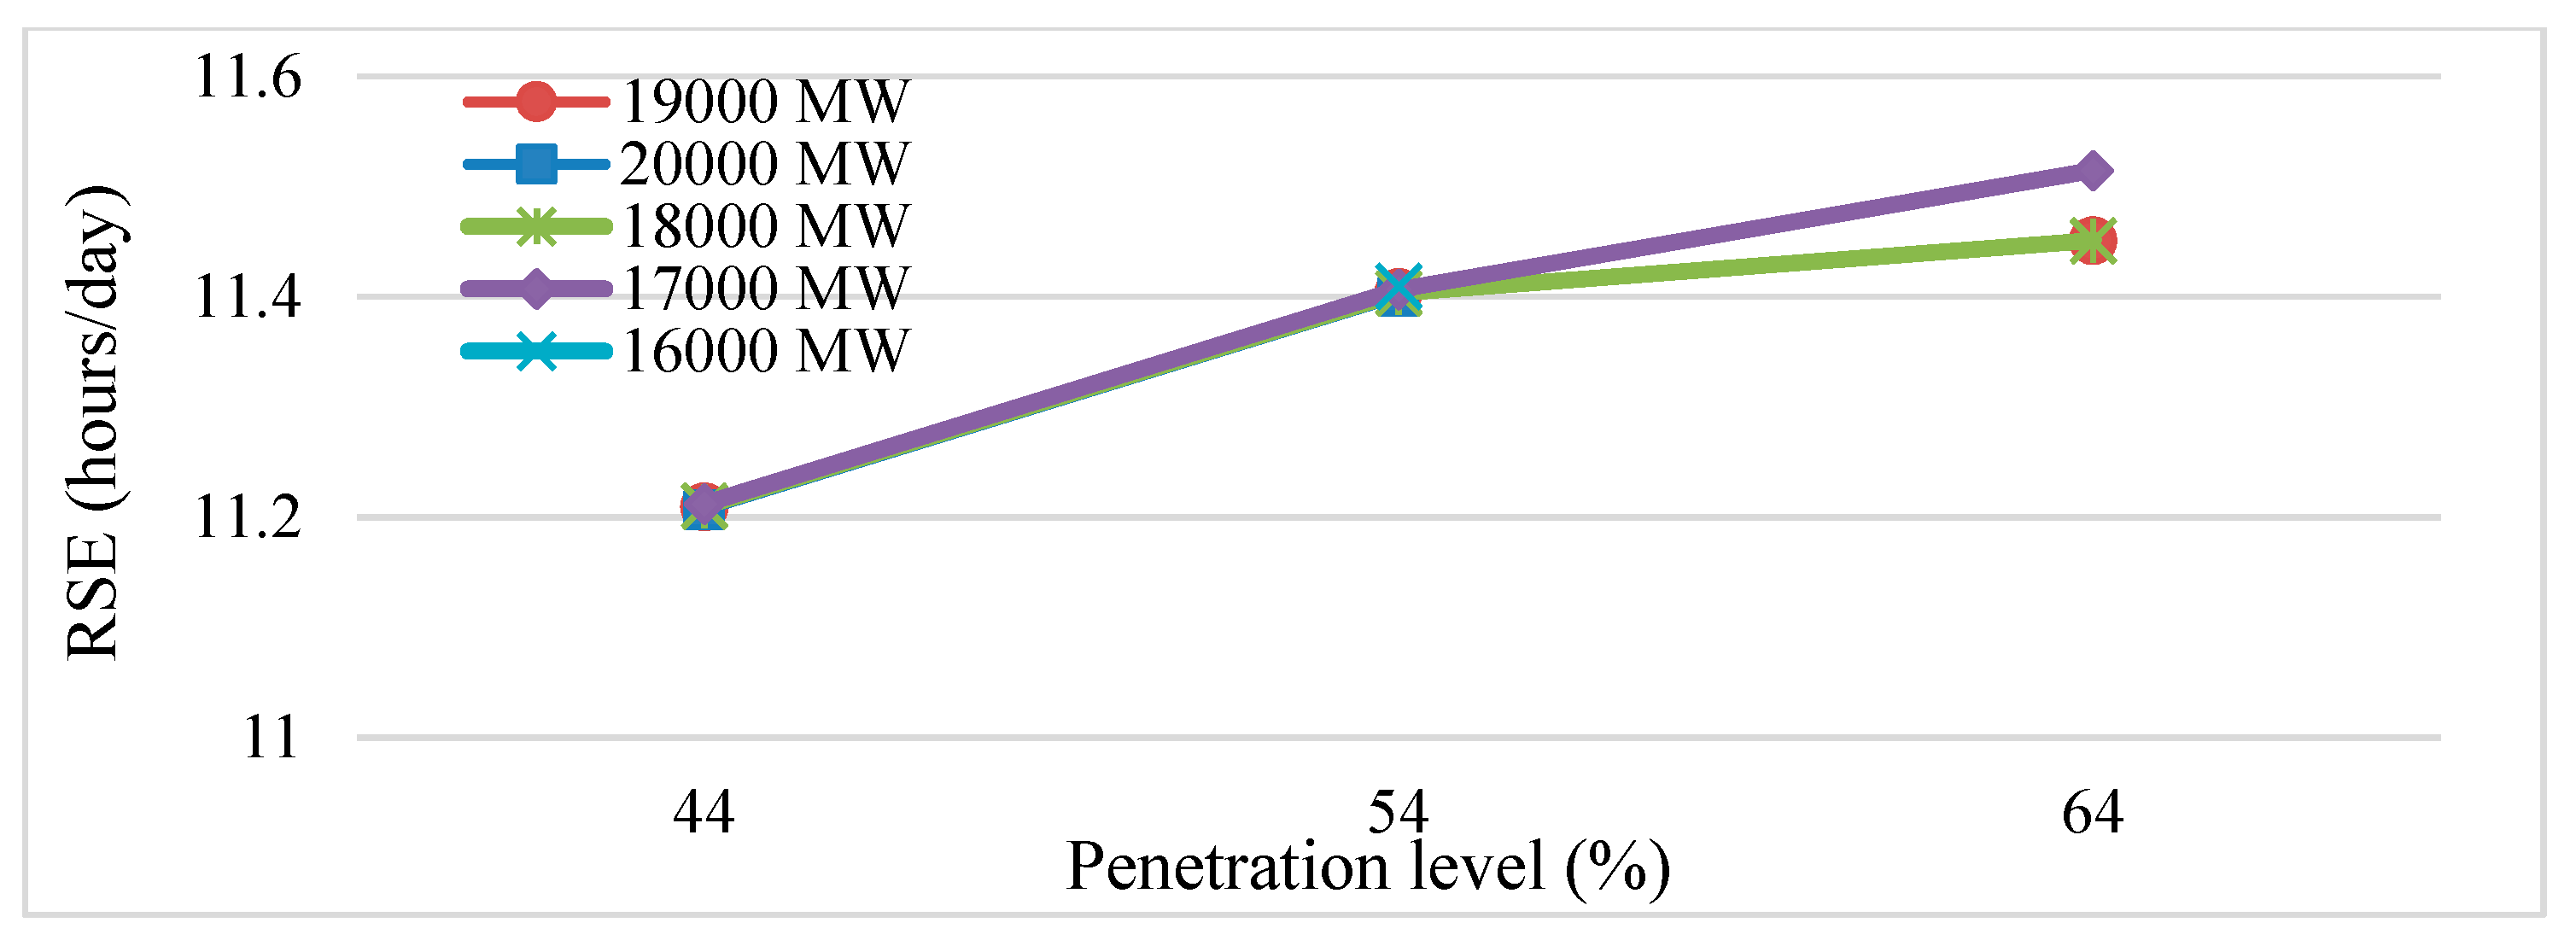
Step 4. Flexibility evaluation based on penetration level and NTC range. To evaluate flexibility, generation schedule results for various scenarios are required. The base scenario results, with a penetration level of 54% and an NTC of 18,000 MW, are shown in Figure 5. The calculated RSE for the base scenario was 11.4038 h/day. Figure 6 and Table 3 show the RSE results for each scenario; notably, the RSE for each NTC was proportional to the penetration level. N/A in Table 3 stands for “not applicable”; N/A values occurred when the solutions of the optimization simulations for generation scheduling did not converge.
For reference, the RSE criterion can be set by the system operator based on the tradeoff relationship between reserve and reliability costs. In a previous study [5], the RSE criterion corresponded to the RSE of a Korean power system in 2016 when the installed reserve capacity exceeded 15%; criteria for selecting the RSE were not considered in this study.
Table 4 shows the CMD results for the base scenario; the larger the CMD, the greater the mitigation effect. As expected, the largest (smallest) CMD occurred when the penetration level was 44% (64%) and the NTC was 20,000 MW (17,000 MW). Three important findings were derived. First, for the same penetration level, the greater the NTC, the greater the CMD, with the exception of N/A values. Thus, the results showed that the effect of transmission reinforcement is proportional to NTC. Second, the degree of increase/decrease in the CMD with a change in NTC depended on the penetration level. When the penetration level was 44%, the CMDs for 18,000 and 19,000 MW were different. However, when the penetration level was 64%, there was no change between the CMDs for 18,000 and 19,000 MW. The largest change was found between the CMD for 18,000 MW (i.e., −0.0474) and that for 17,000 MW (i.e., −0.1111), with a penetration level of 64%. The results indicated that the effect of transmission reinforcement depends on the penetration level. Third, the change in CMD was larger when the penetration level decreased 10% from 54% (i.e., to 44%) than when it increased by 10% from 54% (i.e., to 64%). When the NTC was 18,000 MW, the CMD increased (decreased) to 0.1936 (0.0474) when the penetration level decreased (increased) by 10%. Thus, transmission reinforcement was more effective when the penetration level was low.
5. Conclusions
This study introduces a method to quantify the impact of transmission congestion on flexibility in power systems; the effects of transmission congestion were captured using the RSE flexibility index. A case study for a Korean power system in 2030 with congested lines was carried out under various scenarios, with the penetration level of renewable energy resources and NTC range as adjustable parameters. Simulation results showed that the effect of transmission reinforcement on flexibility is proportional to the NTC, and is greater when the penetration level is low. The proposed approach is expected to provide system planners with useful information for more efficient operation and management of power transmission systems. As a part of future work, it would be interesting to analyze the effect of congestion mitigation based on other operation methods and to investigate the potential of congestion for transmission lines.
Author Contributions
C.M. conducted all the research and thoroughly reviewed the work. All authors have read and agreed to the published version of the manuscript.
Funding
This research was funded by Joongbu University Research and Development Fund, in 2019.
Conflicts of Interest
The author declares no conflict of interest.
Nomenclature
| Ai,t | Random variable representing availability of generator i at time t (1 if available, 0 otherwise) |
| b | Index of base scenario |
| c | Element of Ct−Δt |
| Ct-Δt | Set of combinations of Ai,t−Δt when Oi,t−Δt is nonzero for all i |
| e | Element of Et |
| Et | Set of NLFEt |
| FLt | Forecast load at time t |
| FNLt | Forecast net load at time t |
| FVGt | Forecast variable generation at time t |
| i | Index of generator |
| I | Set of generators |
| LFEt | Random variable representing load forecast error at time t |
| LFl,t | Power flow of transmission line l at time t |
| min() | Function selecting a smaller value in the brackets |
| NLFEt | Random variable representing net load forecast error at time t |
| NTCl | Net transfer capacity of transmission line l |
| Oi,t | Value representing whether generator i is online at time t or not |
| Pi,t | Output of generator i at time t |
| Pj,t | Output of generator j at time t |
| Pmax,i | Maximum output level of generator i |
| Prob(·) | Probability in the brackets. |
| Probc[·] | Probability of c if condition [∙] is satisfied, 0 otherwise |
| RSE | Ramping capability shortage expectation |
| RSEs | Ramping capability shortage expectation for scenario s |
| RCRt | Ramping capability requirement at time t |
| rri | Ramp rate of generator i |
| RSPt | Ramping capability shortage probability at time t |
| s | Index of scenario |
| SRCt | System ramping capability at time t |
| t | Index of time |
| Δt | Minimum interval between operating points |
| VGFEt | Random variable representing variable generation forecast error at time t |
References
- The Ministry of Trade, Industry and Energy. The 8th Basic Plan on Electricity Demand and Supply; MOTIE: Sejong, Korea, 2017.
- Min, C.-G.; Kim, M.-K. Flexibility-based reserve scheduling of pumped hydroelectric energy storage in korea. Energies 2017, 10, 1478. [Google Scholar]
- Denholm, P.; Hand, M. Grid flexibility and storage required to achieve very high penetration of variable renewable electricity. Energy Policy 2011, 39, 1817–1830. [Google Scholar] [CrossRef]
- Cochran, J.; Miller, M.; Zinaman, O.; Milligan, M.; Arent, D.; Palmintier, B.; O’Malley, M.; Mueller, S.; Lannoye, E.; Tuohy, A. Flexibility in 21st Century Power Systems; NREL: Golden, CO, USA, 2014.
- Min, C.-G.; Kim, M.-K. Flexibility-based evaluation of variable generation acceptability in korean power system. Energies 2017, 10, 1719. [Google Scholar] [CrossRef] [Green Version]
- Min, C.-G.; Kim, M.-K. Net load carrying capability of generating units in power systems. Energies 2017, 10, 1221. [Google Scholar] [CrossRef] [Green Version]
- Min, C.-G. Analyzing the impact of variability and uncertainty on power system flexibility. Appl. Sci. 2019, 9, 561. [Google Scholar] [CrossRef] [Green Version]
- Min, C.-G.; Kim, M.-K. Impact of the complementarity between variable generation resources and load on the flexibility of the korean power system. Energies 2017, 10, 1719. [Google Scholar] [CrossRef] [Green Version]
- Park, J.-K.; Choi, J.; Min, C.-G. The effect of uncertainty information on short-term reliability in power systems. IFAC-PapersOnLine 2016, 49, 273–277. [Google Scholar] [CrossRef]
- Kubik, M.; Coker, P.J.; Barlow, J.F. Increasing thermal plant flexibility in a high renewables power system. Appl. Energy 2015, 154, 102–111. [Google Scholar] [CrossRef]
- Eser, P.; Singh, A.; Chokani, N.; Abhari, R.S. Effect of increased renewables generation on operation of thermal power plants. Appl. Energy 2016, 164, 723–732. [Google Scholar] [CrossRef]
- Shariatzadeh, F.; Mandal, P.; Srivastava, A.K. Demand response for sustainable energy systems: A review, application and implementation strategy. Renew. Sustain. Energy Rev. 2015, 45, 343–350. [Google Scholar] [CrossRef]
- Bompard, E.; Zalzar, S.; Huang, T.; Purvins, A.; Masera, M. Baltic power systems’ integration into the EU market coupling under different desynchronization schemes: A comparative market analysis. Energies 2018, 11, 1945. [Google Scholar] [CrossRef] [Green Version]
- Giannuzzi, G.; Lucarella, D.; Massucco, S.; Pozzi, M.; Sforna, M.; Silvestro, F. In Advanced load-shedding methodology and architecture for normal and emergency operation of the italian power system. In Proceedings of the 2005 IEEE Power and Energy Society General Meeting, San Francisco, CA, USA, 12–16 June 2005; pp. 1563–1569. [Google Scholar]
- Mayer, P.; Ball, C.S.; Vögele, S.; Kuckshinrichs, W.; Rübbelke, D. Analyzing brexit: Implications for the electricity system of great britain. Energies 2019, 12, 3212. [Google Scholar] [CrossRef] [Green Version]
- Song, G.-B.; Im, G.-H.; Baek, Y.-S. A case study of the congestion management for the power system of the korea electric power cooperation. Trans. Korean Inst. Electr. Eng. A 2001, 50, 549–555. [Google Scholar]
- Nosair, H.; Bouffard, F. Flexibility envelopes for power system operational planning. IEEE Transactions on Sustainable Energy 2015, 6, 800–809. [Google Scholar] [CrossRef] [Green Version]
- Lund, P.D.; Lindgren, J.; Mikkola, J.; Salpakari, J. Review of energy system flexibility measures to enable high levels of variable renewable electricity. Renew. Sustain. Energy Rev. 2015, 45, 785–807. [Google Scholar] [CrossRef] [Green Version]
- Nikoobakht, A.; Aghaei, J.; Shafie-Khah, M.; Catalão, J.P. Assessing increased flexibility of energy storage and demand response to accommodate a high penetration of renewable energy sources. IEEE Trans. Sustain. Energy 2018, 10, 659–669. [Google Scholar] [CrossRef]
- Lannoye, E.; Flynn, D.; O’Malley, M. Transmission, variable generation, and power system flexibility. IEEE Trans. Power Syst. 2014, 30, 57–66. [Google Scholar] [CrossRef]
- Min, C.-G.; Park, J.K.; Hur, D.; Kim, M.-K. A risk evaluation method for ramping capability shortage in power systems. Energy 2016, 113, 1316–1324. [Google Scholar] [CrossRef]
- Allan, R.N. Reliability Evaluation of Power Systems; Springer: Berlin, Germany, 2013. [Google Scholar]
- Weber, C. Adequate intraday market design to enable the integration of wind energy into the European power systems. Energy Policy 2010, 38, 3155–3163. [Google Scholar] [CrossRef]
- Levin, T.; Botterud, A. Electricity market design for generator revenue sufficiency with increased variable generation. Energy Policy 2015, 87, 392–406. [Google Scholar] [CrossRef] [Green Version]
- Singarao, V.Y.; Rao, V.S. Frequency responsive services by wind generation resources in united states. Renew. Sustain. Energy Rev. 2016, 55, 1097–1108. [Google Scholar] [CrossRef]
- Banshwar, A.; Sharma, N.K.; Sood, Y.R.; Shrivastava, R. Renewable energy sources as a new participant in ancillary service markets. Energy Strategy Rev. 2017, 18, 106–120. [Google Scholar] [CrossRef]
- Master’s Space. M-Core User’s Manual; MS: Anyang, Korea, 2016. [Google Scholar]
- Hunt, B.R.; Lipsman, R.L.; Rosenberg, J.M. A Guide to Matlab: For Beginners and Experienced Users; Cambridge University Press: Cambridge, UK, 2014. [Google Scholar]
Figure 1.
Line flows in a three-bus system composed of two generating units and a load: (a) base case; (b) base case: load (20 MW); (c) NTC-violated case: load (50 MW) and NTC3 (20 MW); (d) power-adjusted case: load (50 MW) and NTC3 (20 MW); and (e) NTC-reinforced case: load (50 MW) and NTC3 (25 MW). (O.P. operating point).
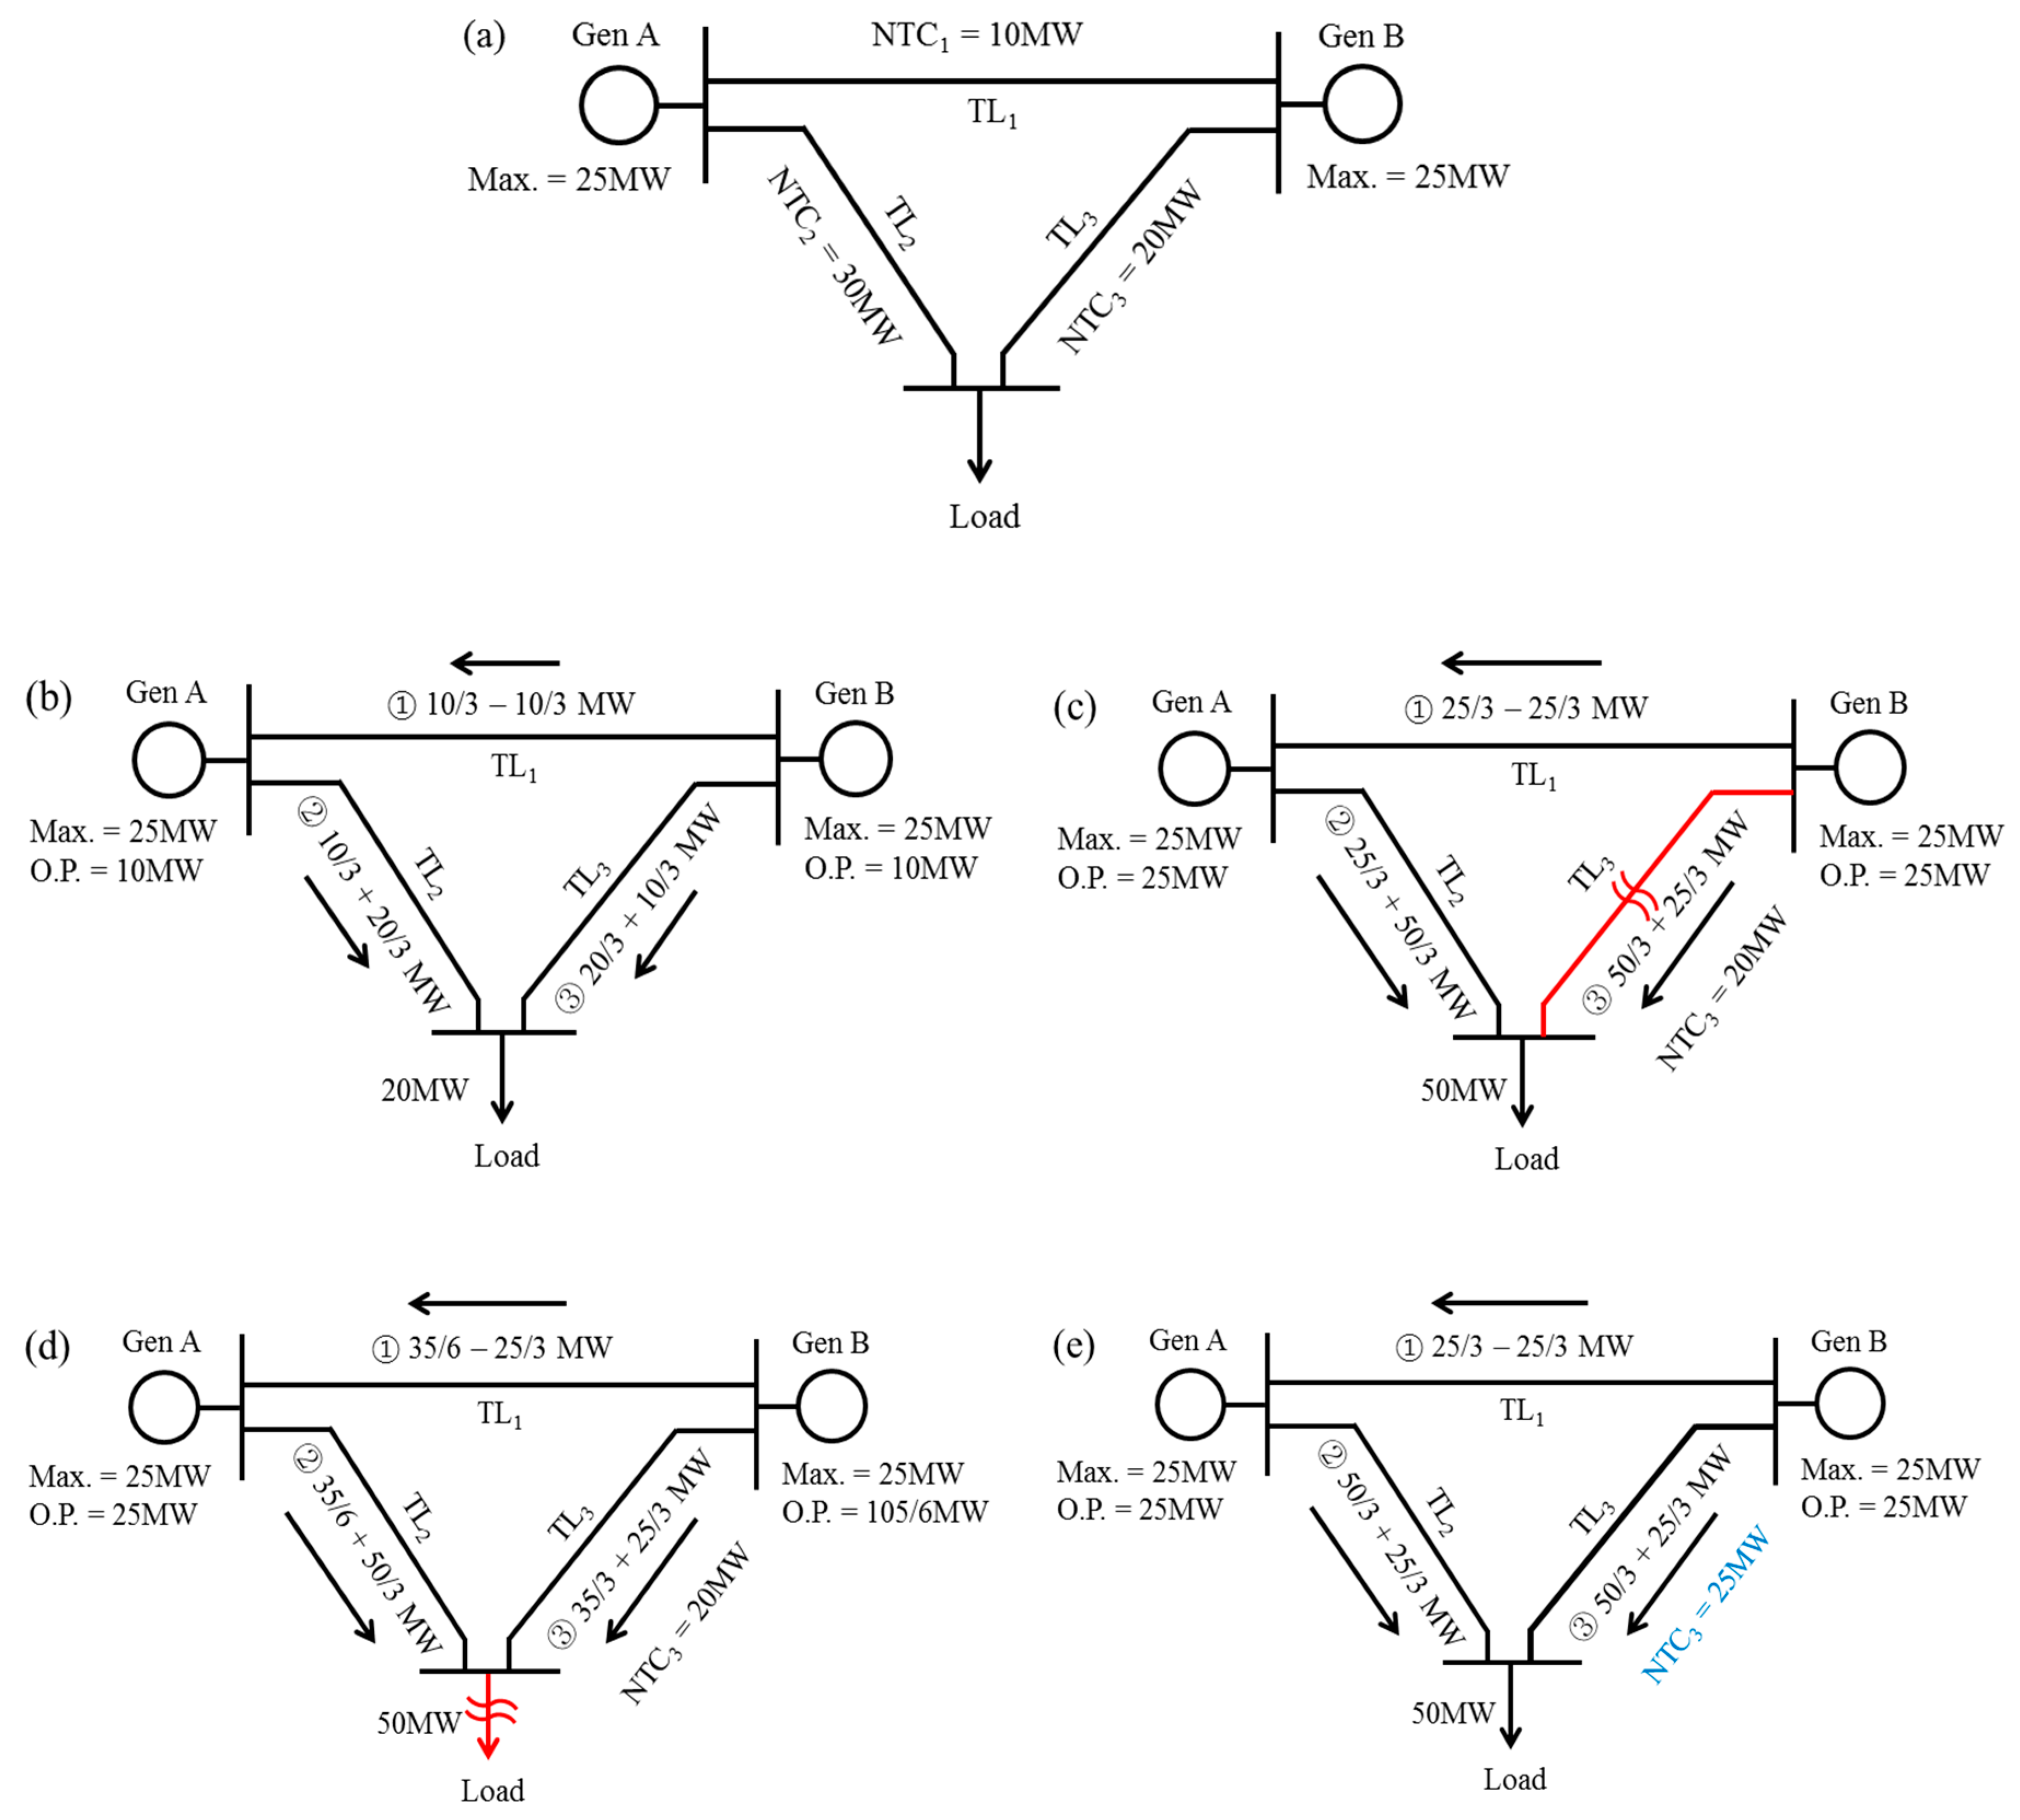
Figure 2.
Scenario generation and evaluation procedure.

Figure 3.
Variable generation (VG)/non-VG output profiles of a peak day in 2016.

Figure 4.
Base scenario. Net load profiles of a peak day in 2030.
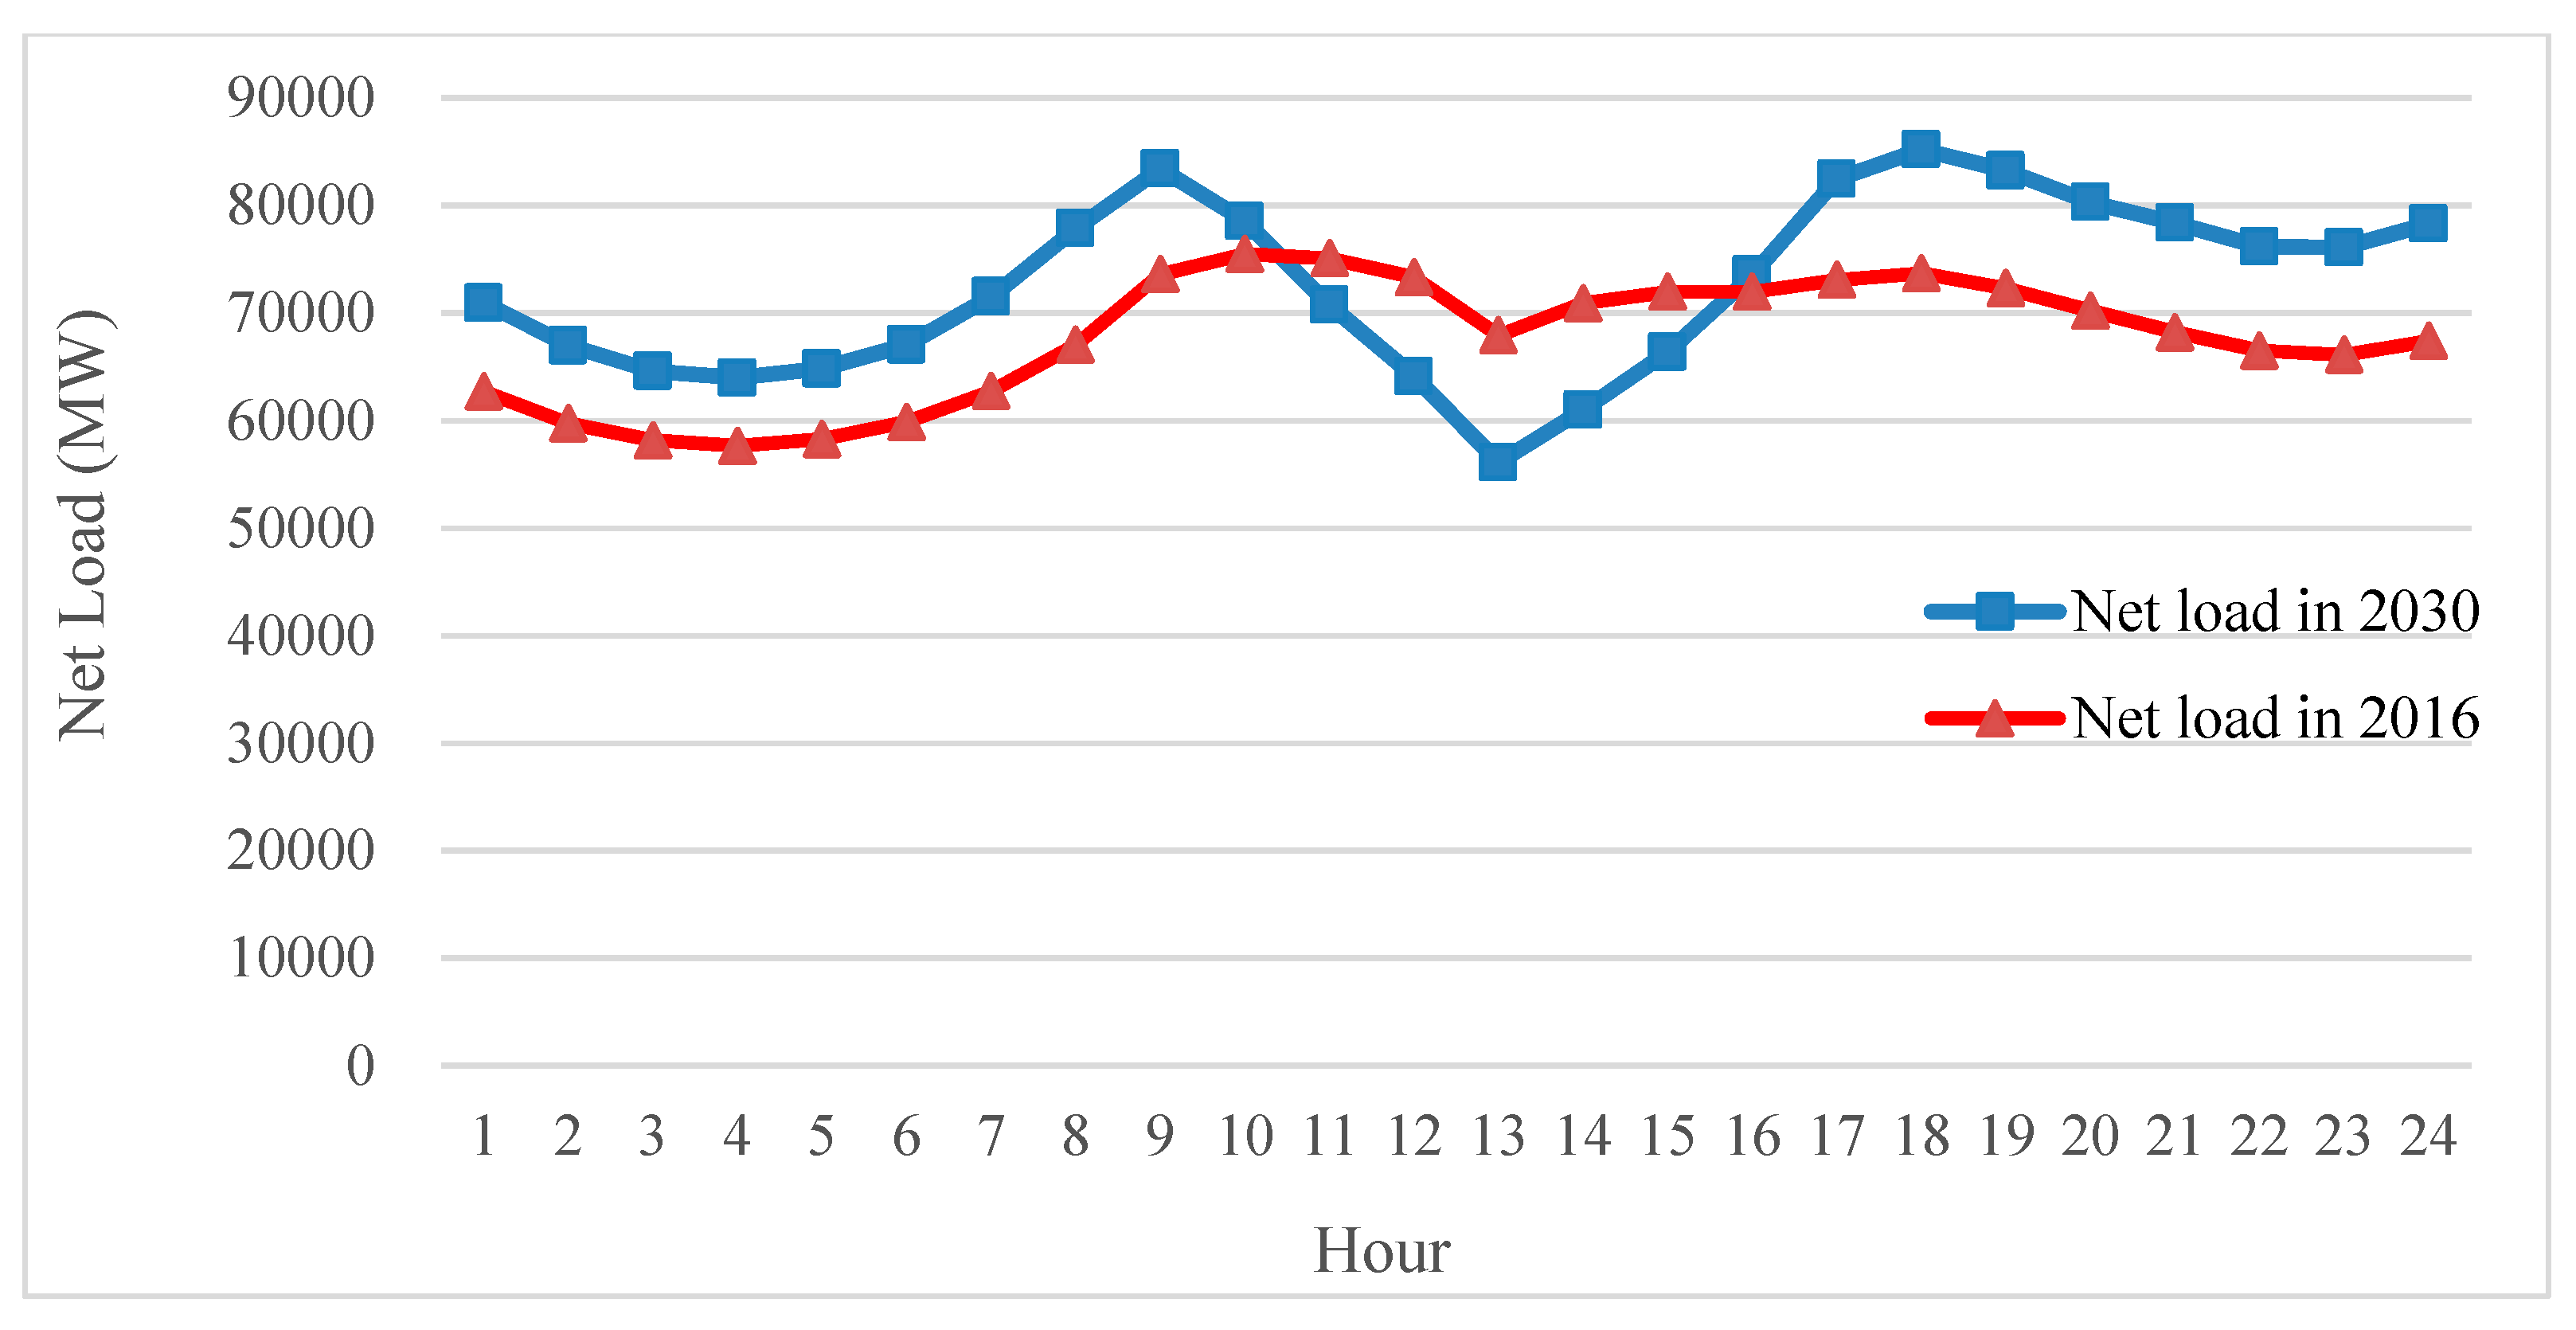
Figure 5.
Generation schedule of the base scenario in 2030.
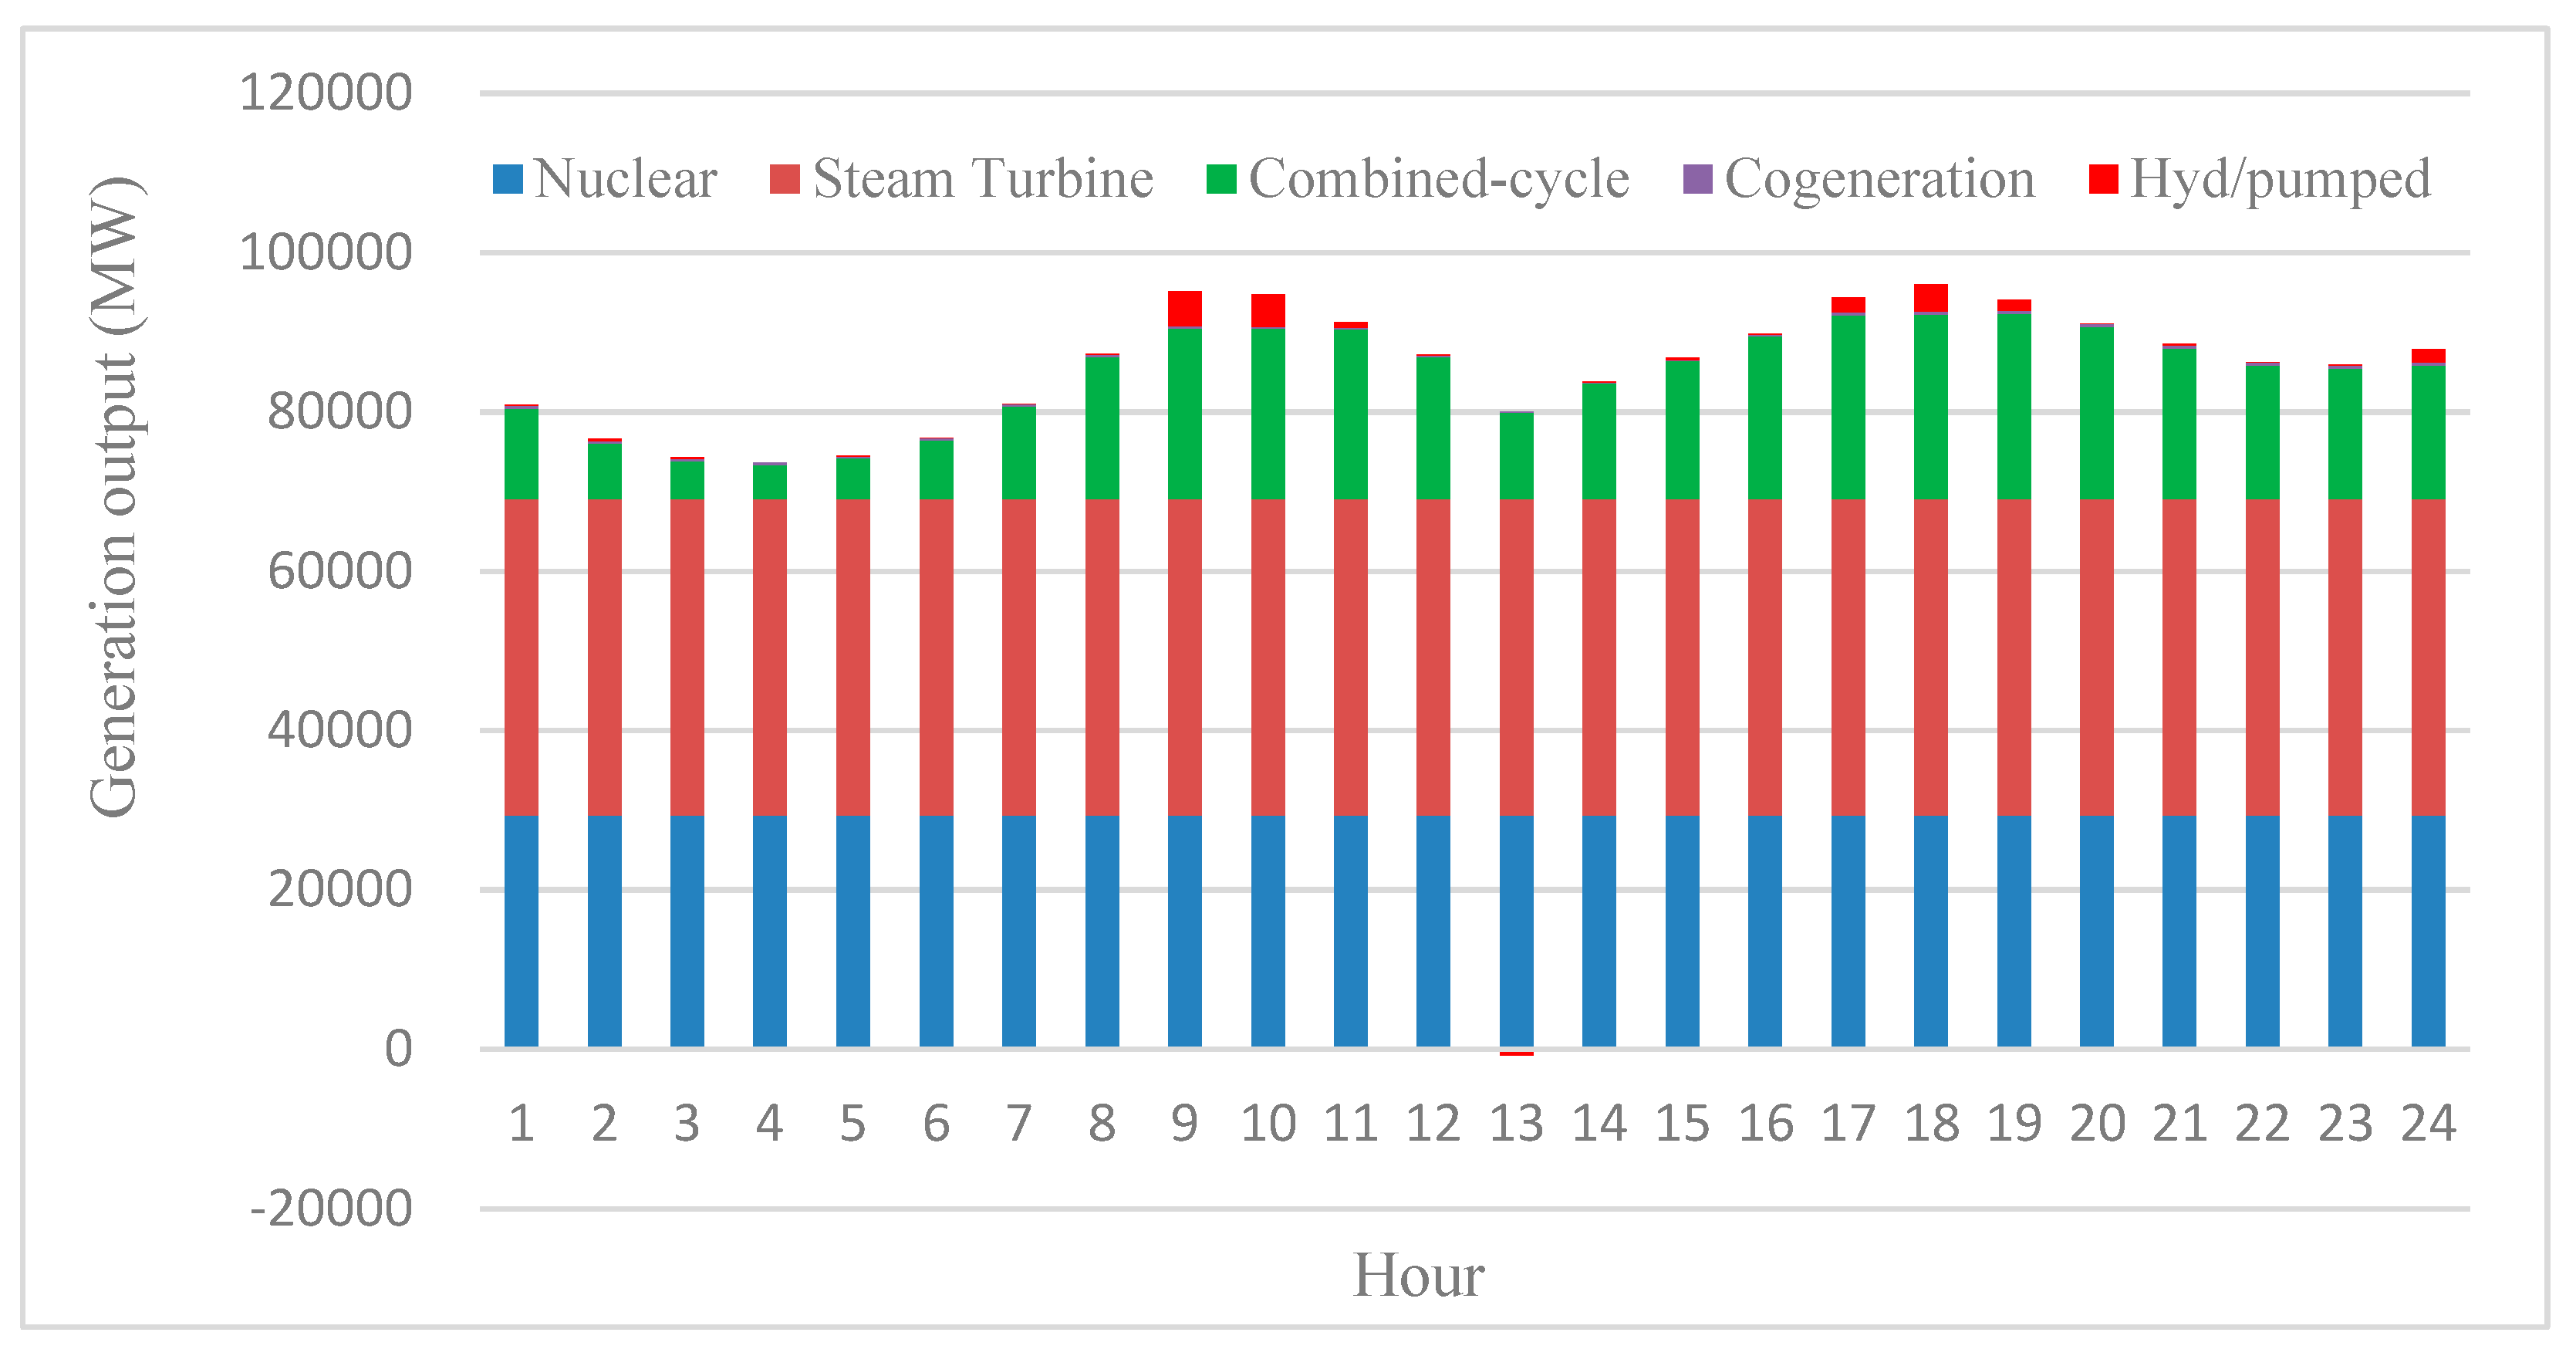
Figure 6.
Ramping capability shortage expectation (RSE) versus penetration level.

Table 1.
Scenarios differing by penetration level and net transfer capacity (NTC).
| Scenario # | Penetration Level, % | NTC, MW |
|---|---|---|
| S1 | High | Particular range |
| S2 | Medium | |
| S3 | Low |
Table 2.
Scenarios differing by penetration level and NTC range for a Korean power system.
| Scenario # | Penetration level, % | NTC, MW |
|---|---|---|
| S1 | High (64%) | 16,000 MW |
| S2 | 17,000 MW | |
| S3 | 18,000 MW | |
| S4 | 19,000 MW | |
| S5 | 20,000 MW | |
| S6 | Medium (54%) | 16,000 MW |
| S7 | 17,000 MW | |
| S8 | 18,000 MW | |
| S9 | 19,000 MW | |
| S10 | 20,000 MW | |
| S11 | Low (44%) | 16,000 MW |
| S12 | 17,000 MW | |
| S13 | 18,000 MW | |
| S14 | 19,000 MW | |
| S15 | 20,000 MW |
Table 3.
RSE results for specific scenarios. (N/A, not applicable).
| Low (44%) | Medium (54%) | High (64%) | |
|---|---|---|---|
| 20,000 MW | 11.2068 | 11.4006 | N/A |
| 19,000 MW | 11.2096 | 11.4041 | 11.4512 |
| 18,000 MW | 11.2102 | 11.4038 | 11.4512 |
| 17,000 MW | 11.2122 | 11.4068 | 11.5149 |
| 16,000 MW | N/A | 11.4095 | N/A |
Table 4.
Congestion mitigation degree (CMD) results for specific scenarios. (N/A, not applicable).
| Low (4%) | Medium (54%) | High (64%) | |
|---|---|---|---|
| 20,000 MW | 0.197 | 0.0032 | N/A |
| 19,000 MW | 0.1942 | −0.0003 | −0.0474 |
| 18,000 MW | 0.1936 | 0 | −0.0474 |
| 17,000 MW | 0.1916 | −0.003 | −0.1111 |
| 16,000 MW | N/A | −0.0057 | N/A |
© 2020 by the author. Licensee MDPI, Basel, Switzerland. This article is an open access article distributed under the terms and conditions of the Creative Commons Attribution (CC BY) license (http://creativecommons.org/licenses/by/4.0/).
Share and Cite
MDPI and ACS Style
Min, C. Impact Analysis of Transmission Congestion on Power System Flexibility in Korea. Energies 2020, 13, 2191. https://doi.org/10.3390/en13092191
AMA Style
Min C. Impact Analysis of Transmission Congestion on Power System Flexibility in Korea. Energies. 2020; 13(9):2191. https://doi.org/10.3390/en13092191
Chicago/Turabian StyleMin, Changgi. 2020. "Impact Analysis of Transmission Congestion on Power System Flexibility in Korea" Energies 13, no. 9: 2191. https://doi.org/10.3390/en13092191
Note that from the first issue of 2016, this journal uses article numbers instead of page numbers. See further details here.