Abstract
Rooftop gardens ona building have proved to be a good way to improve its storm water management, but many other benefits can be obtained from the installation of these systems, such as reduction of energy consumption, decrease of the heat stress, abatement on CO2 emissions, etc. In this paper, the effect from the presence of these rooftop gardens on abuilding’s energy consumption has been investigated by experimental campaigns using a green roof ona public building in a Mediterranean location in Spain. The obtained results demonstrate a substantial improvement by the installation of the green roof onthe building’s cooling energy demand for a standard summer day, in the order of 30%, and a reduction, about 15%, in the heating energy demand for a winter day. Thus, given the longer duration of the summer conditions along the year, a noticeable reduction on energy demand could be obtained. Simulation analysis, using commercial software TRNSYS code, previously calibrated using experimental data for typical summer and winter days, allows for the extrapolation to the entire year of these results deducing noticeable improvement in energy efficiency, in the order of 19%, but with an increase of 6% in the peak power during the winter period.
1. Introduction
The application of rooftop gardens onbuildings, or green roofs [1], which introduces a layer of vegetation, growing media and an additional drainage/auxiliary layers, has evidenced to improve storm water management [2,3], but this is not the only positive outcome resulting from these systems. They also produce positive impacts in many other aspects [4], such as reducing the heat island effect by decreasing the temperature in main city centers [5,6], ameliorating air pollution [7] and reducing energy consumption of buildings [8,9,10]. In relation to this last aspect, roofs are a critical part of the building envelopes, since they are highly susceptible to solar radiation and other environmental changes. Thereby, they have a significant influence on the indoor comfort conditions of the occupants. Roofs account for large amounts of heat gains and losses, especially onone-floor buildings with large roof area. In these cases, green roofs improve the performance of the building’s energy behavior by either decreasing the heat load during the winter period [11] or the cooling requirements during summer time [12]. Green roofs also reduce the temperature fluctuation of the roof membrane along the year [13] and, consequently, increase the efficiency of photovoltaic (PV) systems installed on the roof [14]. In summary, a green roof is a good alternative to improve sustainability in urban areas by reducing energy consumption, heat stress, air pollution and CO2 emissions.
All these possibilities, and the fact that thermal behavior of a building and thus, the impact of green roof installation on the building energy consumption is not an easy subject, explain the important effort developed during the last decade for research on these systems, both from the theoretical simulation and the experimental point of view [15].Thermal conductivity of employed materials is an important factor, but other factors, such as internal loads (lights, computers, people etc.) or roof reflectance to solar radiation, can play a very important role, especially in the summer period. Therefore, the contribution of the green roof to the improvement of the energy efficiency in the building will be highly dependent on local conditions and studies should be addressed to model and experimentally quantify that contribution for different climate areas. Thusfar, published works have focusedon cold [11,16] and hot climates [12,17] applications. In this last case, special emphasis has been given to the Mediterranean area [18]. Other research studies in the area indicate the benefits of integrating green roofs onbuildings, contributing to reduce a building’s energy use while mitigating greenhouse gases (GHG) in urban areas [19,20,21].
This paper summarizes a long-term study using a green roof designed, built and installed ona public building located in the Mediterranean coast of Spain. The main emphasis of the study was to deduce its impact on the energy consumption of the building’s air conditioning system by monitoring key energy and environmental variables, covering winter and summer periods. This approach allows evaluating the energy consumption of the building and address a complete comparison for similar periods before and after the installation of the green roof. Simulation studies using commercial software TRNSYS 17 allow for the extrapolation of the results to the entire year. Obtained results are representative for buildings in theMediterranean climate area. Section 2 introduces the experimental setup used for this study, while the main experimental results are presented in Section 3. Section 4 includes an extrapolation of these experimental results to the entire year period using commercial software TRNSYS 17.
2. Experimental Setup
A green roof was installed ona building located on Benaguasil, a small town in the Mediterranean coast of Spain. As a reference, aclimograph of Valencia was included, which is the nearest city (at a distance of about 18 km and with similar altitude) with available weather data (Valencia weather station of Viveros). In Valencia, the average annual temperature is 23.0 °C during the day and 13.8 °C at night. In January (the coldest month), the temperature typically ranges from 14 °C to 20 °C during the day and 4 °C to 12 °C at night. In August (the warmest month), the average temperature registered over the last 80 years in Valencia was around 25 °C (Figure 1). Furthermore, specific temperature data of the Benaguasil area ranged from 28 °C to 34 °C during the day and about 22 °C at night.
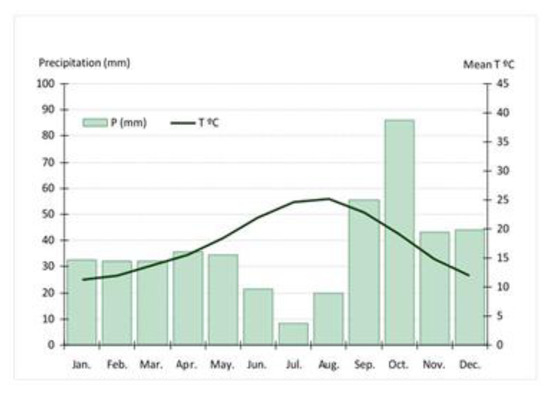
Figure 1.
Climograph of the 1938–2018 period for Valencia city (Viveros).
Building Description
The building is a multipurpose social center with 1160 m2 anda single floor, located in the southeast of the town (Figure 2). Since it was initially designed as a day care center for senior citizens, the building has some common spaces and facilities such as a dining room, dressing rooms, kitchen etc.
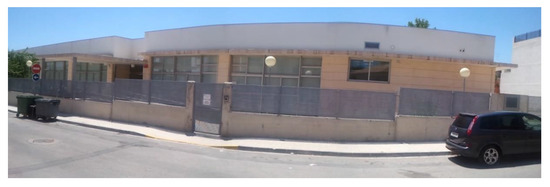
Figure 2.
Building main facade (north).
The building has a flat roof with an “inverted roof” typology, characterized by having the thermal insulation (extruded polystyrene, XPS) over the waterproofing membrane, and over this thermal insulation liesa geotextile filter and a layer of gravels.
In our case, the detailed structure (Figure 3) incorporates the following elements: gravel layer (gravel diameter in the range of 20 to 50 mm and 1700 kg/m3 bulk density, 50 mm of layer thickness), geotextile filter layer (2 mm), extruded polystyrene (XPS) insulation (40 mm), waterproofing membrane (5 mm) and concrete hollow block (300 mm).
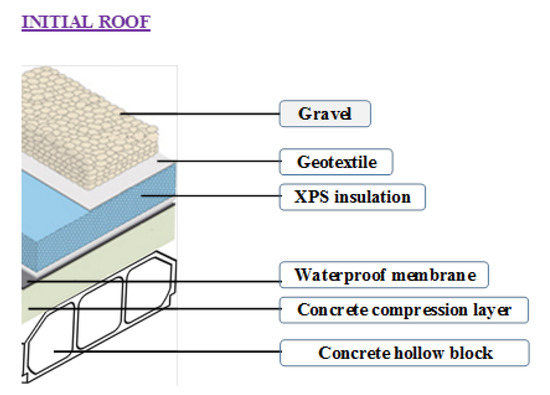
Figure 3.
Initial roof structure.
The green roof was built over the present “inverted roof”. It was decided to remove the layer of gravel and a water retention layer was added below the growing medium (separated with a filter fabric layer). This storage layer increases the capacity of the roof for retaining water after a rain episode and significantly reduces the amount of runoff generated. Figure 4 displays the green roof structure, which includes the following layers: growth medium (80 mm thickness), permeable textile layer (2 mm), drainage layer (water storage layer, 30 mm), geotextile layer/root barrier layer (3 mm), XPS insulation (40 mm), waterproofing membrane (5 mm) and a concrete hollow block (300 mm).
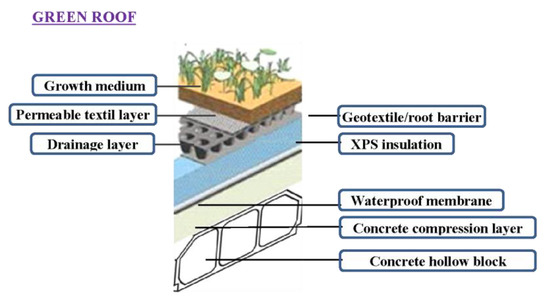
Figure 4.
Green roof structure.
The growth medium is a mixture of conventional gardening organic substrate (40%), volcanic lava rocks (40%) and silica sand (20%). In the upper part of the green roof, there are plants covering almost the entire area with a height in the range of 50 to 150 mm. These plants are genus sedum (a mixture of sedum album AH, sedum floriferum, sedum sediform, sedum reflexum, sedum spurium, sedum moranense and sedum acre).
Figure 5 displays the plan view of the building, denoting the roof area where the green roof was installed by the dotted line. The building area under controlled conditions with green and conventional rooftop was 280 m2. Figure 6 shows the green roof already installed.
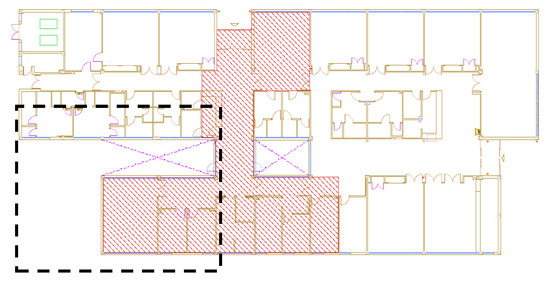
Figure 5.
General view of building roof (dotted line indicating green roof affected area).
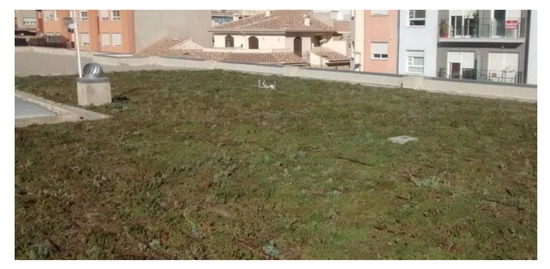
Figure 6.
General view of greenroof.
The monitoring system used for these experiments is presented in Figure 7.
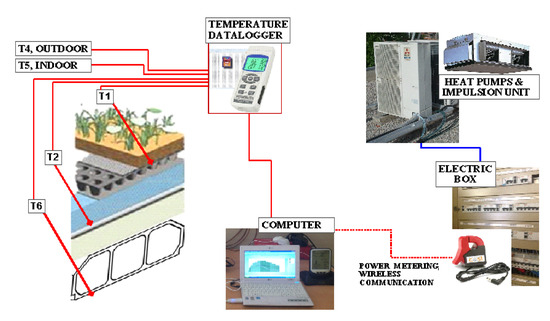
Figure 7.
Monitoring system scheme.
A set of six type T thermocouples, whose positions and missions are detailed in Table 1, enables to determine the evolution of the temperature at different layers of the roof. These temperature measurements allow identifying similar ambient temperature conditions in the registered data sets and provide the data required for the simulation tools.

Table 1.
Thermocouple positions.
Specifications of the thermocouple sensors were: Probe PT100 RS PRO M16, PT100, +100 to +450 °C, diameter 6 mm, Connection head, Class B 4 Stainless Steel.
All these thermocouple signals were stored every minute in a data logger, together with the electricity consumption of the two heat pumps and the impulsion unit of the air conditioning system of the area covered by the green roof. In addition, wind velocities and solar radiation were provided by a nearby meteorological station.
The area affected by the green roof is about 1/4 of the total building surface and it has an independent air conditioning system. There are two heat pumps (Mitsubishi Electric PEA-RP250GA, with an input power of 8.455 kW each). Additionally, there is a common air impulsion unit of 3.05 kW of input power. Thus, maximum total input power, for both cooling and heating models, is about 19.96 kW.
This monitored building area is about 280 m2 and it was closed during the testing periods to guarantee the control on internal loads and other factors that could affect the energy consumption. In this way, the test conditions are the same along the experimental campaigns with the conventional and the green roof. Only the external variables (temperature, solar radiation, wind etc.), which are experimentally monitored, change. These campaigns cover different indoor comfort temperatures, in arange from 22 °C to 28 °C.
3. Experimental Results
The experimental campaigns check the green roof effects on the building energy efficiency during 20 months (July 2017 to March 2019). During the first period, from July 2017 to February 2018, measurements correspond to the “conventional” roof. In February 2018, the external gravel layer of the conventional roof was replaced by the green roof. Thus, from March 2018 to March 2019, registered data corresponded to the green roof effects. Figure 8 displays typical traces for the temperatures and solar radiation obtained for the conventional and green roof campaigns, respectively, along an entire week during the summer period.
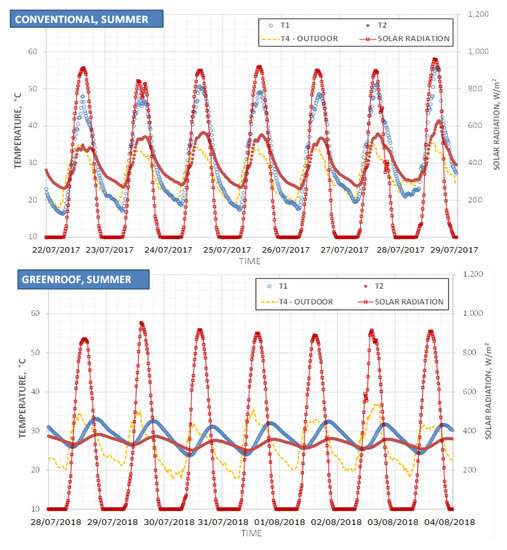
Figure 8.
Typical traces for different temperatures and solar radiation in summer period.
The obtained results in both situations are summarized in Table 2, where the consumption from the air conditioning system (peak demand, energy consumption range during the entire campaign and its average daily range) and the external roof temperature are detailed for both types of roofs. Because the operation time of the offices located in the building was restricted to the morning hours, the operating time of the Heating, Ventilating and Air Conditioning (HVAC) system was only from 8:00 to 15:00, thus, the time span for comparison purposes was fixed for the period 9:00–13:00.
Table 2.
Energy demand for conventional and green roof.
We can deduct from these measurements that, during summer time, energy consumption was higher in the conventional roof in comparison to the winter one. However, energy consumption during winter is lower in the conventional roof. This behavior could be partly explained due to the presence of gravel in external layer of the roof, which acts as a heat storage system with high temperature. This fact introduces an additional load to be compensated by the air conditioning system during the summer. Given that the summer period is much longer than the winter one in the Mediterranean area, any effort to increase energy efficiency of the building should be concentrated onthe summer months.
Once the green roof is installed, the differences in energy consumption between the summer and winter periods reduced significantly to less than 15%, higher for the winter period in this case, whichcould be explained by the absence of the gravel layer as aheat source. This interpretation is supported by the data presented in Figure 9 and Figure 10, where the evolution of the temperature along a similar day during the summer and winter periods, respectively, is presented for the conventional and green roof situations. Similar days were selected in terms of similar ambient outdoor temperature, humidity and solar radiation. During the summer, ambient outdoor temperature was 35 °C and the gravel reaches 50 °C, while with the presence of the green roof, this effect is smoothed and the temperature in the roof does not exceed the ambient outdoor temperature; in fact, it is below that value, namely, 32 °C.
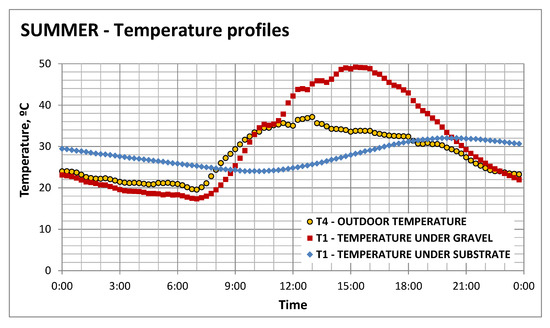
Figure 9.
Temperature evolution for a typical summer day with and w/o green roof.
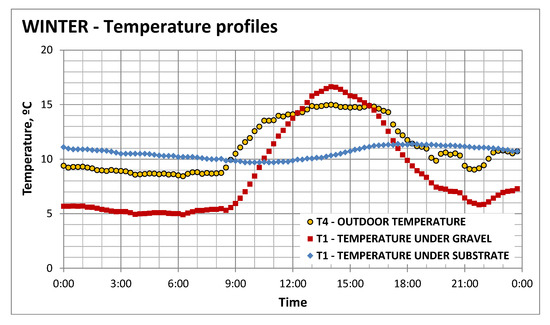
Figure 10.
Temperatureevolution for a typical winter day with and w/o green roof.
Similar behaviorwasobtained for the winter period, as data plotted in Figure 10 shows. In this case, the smoothing of the temperature fluctuation due to the green roof reduces the heat input to the building and forces to higher energy consumption for the same level of indoor comfort.
Analysis of the data presented at Table 2 enables to evaluate the impact of the green roof on the energy requirements of the building. It can be deduced that in the winter period there is an increase for the total daily energy consumption and the requirement in electric power to be used by an order of 15%. This fact can be explained by the increase in the roof external layer temperature produced by the solar radiation, which is 50% higher in the case of the conventional roof than with the green roof due to the isolation produced by the former one. This heat source helps to heat up the building, reducing the energy requirements in winter, while this is not available when the green roof is installed. On the contrary, during the summer period, the energy saving increases up to 30%, with a reduction of the required peak power of about 15%. Given the higher percentage of savings and the longer duration of the summer period, it can be concluded that the global energy savings for the entire year is going to be highlysignificant. Table 3 summarizes the percentages in energy requirement variation due to installing the green roof for the winter and summer periods.
Table 3.
Energy and power demand variation due to the green roof presence.
Data comparingtwo similar days during summer time with both types of roofs areshown in Figure 11. An initial peak power was observed to start building conditioning, as is the case for the conventional roof; once a stable situation is reached, however, the power demand with the green roof is 20% less than with the conventional one.
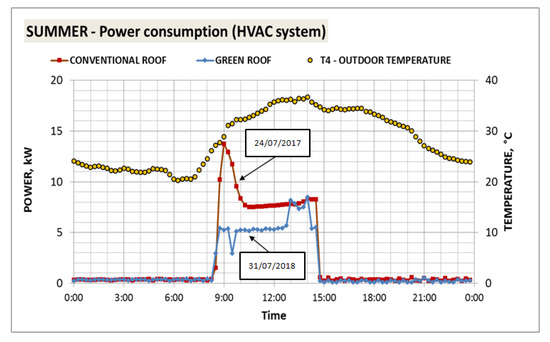
Figure 11.
Comparison of similar days with and without a green roof in the summer period.
A similar comparison is presented in Figure 12 for two similar days in the winter period. Power demand is very similar for both types of roof, but slightly lower in the case of the conventional one.
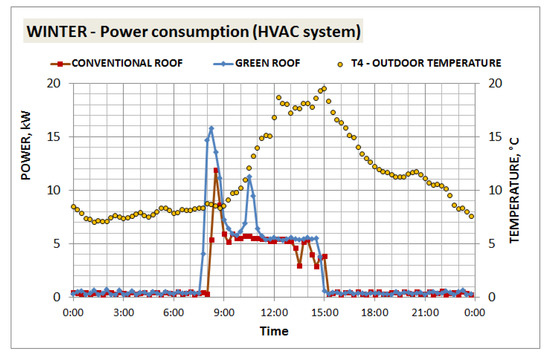
Figure 12.
Comparison of similar days with and without a green roof in the winter period.
Obtained experimental results are comparable with other experimental studies conducted in Mediterranean climate conditions [22], in which a 15% to 17% lower energy consumption was observed during warm periods, whilehigher energy consumption (10% to 12%) was observed during cold times.
4. Simulation Results
In order to evaluate the benefits of the green roof for a longer period of time, commercial software TRNSYS 17 was used as theenergy simulation tool of the experimental setup. During the simulation, conventional and green roof were modeled based on their constructive characteristics and energy relationships. TRNSYS model was defined with 6 layers with different thickness: gravel or green roof (0.07 m), polystyrene insulation (0.05 m), membrane (0.001 m), concrete (0.075 m), building slab (0.17 m) and air chamber (0.5 m). The estimated U-value for the traditional roof was considered 0.518 W/m2·°K, while for the green roof, estimation was 0.409 W/m2·°K.Solar absorption of the roof was modelled with 0.8 for the gravel and 0.2 for the green roof.
Figure 13 shows the input data for the simulation, external conditions, building characteristics and temperature set points, and the deduced outputs, temperatures in the different layers of the roof and cooling and heating demand along the year.
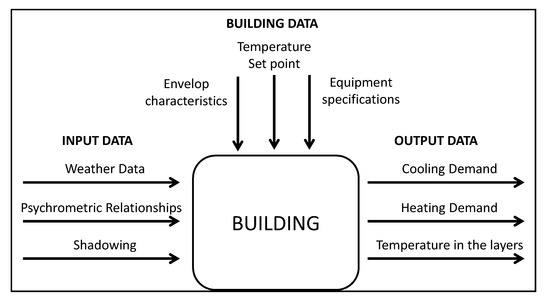
Figure 13.
Parameters of TRNSYS Model.
Initially, rooftop models developed in TRNSYS were validated using collected experimental data. Validation was carried out in two stages, using a down-top approach: first, it was checked that modelled temperatures were similar to the experimentally measured at the rooftop layers along a week period. Then, the model was calibrated using the data from experimental daily profiles in the summer period.
In the case of the week validation, temperatures of the different layers of the roof were determined with the model and results (Figure 14) were compared with the corresponding experimental data. Maximum simulated temperatures of 59 °C were obtained during summertime in the gravel, while registered data during the same time period revealed a temperature range of 45 °C to 55 °C.
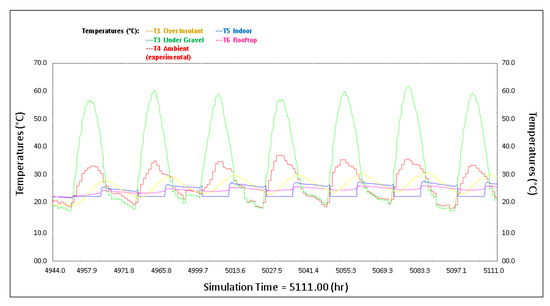
Figure 14.
Simulated temperatures of the initial rooftop.
One-day validation was performed using as a reference two similar days in terms of environmental parameters (temperature, humidity etc.) and use-of-space (workday) during the experimental campaign, one for each of the two different types of roof considered, on 24th July 2017 (conventional roof) and 31st July 2018 (green roof), in order to deduce the parameters used in the simulation. Comparison of the simulation results, detailed in Figure 15, with the experimental data plotted in Figure 11, shows a good enough agreement, thus, the simulation for the entire year could be addressed using these parameters. In order to complete the simulation task, a selected time window during the day with stable conditions was identified. This time span was from 11:00 to 13:00. During this time span, TRNSYS simulations were addressed considering a set-point of 22 °C in heating demand (October to March) and 26 °C for cooling needs (April to September).
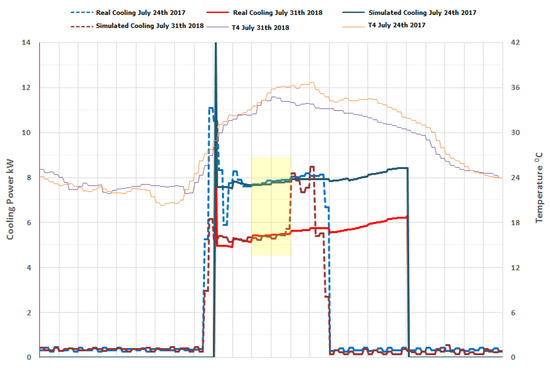
Figure 15.
One-day validation of the models for conventional and green roof.
Figure 16 shows temperature evolution in the building outdoors (T4) and indoors (T5), as well as the temperature below the growth medium (T1). As can be observed, top roof temperatures decreased both in summer (40 °C to 35 °C) and winter (10 °C to 5 °C), which requires to compare the benefits for cooling in summer versus the negative effects in heating during winter period.
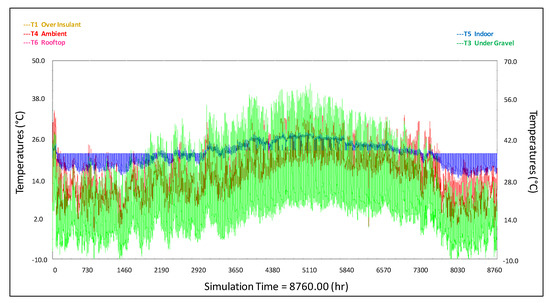
Figure 16.
Results for temperatures evolution along the year.
Recorded data for cooling energy demand in both scenarios (conventional and green roof) showed an energy savings of approximately 25% in cooling energy demand, decreasing the maximum peak power demand by 33%. Heating energy demand in both scenarios (conventional and green roof) is presented in Figure 17. In this case, the results show that energy heating demand increased12% in the green roof scenario. Moreover, the maximum energy peak due to heating also rose6% with the green roof in comparison to the conventional rooftop, due to the reduction of solar heat gain reaching the building.
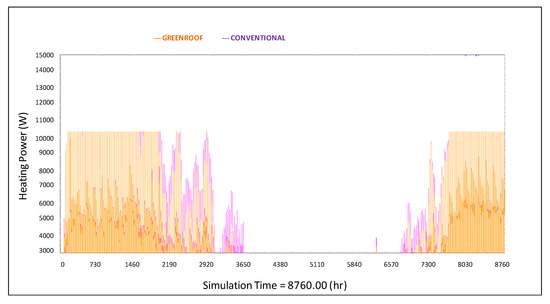
Figure 17.
Results of the heating demand in both rooftops.
As a summary, results of the simulation are presented in Table 4 and Table 5, which show total energy consumption, saving in cooling and heating mode and the average power saved along the operation time.
Table 4.
Annual energy consumption for the conventional and green roof.
Table 5.
Simulation results in energy savings (green roof vs. conventional rooftop).
These results are compatible with the experimental values detailed at Table 2, which indicate a net gain in energy saving for the entire year, in the order of 19%. In contrast, an energy demand increase of 6% is noted, due to the requirement for additional heating in the winter period.
5. Conclusions
Consecutive experimental campaigns in a building with a conventional and with a green roof have allowed deducing the impact on the energy efficiency of the building air conditioning system due to green roof installation. In its application to a typical Mediterranean one-story building, insulation effects coming from the presence of the green roof introduced a small deterioration in that energy efficiency for the winter period, but showed clear improvements for the summer one. The global effect along the entire year is a net gain in the order of 19% for the energy consumption, but a 6% increase for the nominal power in the winter period. These results werededuced using a TRNSYS calculation, previously calibrated with the experimental data obtained for summer and winter periods. Therefore, in addition to the beneficial effects on the storm water control by reducing runoff and improving water quality, green roofs are also a significant element to improve energy efficiency in buildings and could help to mitigate urban heat island effect, while increasing urban biodiversity.
Author Contributions
J.C.-C. and E.P.-L. developed the methodology; J.C.-C., E.P.-L. and I.V.-S. prepared the conceptualization and data curation; E.H.-P., D.A.-S., J.C.-C. and E.P.-L. gathered and analyzed the data. J.C.-C. and E.P.-L. wrote the paper. All authors have read and agreed to the published version of the manuscript.
Funding
This work was supported by the European Union’s Horizon 2020 research and innovation programme under the project Green Cities for Climate and Water Resilience, Sustainable Economic Growth, Healthy Citizens and Environments with reference 730283.
Conflicts of Interest
The authors declare no conflict of interest.
References
- Jim, C.Y. Green roof evolution through exemplars: Germinal prototypes to modern variants. Sustain. Cities Soc. 2017, 35, 69–82. [Google Scholar] [CrossRef]
- Dos Santos, S.M.; Silva, J.F.F.; dos Santos, G.C.; de Macedo, P.M.T.; Gavazza, S. Integrating conventional and green roofs for mitigating thermal discomfort and water scarcity in urban areas. J. Clean. Prod. 2019, 219, 639–648. [Google Scholar] [CrossRef]
- Ferrans, P.; Rey, C.V.; Pérez, G.; Rodríguez, J.P.; Díaz-Granados, M. Effect of green roof configuration and hydrological variables on runoff water quantity and quality. Water 2018, 10, 960. [Google Scholar] [CrossRef]
- Gómez, F.; Valcuende, M.; Matzarakis, A.; Cárcel-Carrasco, J. Design of natural elements in open spaces of cities with a Mediterranean climate, conditions for comfort and urban ecology. Environ. Sci. Pollut. Res. 2018, 25, 26643–26652. [Google Scholar] [CrossRef] [PubMed]
- Chen, X.; Shuai, C.; Chen, Z.; Zhang, Y. What are the root causes hindering the implementation of green roofs in urban China? Sci. Total Environ. 2019, 654, 742–750. [Google Scholar] [CrossRef] [PubMed]
- Radhi, H.; Sharples, S.; Taleb, H.; Fahmy, M. Will cool roofs improve the thermal performance of our built environment? A study assessing roof systems in Bahrain. Energy Build. 2017, 135, 324–337. [Google Scholar] [CrossRef]
- Baik, J.J.; Kwak, K.H.; Park, S.B.; Ryu, Y.H. Effects of building roof greening on air quality in street canyons. Atmospheric Environ. 2012, 61, 48–55. [Google Scholar] [CrossRef]
- Shafique, M.; Kim, R.; Rafiq, M. Green roof benefits, opportunities and challenges–A review. Renew. Sustain. Energy Rev. 2018, 90, 757–773. [Google Scholar] [CrossRef]
- Goussous, J.; Siam, H.; Alzoubi, H. Prospects of green roof technology for energy and thermal benefits in buildings: Case of Jordan. Sustain. Cities Soc. 2015, 14, 425–440. [Google Scholar] [CrossRef]
- Yang, W.; Wang, Z.; Cui, J.; Zhu, Z.; Zhao, X. Comparative study of the thermal performance of the novel green (planting) roofs against other existing roofs. Sustain. Cities Soc. 2015, 16, 1–12. [Google Scholar] [CrossRef]
- Foustalieraki, M.; Assimakopoulos, M.N.; Santamouris, M.; Pangalou, H. Energy performance of a medium scale green roof system installed on a commercial building using numerical and experimental data recorded during the cold period of the year. Energy Build. 2017, 135, 33–38. [Google Scholar] [CrossRef]
- Santamouris, M.; Pavlou, C.; Doukas, P.; Mihalakakou, G.; Synnefa, A.; Hatzibiros, A.; Patargias, P. Investigating and analysing the energy and environmental performance of an experimental green roof system installed in a nursery school building in Athens, Greece. Energy 2007, 32, 1781–1788. [Google Scholar] [CrossRef]
- Zhao, X.; Zuo, J.; Wu, G.; Huang, C. A bibliometric review of green building research 2000–2016. Archit. Sci. Rev. 2019, 62, 74–88. [Google Scholar] [CrossRef]
- Lee, E.J. A Study on Correlation between Improvement in Efficiency of PV and Green roof of Public Building. KIEAE J. 2013, 13, 111–118. [Google Scholar]
- Feng, C.; Meng, Q.; Zhang, Y. Theoretical and experimental analysis of the energy balance of extensive green roofs. Energy Build. 2010, 42, 959–965. [Google Scholar] [CrossRef]
- Tang, X.; Qu, M. Phase change and thermal performance analysis for green roofs in cold climates. Energy Build. 2016, 121, 165–175. [Google Scholar] [CrossRef]
- Jim, C.Y.; Tsang, S.W. Ecological energetics of tropical intensive green roof. Energy Build. 2011, 43, 2696–2704. [Google Scholar] [CrossRef]
- Bevilacqua, P.; Mazzeo, D.; Bruno, R.; Arcuri, N. Experimental investigation of the thermal performances of an extensive green roof in the Mediterranean area. Energy Build. 2016, 122, 63–79. [Google Scholar] [CrossRef]
- Susca, T. Green roofs to reduce building energy use? A review on key structural factors of green roofs and their effects on urban climate. Build. Environ. 2019, 162, 106273. [Google Scholar] [CrossRef]
- Ávila-Hernández, A.; Simá, E.; Xamán, J.; Hernández-Pérez, I.; Téllez-Velázquez, E.; Chagolla-Aranda, M.A. Test box experiment and simulations of a green-roof: Thermal and energy performance of a residential building standard for Mexico. Energy Build. 2020, 209, 109709. [Google Scholar] [CrossRef]
- Tian, Z.; Lei, Y.; Gu, X. Building Energy Impacts of Simple Green Roofs in the Hot Summer and Cold Winter Climate Zone: Suzhou as a Study Case. Procedia Eng. 2017, 205, 2918–2924. [Google Scholar] [CrossRef]
- Coma, J.; Pérez, G.; Solé, C.; Castell, A.; Cabeza, L.F. Thermal assessment of extensive green roofs as passive tool for energy savings in buildings. Renew. Energy 2016, 85, 1106–1115. [Google Scholar] [CrossRef]
© 2020 by the authors. Licensee MDPI, Basel, Switzerland. This article is an open access article distributed under the terms and conditions of the Creative Commons Attribution (CC BY) license (http://creativecommons.org/licenses/by/4.0/).