Article

On the Implementation of the Nearly Zero Energy Building Concept for Jointly Acting Renewables Self-Consumers in Mediterranean Climate Conditions

by
Faidra Kotarela
1,
Anastasios Kyritsis
2 and
Nick Papanikolaou
1,*
1
Department of Electrical & Computer Engineering, Democritus University of Thrace, 67100 Xanthi, Greece
2
Photovoltaic Systems and Distributed Generation Department, Centre for Renewable Energy Sources and Saving, 19009 Athens, Greece
*
Author to whom correspondence should be addressed.
Energies 2020, 13(5), 1032; https://doi.org/10.3390/en13051032
Submission received: 4 February 2020 / Revised: 21 February 2020 / Accepted: 23 February 2020 / Published: 25 February 2020

Abstract

:
Cost-effective energy saving in the building sector is a high priority in Europe; The European Union has set ambitious targets for buildings’ energy performance in order to convert old energy-intensive ones into nearly zero energy buildings (nZEBs). This study focuses on the implementation of a collective self-consumption nZEB concept in Mediterranean climate conditions, considering a typical multi-family building (or apartment block) in the urban environment. The aggregated use of PVs, geothermal and energy storage systems allow the self-production and self-consumption of energy, in a way that the independence from fossil fuels and the reliability of the electricity grid are enhanced. The proposed nZEB implementation scheme will be analyzed from techno-economical perspective, presenting detailed calculations regarding the components dimensioning and costs-giving emphasis on life cycle cost analysis (LCCA) indexes—as well as the energy transactions between the building and the electricity grid. The main outcomes of this work are that the proposed nZEB implementation is a sustainable solution for the Mediterranean area, whereas the incorporation of electrical energy storage units—though beneficial for the reliability of the grid—calls for the implementation of positive policies regarding the reduction of their payback period.

1. Introduction

Buildings in EU countries account for approximately 40% of the total primary energy consumption and 36% of greenhouse emissions [1]. EU climate change objectives for 2020, such as a 20% increase of RES in gross final consumption of energy, 20% reduction of buildings primary energy consumption and 20% reduction of greenhouse gas emissions compared to 1990 levels are key issues nowadays, whereas new more ambitious targets were set in 2030 climate and energy framework [2].
In this context, the concept of highly efficient buildings has been perceived. Specifically, the term “nearly Zero Energy Building” (nZEB) has been introduced, referring to a building of high energy performance which takes advantage of various types of RES in order to service a significant number of its total annual energy needs [3,4]. The nearly zero or very low amount of energy required can be produced in site (under the net metering scheme) or in the near area (under the virtual net metering scheme). Therefore, nZEBs are interconnected to the electricity distribution networks, using them as a backup system for their power balance. Analytically, the excess electricity that is injected into the grid (during low building energy consumption intervals) can be used during low energy production intervals. It is worth noting that the majority of residential buildings under the net metering scheme receive almost 70% of the energy required to maintain power balance from the grid, in real time. Indeed, by studying self-consumption ratio of southern European residential buildings (buildings with PV installations under the net metering scheme) it is concluded that the mean self-consumption ratio of such buildings ranges between 30 and 35%. Hence, nearly zero or very low energy consumption should be studied in regard to energy transactions with the electricity networks [5]. Considering the energy consumption and production (where applicable) profiles of residential buildings, it is generally accepted that demand side management techniques and energy storage systems installation seem to be the most suitable smart-grid services in such applications. As far as demand side management is concerned, demand and response techniques could provide flexibility on electrical system operation either by reducing residential consumers’ electricity consumption during electrical load peak periods, or by motivating buildings owners to modify their electrical consumption profile according to RES availability [6,7,8,9]. Demand side management may be more efficient when implemented at the level of final consumers’ aggregators, which have direct control on air conditioning, heat pump units and water heaters during periods of peak demand or peak RES production. Building owners which provide demand side management services could be remunerated either for their demand and response availability (following contracted time-based rates and critical peak rebates) or for the procurement of the service (following variable peak pricing or real-time pricing and time-of-use pricing).
Additionally, it is worth mentioning that unlike detached houses where the installation of small RES systems (mainly PVs) is usually simple, in the case of apartment buildings the installation of many small and independent PV systems is less efficient and calls for a much more complicated design. Today, however, the implementation of nZEB concept in apartment buildings is facilitated by the scheme of energy communities [10,11]. The aggregated use of RES from a group of self-producers who are located in the same building or multi-apartment block allows the production of clean energy at the level of a whole building and not an individual property.
nZEBs consist of low thermal transmittance building materials with high energy standards and technical specifications, in order to increase the insulation levels of building envelope (walls, roof, floor and windows), achieving so significant reduction on thermal losses. Furthermore, highly efficient electromechanical installations for heating and cooling are employed in conjunction with bioclimatic architecture rules and passive solar design techniques for natural cooling and ventilation. Energy consumption defines the energy classification of each building to specific grades (i.e., A, B, C, D, E, F or G). For the development and widespread of nZEB concept, EU Commission has published the Directive 2010/31/EU which regards the residential and tertiary sectors (offices, public buildings etc.). As for the targets determined for new buildings, this Directive imposes all new buildings to become nZEBs by 31 December 2020, whereas the deadline for new buildings occupied and owned by public authorities was 31 December 2018. Additionally, the European Directive states that the upgrade of buildings energy performances should be pursued to the extent that this is technically, economically and functionally feasible.
The main issues raised by nZEB concept are the achievement of nearly zero energy transactions with the public grid on annual basis (and the certification of this condition), the type of energy used, the accepted renewable energy supply options and requirements in terms of energy efficiency, the indoor/outdoor climate conditions and the connection with the electricity grid [12]. State-of-the-art strategies for nZEB technologies are synopsized in three main categories: passive energy-saving technologies, energy-efficient building service systems and RES integration technologies. The implementation of these interventions is reviewed in [13]. Renovating constructions are a part of the building conversion into a nZEB, especially in old buildings, in order to attain high energy efficiency. In [14] it is demonstrated that deep energy renovation of existing buildings (especially if it is combined with the overall energy improvement of the building which also involves non-energy related aspects) is one of the major opportunities to reduce energy consumption and to improve internal comfort conditions for the residents. In a case study referred in Mediterranean climate conditions it is mentioned that nZEB mainly depends on a synthesis of existing technologies and know-how of consolidated or traditional building principles [15]. Reference [16] provides a brief overview of existing nZEBs in Mediterranean countries, by noting the main characteristics for microclimatic design and energy conversion from RES systems. The main part of [16] focuses on an existing single-family nZEB, which is equipped with various energy conversion systems from RES, such as solar thermal collectors, PVs and GHEs, aerothermal and multi-split systems as well. EESUs and thermal storage for DHW tank were also considered.
Many scientific papers perform the energy consumption analysis of the building sector. In [17] the energy consumption, the technical and the environmental characteristics of residential buildings in Mediterranean are presented, as well as their potential for energy saving, based on their actual energy consumption profiles. The technical characteristics of residential buildings related to their energy performance (thermal insulation, envelope specifications, heating and cooling energy system, etc.), the actual energy use and the environmental factors related to energy consumption, are also described. The authors of [18] have proposed a new methodology called BEA, in order to examine the energy classification of buildings; various aspects of BEA such as, heating/cooling and electrical load demand, energy consumption and CO2 emissions were analyzed. In [19] the energy savings of multi-family residential building thermal systems, such as hybrid biomass-solar ones, is examined. The required measurements conducted taking into consideration parameters such as energy consumption and CO2 emissions reduction. In view of developing energy-efficient structures, references [20,21] provide an overview of building design criteria that can reduce the thermal and cooling load demand of residential buildings. These criteria are based on buildings orientation, shape, envelope system, passive heating and cooling mechanisms, shading and glazing. These papers investigate the optimal sustainable and energy-efficient building design options. Energy efficiency measures and installation of RES technologies for buildings designed to become nZEBs are investigated in [22], with the use of quasi-dynamic simulation tools and models. In [23] the principles of integrated designed procedure and smart building technologies (along with energy efficiency methodologies and innovative techniques) are presented, highlighting that the integration of smart technologies requires a holistic approach that takes into account all aspects of sustainability from the early design phases of the building, in order to take full advantage of the benefits of the process and the opportunities that smart grids offer.
As for the installed RES technologies on buildings, there are many studies that propose various combinations of RES systems considering the nZEB concept. Some of them focus on the implementation of PVs and solar-thermal collectors as combined heat and power systems, in order to cover both electrical and thermal load demand [24,25]. In [26], a comparison among the installation of building-integrated PV/T air collectors and side-by-side PV modules and solar thermal collectors is presented, whilst in [27] a BIPV/T has been used as the roof top of a building in order to increase the electrical energy per unit area figure and to meet thermal demands. Additionally, ΒIPV systems are noted as an interesting approach for newly built and refurbished residences, because they operate as multifunctional building construction materials (they produce energy and serve as part of buildings envelope) [28,29,30,31,32]. BIPVs are usually used as glazing and windows for transparent openings; moreover, they can be used instead of ceramic tiles on the roofs of buildings. Furthermore, BAPV in the form of façade components can be used as curtain walls, or as shadings and balcony barriers. Both types of building PV products do not require the existence of free building surfaces or free land space for installation, compared to usual residential PV plants. In addition, from an architectural perspective, the ability to add color to PV cells (with the addition of suitable coatings) as well as to PV modules frames, reduces any optic nuisance, allowing the aesthetic integration of PV technology into the shell of buildings [29,30,31,32,33,34]. Additionally, lightweight fibre reinforced composite BIPV and BAPV modules are able to be curved (maintaining high mechanical strength) and thus various surface finishes are possible [28].
In [35] the optimal integration of a CHP to provide district-level cooling, heating, and electrical energy to a residential area and the potential for combination of the CHP with PV system has been investigated. In this context, authors in [36] presented an innovative technological concept for energy supply (electrical and thermal energy) consisting of CHP and WPP. This proposed combination is able to manage the energy demand in a small-scale area, like buildings. Finally, a combination of a solar thermal and a cogeneration system for district heating with seasonal energy storage installed on building-level is represented in [37].
In [38] a Swedish case study presents an analysis on how EAHPs and GSHPs in combination with PV-systems affect the specific energy demand of buildings, considering the nZEB concept. In more details, this energy production combination (enhanced with heat recovery ventilation) leads to decreased specific energy demand. A hybrid system installation in Bahrain that consists of PVs, a wind turbine and hydrogen fuel cells is analyzed in [39]. These building integrated RES are proved to be efficient as well as of a significant environmental impact.
Considering that nZEBs usually operate under the net metering scheme, their design principles are associated with the on-site production from RES and the self-consumption of locally generated clean electricity. Self-consumption can be enhanced by installing ESUs-sized for the amounts of produced energy. In [40] a PV system with two types of energy storage is analyzed, i.e., lead acid batteries and water heat tank storage, where a part of the electricity produced by the PVs is stored as heat. Comparing these two types of energy storage, the water heat tank is competitive to the ESS when it comes to the level of self-consumption. On the other hand, lead-acid battery life is too short in compared to battery investment cost, and therefore not considered to be profitable. Thus, more suitable battery technologies should be incorporated in the nZEB concept, such as Li-ion batteries which is the case in the present work. Another proposed energy system is presented in [41], using hybrid ESS including both batteries and electric water heaters in residential nZEBs, in order to store the PV energy production. The outcomes of this work highlight that the proposed hybrid PV ESS can mitigate the issue of high load variation that is raised at the utility side by the communities with high PV penetration levels. A thorough economic analysis for a residential building with the integration of PVs and battery ESSs is presented in [42]. This work considers various tariff structures of the electrical market, as well as various energy savings and CO2 emissions reduction scenarios. The reduction of CO2 emissions per kWh produced from GSHP systems is investigated in [43,44]. Moreover, Lo Russo et al. [45] consider a very low-enthalpy geothermal plant, using GWHPs, in order to evaluate the sustainability and the benefits of the concept under-study by means of greenhouse gasses reduction. Additionally, in [46] a survey on various cases regarding the sustainable design of buildings is presented, whereas the reduction of CO2 levels in national and global scale is discussed.
As for the installation of geothermal energy systems on buildings, there are many case studies that focus on the separate exploitation of this type of RES technology. References [47,48,49] present a comprehensive review on the geothermal energy exploitation in buildings, taking into consideration various restrictions that play a vital role in designing small- or large-scale systems, such as the length and diameter of the GHE tube, the space between the GHEs and their technical specifications. In addition, Niemelä et al. [50] present a method for efficient heating of DHW by using a GHP; the water is heated from the inlet temperature of cold water to the target DHW. This system balances the thermal/cooling load demands of multi-family apartment buildings. Moreover, a case study of a GHE, designed for extraction or injection of thermal energy from/into ground, has shown that the double U-tube boreholes are superior to the ones of the single U-tube with reduced borehole resistance [51].
In [52] an optimization model for a PV/ST and a GSHP system for office building is presented. This model focuses on the optimal sizing of the PV/ST and the geothermal system, under the restriction of limited available area and practical heating and cooling loads, without considering the sizing of ESUs. Referring to the thermal load of nZEBs, the work in [53] compares two types of thermal storage for a GHP system, i.e., exhaust air- and solar-thermal storage; the analysis has highlighted the outperformance of the exhaust air-thermal storage option. In addition, a smart renewable energy system is introduced in [54], consisting of solar PVs, an ASHP and an ESU, in order to prove the significant decrease of the energy consumption for buildings and the accompanied reduction on greenhouse emissions. A comparison between the proposed system and the traditional energy supply system (electricity grid and natural gas) is also represented in this paper, where the surplus energy can be either delivered to the electricity grid or to the ESU. The performance of hybrid solar thermal and geothermal energy systems is discussed in [55,56,57,58,59,60,61]. In these studies, energy is supplied to the geothermal flow from wells in order to boost the power output. Next, Rad et al. [62] discuss the viability of hybrid GSHP systems combining with solar thermal collectors as the supplemental component in heating dominated buildings. This examination has shown that the installation of solar TES in the ground can considerably reduce the GHE length. As for the TESs design, a case study describes the installation of GSHPs fed by BHEs; in this framework, the installation of UTES for high temperature heat storage has been proven to be successful [63]. In this direction, it analyzes the operating performance of a PV/GHP system on a residential building that maximizes the self-consumption of the energy production [64]. The experimental analysis is based on real time data, regarding both the operation of the two systems and the interaction with the electricity grid. Finally, the case study in [65] presents a combined CCHP, i.e., a PV and a GSHP integrated system, which is designed for a large office.
As for the energy storage in smart grids, it emphasizes on the importance of the energy storage for the effective management of energy demand and supply, by analyzing the various types of ESUs (electrical, electrochemical, thermal, and mechanical ones) [66]. Also, in [67] the new types of energy storage being integrated into the grid are addressed. In this context, the design of smart grids will take advantage of the available storage capacity in dealing with more dynamic loads and sources.
Following the review on relevant scientific literature, we conclude that there are various combinations of RES systems in order to cover electrical and thermal (heating and cooling) load demands of nZEBs. As for ESUs, the existing installations incorporate either thermal or electrochemical storage units. Also, in many studies, the exploitation of the electricity grid for net metering application is presented. In conclusion, the outcomes of all these works regard the case of individual buildings, whereas there is a gap in the literature for the case of multi-family buildings or apartment blocks. Additionally, the main scope of the introduced RES and ESUs has been the decrease of CO2 emissions and the increase of self-consumption ratio of the locally installed RES, at individual building/owner level. Therefore, the benefits of local installed RES and ESU units are limited from electricity grid perspective, because it is not manageable to handle numerous small systems at low voltage distribution level. In this context, it is worth noting that demand-response services are easier to be applied to aggregated low voltage prosumers (by using price signals to rearrange their consumption, production or storage services), than negotiating with numerus individual owners of small RES and ESU units at “stand–alone” buildings. In this way, demand-response can be a more credible and cost-effective solution for shifting energy demand (e.g., by reducing peak consumption) and avoiding high load fluctuations at grid side. Additionally, considering that more than half of buildings energy consumption corresponds to the heating and cooling needs (in order to achieve acceptable internal comfort conditions), it is concluded that a great share of demand-response lies in thermal appliances.
As for the LCCA of those installations, there are many case studies in the specific literature. Among them, in [68] the basic methodology of LCCA is presented, emphasizing on the analysis of the present value of system components, in order to calculate the total cost of ownership over its life time, including the costs to purchase, install, operate and maintain. Ιn [69] a life cycle analysis of various renovation scenarios for multi-family buildings in Portugal is presented, by focusing on the goals of the nZEB and ZEB design process and on the contribution of solar systems, such as solar thermal collectors and PVs. According to [70], the LCCA is proposed for a PV and battery energy system in a residential building in India, by using analytical expressions for the payback period calculation. Also, Marszal andHeiselberg [71] use the LCCA method and considers a multi-family nZEB to indicate that in order to build a cost-effective nZEB, the energy use should be reduced to a small amount which should be covered by renewable energy generation. The work in [72] presents a comparison of the LCC of five alternative heating systems, namely GDHS, natural gas-fired boilers, pellet-fired boilers, GCHP and coal-fired boiler technologies, in four climate zones in Turkey. In addition, life cycle cost calculations for geothermal energy systems are presented in [73,74]. In case of battery ESSs, the LCCA method is used in [75,76,77,78].
The present paper focuses on the implementation of a collective self-consumption nZEB concept for multi-family building of B-energy class certification (which is imposed by the relevant legislation), that uses RES and ESUs [10]; the area of interest in this work is the Mediterranean, due to its excellent RES potential, its mild temperature conditions, and the relatively poor energy performance of its building sector (characterized by old buildings of high thermal losses and limited use of state of the art HVAC systems) [2,3,4]. The term collective self-consumption is used to describe a group of jointly acting renewables self-consumers who are located in the same building or multi-apartment block [10,11]. The joint use of RES technologies in conjunction with the installation of electrochemical and thermal ESUs, strengthens the scheme of energy communities; in terms of electricity grid operation, the installed energy storage not only increases the self-consumption ratio of the on-site installed RES (increasing the economic benefits of the users of the buildings) but it also relaxes load flow congestion and manages the evening peaks of electricity demand. These aspects are crucial for the secure operation of the electrical grids and will become more intensely as the electricity generation shifts from the centralized generation model to the distributed intermittent RES generation concept [5]. In this context, the adopted net metering schemes around Europe permit the residents of a multi-family building to establish an energy community and install a common PV system in order to serve their total annual electricity needs. The supplier offsets the energy bill by virtually sharing the production of the PV plant according to the rates given by the jointly acting renewables self-consumers. The design principles of this concept and its application are described in the following sections.
Last but not least, the estimation of the life cycle cost of the investment by using the LCCA method (for the proposed collective self-consumption nZEB scheme) is also performed, in order to evaluate its sustainability and describe the necessary incentives for its successful application.

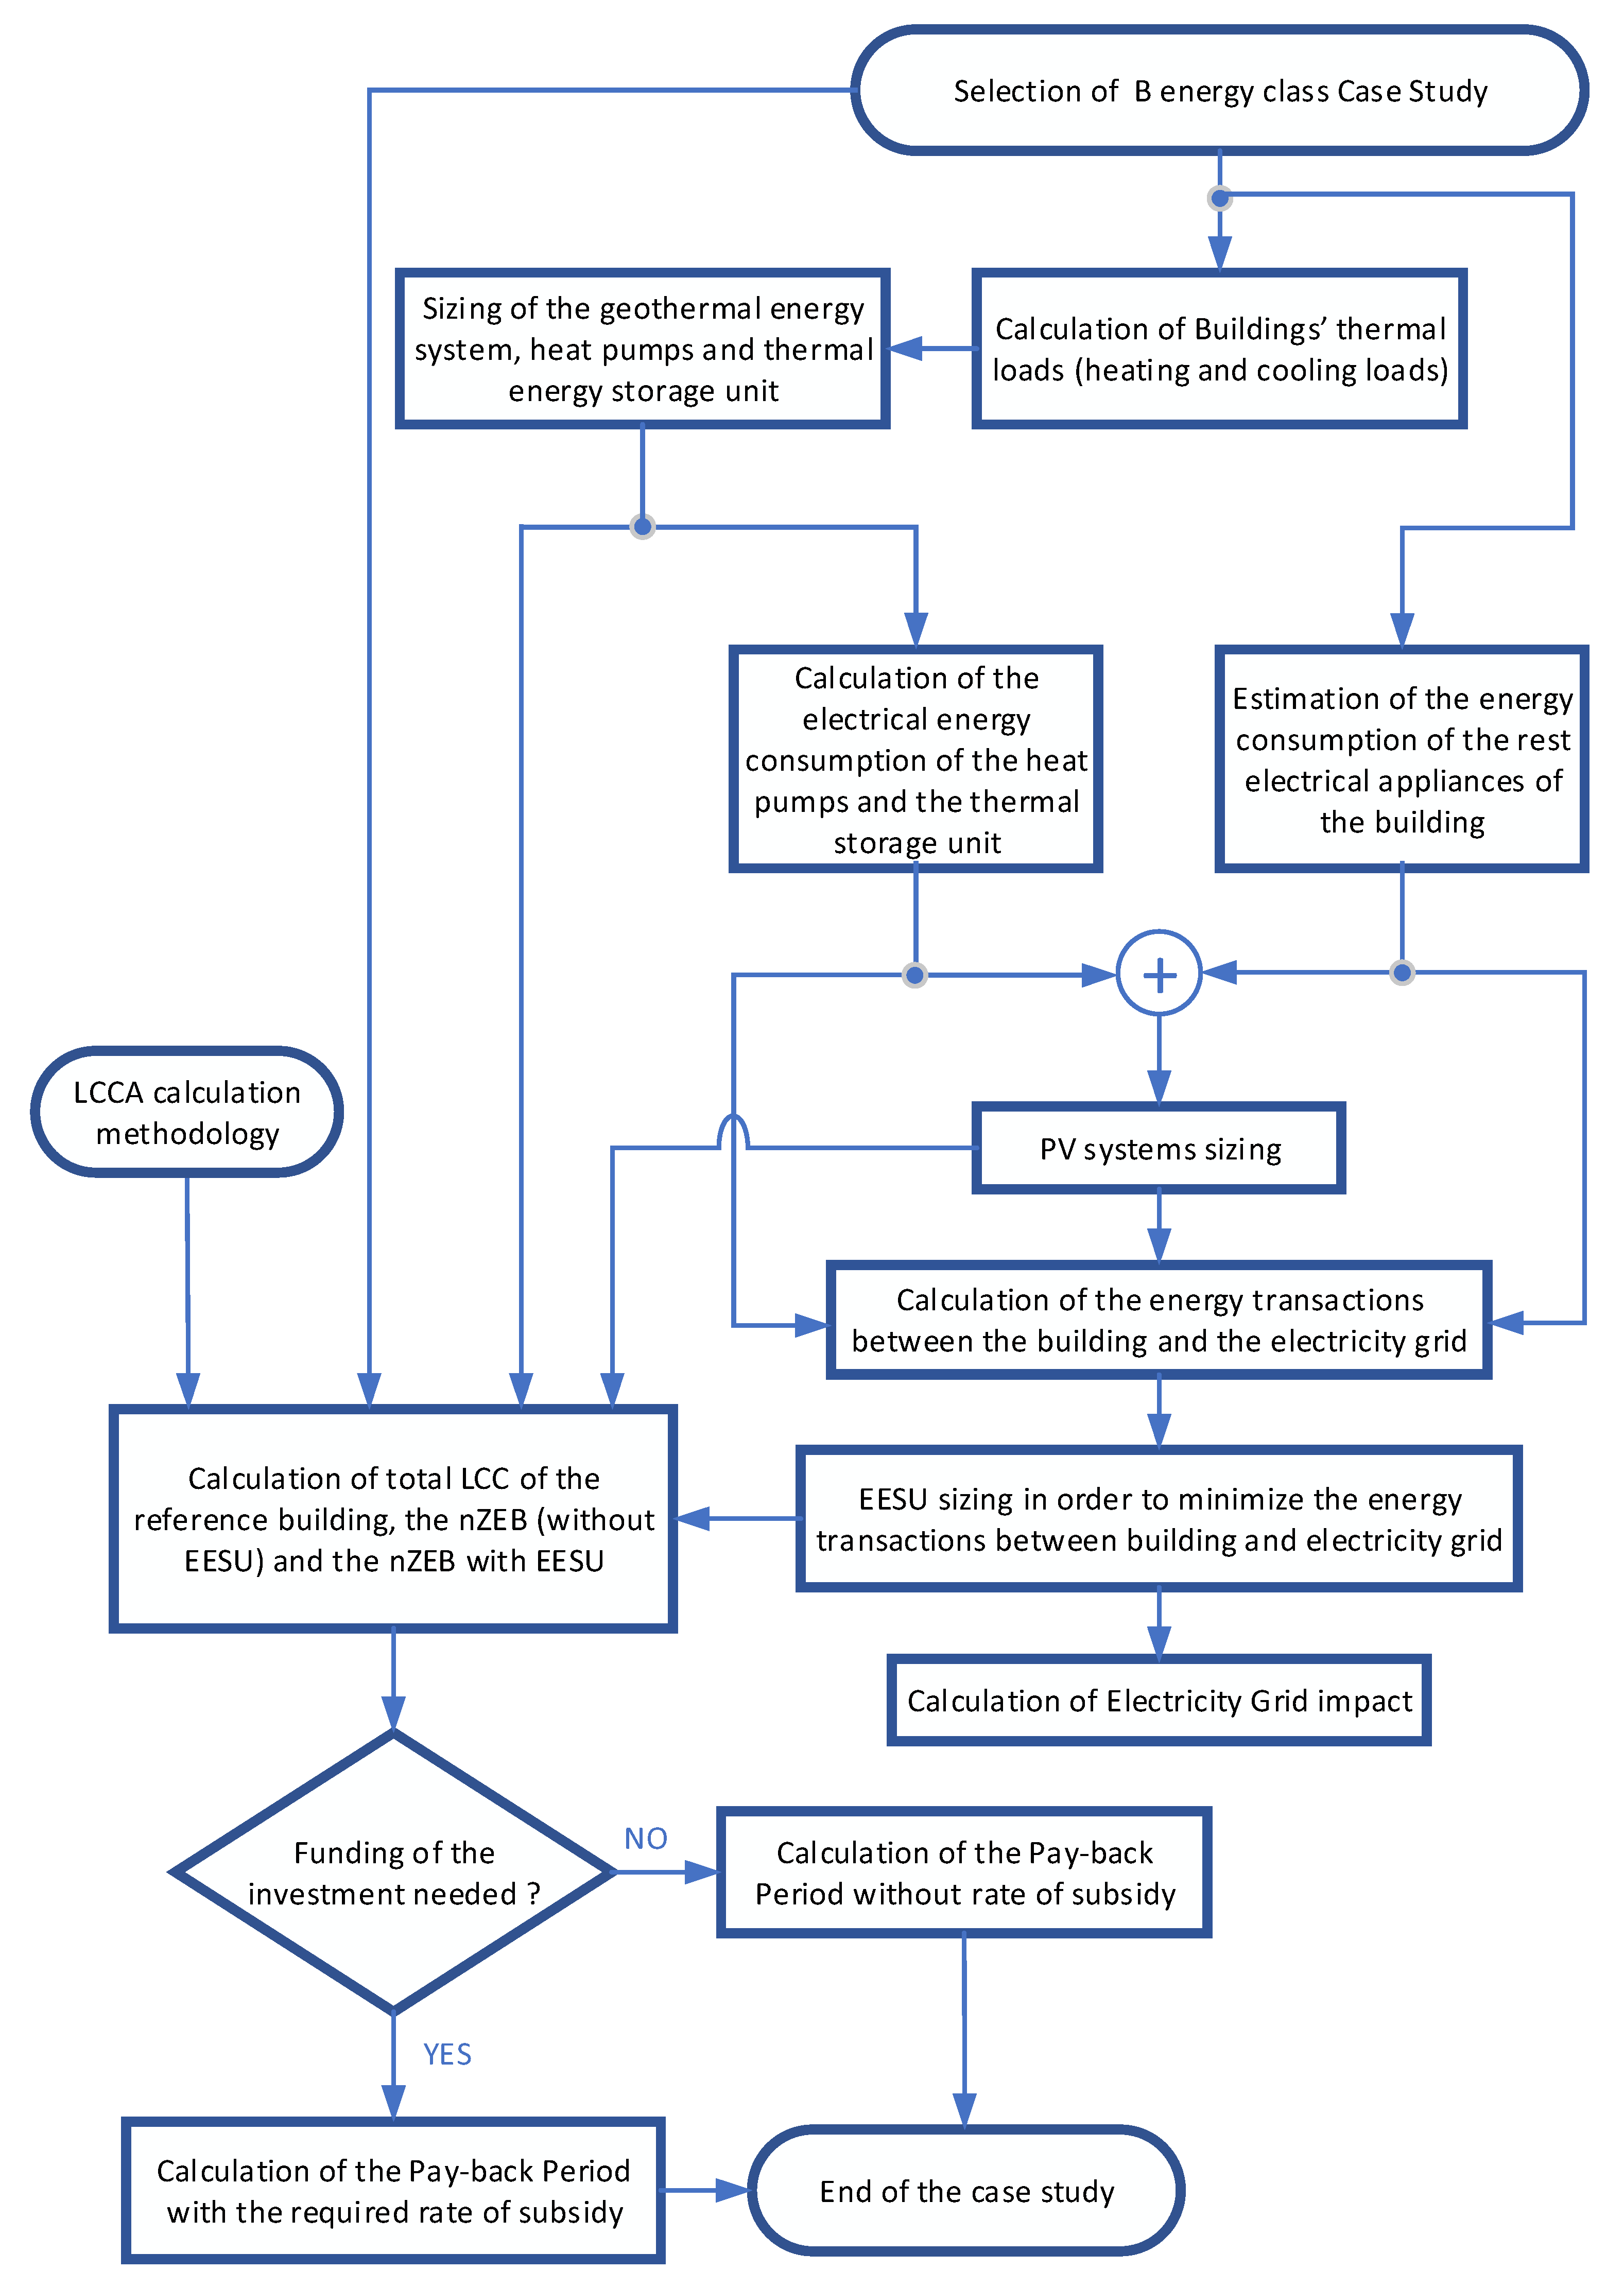
2. Materials and Methods

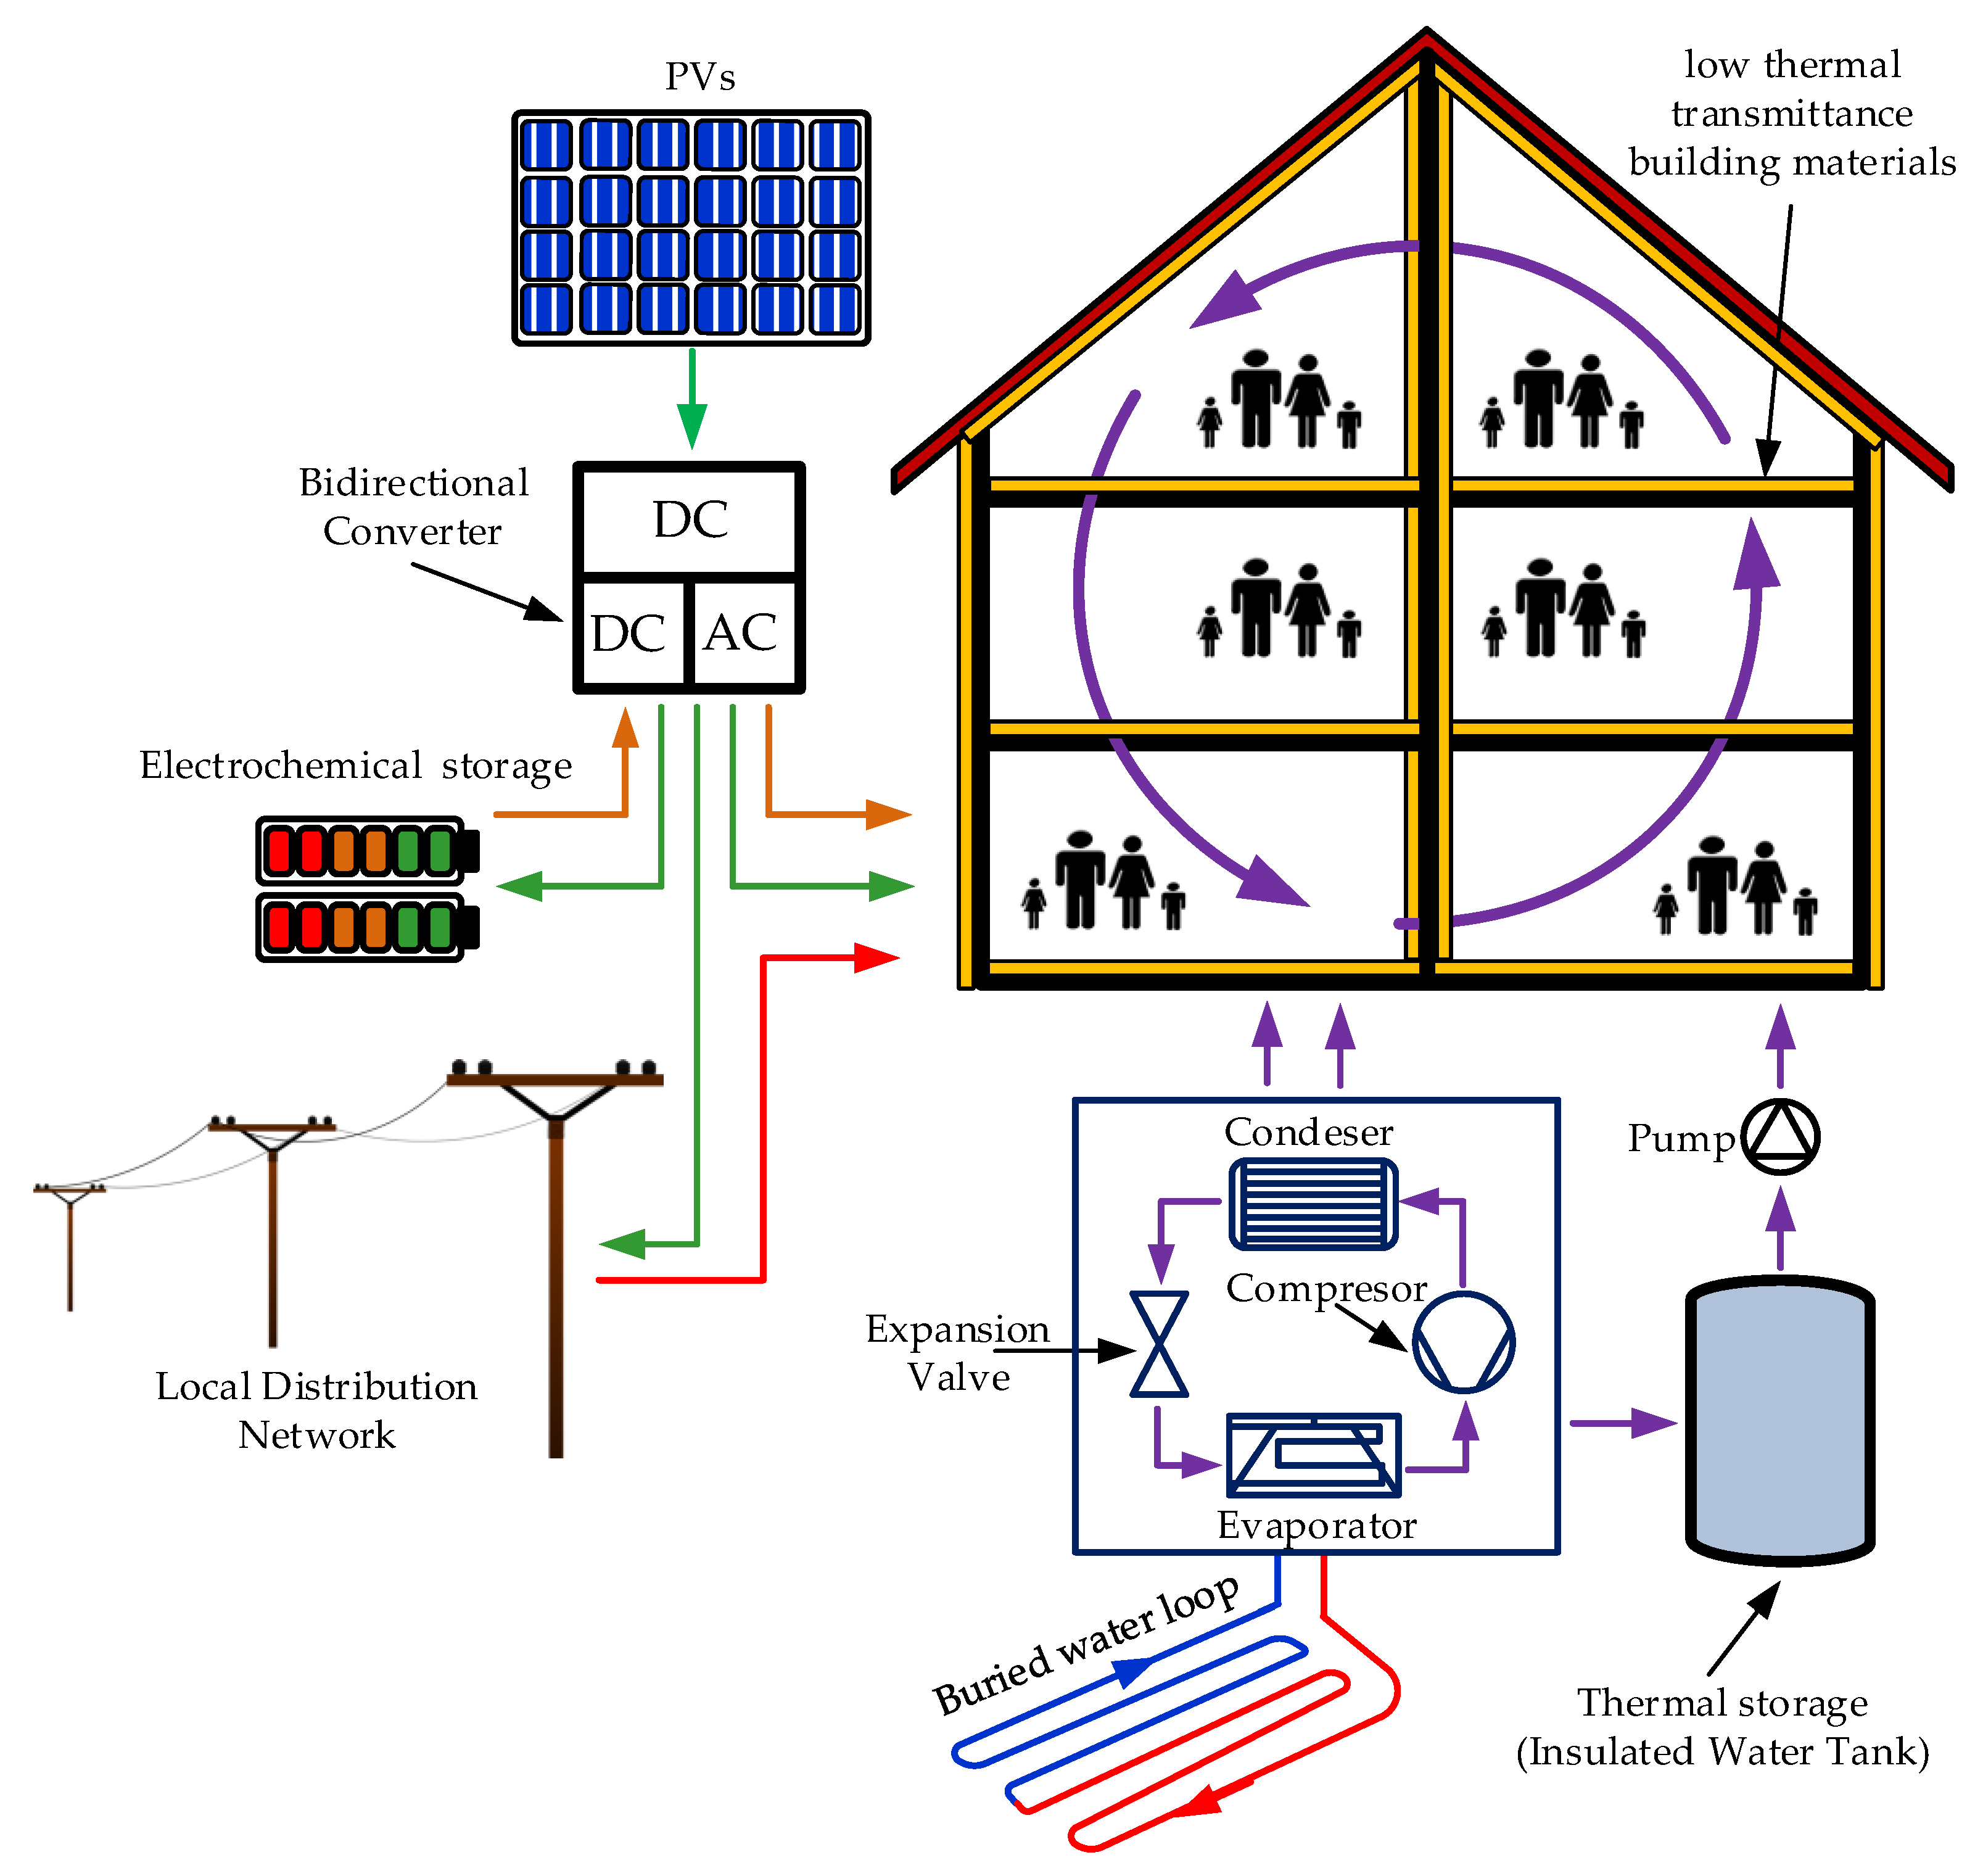
2.1. Description of Collective Self-Consumption nZEB under Study

For the purposes of this study, a hypothetical multi-family building in the city of Athens (B climate zone area according to the National Regulation [79], which is characterized by mild temperatures during winter and dry weather conditions during summer period), with three floors and two dwellings per floor, is considered as the case study building. This type of building stock is common in many small and medium-sized cities in European Mediterranean countries. The Commission Recommendation 2016/1318/EU (as regards the application of the nZEB definition in practice) benchmarks for the energy performance of nZEBs the bespoken targets; those targets are mandatory for the new buildings in EU. Indicatively, for new households in Mediterranean area, the annual primary energy consumption ranges between 0–15 kWhprimary/m2, according to [80]. However, for the purpose of this work, each dwelling is classified in B energy class (supposing that all necessary renovation measures have been already applied). In this regard, it is worth noting that at national level in Greece 65% of dwellings are classified in energy classes E–H, 32% in C–D and only 3% in A–B. Additionally, the national plan for Greece requires the energy improvement of refurbished buildings to B-class before their nZEB transformation. Therefore, in order to convert them into nZEBs, it is necessary first to reduce their energy demand by using energy efficient materials (such as low emission glazing for transparent openings and thermal envelope materials with appropriate U-Value for the insulation of roof, floor, thermal bridges and external walls) and upgrading the electromechanical equipment to the minimum energy efficiency standards, and afterwards to utilize RES to meet the extremely low energy demand. Although the upgrade of buildings thermal insulation is a key issue on their energy performance, as it has been thoroughly discussed in the scientific literature [81,82], the present work focuses on the effective energy supply of nZEBs (employing GHPs and PVs) and the optimal integration of EESUs. Any further discussion regarding renovation measures for enhancing the thermal insulation level of buildings envelope is out of the scope of this paper.
Last but not least, according to the Hellenic Statistic Authority [83], the average annual primary energy consumption in Greek households that belong to B energy class is roughly 98 kWhprimary/m2 [78]. Thus, this primary energy consumption value was selected for, in order to formulate the energy consumption profiles of the building under study. The term “Primary Energy” refers to the energy production from RES and non-RES which has not undergone any conversion or transformation process and it is calculated by using the primary energy factors shown in Table 1 [3,4].
As it will be further analyzed below, the present study focuses on the implementation of a collective self-consumption nZEB concept by exploiting PVs and geothermal energy systems on a multi-family residential building. The featured nZEB concept is based on the high energy productivity of PV systems in Mediterranean countries [84]. Additionally, a central geothermal energy system has been selected to serve both heating and cooling needs of the multi-family residential building, due to the technological maturity of these systems as well as their high efficiency [85]. In this case study, the calculation of the energy consumption of the rest appliances is also taken into consideration, i.e., the electrical consumption of the building before the installation of GHPs. As for the rest electrical appliances, it is mentioned that they account for approximately 20–25% of the annual energy consumption [86]. For this reason, this energy consumption component should not be disregarded from the rest analysis. The total area of each dwelling is considered to be 150 m2. Having in mind that the ceiling height is roughly 3.2 m, the total heated and cooled volume of the building is equal to 2880 m3. Moreover, the building is south-east oriented, and it is located in an urban area.
As an alternative solution, solar thermal panels could be installed instead of the geothermal energy system. Although solar thermal panels could reduce the required size of GHPs, for the sake of simplicity this scenario is not examined. Hence, in this paper a case study of a shallow geothermal energy system has been selected. It consists of GHEs in vertical layout, in order to occupy as less installation space as possible. The underground thermal energy is supplied to the building by using highly efficient GSHPs. Moreover, ESUs (electrical and thermal) are used to enhance nZEB performance. The schematic diagram of the proposed flexible nZEB system is presented in Figure 1. Additionally, the same figure illustrates the electrical energy transactions between the building under-study, the locally installed PV system and the electrical distribution network (along with the energy transactions with the EESU), as well as the thermal transactions between the building and the geothermal energy system.
The proposed combination of RES technologies comes up with certain restrictions for the necessary energy storage capacity (electrical and thermal), in order to avoid oversized systems and high initial investment costs that affect the pay-back period. The design aspects regarding the reduction of energy transactions with the electricity grid and the associated electrical/thermal energy storage capacity are discussed. Also, the optimal sizing of the ESUs manages to control demand-response and peak shavings. In order to achieve that, this study presents the calculations of the electrical PV production and consumption of the building for a 10-years period. This time period analysis is used for the following reasons: Firstly, the aim of this paper is the long-term design of the building energy system, taking into consideration the average life cycle of the ESU unit. Also, this time period analysis is quite enough for the reliable definition of the load demand and the excess energy or the energy losses on a monthly and on a yearly basis. Although (according to the nZEB concept) the energy transactions at the end of each year must be low, this is not a representative period of analysis, due to the weather conditions and especially the solar irradiation variations. Thus, the 10-years period enables the consideration of those variations on climatic conditions; apparently, by the end of the 10-years period the energy transactions must be low enough in order to meet the nZEB concept requirements. As for the economic parameters, the 10-year time frame is a usual pay-back period time for such investments. As regards the EESUs, their costs are a major part of this investment; hence their sizing should be carefully designed in order to come up with an acceptable payback period. In this study, the EESU is sized by means of an optimization process that takes into account the energy transactions among the nZEB and the electricity grid.
In next sections, the sizing of the collective self-consumption nZEB concept will be analyzed in detail. First, the energy consumption of the building is calculated on a yearly and a monthly basis. This is the fundamental step for the design of the PV unit and the geothermal system, as well as for the estimation of the energy transactions with the electricity grid. According to the previous section, the sizing of the ESUs should aim at minimizing those energy transactions. Finally, calculations on the LCCA of the proposed energy system, with and without using EESUs, are presented in Section 3.
In order to make the proposed case study more comprehensive, the flow diagram in Figure 2 describes the steps, the methods used and the aim of each step.

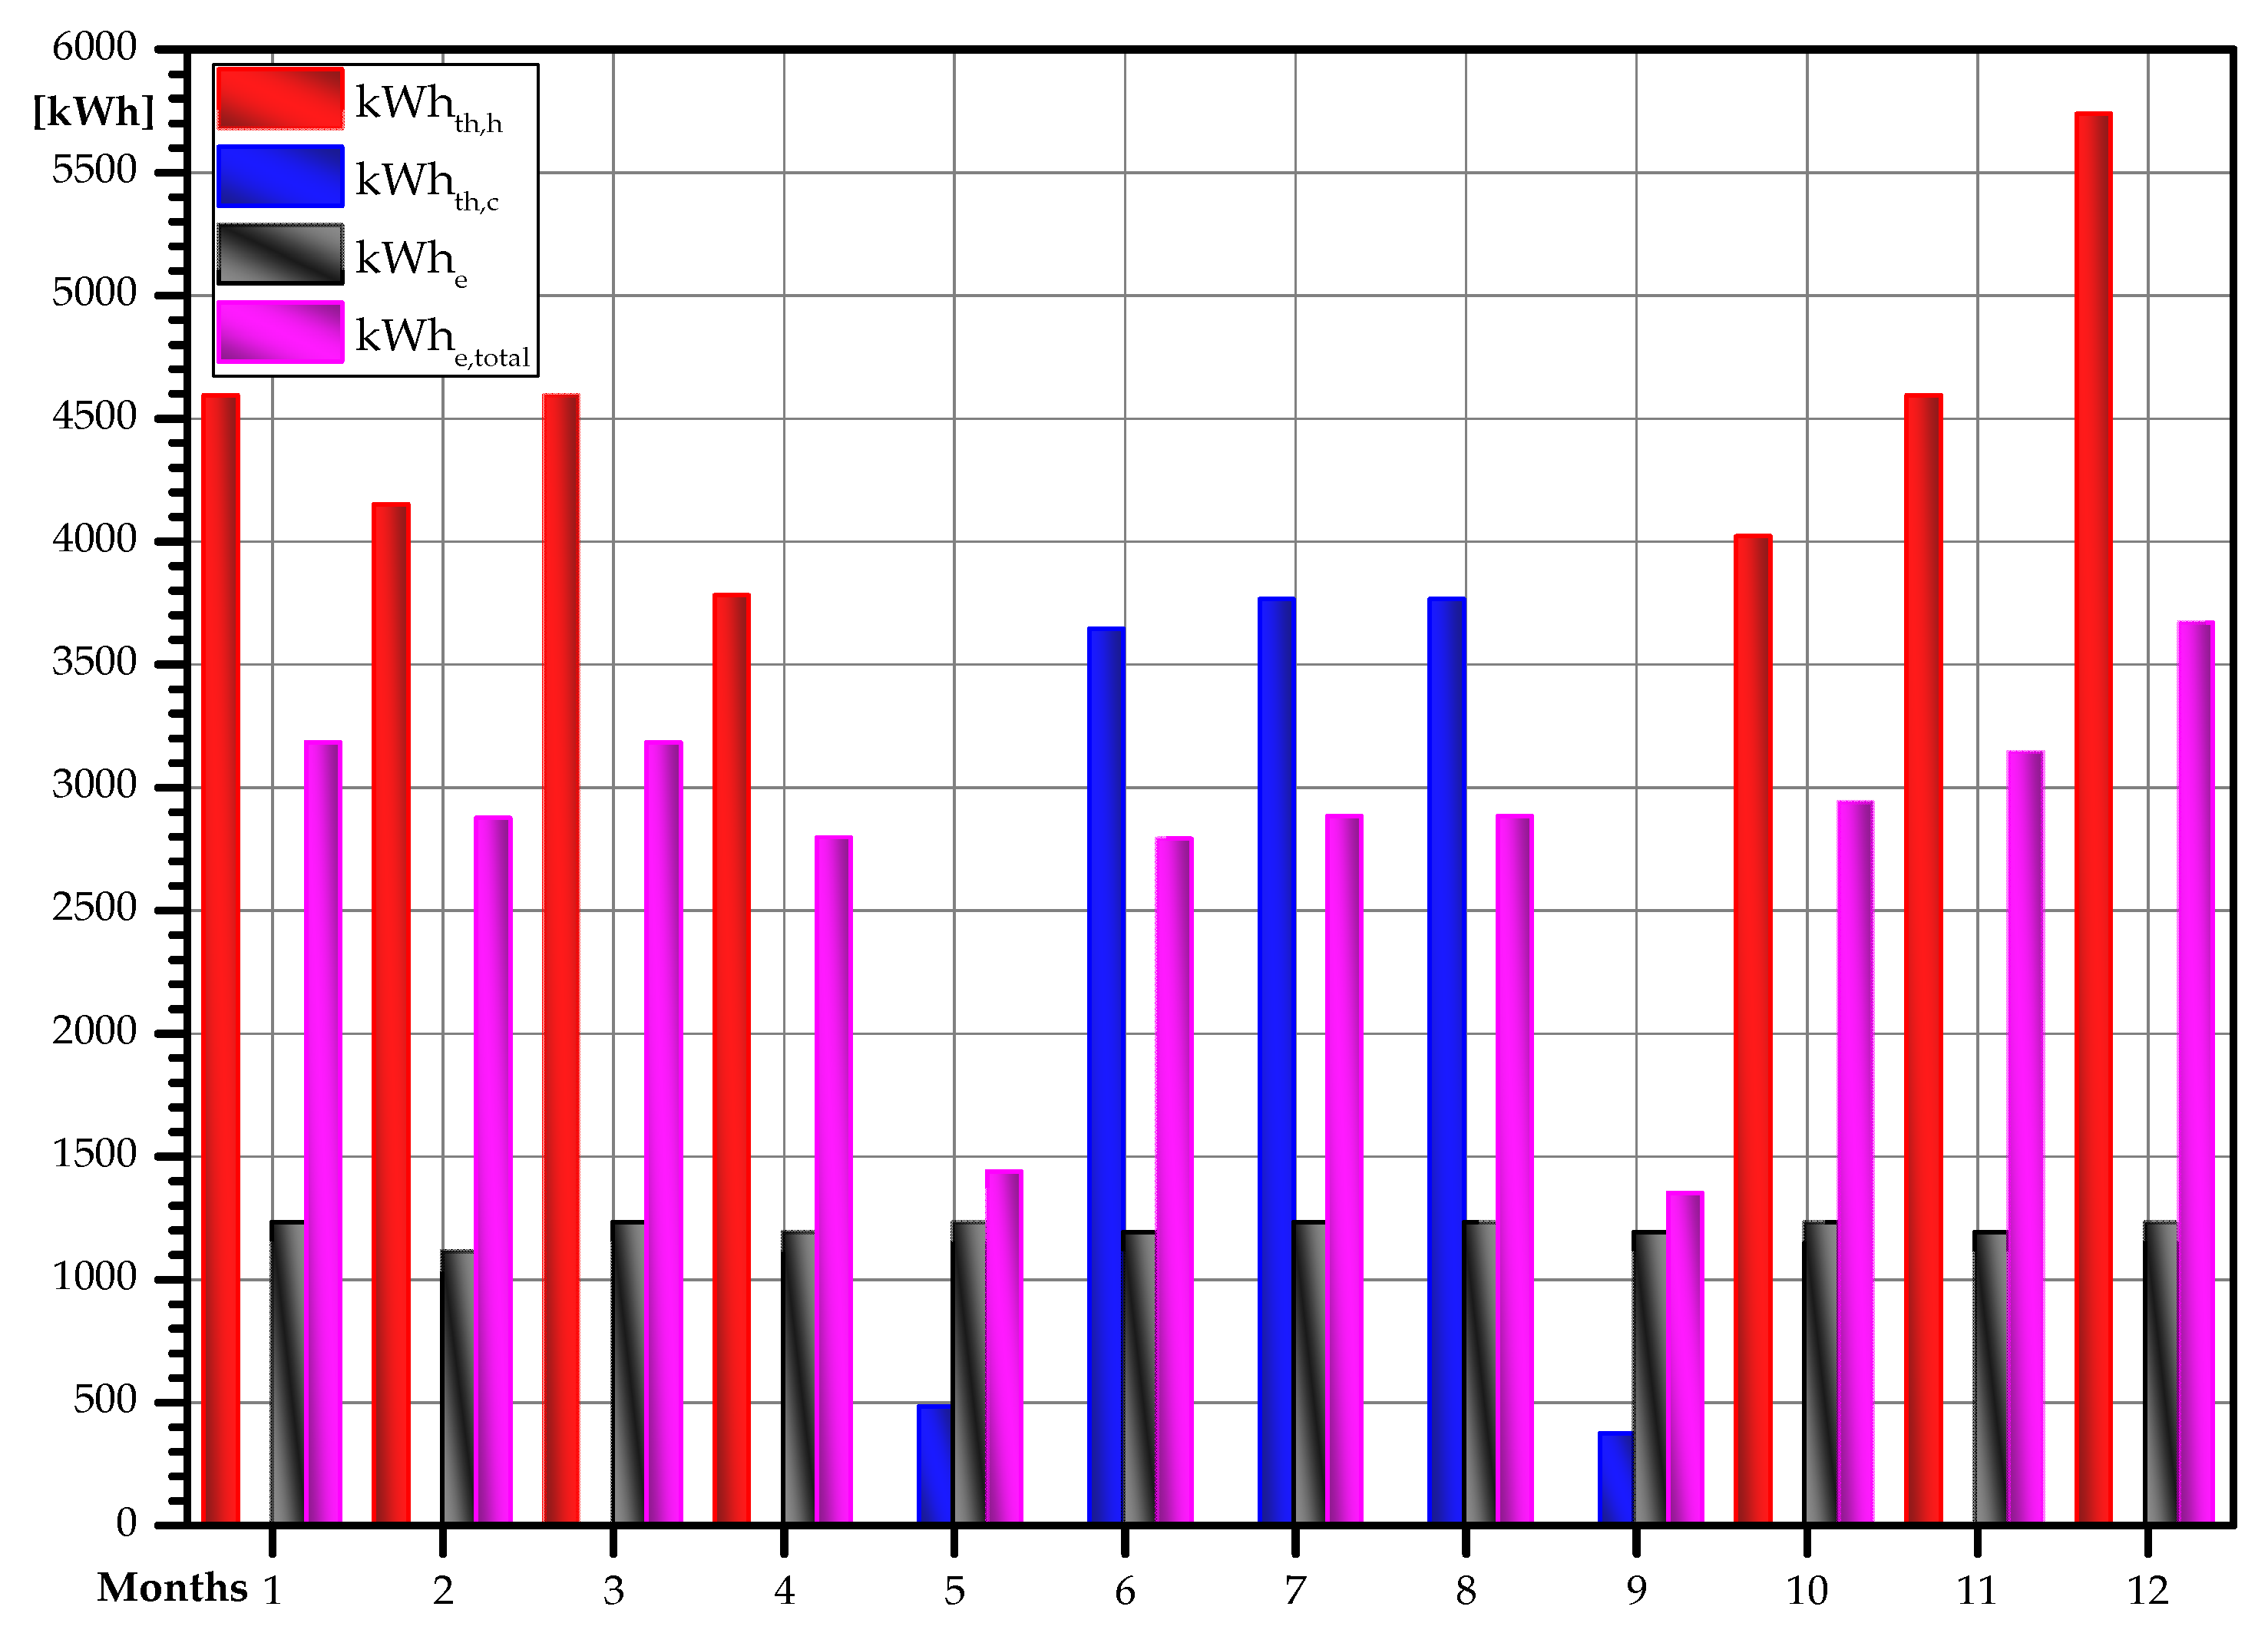
2.2. Definition of the Energy Consumption Profiles

As referred in the previous section, the average annual primary energy consumption in Greek households that are classified at B energy class is roughly 98 kWhprimary/m2 [79,83]. In more details, the average annual thermal consumption, in terms of heating, of the aforementioned Greek households is 5244 kWhth,h and the average annual electrical consumption is 2400 kWhe. In order to achieve the appropriate comfort indoor conditions during summer period, it is assumed that the need for cooling energy in each household is 2000 kWhth,c, which is covered by GHPs. Hence, the distribution of heating and cooling load demands can be calculated on a monthly basis, during winter and summer period, as it is shown in Figure 2.
According to Table 1, those amounts of energy consumption are equal to 5506 kWhth,h-primary, 6960 kWhe,primary and 2100 kWhth,c-,primary, which leads to 14,566 kWhprimary in total. This amount of energy consumption (calculated for the proposed building) is in line with the previously noted average total primary energy consumption per dwelling for the B energy class. Additionally, these energy needs must be covered by the utilization of GHPs and PVs in order to transform the building into a nZEB one. Next, the three types of energy load demand (heating, cooling and pure electric) of the building under study will be allocated on a monthly basis.

2.2.1. Thermal Energy Consumption (for Heating) Calculation

The definition of the thermal-heating load demand of the multi-family building is based on the average annual thermal consumption (for heating needs) that each dwelling has. Thus, according to the previous subsection, the total thermal energy load of the building is 31,464 kWhth,h. This will be covered by the geothermal energy system; its annual operating hours (in order to cover the thermal energy demand for heating) regard the winter period and in general the cold days of the year. Those are estimated to 1700 h per year. This can be assumed by taking into consideration the mild weather conditions in Mediterranean climates during spring and autumn periods. Upon this parameter, the average annual heating load is 18.5 kWth,h.

2.2.2. Thermal Energy Consumption (for Cooling) Calculation

As for the cooling load demand, this is similarly calculated to the heating one. Starting from the cooling load of each dwelling, the total need for cooling energy is 12,000 kWhth,c. This amount of energy demand refers to the summer period and it is covered by using the same GHP (it performs both heating and cooling operation). The number of cooling operating hours is estimated to 990 h per year. So, the average annual cooling load is 12.13 kWth,c.

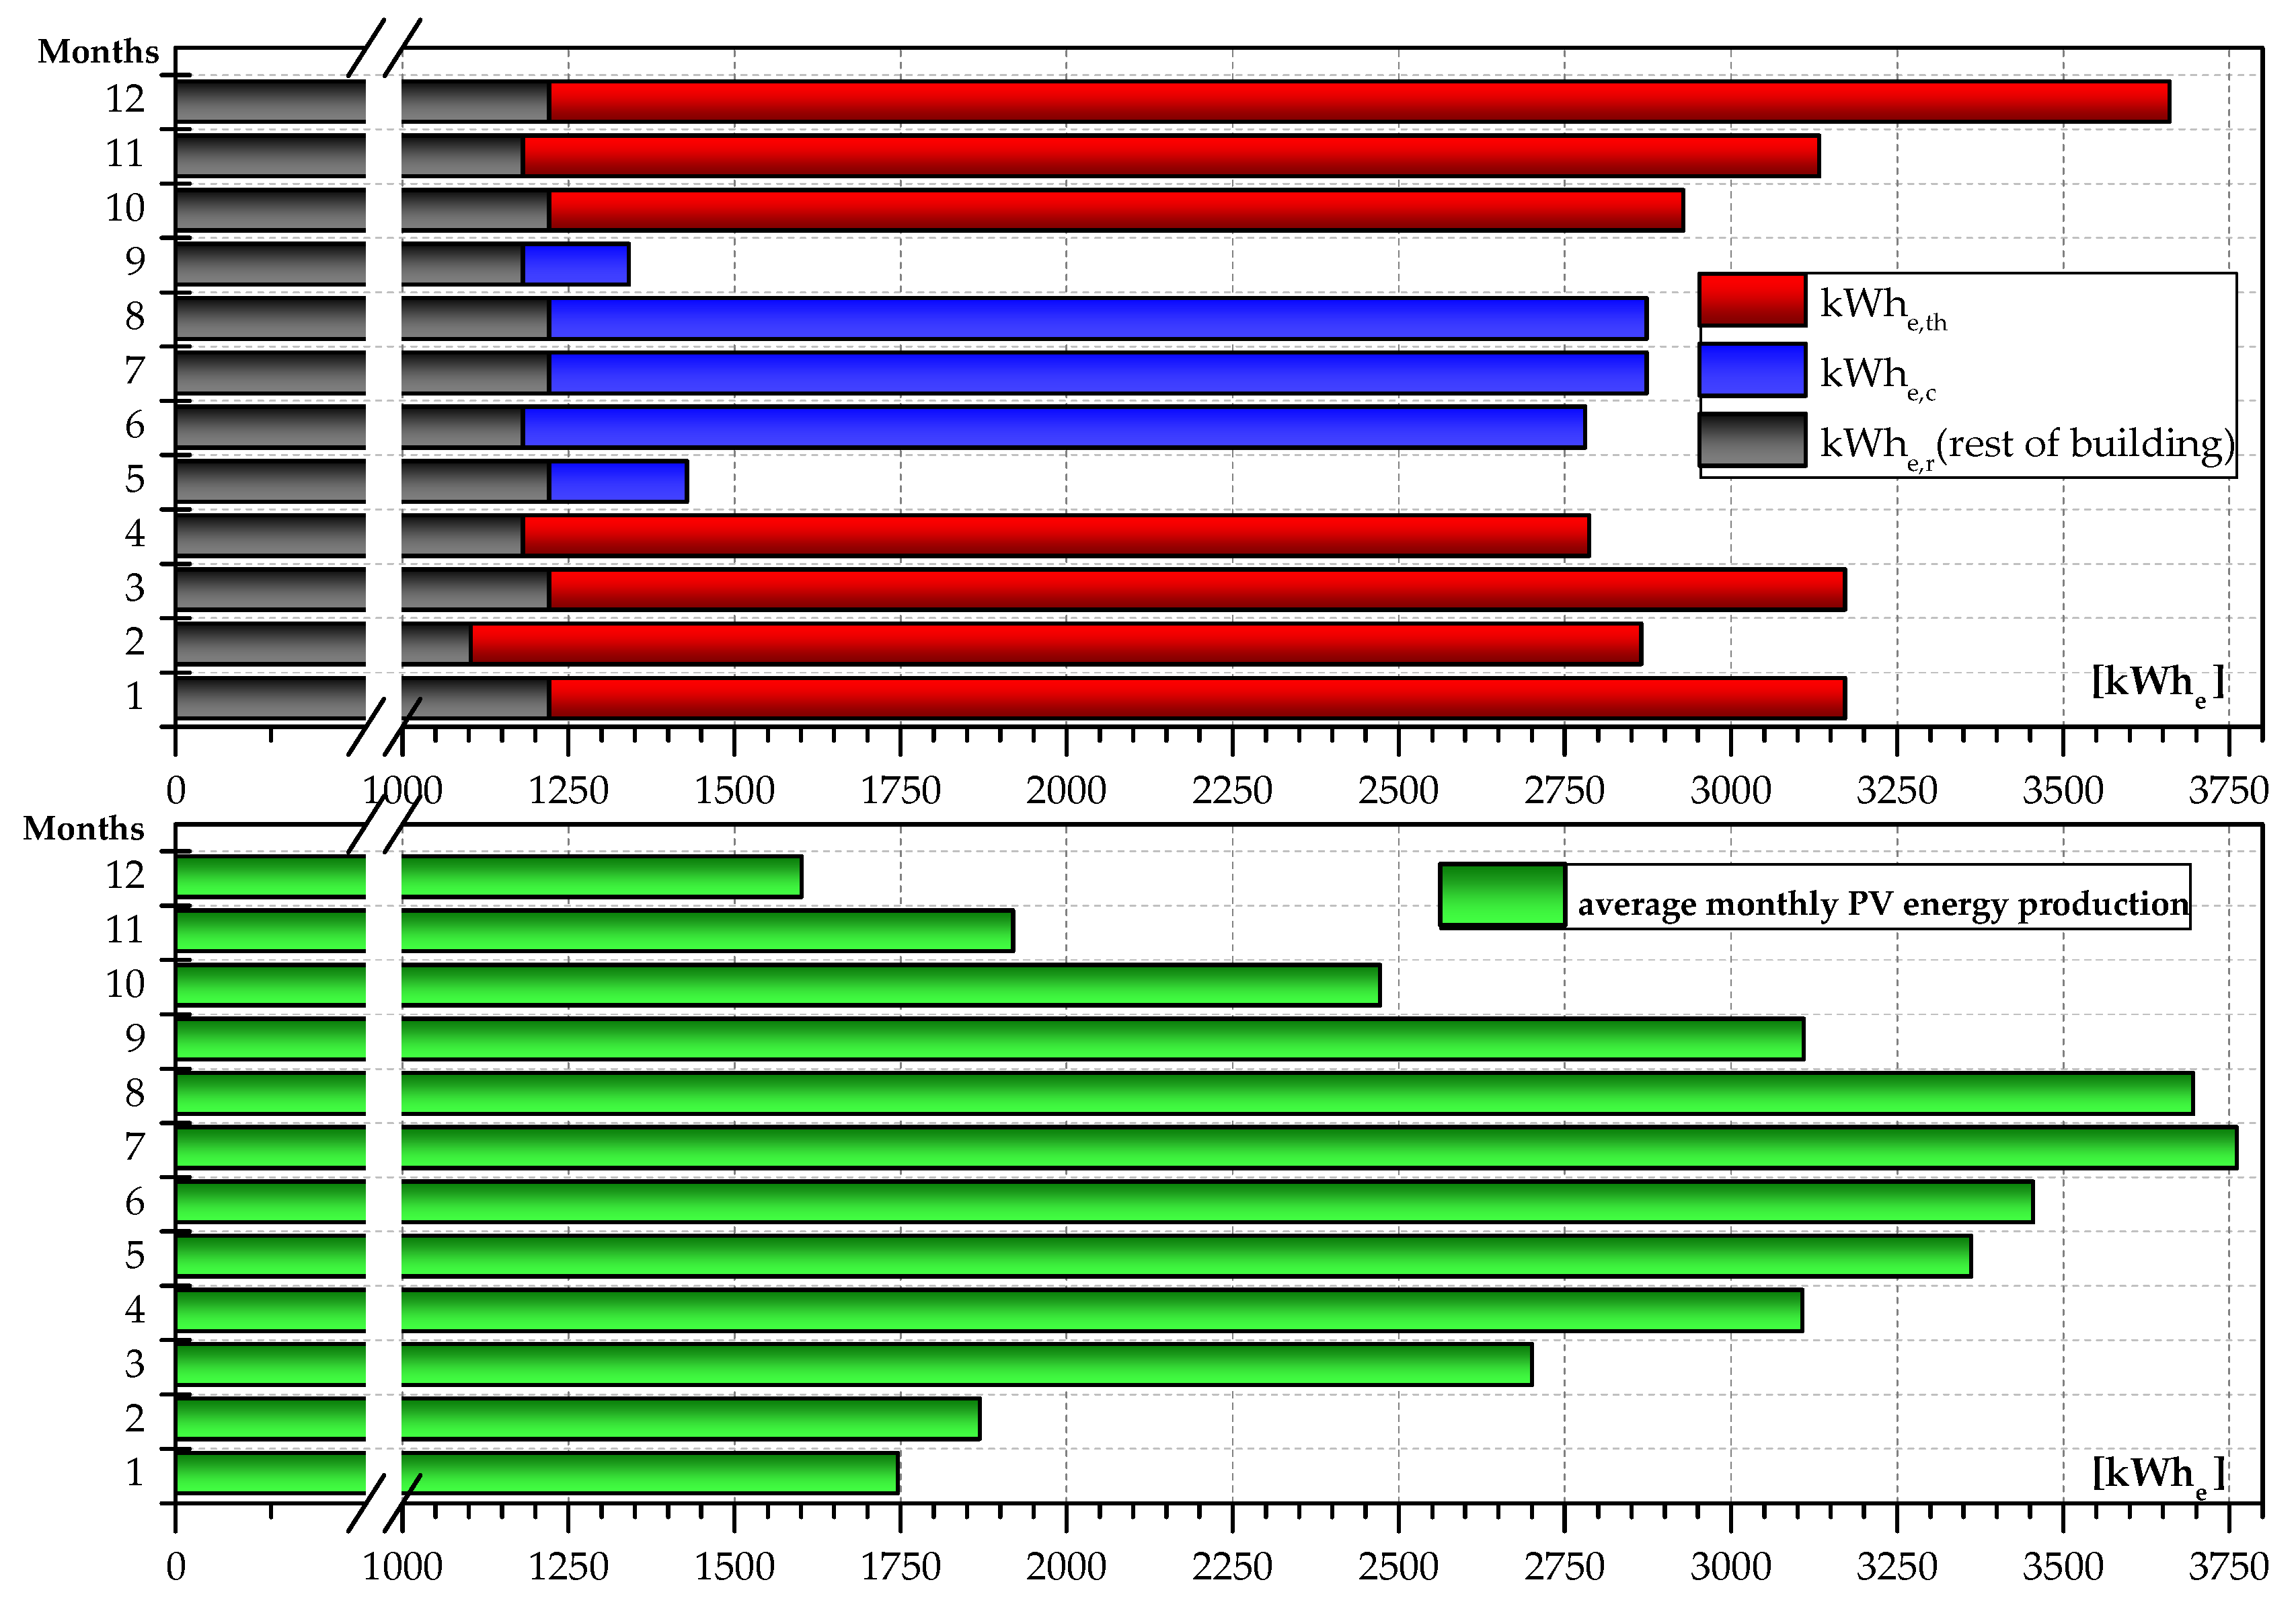
2.2.3. Electrical Energy Consumption Calculation

The total electrical energy load is the sum of the pure electrical energy consumption of building electrical appliances and the electrical energy that heat pumps absorb during their operation, as it will be shown in the following sections. The second component of the electrical energy consumption can be calculated indirectly through the aforementioned heating and cooling loads and the efficiency of the heat pumps for those operational modes (heating and cooling). The average annual pure electrical energy consumption of the multi-family residential building is 14,400 kWhe. Assuming a 24-h operation, the average annual electrical load of the building is 1.64 kWe. Note that the total electrical energy consumption should be covered by the PV system. Having in mind the contracted electrical power capacity per dwelling, each dwelling may consume up to a maximum of 12 kWe. Thus, according to the standardization of the Hellenic Electricity Distribution Network Operator S.A. (HEDNO S.A.), the contracted power capacity of the building is 85 kVA.

2.3. Geothermal Energy System Design

The shallow geothermal energy system is installed in the uncovered ground area of the land that the building is situated. According to Figure 1, the geothermal system is installed in a vertical layout and it consists of a GHP, the necessary GHEs, an insulated TES, a separate heat pump that charges/discharges the TES unit (HPSU) and the distribution network that transfers heat in the building.
GHPs perform heating and cooling operation and they must be able to cover the maximum thermal and cooling load demands. For the case under study, the total operating hours for the GHP are 2690 h per year in order to serve the average annual thermal (heating and cooling) energy demand. A significant parameter in the selection of the GHP is the COP, which is the ratio between the useful thermal energy and the absorbed electrical energy during its operation [87]. COP factor differs for heating and cooling operation. During cooling operation this factor is referred as EER, though it has the same meaning with COP factor. Hence, depending on the total operating hours, the COP and the EER factors determine the necessary electrical energy consumption of the heat pump. The technical data of the GHP and HPSU heat pumps, for the specific building, are shown in Table 2. It is noted that those are actual data from commercial heat pumps.
Another important issue is the sizing of the TES unit, as it has to cover thermal energy demands deviations from the average annual value. The sizing of the TES is based on the estimation of the number of continuous hours per year that heating or cooling load demand is at its maximum value. Hence, considering a maximum of 12 h continuous maximum thermal load demand, a commercial TES unit of 40 m3 volume has been selected (assuming a conservative capacity factor of 15 kWh/m3 in case of water-tanks). This proposed heat volume is appropriate for underground installation, without calling for a lot of excavation work. Thus, GHP supplies the TES unit with thermal energy during low thermal load conditions, whereas the reverse thermal energy flow takes place during high thermal load conditions.
As a result, the electrical energy consumption of the building is higher due to heat pumps operation, comparing to the electrical energy consumption without using heat pumps (pure electrical energy), as shown in Figure 3. More specifically, taking into consideration the technical characteristics in Table 2, the total annual electrical energy that both pumps consume is calculated to be 18,668 kWhe. Thus, the total annual electrical energy consumption becomes 33,068 kWhe. The allocation of building energy consumption on a monthly basis (due to heat pumps operation) is illustrated in Figure 3 for a typical year. In more detail, this figure depicts the allocation of the thermal energy consumption of the building broken down by operation mode (cooling-kWhth,c and heating-kWhth,h), as well as the monthly total (including the electrical consumption of the heat pumps), kWhe,total, and the initial (prior to nZEB transformation) electrical consumption of the building, kWhe.

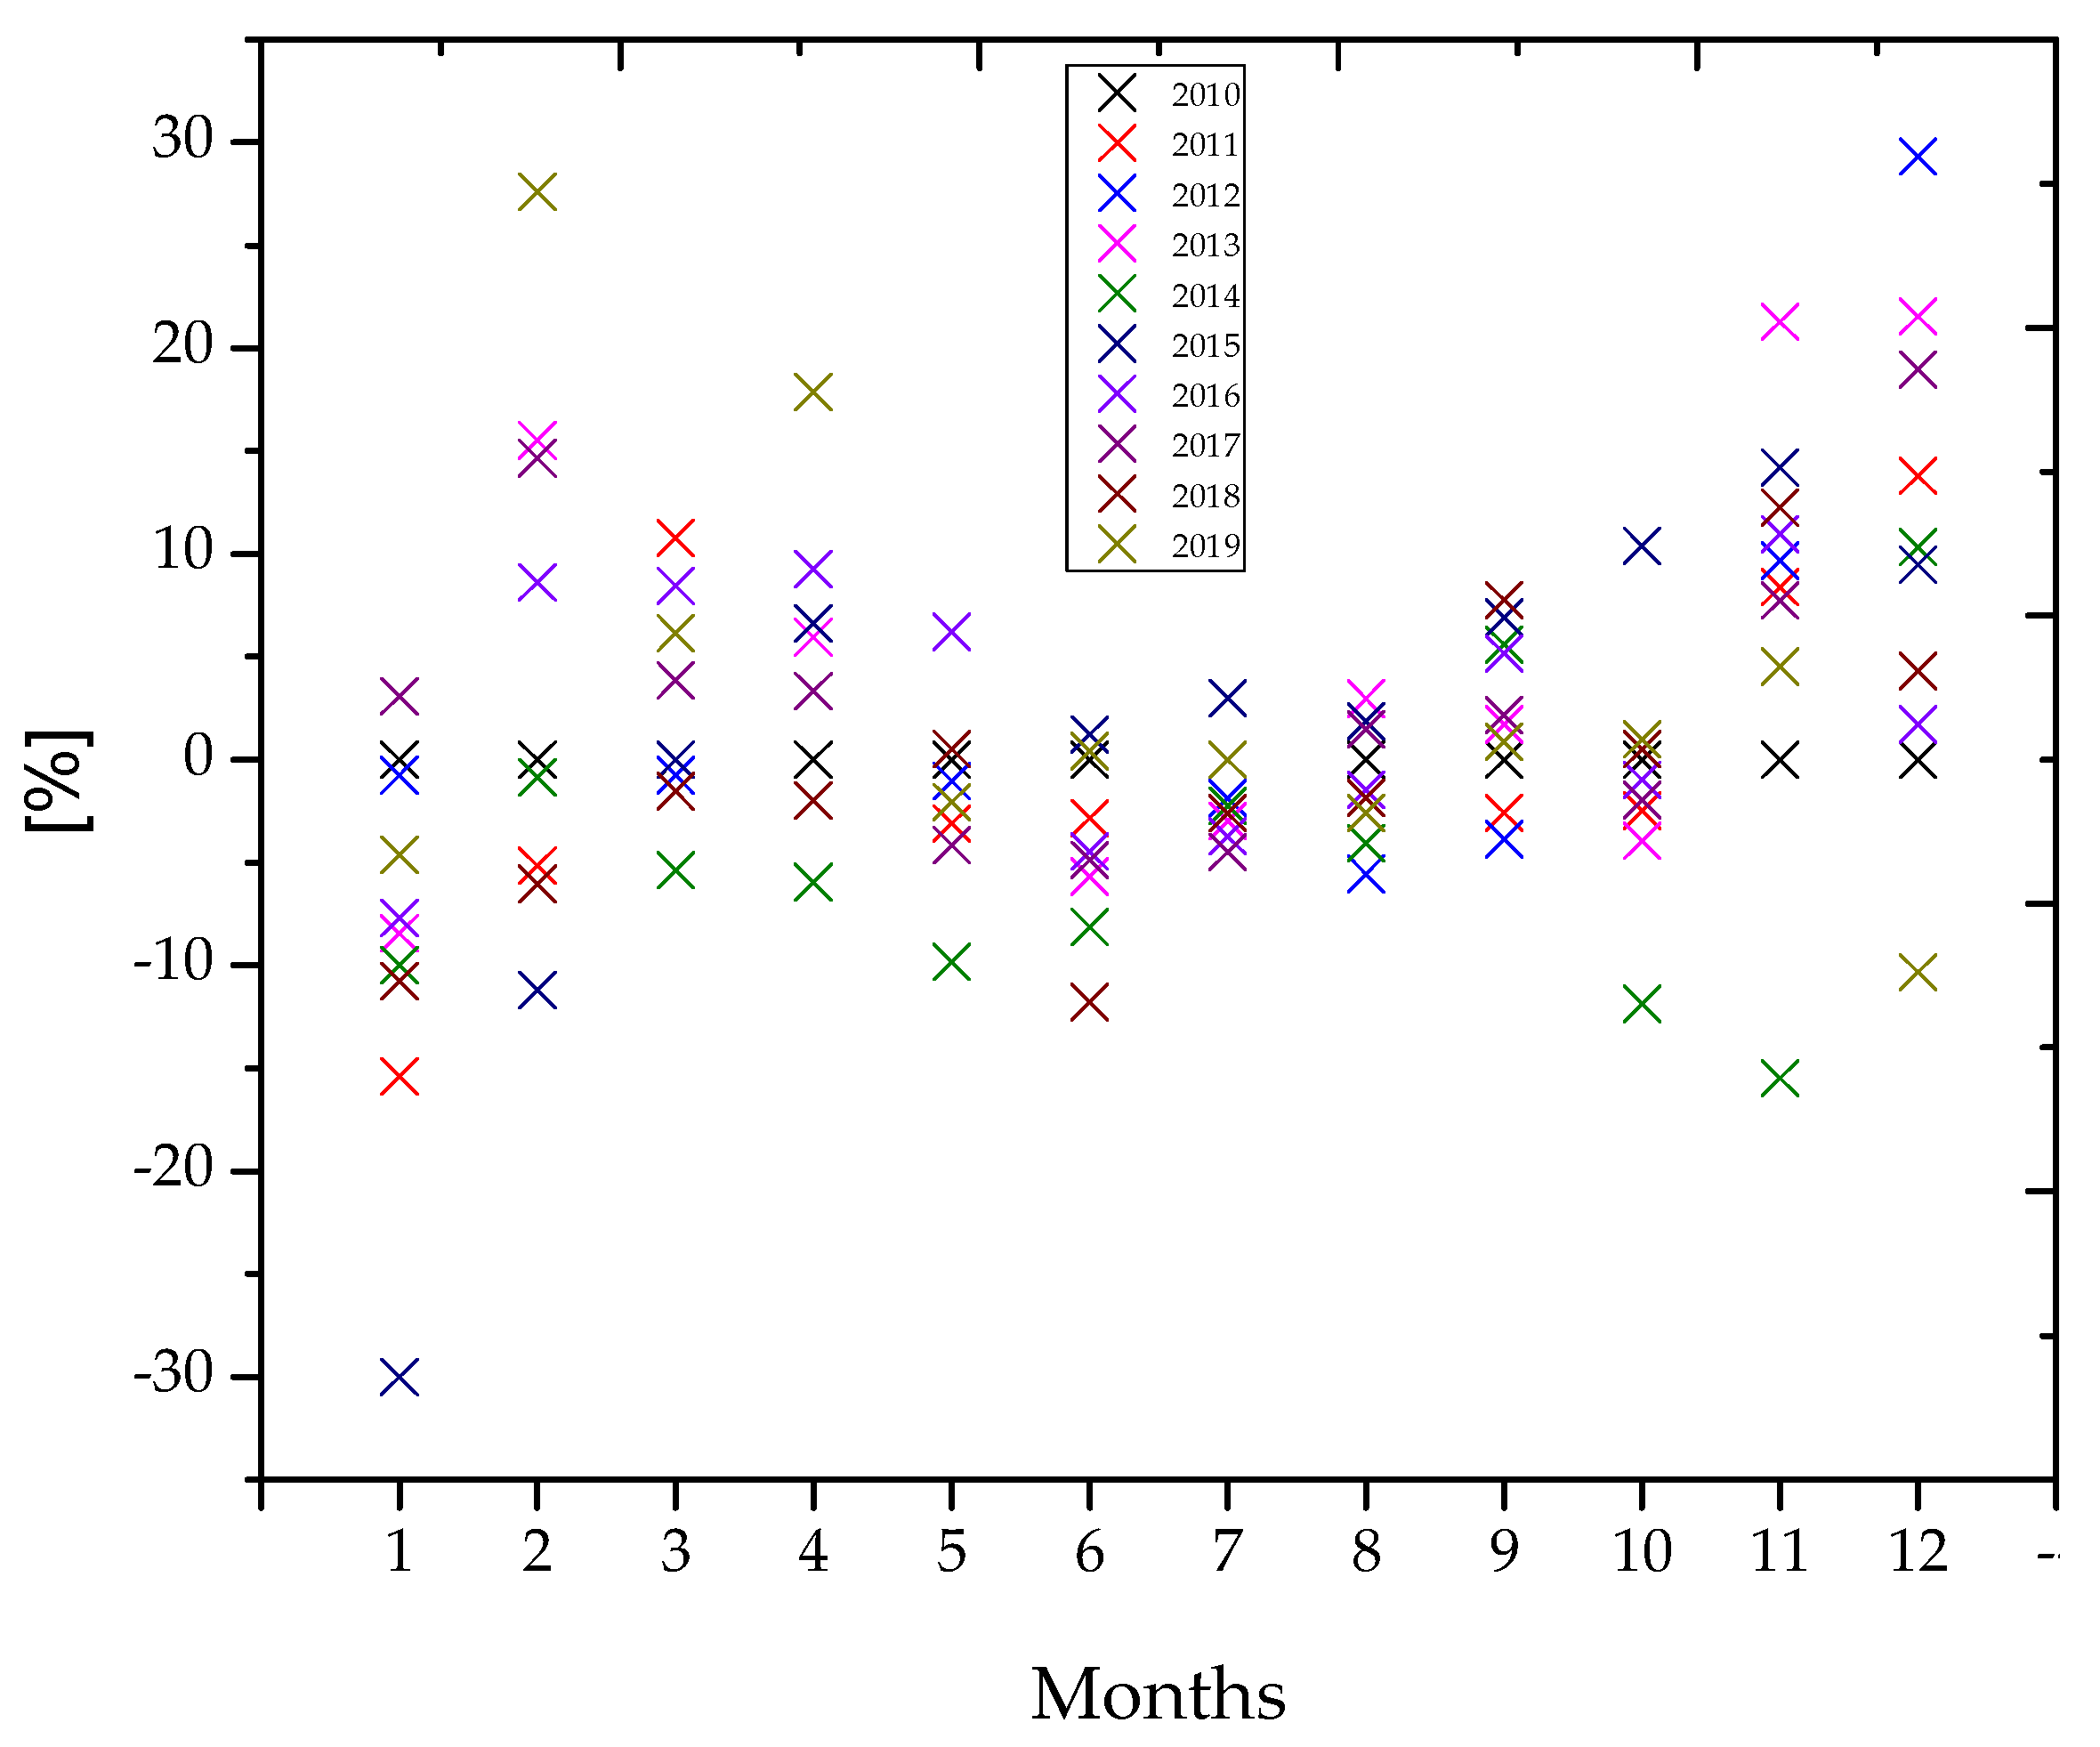
2.4. PV System Design

The sizing of the PV system is based on the total electrical energy consumption of the building, i.e., the electrical energy consumption of 33,068 kWhe according to Section 2.4. Considering the orientation of the building, the available meteorological data of the site, as well as the spatial planning restrictions, the proposed PV system nominal power is 21 kWp, and it is composed by three strings of 24 mainstream PV modules in series (considering PV panels of 295 Wp). The PV panels are installed on the rooftop of the building in tilt angle close to the latitude optimum inclination of 30° facing south.
It is noted that the relative production index for free standing-PV systems composed by crystalline silicon modules (placed in optimum tilt angle facing south) in the area of Athens, is roughly 1575 kWhe/kWp. Additionally, the average monthly value of the capacity utilization index for PV systems in Greece is 17.73%, whereas the minimum and maximum recorded monthly values are 9.1% and 24.1% respectively. The minimum and maximum capacity utilization index values are recorded every year in July or August and in December or January respectively, highlighting the seasonal variation of PV electricity generation [85]. It is worth mentioning that the capacity utilization index is defined as the ratio of the final AC energy output (kWh) of a PV system over a specific period, to the AC rating (kW) of the plant, for the same time period, under STC.
The allocation of the monthly energy consumption presented in Figure 3 is the average energy consumption per month for a 10-years period (according to available climate data for the area of Athens). Indicatively, Figure 4 shows the monthly variation of solar irradiation, compared to the 10 years corresponding average value [88]. Similarly, Figure 5 shows the monthly variation of temperature; those data corroborate the proposed 10-years period of analysis, in order to take into account any climatic conditions deviations [88].
In order to calculate the PV energy production evolution over the period of analysis, the same climate data for the area of Athens are considered. In Figure 6, the 10-years period average energy production of the PV system per month in contrast to the monthly energy consumption of the building is presented.
As it is referred in Section 2.3, the electrical energy consumption of the building is higher due to the heat pumps operation. This is confirmed by Figure 6, comparing the electrical load of the building (referring strictly to building electrical appliances—pure electric energy) with the total electrical energy consumption during the heating/cooling operation of the heat pumps. Also, Figure 6 denotes the deviations between PV generation and load electrical demand on a monthly basis; during high electrical energy consumption intervals, the excessive energy needed is supplied by the electricity grid. The reverse electrical energy flow takes place during low load intervals, where the excessive PV energy production is supplied to the grid or to the EESU (as it is analyzed in Section 2.5), in order to balance the energy transactions between the building system and the electricity grid. In this context, it is noted that under the net-metering scheme the prosumers are allowed to inject the excessive amount of the produced PV electricity into the grid and use it at a later time to offset their consumption (when their renewable generation is absent or not sufficient).
In any case, according to the above-mentioned data, by the end of the 10-years period the total electric energy supply by the grid is estimated to be 924 kWhe, considering there is not any EESU installed. This amount of energy accounts for the 0.279% of the energy consumption of the building in the 10-years period. Having that in mind, the proposed residential building is characterized as a nZEB, indeed.

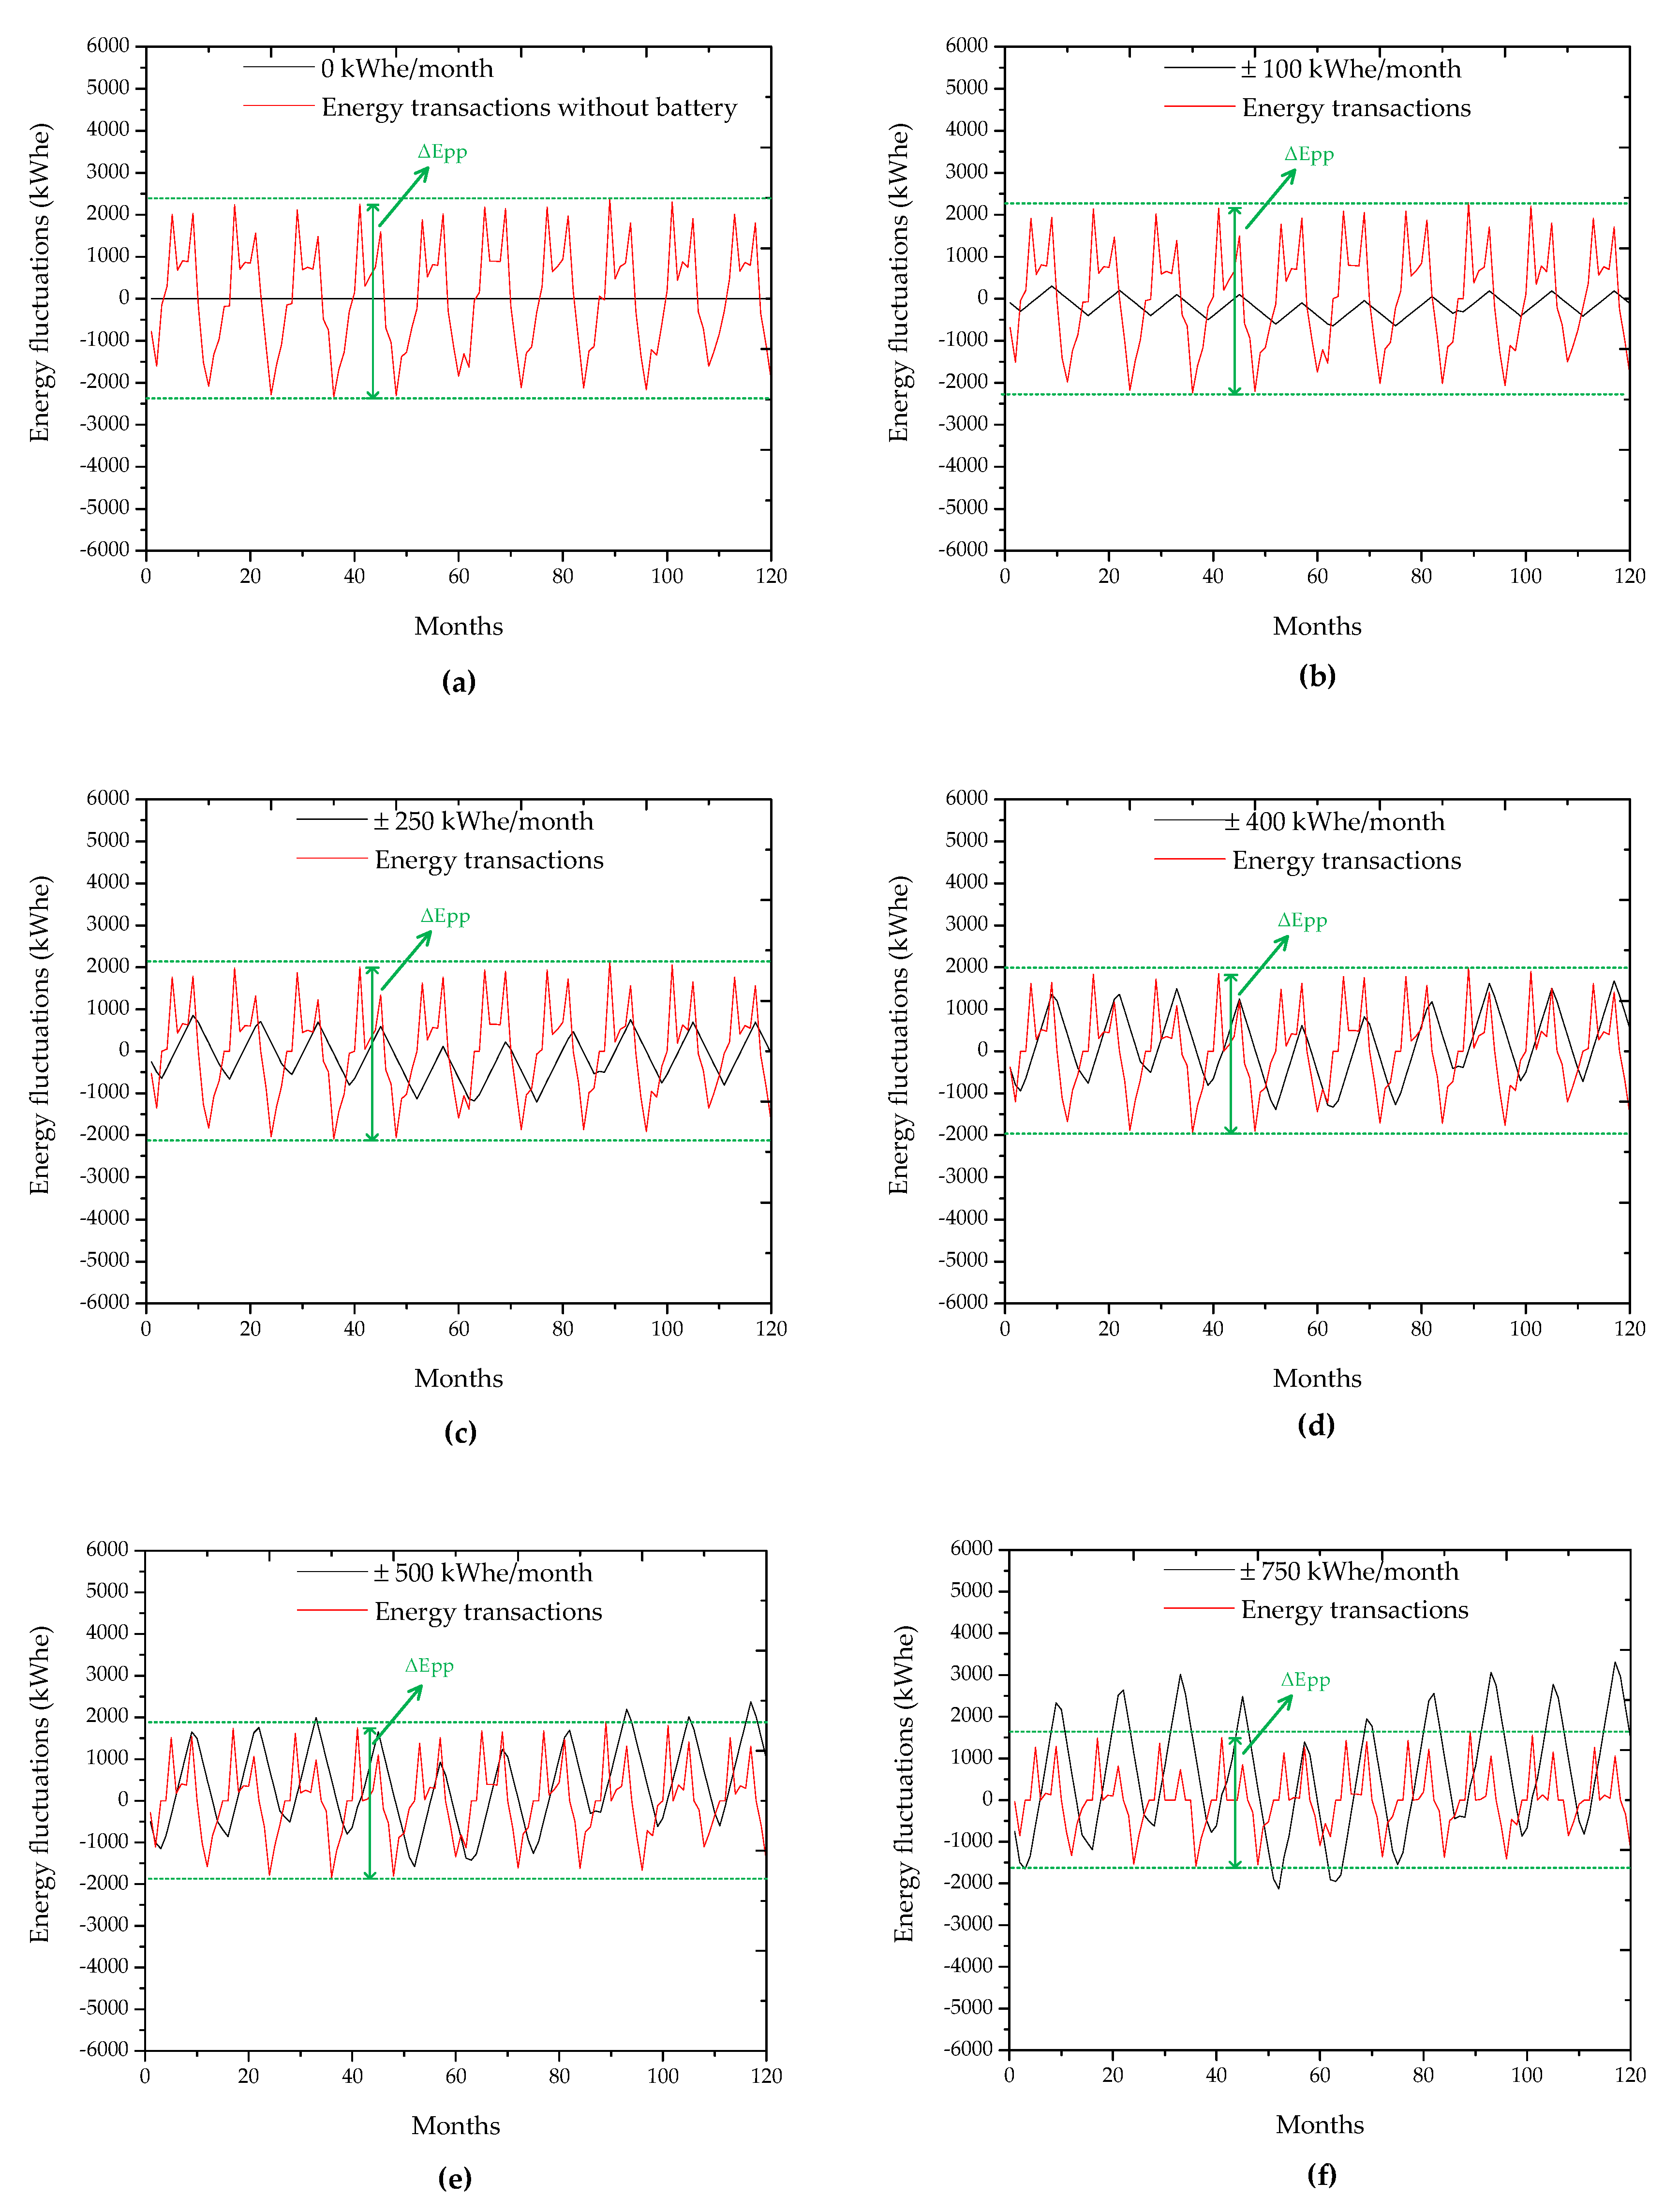
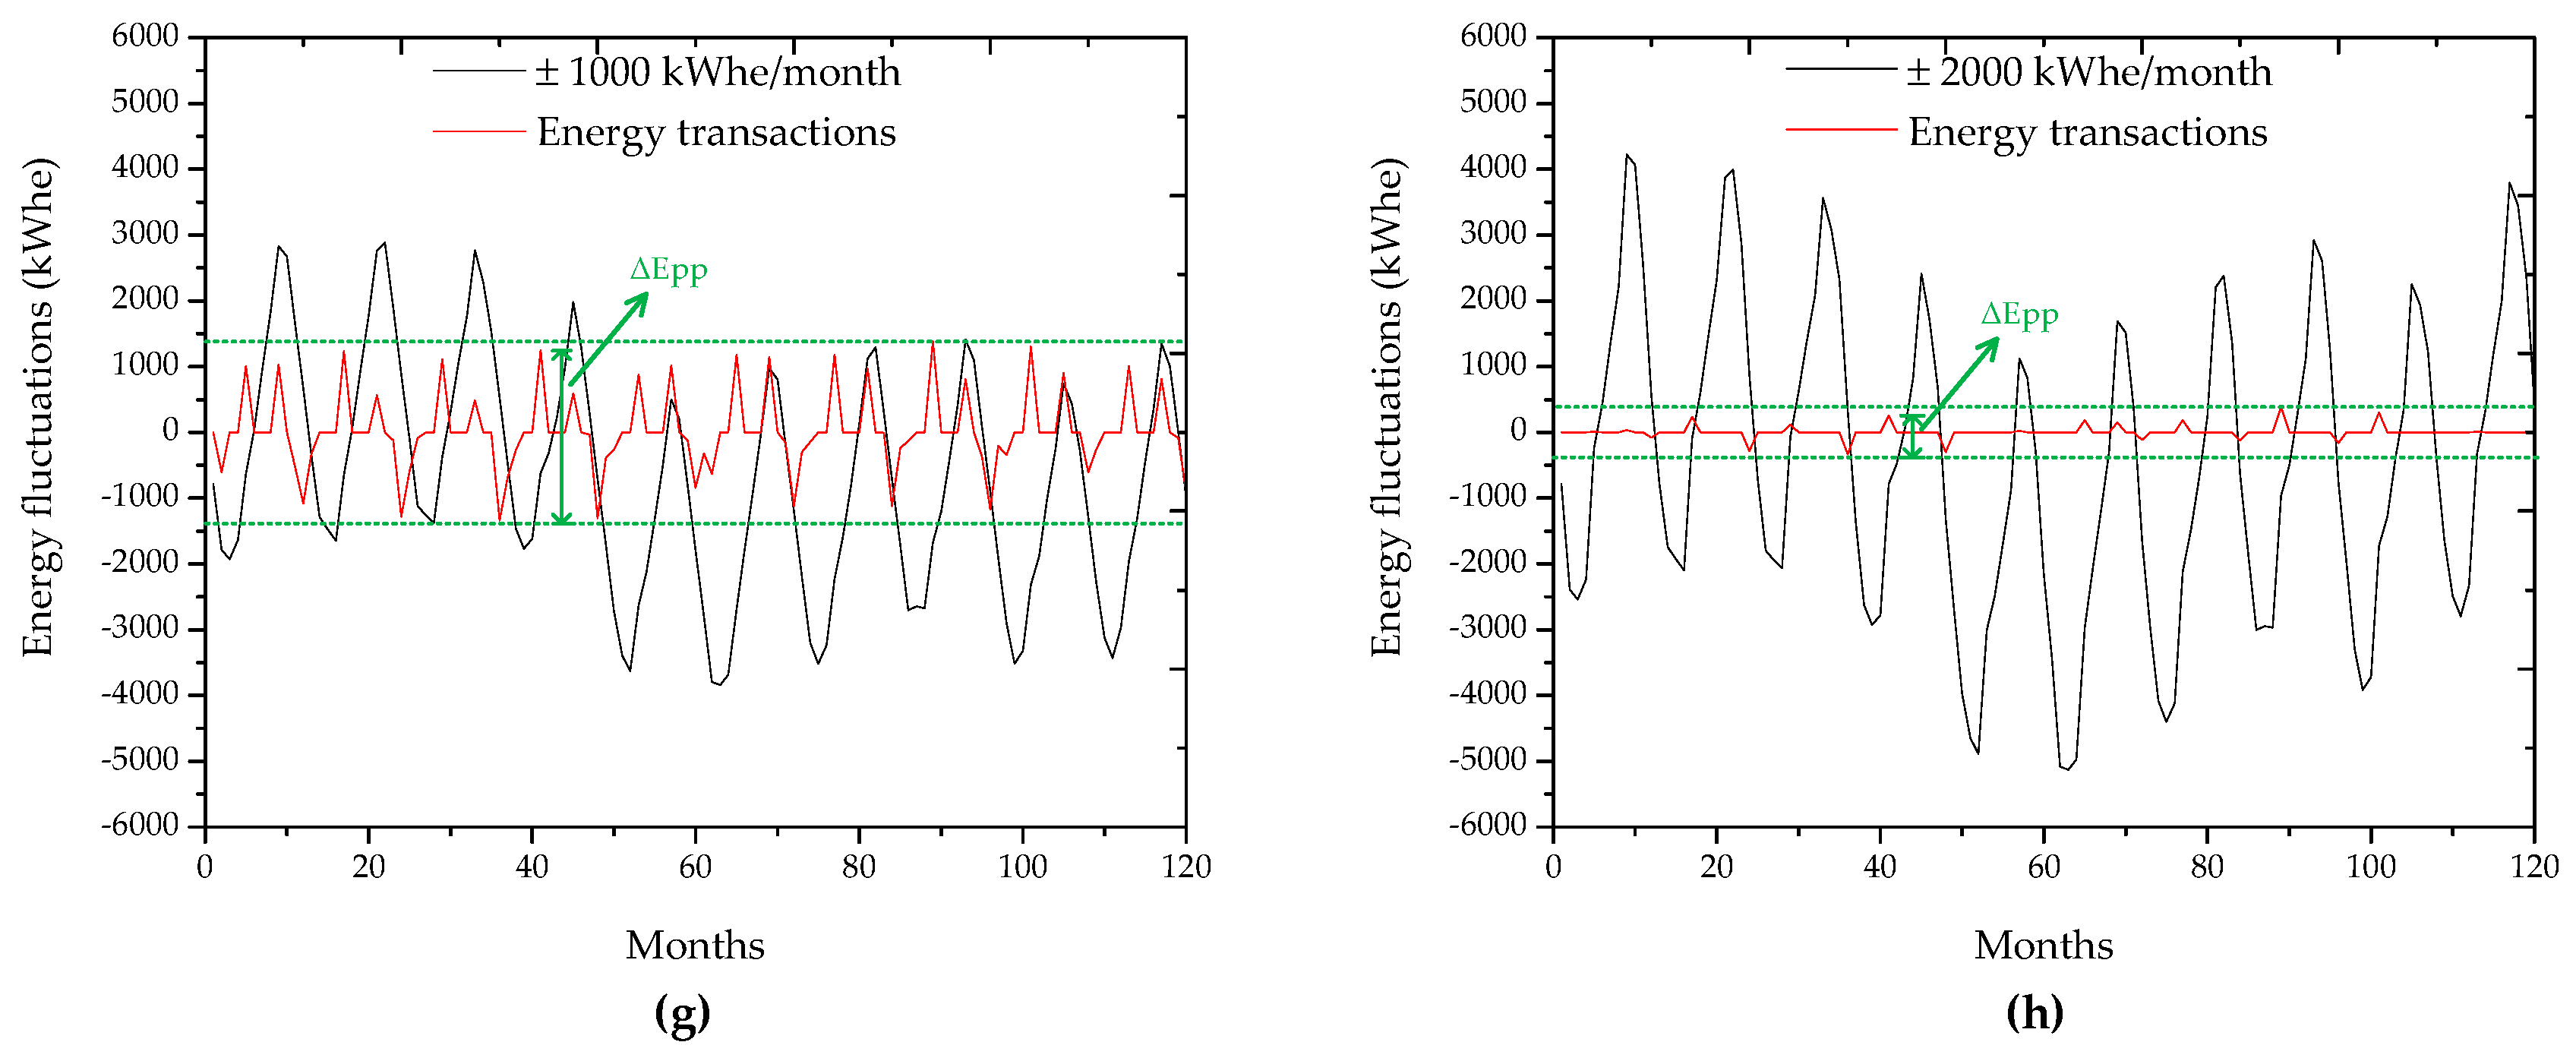
2.5. Sizing of the Electrical Energy Storage Unit

In the previous section, the amount of energy transactions considering the collective self-consumption nZEB concept without using EESUs was defined. In this section, the use of EESUs is presented, in order to reduce the energy transactions between the building and the electricity grid.
The EESU sizing is based on the energy fluctuations limitation (among the nZEB and the grid) per month. In this context, Figure 7 shows the energy exchanges per month (10-years window) for the EESU, as well as the energy transactions reduction (and the corresponding storage capacity). The maximum permitted monthly fluctuation in the EESU, ΔΕstorage,month, is set in the following scenarios, i.e., ± 100, ± 250, ± 400, ± 500, ± 750, ± 1000 and ± 2000 kWhe.
The amount of energy that can be stored in the EESU depends on its acceptable maximum (SOCmax) and minimum (SOCmin) state of charge values. In this paper, it is assumed that SOCmin is 10% of the peak-to-peak stored energy fluctuation (ΔΕpeak-to-peak). Thus, the required storage capacity, Cstorage, can be expressed as:
Cstorage = SOCmin + ΔΕpeak-to-peak
During the EESU charging mode, the electrical energy is considered positive and vice versa. Table 3 shows the required storage capacity of each scenario, according to Equation (1) and the energy flows shown in Figure 7.
The importance of sizing EESUs for the proposed collective self-consumption nZEB concept is related to the energy transactions with the electricity grid. This interrelation is presented in Figure 7; the more storage capacity is used (black line), the less energy transactions appear (red line). Of course, in case that not any EESU is used, the energy transactions with the grid are equal to the balance between the PV energy production and the energy consumption of the building. On the other hand, in case of 2000 kWhe per month permitted storage energy fluctuations, the energy transactions between the nZEB and the grid are mitigated. However, according to Table 3, this calls for unrealistic EESU capacities for building applications. Another deterrent for such an EESU scenario is its high cost and the danger for the residents and the building itself in case of damage. The economic analysis of the proposed system with and without an EESU is presented in the following sections.
Although all nZEBs do not present the same profile and size of power transactions with the electricity grid, their PV production is maximized at the same time interval (i.e., during midday). Having in mind the energy flows showed in Figure 7 (with and without EESUs) and considering a high penetration level of residential PV systems, it is concluded that various hazardous operating conditions (such as voltage rise, fault tripping and poor coordination of grid protection devices) could be emerged for the electricity grid [89]. Bearing in mind the above issues, the importance of EESU installation in nZEBs is highlighted—as a measure to secure electric grid operation.

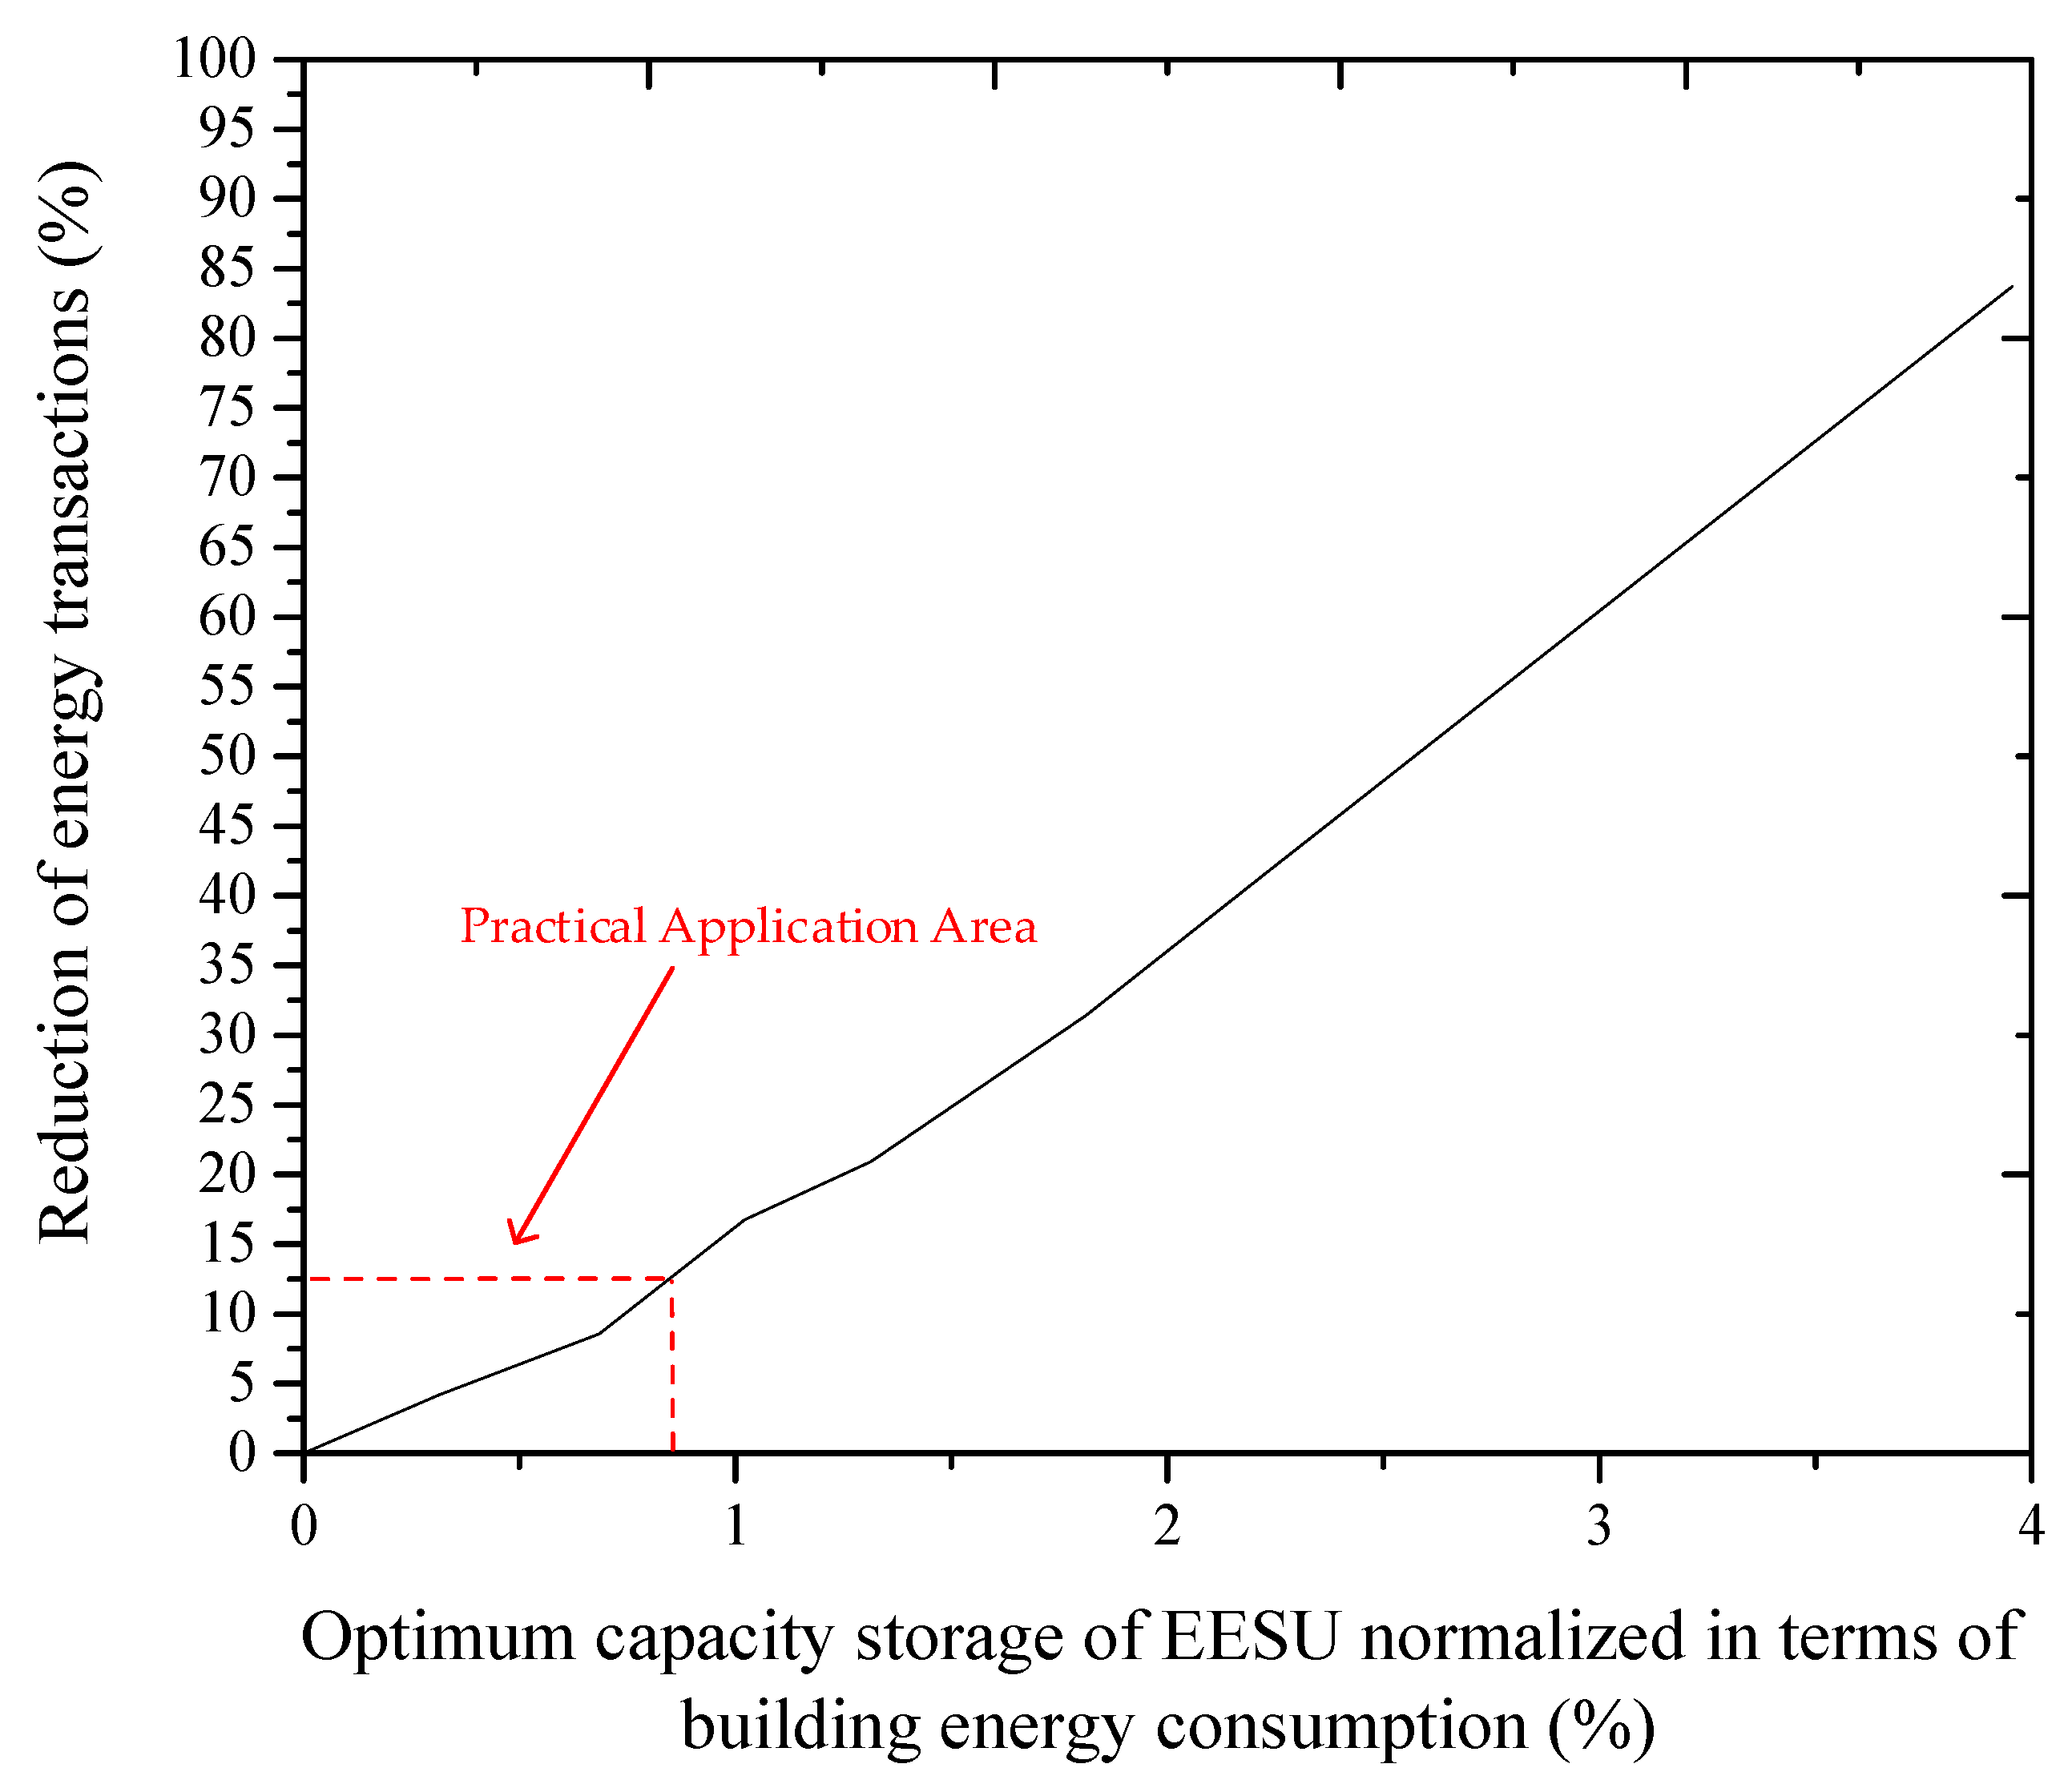
2.6. Optimal EESU Sizing

In this section, an optimization sizing methodology for the EESU is proposed.
The optimal selection of the required storage capacity is based on the analysis presented in Section 2.5. In this context, the optimal storage capacity can be calculated using the following cost function:
e ( K ) = | C s t o r a g e C s t o r a g e , r e f C s t o r a g e , r e f | + | Δ E g r i d , m o n t h Δ E g r i d , m o n t h , r e f Δ E g r i d , m o n t h , r e f |
where Cstorage corresponds to the storage capacity of the EESU in kWhe, derived by Equation (1), ΔΕgrid,month is the absolute value of the maximum energy transaction between the building and the electricity grid during the 10-years period, in kWhe. Cstorage,ref and ΔΕgrid,month,ref, are the reference values (weighting factors).
Also, the normalized variable K is defined by Equation (3):
K = Δ E s t o r a g e , m o n t h Δ E s t o r a g e , m o n t h , r e f
where ΔΕstorage,month represents the maximum energy amount that can be stored in the EESU or it can be supplied to the building by the EESU, in kWhe. In Equation (3), ΔΕstorage,month,ref is arbitrary selected to be 250 kWhe, and so variable K becomes an integer number which ranges between 0 and 8 (in regard to the scenarios discussed in Section 2.5).
In order to find the optimal storage capacity, the cost function must be minimized; according to the procedure described above, this means that the optimal EESU capacity is based on the energy transactions between the building and the electricity grid. Thus, in Table 4, the results of the optimization process regarding the EESU sizing is presented. Also, the reduction of the energy transactions for the optimum capacity of the EESU normalized in terms of building energy consumption (considering the nZEB concept), is illustrated in Figure 8.
As shown in Figure 8, this study comes up to the conclusion that energy transactions between the building and the electricity grid reduce to a significant extent as the storage capacity increases (peak shavings). Moreover, it is estimated that the optimum EESU capacity is only a small ratio of the total energy consumption of the building during this 10-years period of analysis. The area below the red line shows that values from 0% to 0.68% refer to the practical application area, as higher energy storage values are not applicable at building level. Apparently, the increase of the EESU capacity enhances the independence from the electricity grid; however, as it will be discussed next, the investment cost is about to be extremely high. Last but not least, the results in Figure 8 highlight the effectiveness of the proposed collective self-consumption nZEB concept for multi-family buildings, as considerable EESU capacities can be exploited, reducing notably the energy transactions with the distribution grid.

3. Techno-Economic Analysis and Discussions

3.1. The LCCA Method

After the technical analysis of the energy system, in this section the cost-effectiveness of the proposed collective self-consumption nZEB is analyzed and discussed. As already noted, another important issue of this work is to calculate the total cost of the proposed investment, in order to estimate the payback period. The cost-effectiveness of the investment is the result of the LCCA method, by using the mathematical calculation procedure that will be fully analyzed in next sections. For the sake of calculations, LCCA is conducted for 25 years instead of 10 years. The option of the 25 years period analysis is related to the life cycle of the PV system.
In order to calculate the total life cycle cost of the abovementioned RES and EESU technologies combination, some economic and time parameters will be used, as presented in Table 5.
The LCCA method calculates the total life cycle cost of the system, considering any future costs that are reduced to their present value (PV). In general, the reduction to present value of any investment, considering its increase due to the parameter of the inflation rate, is calculated as:
P V = X × 1 d g × [ 1 ( 1 + g 1 + d ) N ] = X × P V F ( d , g , N )
The purpose of the LCCA method used in this paper is to calculate:
(a)
the Initial Cost (IC) of the investment, and
(b)
the payback period of the proposed investment.
The total present value of the proposed investment (PVTOT), is calculated by using Equation (5):
P V T O T = P V S Y S + P V M I S C + P V R E P + P V E N E R t × P V I N T P V I T C P V S V
The parameters of Equation (4) will be described in next paragraphs, by giving their mathematical expressions:
(i) Present value of the total system costs (PVSYS)
P V S Y S = D × I C + P V L O A N
PVLOAN is expressed by Equation (7):
P V L O A N = ( 1 D ) × I C × P V F ( d , 0 , N Δ ) P V F ( i , 0 , N Δ ) ,   N N
(ii) Present value of annual interest (PVINT)
P V I N T = ( 1 D ) × I C × { P V F ( d , i , N 1 ) × [ i 1 P V F ( i , 0 , N Δ ) ] + P V F ( d , 0 , N 1 ) P V F ( d , 0 , N Δ ) }
where: N 1 = m i n ( N Δ , N ) and D = 0 (zero down payment is considered).
(iii) Present value of the funding of the investment (PVITC)
P V I T C = I 1 + D
(iv) Present value of operation and maintenance costs (PVMISC)
P V M I S C = O M × P V F ( d , g , N )
OM costs are repetitive costs during the analysis period and can be calculated by using Equation (10):
(v) Present value of the energy cost that is supplied by the grid-according to the net metering scheme (PVENER)
P V E N E R = E × P V F ( d , e , N )
(vi) Present value of the replacement costs (PVREP)
In many cases it may be necessary to replace some of the subsystems. The present value of the replacement cost is calculated by using Equation (12):
P V R E P = R ( 1 + g ) k = 1 r ( 1 + g 1 + d ) N k r + 1
(vii) Present value of the remaining value at the end of the life cycle (PVSV)
The PVSV calculation is related to the life cycle of the system. Given that PVSV is difficult to be estimated, it is a common practice to extend the period of analysis up to the expected life period of the system. This is the reason for the LCCA extension to 25-years period, and so PVSV becomes:
P V S V = 0
In next subsections, the LCCA of the building energy consumption and the proposed energy system is presented, according to the LCCA method analyzed above.

3.2. LCCA of the Proposed Energy System

In this section the results of the LCC calculations are presented. First, the total LCC of the building energy consumption before the installation of the proposed energy system is described. Then, the total LCC of the PV, the geothermal system and the EESU will be calculated.

3.2.1. LCCA of the Building Energy Consumption

As referred above, the annual electrical and thermal energy consumption is 26,400 kWhe/y and 31,464 kWhth, respectively. Before the installation of the proposed energy system, the total energy consumption was covered by using the electricity grid and a diesel-boiler plant. According to the current rate prices of the electric energy and the diesel oil for heating purposes in Greece [90,91], the total annual costs of each consumption are 6391€ and 2260€, respectively. The rest costs of the building, according to the LCCA method, as well as some practical commercial data, are regarded as:
Initial Cost = 0€
Annual operation and maintenance costs = 700€
Replacement costs = 1500€ (i.e., replacement of the diesel boiler plant, r = 1)
Total energy cost = 8651€
Residual value at the end of the life cycle = 0€
Rate of subsidy = 0%
Thus, using Equations (5)–(13), as well as the data in Table 5, the total LCC of the building energy consumption is roughly 263k€. This total cost is essential in order to estimate the payback period and the energy and cost savings achieved by the proposed transformation to nZEB.
Next, the LCCA method is used for the proposed energy system, considering the net metering scheme; after the estimation of the total Initial Cost of the investment and the calculation of the total LCC of the system (LCCTOTAL), the rate of the required subsidy is calculated, in order to make the whole investment sustainable.

3.2.2. LCCA of the PV System

As described in Section 2.4, the PV system is of 21 kWp nominal power in order to cover the 33,068 kWhe of electrical consumption. According to the LCCA method, as well as some practical commercial data, the costs of the PV system are estimated further down:
PV system cost = 21,600€
Annual operation and maintenance costs = 500 €/y
Other costs (insurance etc.) = 1200 €/y
Installation and interconnection costs (according to the Hellenic Electricity Distribution Network Operator) = 500€
Thus, the total Initial Cost of the PV system is roughly 22,100€. So, using Equation (5) and the data in Table 5, the total LCC of the PV system becomes 97,197€. Also, according to the LCC of the building energy consumption, the annual energy savings due to the PV energy production are equal to 6391 €/y.

3.2.3. LCCA of the Geothermal Energy System

The geothermal energy system has been designed to cover the 31,464 kWhth of thermal energy consumption. According to the LCC method, as well as some practical commercial data, the costs of the geothermal energy system are:
Initial Cost (construction costs of vertical loop system for 6 dwellings of 150 m2) = 60,000€
Annual operation and maintenance costs = 4000 €/y
Replacement costs (one replacement of the heat pump unit) = 4500 €/y
Thus, the total LCC of the geothermal energy system is roughly 239 k€. Also, in comparison with the LCC of the building energy consumption, the annual energy savings due to the thermal production from the geothermal energy system are 2260 €/y.

3.2.4. LCCA of the TES Unit

As referred in Section 2.3, the TES unit is a 40 m3 volume underground cylindrical water tank. The various costs of the TES system (according to some practical commercial data) are presented further down:
Tank cost (0.8€/lt) = 32,000€
Total Excavation costs (6 €/m3) = 240€
Annual operation and maintenance costs = 640 €/y
Hence, the total Initial Cost of the TES is 32,240€, and the total LCC is 66,645€.

3.2.5. LCCA of the EESU

The EESU consists of a Li-ion battery bank. As discussed in Section 2.5, this study considers a number of alternative EESU capacity scenarios, in order to minimize the energy transactions between the building and the electricity grid on a monthly, yearly and 10-years basis. Thus, LCC is proceeded for all storage capacity scenarios and the LCCTOTAL calculations of the whole investment are summarized in Table 6.
Several organizations have performed market analysis on Li-ion batteries (which is the selected EESU for our case too), providing forecasts regarding their price evolution over the next decades on the basis of some techno-economical hypotheses [92,93,94,95]. However, in the present work the considered future price formation of Li-ion batteries lies on the study of Bloomberg New Energy Finance Organization [91], due to the fact that these forecasts are the main scenario for the relevant market players. Thus, the present cost of Li-ion batteries is considered to be 162.5 €/kWh [92]. It is noted that at the 13th year (i.e., the year 2033) of the analysis period the EESU is going to be replaced. However, the cost of Li-ion batteries by this year is foreseen to be reduced to 74 €/kWh [92]. The various costs of the EESU system (taking into account some practical commercial data) are presented further down:
Annual operation and maintenance costs = 2% of the Initial Cost
Other costs (insurance etc.) = 1650 €/y
Cost of inverter unit = 150 €/kW
Cost of EESU activation = 150€
Cost for connection with the electricity grid = 300€.
In order to calculate the total LCC of the proposed investment, the regime of the net metering concept is also considered. According to the requirements of the Greek Net Metering scheme, prosumers avoid all charges (such as competitive charges, transmission and distribution grid charges, CO2 emissions fees) for the electricity that they self-produce and consume simultaneously (self-utilization), with the sole exception of the social services fees. The excess energy (which is injected into the grid) is compensated with consumed energy; however, only competitive charges are subject to compensation.
As referred in Section 3.2.1, the LCC of the investment is calculated considering both self-consumed and injected PV electric energy. According to the household bills released by the HEDNO, the competitive charges for the electricity procurement are 0.04364 €/kWhe. On the other hand, the surplus energy injected to the electricity grid is not credited.
The total amount of the excessive PV electricity which is injected into the grid and can be used at a later time on the 25-year basis, as well as the total cost that must be paid for this amount of PV energy, are presented in Table 7. Hereinafter and for the purposes of this study, the not directly consumed PV energy is referred as “absorbed energy”.
The cost of the absorbed energy (under the net metering scheme), after the reduction to its present value (PVABSORBED), is calculated using Equation (14):
P V A B S O R B E D = E A B S O R B E D × 0.04364 × 1 d e × [ 1 ( 1 + e 1 + d ) N ] = E A B S O R B E D × 0.04364 × P V F ( d , e , N )
Next, the results of the total LCC of the proposed investment is presented in Table 6, by using Equation (15):
P V T O T A L = P V S Y S + P V M I S C + P V E N E R + P V R E P + P V A B S O R B E D t × P V I N T P V I T C P V S V
In addition, Table 7 depicts the necessary rate of subsidy for the investment depreciation within the 25-years period of analysis. According to these results, it seems that the proposed transformation to nZEB may remain sustainable as long as the installed EESU capacity remains below 400 kWh. This is an important outcome of this work, as it gives a concise sizing EESU capacity figure for the Mediterranean area, which can be exploited by the local subsidy policies that are about to be undertaken in order to transform the building sector into a nZEB one. Furthermore, the results in Table 7 highlight the fact that the installation of EESUs in an upper distribution level is more effective, in order to accommodate multiple nZEBs, e.g., in a common LVDS; hence, the mitigation of energy transactions with the electrical grid calls for the common share of larger-scale EESUs in the frame of LVDS and/or Energy Communities [96,97]. Thus, Energy Communities can become beneficial for the reliability and the power quality of the grid.

4. Conclusions

This paper has proposed an efficient combination of RES technologies installed on a typical multi-family residential building in the urban environment, focusing on the Mediterranean area. This hybrid energy system consists of a PV and a geothermal unit, in order to meet electrical, thermal and cooling load demands. Furthermore, a methodology for sizing ESUs for thermal/cooling and electrical loads has been fully analyzed, so that the whole system has been designed considering the nZEB concept.
The technology that exploits geothermal energy is very efficient and environmentally friendly. However, an appropriate TES unit is needed, to meet thermal load deviations. In this paper, the TES has been sized so as to cover maximum load needs at any time of the year. This is a significant issue, as the main geothermal unit can balance only the average annual thermal/cooling load demand. The TES volume should be carefully designed, so that it could be undergroundly installed.
The analysis of the total life cycle cost of the proposed nZEB concept highlighted the fact that the proposed collective self-consumption nZEB concept for multi-family buildings is a sustainable way to transform the building sector of the Mediterranean area into a nZEB one; as for the installation of EESUs, this is facilitated by the collective self-consumption nZEB concept, according to the outcomes of this work. Nevertheless, as previously discussed, a great potential is foreseen in installing larger EESUs at LVDS level or in the frame of Energy Communities concept, enhancing so the reliability and the power quality of the electrical grid.
Moreover, the proposed collective self-consumption nZEB concept could be applicable even in large scale buildings, where there is no available space for RES systems to be installed, by exploiting the advantages of virtual net metering scheme.
As far as EESUs are concerned, an optimal methodology has been presented for their sizing, taking into account the corresponding energy transactions with the electricity grid. EESUs installation importance is given, as the more EESU capacity, the less energy transactions with the electricity grid are observed. In this context, the proposed dimensioning methodology contributes to avoid a negative impact on the operation of the electricity grid (such as reverse power flow, voltage rise, false tripping of protection measures, etc.) as a result of the increased penetration of residential PV systems into the same feeder.
Indeed, as we reach the 2030 target, the number of nZEB buildings and the capacity of intermittent RES systems (mainly PVs in densely populated areas) will be increasing, whilst electricity system inertia will be decreasing due to the replacement of synchronous generators with electronically coupled RES units. Thus, in order to secure the operation of the electricity grid and to avoid a curtailment operation for the RES units, mass EESUs installation either in the electricity grid or buildings is presumed. Therefore, the analysis on the energy transactions between nZEBs and the electricity grid as well as the optimal sizing of EESUs that have been presented in this work are of great interest for DSOs and policy makers, providing insightful assessments on the necessity of subsidy programs for nZEB transformation as well as on the grid impact due to the fluctuating production profile of PVs.

Author Contributions

Conceptualization, F.K., A.K. and N.P.; methodology, F.K., A.K. and N.P.; software, F.K. and A.K.; validation, A.K. and N.P.; formal analysis, F.K., A.K. and N.P.; investigation, F.K. and A.K.; data curation, N.P.; writing—original draft preparation, F.K.; writing—review and editing, A.K. and N.P.; visualization, A.K.; supervision, N.P.; funding acquisition, A.K. and N.P. All authors have read and agreed to the published version of the manuscript.

Funding

The research leading to these results has received partial funding from the European Union HORIZON 2020 Programme “EU HEROES” under grant agreement no 764805. The authors are solely responsible for the content of this publication.

Conflicts of Interest

The authors declare no conflict of interest.

Nomenclature

ACAlternative Current
ASHPAir-source heat pump
BAPVBuilding Applied Photovoltaic System
BEABuilding Energy Analysis
BHEsBorehole heat exchangers
BIPVBuilding Integrated Photovoltaic System
BIPV/TBuilding Integrated Photovoltaic/Thermal system
CCHPCombined cooling, heating and power system
CHPCooling, heating and power system or cogeneration system
CO2Carbon dioxide
COPCoefficient of performance
CstorageStorage capacity (kWhe)
Cstorage,refReference value of storage capacity (kWhe)
dDiscount rate (%)
DDown payment (%)
DHWDomestic hot water
DSODistribution System Operator
eEscalation of energy costs (%)
e(K)Cost function of optimal storage capacity
EAnnual cost of the energy (€)
EABSORBEDAbsorbed energy (€)
EAHPExhaust air heat pump
EEREnergy efficiency ratio
EESUElectrical energy storage unit
ESSEnergy storage system
ESUsEnergy storage units
EUEuropean Union
gInflation rate (%)
GCHPGound-coupled heat pump
GDHSGeothermal district heating system
GHEsGeothermal heat exchangers or Ground heat exchangers
GHPGeothermal heat pump
GSHPGround-source heat pump
GWHPGround-water heat pump
HEDNOHellenic Electricity Distribution Network Operator
HPSUHeat pump storage unit
HVACHeating, ventilation and air-conditioning
iBorrowing rate (%)
IFunding of the investment (%)
ICInitial Cost (€)
KNormalized variable
LCCTOTALTotal life cycle cost of the building (€)
LCCALife Cycle Cost Assessment
Li-ionLithium iodide battery
LPGLiquified Pretroleum Gas
LVDSLow Voltage Distribution System
NPeriod of analysis (years)
N1The minimum between N and N1 (years)
NΔBorrowing period (years)
nZEBnearly Zero Energy Building
OMOperation and Maintenace (€)
PVPhotovoltaic system
PVPresent Value (€)
PVABSORBEDPresent value of absorbed energy (€)
PVENERPresent value of the energy cost that is supplied by the grid (€)
PVINTPresent value of the annual interest (€)
PVITCPresent value of the funding of the investment (€)
PVLOANPresent value of the lean installment (€)
PVMISCPresent value of the various costs during the life cycle, such as maintenance costs (€)
PVREPPresent value of the replacement costs (€)
PVSYSPresent value of total system cost (€)
PVSVPresent value of the system remaining value at the end of the period of analysis (€)
PVTOTALTotal present value of the investment (€)
PVFPresent Value Function (€)
PV/GHPPhotovoltaic/Geothermal heat pump system
PV/STPhotovoltaic/Solar thermal system
PV/TPhotovoltaic/Thermal system
rThe number of replacements during the analysis period
RReplacement cost of a subsystem with reference to the first year of operation (€)
RESRenewable Energy Sources
SOCmaxMaximum State of Charge value (%)
SOCminMimimum State of Charge value (%)
STCStandard Test Conditions
tIncome tax (%)
TESThermal energy storage
UTESUnderground thermal energy storage
WPPWind power plant
XAny investment to be analyzed (€)
ΔEgrid, monthAbsolute value of the maximum energy transaction between the building and the electricity grid during the 10 – years period (kWhe)
ΔEgrid, month,refReference value of maximum energy transaction between the building and the electricity grid during the 10 – years period (kWhe)
ΔEpeak-to-peakPeak-to-peak stored energy fluctuation in EESU (kWhe)
ΔEstorage, monthMaximum permitted energy fluctuation in the EESU per month (kWhe)
ΔEstorage, month,refReference value of maximum permitted energy fluctuation in the EESU per month (kWhe)

References

  1. D’ Agostino, D.; Mazzarella, L. What is a Nearly zero energy building? Overview, implementation and comparison of definitions. J. Build. Eng. 2019, 21, 200–212. [Google Scholar] [CrossRef]
  2. Green Paper, A 2030 Framework for Climate and Energy Policies COM 169. Available online: https://eur-lex.europa.eu/legal-content/EN/TXT/PDF/?uri=CELEX:52013DC0169&from=EN (accessed on 23 January 2020).
  3. EU. Directive 2010/31/EU 2010 of the European Parliament and of the Council of 19 May 2010 on the Energy Performance of Buildings (recast). Available online: https://eur-lex.europa.eu/legal-content/EN/TXT/PDF/?uri=CELEX:32010L0031&from=el (accessed on 10 January 2020).
  4. EU. Directive 2018/844 of the European Parliament and of the Council of 30 May 2018, Amending Directive 2010/31/EU on the Energy Performance of Buildings and Directive 2012/27/EU on Energy Efficiency. Available online: https://eur-lex.europa.eu/legal-content/EN/TXT/?uri=uriserv%3AOJ.L_.2018.156.01.0075.01.ENG (accessed on 7 February 2020).
  5. Kyritsis, A.; Mathas, E.; Antonucci, D.; Grottke, Μ.; Tselepis, S. Energy improvement of office buildings in Southern Europe. Energy Build. 2016, 123, 17–33. [Google Scholar] [CrossRef]
  6. Carli, R.; Dotoli, M. Decentralized control for residential energy management of a smart users ’ microgrid with renewable energy exchange. IEEE/CAA J. Autom. Sin. 2019, 6, 641–656. [Google Scholar] [CrossRef]
  7. Geidl, M.; Koeppel, G.; Favre-Perrod, P.; Klockl, B.; Andersson, G.; Frohlich, K. Energy hubs for the future. IEEE Power Energy Mag. 2007, 5, 24–30. [Google Scholar] [CrossRef]
  8. Hosseini, S.M.; Carli, R.; Dotoli, M. Robust Day-Ahead Energy Scheduling of a Smart Residential User Under Uncertainty. In Proceedings of the 2019 18th European Control Conference (ECC), Naples, Italy, 25–28 June 2019; pp. 935–940. [Google Scholar] [CrossRef]
  9. Park, S.; Salkuti, S.R. Optimal Energy Management of Railroad Electrical Systems with Renewable Energy and Energy Storage Systems. Sustainability 2019, 11, 6293. [Google Scholar] [CrossRef] [Green Version]
  10. EU. Directive 2018/2001 of the European Parliament and of the Council of 11 December 2018 on the Promotion of the Use of Energy from Renewable Sources (Recast). Available online: https://eur-lex.europa.eu/legalcontent/EN/TXT/PDF/?uri=CELEX:32018L2001&qid=1580204680261&from=EN (accessed on 10 January 2020).
  11. CEER Report C18-CRM9_DS7-05-03, 25. Regulatory Aspects of Self-Consumption and Energy Communities, Council of European Energy Regulators Asbl. Available online: https://www.ceer.eu/documents/104400/-/-/8ee38e61-a802-bd6f-db27-4fb61aa6eb6a (accessed on 10 January 2020).
  12. Marsza, A.J.; Heiselberg, P.; Bourrelle, J.S.; Musall, E.; Voss, K.; Sartori, I.; Napolitano, A. Zero Energy Building–A review of definitions and calculation methodologies. Energy Build. 2011, 43, 971–979. [Google Scholar] [CrossRef]
  13. Cao, X.; Dai, X.; Liu, J. Building energy-consumption status worldwide and the state of- the-art technologies for zero-energy buildings during the past decade. Energy Build. 2016, 128, 198–213. [Google Scholar] [CrossRef]
  14. Semprini, G.; Gulli, R.; Ferrante, A. Deep regeneration vs shallow renovation to achieve nearly Zero Energy in existing buildings: Energy saving and economic impact of design solutions in the housing stock of Bologna. Energy Build. 2017, 156, 327–342. [Google Scholar] [CrossRef]
  15. Ferrante, A.; Cascella, M.T. Zero energy balance and zero on-site CO2 emission housing development in the Mediterranean climate. Energy Build. 2011, 43, 2002–2010. [Google Scholar] [CrossRef]
  16. Ascione, F.; Borrelli, M.; Francesca De Masi, R.; de Rossi, F.; Vanoli, G.P. A framework for nZEB design in Mediterranean climate: Design, building and set-up monitoring of a lab-small villa. Sol. Energy 2019, 184, 11–29. [Google Scholar] [CrossRef]
  17. Gaglia, A.G.; Dialynas, E.N.; Argiriou, A.A.; Kostopoulou, E.; Laskos, K.M. Energy performance of European residential buildings: Energy use, technical and environmental characteristics of the Greek residential sector–energy conservation and CO₂ reduction. Energy Build. 2019, 183, 86–104. [Google Scholar] [CrossRef]
  18. Rey, F.J.; Velasco, E.; Varela, F. Building energy analysis (BEA): A methodology to assess building energy labeling. Energy Build. 2007, 39, 709–716. [Google Scholar] [CrossRef]
  19. Calero, M.; Alameda-Hernandez, E.; Fernández-Serrano, M.; Ronda, A.; Martín-Lara, M.Á. Energy consumption reduction proposals for thermal systems in residential buildings. Energy Build. 2018, 175, 121–130. [Google Scholar] [CrossRef]
  20. Pacheco, R.; Ordóñez, J.; Martínez, G. Energy efficient design of building: A review. Renew. Sustain. Energy Rev. 2012, 16, 3559–3573. [Google Scholar] [CrossRef]
  21. Feng, Y. Thermal design standards for energy efficiency of residential buildings in hot summer/cold winter zones. Energy Build. 2004, 36, 1309–1312. [Google Scholar] [CrossRef]
  22. Kampelis, N.; Gobakis, K.; Vagias, V.; Kolokotsa, D.; Standardi, L.; Isidori, D.; Cristalli, C.; Montagninoc, F.M.; Paredes, F.; Muratore, P.; et al. Evaluation of the performance gap in industrial, residential & tertiary near-Zero energy buildings. Energy Build. 2017, 148, 58–73. [Google Scholar] [CrossRef] [Green Version]
  23. Karlessi, T.; Kampelis, N.; Kolokotsa, D.; Santamouris, M.; Standardi, L.; Isidori, D.; Cristalli, C. The concept of smart an nZEB buildings and the integrated design approach. Procedia Eng. 2017, 180, 1316–1325. [Google Scholar] [CrossRef]
  24. Kalogirou, S.A.A.; Tripanagnostopoulos, Y. Hybrid PV/T solar systems for domestic hot water and electricity production. Energy Convers. Manag. 2006, 47, 3368–3382. [Google Scholar] [CrossRef]
  25. Yin, H.M.; Yang, D.J.; Kelly, G.; Garant, J. Design and performance of a novel building integrated PV/thermal system for energy efficiency of buildings. Sol. Energy 2013, 87, 184–195. [Google Scholar] [CrossRef]
  26. Delisle, V.; Kummert, M. A novel approach to compare building-integrated photovoltaics/thermal air collectors to side-by-side PV modules and solar thermal collectors. Sol. Energy 2014, 100, 50–65. [Google Scholar] [CrossRef]
  27. Agrawal, B.; Tiwari, G.N. Optimizing the energy and exergy of building integrated photovoltaic thermal (BIPVT) systems under cold climatic conditions. Appl. Energy 2010, 87, 417–426. [Google Scholar] [CrossRef]
  28. Kyritsis, A.; Roman, E.; Kalogirou, S.A.; Nikoletatos, J.; Agathokleous, R.; Mathas, E.; Tselepis, S. Households with Fibre Reinforced Composite BIPV modules in Southern Europe under Net Metering Scheme. Renew. Energy 2019, 137, 167–176. [Google Scholar] [CrossRef]
  29. López, P.C.S.; Frontini, F. Energy Efficiency and Renewable Solar Energy Integration in Heritage Historic Buildings. Energy Procedia 2014, 48, 1493–1502. [Google Scholar] [CrossRef] [Green Version]
  30. López, P.C.S.; Lucchi, E.; Franco, G. Acceptance of Building Integrated Photovoltaic (BIPV) in heritage buildings and landscapes: Potentials, barriers and assessment criteria. In Proceedings of the Rehabend Congress 2020, Construction Pathology, Rehabilitation Technology and Heritage Management, Granada, Spain, 24–27 March 2020. [Google Scholar]
  31. Jelle, B.P.; Breivik, C.; Drolsum Røkenes, H. Building integrated photovoltaic products: A state-of-the-art review and future research opportunities. Sol. Energy Mater. Sol. Cells 2012, 100, 69–96. [Google Scholar] [CrossRef] [Green Version]
  32. Cerón, I.; Caamaño-Martín, E.; Javier Neila, F. ‘State-of-the-art’ of building integrated photovoltaic products. Renew. Energy 2013, 58, 127–133. [Google Scholar] [CrossRef] [Green Version]
  33. Attoye, D.E.; Aoul, K.A.T.; Hassan, A. A Review on Building Integrated Photovoltaic Façade Customization Potentials. Sustainability 2017, 9, 1–24. [Google Scholar]
  34. Sánchez-Pantoja, N.; Vidal, R.; Carmen Pastor, M. Aesthetic perception of photovoltaic integration within new proposals for ecological architecture. Sustain. Cities Soc. 2018, 39, 203–214. [Google Scholar] [CrossRef]
  35. Ondeck, A.D.; Edgar, T.F.; Baldea, M. Optimal operation of a residential district-level combined photovoltaic/natural gas power and cooling system. Appl. Energy 2015, 156, 593–606. [Google Scholar] [CrossRef]
  36. Postnikov, I.; Stennikov, V.; Penkovskii, A. Integrated energy supply schemes on basis of cogeneration Plants and wind power plants. Energy Procedia 2019, 158, 154–159. [Google Scholar] [CrossRef]
  37. Lindenberger, D.; Bruckner, T.; Groscurth, H.M.; Kummel, R. Optimization of solar district heating systems: Seasonal storage, heat pumps, and cogeneration. Energy 2000, 25, 591–608. [Google Scholar] [CrossRef]
  38. Thygesen, R.; Karlsson, B. An analysis on how proposed requirements for near zero energy buildings manages PV electricity in combination with two different types of heat pumps and its policy implications–A Swedish example. Energy Policy 2017, 101, 10–19. [Google Scholar] [CrossRef]
  39. Alnaser, N.W. Building integrated renewable energy to achieve zero emission in Bahrain. Energy Build. 2015, 93, 32–39. [Google Scholar] [CrossRef]
  40. Thygesen, R.; Karlsson, B. Simulation and analysis of a solar assisted heat pump system with two different storage types for high levels of PV electricity self-consumption. Sol. Energy 2014, 103, 19–27. [Google Scholar] [CrossRef]
  41. Gong, H.; Rallabandi, V.; Ionel, D.M.; Colliver, D.; Duerr, S.; Ababei, C. Net Zero Energy Houses with Dispatchable Solar PV Power Supported by Electric Water Heater and Battery Energy Storage. In Proceedings of the 2018 IEEE Energy Conversion Congress and Exposition (ECCE), Portland, OR, USA, 23–27 September 2018; pp. 2498–2503. [Google Scholar] [CrossRef]
  42. Akter, M.N.; Mahmud, M.A.; Amanullah, M.T.O. Comprehensive economic analysis of a residential building with solar photovoltaic and battery energy storage system An Australian case study. Energy Build. 2017, 138, 332–346. [Google Scholar] [CrossRef]
  43. Blum, P.; Campillo, G.; Munch, W.; Kolbel, T. CO2 savings of ground source heat pump systems–A regional analysis. Renew. Energy 2010, 35, 122–127. [Google Scholar] [CrossRef]
  44. Sivasakthivel, T.; Murugesan, K.; Sahoo, P.K. Potential Reduction in CO2 Emission and Saving in Electricity by Ground Source Heat Pump System for Space Heating Applications-A Study on Northern Part of India. International Conference on Modeling Optimization and Computing (ICMOC -2012), April 10 & 11. Procedia Eng. 2012, 38, 970–979. [Google Scholar] [CrossRef] [Green Version]
  45. Lo Russo, S.; Boffa, C.; Civita, M.V. Low-enthalpy geothermal energy: An opportunity to meet increasing energy needs and reduce CO2 and atmospheric pollutant emissions in Piemonte, Italy. Geothermics 2009, 38, 254–262. [Google Scholar] [CrossRef]
  46. Knudstrup, M.A.; Ring-Hansen, H.T.; Brunsgaard, C. Approaches to the design of sustainable housing with low CO2 emission in Denmark. Renew. Energy 2009, 34, 2007–2015. [Google Scholar] [CrossRef]
  47. Kaushal, M. Geothermal cooling heating using GHE for various experimental and analytical studies: Comprehensive review. Energy Build. 2017, 139, 634–652. [Google Scholar] [CrossRef]
  48. Florides, G.; Kalogirou, S. Ground heat exchangers-a review of systems, models and applications. Renew. Energy 2007, 32, 2461–2478. [Google Scholar] [CrossRef]
  49. Self, S.J.; Reddy, B.V.; Rosen, M.A. Geothermal heat pump systems: Status review and comparison with other heating options. Appl. Energy 2013, 101, 341–348. [Google Scholar] [CrossRef]
  50. Niemelä, T.; Manner, M.; Laitinen, A.; Sivula, T.M.; Kosonen, R. Computational and experimental performance analysis of a novel method for heating of domestic hot water with a ground source peat pump system. Energy Build. 2018, 161, 22–40. [Google Scholar] [CrossRef] [Green Version]
  51. Zeng, H.Y.; Diao, N.R.; Fang, Z.H. Heat transfer analysis of boreholes in vertical ground heat exchangers. Int. J. Heat Mass Transf. 2003, 46, 4467–4481. [Google Scholar] [CrossRef]
  52. Fu, Y.; Haiyang, L.; Sun, K.; Sun, Q.; Wnnersten, R. A multi objective optimization of PV/ST-GSHP system based on office buildings. Energy Procedia 2018, 152, 71–76. [Google Scholar] [CrossRef]
  53. Fadejev, J.; Simson, R.; Kurnitski, J.; Kesti, J.; Mononen, T.; Lautso, P. Geothermal heat pump performance in a nearly zero-energy building. Energy Procedia 2016, 96, 489–502. [Google Scholar] [CrossRef]
  54. Lv, Y.; Si, P.; Liu, J.; Ling, W.; Yan, J. Performance of a Hybrid Solar Photovoltaic - Air Source Heat Pump System with Energy Storage. Energy Procedia 2018, 158, 1311–1316. [Google Scholar] [CrossRef]
  55. Lentz, A.; Almanza, R. Solar–geothermal hybrid system. Appl. Therm. Eng. 2006, 26, 1537–1544. [Google Scholar] [CrossRef]
  56. Zhou, C.; Doroodchi, E.; Moghtaderi, B. An in-depth assessment of hybrid solar–geothermal power generation. Energy Convers. Manag. 2013, 74, 88–101. [Google Scholar] [CrossRef]
  57. Li, H.; Xu, W.; Yu, Z.; Wu, J.; Yu, Z. Discussion of a combined solar thermal and ground source heat pump operation strategy for office heating. Energy Build. 2018, 162, 42–53. [Google Scholar] [CrossRef]
  58. Dai, L.; Li, S.; DuanMu, L.; Li, X.; Shang, Y.; Dong, M. Experimental performance analysis of a solar assisted ground source heat pump system under different heating operation modes. Appl. Therm. Eng. 2015, 75, 325–333. [Google Scholar] [CrossRef]
  59. Bi, Y.; Guo, T.; Zhang, L.; Chen, L. Solar and ground source heat-pump system. Appl. Energy 2004, 78, 231–245. [Google Scholar] [CrossRef]
  60. Trillat-Berdal, V.; Souyri, B.; Fraisse, G. Experimental study of a ground-coupled heat pump combined with thermal solar collectors. Energy Build. 2006, 38, 1477–1484. [Google Scholar] [CrossRef]
  61. Ozgener, O.; Hepbasli, A. Performance analysis of a solar assisted ground-source heat pump system for greenhouse heating: An experimental study. Build. Environ. 2005, 40, 1040–1050. [Google Scholar] [CrossRef]
  62. Rad, F.M.; Fung, A.S.; Leong, W.H. Feasibility of combined solar thermal and ground source heat pump systems in cold climate, Canada. Energy Build. 2003, 61, 224–232. [Google Scholar] [CrossRef]
  63. Sanner, B.; Karytsas, C.; Mendrinos, D.; Rybach, L. Current status of ground source heat pumps and underground thermal energy storage in Europe. Geothermics 2003, 32, 579–588. [Google Scholar] [CrossRef]
  64. Franco, A.; Fabio, F. Experimental analysis of a self-consumption strategy for residential building: The integration of PV system and geothermal heat pump. Renew. Energy 2016, 86, 1075–1085. [Google Scholar] [CrossRef]
  65. Ma, W.; Fang, S.; Liu, G. Hybrid optimization method and seasonal operation strategy for distributed energy system integrating CCHP, photovoltaic and ground source heat pump. Energy 2017, 141, 1439–1455. [Google Scholar] [CrossRef]
  66. Kolokotsa, D.; Kampelis, N.; Mavrigiannaki, A.; Gentilozzi, M.; Paredes, F.; Montagnino, F.; Venezia, L. On the integration of the energy storage in smart grids: Technologies and applications. Energy Storage 2019, 1. [Google Scholar] [CrossRef] [Green Version]
  67. Roberts, B.P.; Sandberg, C. The role of energy storage in development of smart grids. Proc. IEEE 2011, 99, 1139–1144. [Google Scholar] [CrossRef]
  68. Li, H.; Qu, L.; Qiao, W. Life-cycle cost analysis for wind power converters. In Proceedings of the 2017 IEEE International Conference on Electro Information Technology (EIT), Lincoln, NE, USA, 14–17 May 2017; pp. 630–634. [Google Scholar] [CrossRef]
  69. Silva, S.M.; Mateus, R.; Marques, L.; Ramos, M.; Almeida, M. Contribution of the solar systems to the nZEB and ZEB design concept in Portugal – Energy, economics and environmental life cycle analysis. Sol. Energy Mater. Sol. Cells 2016, 156, 59–74. [Google Scholar] [CrossRef] [Green Version]
  70. Jacob, A.S.; Das, J.; Abraham, A.P.; Banerjee, R.; Ghosh, P.C. Cost and Energy Analysis of PV Battery Grid Backup System for a Residential Load in Urban India. Energy Procedia 2017, 118, 88–94. [Google Scholar] [CrossRef]
  71. Marszal, A.J.; Heiselberg, P. Life cycle cost analysis of a multi-storey residential Net Zero Energy Building in Denmark. Energy 2011, 36, 5600–5609. [Google Scholar] [CrossRef]
  72. Ates, S.A. Life cycle cost analysis: An evaluation of renewable heating systems in Turkey. Energy Explor. Exploit. 2015, 33, 621–638. [Google Scholar] [CrossRef] [Green Version]
  73. Sullivan, J.L.; Clark, C.E.; Han, J.; Wang, M. Life-Cycle Analysis Results of Geothermal Systems in Comparison to Other Power Systems, Center for Transportation Research Energy Systems Division, Argonne National Laboratory August 2010. Available online: http://www.osti.gov/bridge (accessed on 10 January 2020).
  74. Yilmaz, C. Life cycle cost assessment of a geothermal power assisted hydrogen energy system. Geothermics 2020, 83, 101737. [Google Scholar] [CrossRef]
  75. Deng, Y.; Li, J.; Li, T.; Gao, X.; Yuan, C. Life cycle assessment of lithium sulfur battery for electric vehicles. J. Power Sources 2017, 343, 284–295. [Google Scholar] [CrossRef] [Green Version]
  76. Schoenung, S.M.; Hassenzahl, W.V. Long- vs. Short-Term Energy Storage Technologies Analysis A Life-Cycle Cost Study A Study for the DOE Energy Storage Systems Program, August, 2003. Available online: https://prod-ng.sandia.gov/techlib-noauth/access-control.cgi/2003/032783.pdf (accessed on 10 January 2020).
  77. Karanasios, E.; Ampatzis, M.; Nguyen, P.H.; Kling, W.L.; van Zwam, A. A model for the estimation of the cost of use of Li-Ion batteries in residential storage applications integrated with PV panels. In Proceedings of the 2014 49th International Universities Power Engineering Conference (UPEC), Cluj-Napoca, Romania, 2–5 September 2014; pp. 1–6. [Google Scholar] [CrossRef]
  78. Mehdijev, S. Dimensioning and Life Cycle Costing of Battery Storage System in Residential Housing-A Case Study of Local System Operator Concept. Master of Science Thesis, Project in Electric Power Engineering, Stockholm, Sweden, June 2017. Available online: http://www.diva-portal.org/smash/get/diva2:1130036/FULLTEXT01.pdf (accessed on 10 January 2020).
  79. Droutsa, P.; Kontogiannidis, S.; Dascalaki, E.; Blaras, C. Mapping the energy performance of hellenic residential buildings from EPC (energy performance certificate) data. Energy 2016, 98, 284–295. [Google Scholar] [CrossRef]
  80. EU. Commission Recommendation 2016/1318/EU of 29 July 2016 on Guidelines for the Promotion of Nearly Zero-Energy Buildings and Best Practices to Ensure That, by 2020, All New Buildings are Nearly Zero-Energy Buildings. Available online: https://eur-lex.europa.eu/legal-content/EN/TXT/PDF/?uri=CELEX:32016H1318&from=EL (accessed on 7 February 2020).
  81. Lucchi, E.; Tabak, M.; Troi, A. The “Cost Optimality” Approach for the Internal Insulation of Historic Buildings. Energy Procedia 2017, 133, 412–423. [Google Scholar] [CrossRef]
  82. Paduos, S.; Corrado, V. Cost-optimal approach to transform the public buildings into nZEBs: A European cross-country comparison. Energy Procedia 2017, 140, 314–324. [Google Scholar] [CrossRef]
  83. Hellenic Statistic Authority 2013. Survey on Energy Consumption in Households 2011-2012 Press Release. Available online: https://www.statistics.gr/documents/20181/985219/Energy+consumption+in+households/ (accessed on 10 January 2020).
  84. Braun, M.R.; Walton, P.; Beck, S.B.M. Illustrating the relationship between the coefficient of performance and the coefficient of system performance by means an R404 supermarket refrigeration system. Int. J. Refrig. 2016, 70, 225–234. [Google Scholar] [CrossRef] [Green Version]
  85. Kyritsis, A.; Papanikolaou, N.; Christodoulou, C.; Gkonos, G.; Tselepis, S. Installation guidelines: Electrical. In McEvoy’s Handbook of Photovoltaics, 3rd ed.; Kalogirou, S.A., Ed.; Academic Press: Cambridge, MA, USA, 2018; pp. 891–914. [Google Scholar] [CrossRef]
  86. Odyssee- Mure. Available online: https://www.odyssee-mure.eu/project.html (accessed on 7 February 2020).
  87. Lund, J.W.; Freeston, D.H.; Boyd, T.L. Direct utilization of geothermal energy 2010 worldwide review. Geothermics 2011, 40, 159–180. [Google Scholar] [CrossRef]
  88. The European Commission’s Science and Knowledge Service. Available online: https://ec.europa.eu/jrc/en/pvgis (accessed on 10 January 2020).
  89. Kyritsis, A.; Voglitsis, D.; Papanikolaou, N.; Tselepis, S.; Christodoulou, C.; Gonos, I.; Kalogirou, S.A. Evolution of PV systems in Greece and review of applicable solutions for higher penetration levels. Renew. Energy 2017, 109, 487–499. [Google Scholar] [CrossRef]
  90. Ministry of Economy and Development/General Secretariat of Commerce and Consumer Protection/Department of Prices Observatories. Available online: http://oil.gge.gov.gr/ (accessed on 10 January 2020).
  91. Public Power Corporation, S.A. Hellas. Residential Tariff. Available online: https://www.dei.gr/en/oikiakoi-pelates/timologia/oikiako-timologio-xwris-xronoxrewsi-g1 (accessed on 10 January 2020).
  92. Bloomberg NEF. Available online: https://about.bnef.com/ (accessed on 10 January 2020).
  93. EASE/EERA, European Energy Storage Technology Development Roadmap. 2017. Available online: https://eera-es.eu/wp-content/uploads/2016/03/EASE-EERA-Storage-Technology-Development-Roadmap-2017-HR.pdf (accessed on 19 February 2020).
  94. Tsiropoulos, I.; Tarvydas, D.; Lebedeva, N. Li-ion batteries for mobility and stationary storage applications–Scenarios for costs and market growth. 2018. Available online: https://publications.jrc.ec.europa.eu/repository/bitstream/JRC113360/kjna29440enn.pdf (accessed on 19 February 2020).
  95. IRENA, Electricity Storage and Renewables: Costs and Markets to 2030. International Renewable Energy Agency, Abu Dhabi 2017. Available online: https://www.irena.org/publications/2017/Oct/Electricity-storage-and-renewables-costs-and-markets (accessed on 19 February 2020).
  96. Heldeweg, M.A.; Saintier, S. Renewable energy communities as ‘socio-legal institutions’: A normative frame for energy decentralization? Renew. Sustain. Energy Rev. 2020, 119, 109518. [Google Scholar] [CrossRef]
  97. Ceglia, F.; Esposito, P.; Marrasso, E.; Sasso, M. From smart energy community to smart energy municipalities: Literature review, agendas and pathways. J. Clean. Prod. 2020, 254, 120118. [Google Scholar] [CrossRef]
Figure 1. Schematic diagram of the proposed nZEB concept.
Energies 13 01032 g001
Figure 2. Flow diagram of the methodology and steps of this paper.
Energies 13 01032 g002
Figure 3. Allocation of the monthly energy consumption of the building for a typical year.
Energies 13 01032 g003
Figure 4. Monthly variation of solar irradiation for 10-years period (actual data for Athens area) [88].
Energies 13 01032 g004
Figure 5. Monthly variation of temperature for 10-years period (actual data for Athens area) [88].
Energies 13 01032 g005
Figure 6. Total electrical energy consumption and average monthly PV production.
Energies 13 01032 g006
Figure 7. Monthly energy fluctuations in the EESU and energy transactions with the electricity grid for each scenario of EESU maximum permitted storage energy fluctuations. Maximum Permitted EESU Energy Fluctuations Per Month (kWhe/month: (a) 0, (b) ±100, (c) ±250, (d) ±400, (e) ±500, (f) ±750, (g) ±1000, (h) ±2000.
Energies 13 01032 g007aEnergies 13 01032 g007b
Figure 8. Interrelation between the energy transactions reduction and the optimum storage capacity.
Energies 13 01032 g008
Table 1. Primary energy factors.
Energy SourcePrimary Energy FactorEmissions kg CO2/kWh
Natural Gas1.050.196
Heating Diesel1.10.264
Electric Energy2.90.989
LPG1.050.238
Biomass1-
District heating by thermal stations0.70.347
District heating by RES0.5-
Table 2. Geothermal energy system technical data.
GHP Technical DataHPSU Technical Data
Heating capacity (kWth,h)22.2671.8
Cooling capacity (kWth,c)24.950.5
COP3.135.04
EER4.43.46
Table 3. Calculated electrical storage capacity for each scenario.
Cstorage (kWh)Maximum Permitted EESU Energy Fluctuations Per Month (kWhe/Month)
1040±100
2264±250
3377±400
4342±500
5988±750
7400±1000
13,080±2000
Table 4. Optimization of electrical energy storage unit.
Cstorage (kWh)ΔEgrid,month (kWh)Reduction of Energy Transactions (%)Optimum Storage Capacity Normalized in Terms of Building Energy Consumption (%)
0238900
104022894.190.31
226421848.580.68
3377198916.751.02
4342188920.931.31
5988163931.401.81
7400138941.862.23
13,08038983.733.95
Table 5. Economic and time parameters for the calculation method of LCCA.
Economic Parameters
Discount rate, d0.25%, 0% (*)
Inflation rate, g0.30%
Borrowing rate, i0%
Down payment, D
Escalation of energy costs, e
0%
0.50%
Time Parameters
Period of analysis, N25 years
Borrowing period, NΔ10 years, 0 years (*)
(*) Values that correspond to the LCCA of the initial building
Table 6. LCCA of the whole investment for each scenario of EESU capacity.
Cstorage
(kWh)
LCCTOTAL
(€)
Total Initial Cost (€)Funding for the Investment (€)Rate of Required Subsidy (%)
0289k€114k€26k€23.31
100376k€146k€113k€77.60
250424k€170k€160k€94.44
400447k€194k€184k€94.50
500503k€211k€240k€113.83
750582k€251k€319k€127.01
1000662k€292k€398k€136.5
2000979k€454k€716k€157.52
Table 7. Cost of absorbed energy in each scenario of energy storage capacity.
Cstorage (kWh)Total Absorbed Energy on 25 Year Basis (MWhe)Total Cost of Absorbed Energy (€)
0159.26949
100156.96848
250152.66662
400150.16554
500146.56395
750142.46215
1000137.25991
2000116.75097

