Assessing the Importance of Biomass-Based Heating Systems for More Sustainable Buildings: A Case Study Based in Spain


Department of Business Organization and Marketing, University of Vigo, 36310 Vigo, Spain
*
Author to whom correspondence should be addressed.
Energies 2020, 13(5), 1025; https://doi.org/10.3390/en13051025
Submission received: 24 December 2019
/
Revised: 19 February 2020
/
Accepted: 21 February 2020
/
Published: 25 February 2020
(This article belongs to the Special Issue Advances in Materials, Technologies and Controls for Sustainable Buildings)
Abstract
:Climate change, other environmental impacts due to increased energy use worldwide, and the exhaustion of energy resources are some of the major challenges facing today’s society. Considering this, this paper assesses the importance of biomass-based heating and hot-water systems in the achievement of more sustainable buildings. Using a simplified calculation method, we jointly analyzed the potential operational cost savings and reduction of CO2 emissions that would be achieved when the traditional energy model, based on the use of fossil fuels, is replaced by biomass-based heating systems. Evidence stems from a case study in public buildings in the province of Pontevedra, in the northwest of Spain. The results of this research not only show a huge impact on CO2 emission reduction just by adapting the kind of fuel use, but also considerable annual cost reduction without compromising activity development and workers’ comfort. Thus, the findings obtained should encourage governments to support the transition toward cleaner sources of energy, acting as first movers toward a locally produced and renewable-based energy supply.
1. Introduction
Climate change and the environmental impacts of increased energy use worldwide (global warming, CO2 emissions, acid rain, ozone layer depletion, etc.), as well as the exhaustion of fixed energy resources, are major long-term challenges facing today’s society [1]. Over the last decade, this concern, coupled with the problems arising from uncertainty in the energy supply and the circularity of resources, promoted strategies for energy efficiency and savings as priorities in the energy policies for most countries, as reflected in new building regulations and certification schemes targeting performance requirements [2,3,4].
Leading developed countries proposed cutting their greenhouse gas (GHG) emissions by 20–30% by 2020 and, although processes for establishing laws to achieve such a goal differ by region, there is an across-the-board acknowledgment that cutting GHG emissions is not an option but a necessity [1,5]. In fact, the problem of fossil-fuel depletion is becoming increasingly crucial, with more than 25 billion tons of CO2 arising from worldwide human activities released annually into the atmosphere. For this reason, the development of new technologies (such as battery electric vehicles for sustainable mobility) and the changing from conventional fuel to biofuel are stringent necessities, both to meet energy demand and to limit the production of carbon dioxide, carbon monoxide, and particulate matter in urban contexts [6,7,8].
In this context, energy efficiency in buildings is recognized as an effective practice to decrease energy use and to mitigate the negative effects of the current energy model on climate [9]. In the European Union (EU), the directive on end-use energy efficiency [10] was introduced as a complement to the directive on the promotion of the use of energy from renewable sources [11]. In this framework, buildings, including public or institutional buildings, are especially important for the European Union, as noted in other directives [12,13,14]. The EU Directive on Energy Performance of Buildings (2010/31/EU) and the EU Directive on Energy Efficiency [14] were amended by the EU Directive 2018/844 [15], unifying criteria for both topics. This was foreseen by 2010/31 Directive in its Article 19, in order to evaluate and to try to achieve EU emission objectives for 2030 and the complete decarbonization of the EU energy supply for 2050.
Following this, this paper assesses the importance of biomass-based heating and hot-water systems in the achievement of more sustainable buildings. Using a simplified calculation method, we jointly analyzed the potential operational cost savings and the reduction of CO2 emissions that would be achieved when the traditional energy model, based on the use of fossil fuels, is replaced by biomass-based heating systems. The paper is structured as follows: Section 2 presents the theoretical background, and Section 3 describes the methodology and the case study. Lastly, we present our main findings and their implications in Section 4.
2. Theoretical Background
2.1. Energy Consumption in the Public Sector
The research about energy use in the public sector is still scarce. Among other reasons, this may be caused by the common division of energy consumption into three main sectors: industry, transport, and the tertiary sector. This latter sector encompasses agriculture and service activities. The residential area, the non-residential building, and the agriculture group are regarded as the fastest growing energy demand sectors and are projected to be 26% higher in 2030 than in 2005 [16]. However, the aggregation of the tertiary sector hinders the in-depth analysis of energy consumption for each activity [17], and the initiatives of energy efficiency and renewable energy use are still under development.
This view highlights the interest in analyzing the use of energy in the tertiary sector, especially in public schools and institutional buildings [18]. In addition to the great potential for energy consumption reduction by applying conservation measures in those institutions, the educational and promotional effects of energy efficiency improvement on existing buildings are valued, i.e., the educational spaces can contribute to raising awareness regarding low-energy buildings [19].
Following this approach, local governments, as the managers of a significant portion of public infrastructure, should take an exemplary role regarding the energy performance of buildings, and not just comply with the minimum legal requirements [18,20]. Indeed, according to the Covenant of Mayors Initiative, the energy consumption of public and institutional buildings could be significantly reduced by implementing environmental sustainable (ES) practices and promoting the use of renewable energies [21]. Therefore, governments should play an active role not only as regulators, developers, consultants, and financiers, but also as consumers, acting as pioneers of a consumption model dominated by the local production of renewable energy. Many cities, especially in northern Europe, started to establish firm links between their energy needs and the possible existing regional resources to meet them [22]. In this regard, biomass is a great option because it is widely recognized as a clean and renewable energy source with the potential to replace conventional fossil fuels in the energy market. It is ranked as the third energy resource used after oil and coal [23], and it can make a significant contribution to the reduction of GHG emissions when produced sustainably and used efficiently [24].
Efficient energy management in a local government needs to be backed by the knowledge of the real energy demands associated with the use of each building managed. Thermal demand for domestic hot water (DHW) is relevant in every building where a service is provided by a local government, and we sought to obtain the annual consumption of final and primary energy. Various methods to obtain reasonable energy demand patterns for residential buildings were developed [19,25], as well as simulation and design tools and other software for planning low-energy buildings [26]. Although the applications available for calculations related to facilities projects can partly solve the problem, the reality is more complex. Firstly, it is not always possible to have access to such tools due to its cost and, although the use of free access energy certification software can also be considered, these are only useful if they are recently built buildings for which there are abundant and reliable data. Indeed, the evaluation of the energy efficiency of buildings through the use of different simulation tools, as well as a partial methodological evaluation for the energy efficiency of individual building components, requires the use of a large number of parameters [27]. Thus, a second limitation lies in the lack of access to certain technical data that these programs require as input values due to the unavailability of project documentation on municipal buildings, whether because of their age, poor information management, resource scarcity, etc. Although simplified simulation tools are being developed with different approaches [27,28], the use of a computer tool does not relieve users from the need to be acquainted with the know-how and management of a wide range of rules, regulations, and technical instructions involved in decision-making.
2.2. Research Gap
Taking into account the limitations described in the previous section, it would be interesting to develop a calculation model to quantify the thermal energy requirements, specifically heating and DHW, which would include, in turn, all mandatory regulations and technical instructions. In this way, it would be a complete calculation tool for all the parameters that it contemplates, while also being simplified in terms of the ease of use by having all the required parameters defined (see Appendix A).
Although simplified calculation methods are being developed with different approaches [27,28], our aim is to develop a method to quantify the thermal energy requirements, specifically heating and DHW, with an ability to contemplate the complexity involving the calculations and simplicity in its implementation. The primary energy, translated into monetary values and depending on the fuel used, will allow us to estimate the annual cost local governments are facing in the current conditions and how this would change with renewable energies [29]. Thus, two fundamental aspects of energy management are addressed: firstly, how to quantify the current thermal requirements associated with the use of a building, and secondly, how to measure the influence of certain variables and actions in energy consumption.
In this regard, the technical perspective is complemented with an analysis that supports the decision-making process, encouraging local governments to consider changing of its traditional and inefficient model of energy management, promoting structural improvements in buildings in order to reduce consumption, and fostering interest in the use of renewable energies.
Having developed and validated the simplified calculation method through the different buildings managed by one local government of a municipality in the south of the Galicia region (northwest of Spain), the second aim of this paper is to extend the assessment to other municipalities located in the province of Pontevedra. Thus, by evaluating the annual consumption of the final and primary energy of a further three municipalities selected as reference by the number of inhabitants and the services provided, it is possible to extrapolate the results to all the municipalities of the province (each municipality located in this province is classified in one of the four groups defined by the four reference municipalities analyzed). This global value allows us to estimate the cost savings and local wealth that could be generated if the energy model of the set of municipalities were changed to one based on renewable energies, such as biomass, whose abundance in the region of Galicia should be harnessed [30]. In fact, the potential of biomass available in Spain amounts to 34 million tons per year, and the region of Galicia accounts for almost 40% of this, with 13.7 million tons per year [31].
3. Methodology
3.1. Research Design: The Method
A simplified method was developed in order to determine the primary energy consumption associated with heat generation and thermal demand for domestic hot water (DHW) in the institutional buildings managed by a local government. The objective is that this method can be applied to any building, depending on its characteristics and the services it provides to the local public administration. Thus, based on these energy demands, it will be possible to calculate the annual consumption of the final and primary energy and to provide local governments with a tool for simulating different options, supporting the decision-making process.
There were several simplifications made in the method proposed for calculating thermal energy consumptions. On the one hand, it should be noted that four key parameters were considered to determine the energy demanded by a building: outdoor climate, building envelope, functional and occupational characteristics, and operating range (see Table A1, Table A2, Table A3, Table A4, Table A5, Table A6 and Table A7 in the Appendix A). Accordingly, the structure of the calculation model was based on three blocks that are described in detail in the following sections: (i) annual demand of thermal energy; (ii) annual final thermal energy consumed, according to the performance of the installation; (iii) annual primary thermal energy. In addition, since the energy consumed in a building will depend on the demand factors and the performance of the facilities, different levels of comfort were established (Table A2). It should also be noted that two more simplifications were considered. On the one hand, transmission losses were assumed to be in continuous operation. On the other hand, free energy contributions due to occupation, lighting, electrical equipment, and solar gains were not taken into account.
These simplifications allow for reducing the complexity of the calculations (for example, the losses to transport heat from the boiler to the end points), while maintaining a high level of reliability, and, simultaneously, simplicity of implementation, making it a great tool for decision-makers. After all, the main objective of this study is not to accurately calculate consumption, cost, or CO2 emissions, but to validate a reliable assessment of these values in order to foster an awareness for changing the current energy model in local governments to one based on renewable energies and ES practices. The values of different parameters and the great diversity of rules and technical instructions involved in these calculations are compiled in the Appendix A.
3.1.1. Annual Demand of Thermal Energy
The calculation of annual demand of thermal energy for any building was based on the “Technical Documents of Facilities in Buildings” published by the Spanish Technical Association of Air-Conditioning and Refrigeration [32]. This demand was calculated with Equation (1) consisting of three factors: thermal demand for heating (DH_i), thermal demand for domestic hot water (DDHW_i) and thermal demand in heated pools (DP_i) for sports facilities with swimming pools, calculated for each month i and later summarized.
Thermal demand for heating (DH_i) is the useful energy required that the heating system has to provide to maintain temperature at the indoor design value; this factor is applicable in buildings with heating requirements, including the heated pool area where used [33]; see the Appendix A for more details.
where is the total thermal load and the term represents the operating hours per day and the operating days per month, respectively. This demand is calculated from the thermal heating load, defined by the heat losses that occur in the building and that are mainly due to heat transmission through the building envelope and ventilation (see Table A1, Table A2, Table A3 and Table A4 in the Appendix A).
Thermal demand for domestic hot water (DDHW_i) is the useful energy required that the system must provide for water accumulation to maintain its temperature at a reference value; this factor is applicable in buildings with DHW requirements (see Table A5 and Table A6 in the Appendix A). The calculations were carried out in accordance with the UNE-94002: 2005 standards and the CTE DB HE-4 (parameters for domestic hot water calculations).
where VDHW represents the volume demanded at Tref, CW is the specific heat of water, and describes the difference between DHW storage temperature reference value and the monthly average daily temperature of cold water from general supply.
Thermal demand in heated pools (DP_i) is mainly through evaporation and water renewal (i.e., the amount of fresh water that needs to be replenished due to evaporation losses). The losses by radiation, conduction, and convection can be assumed to be negligible in heated pools [33,34] (see Table A7 in the Appendix A).
where is the thermal load by evaporation, and is the thermal load by water renewal (see Table A8 and Table A9 in the Appendix A).
3.1.2. Annual Final Thermal Energy
Having determined the thermal demand associated with each governmental building, which depends on its characteristics and typologies, and considering the seasonal performance of the heat generating system, the next step is to determine the final energy consumption of the system. This energy is calculated with the following equation:
where EF is the annual final thermal energy consumed, DT is the annual thermal energy demand, ηI is the average performance of installation (a representative value of a high-performance combustion boiler equal to 0.92 was considered (see Section 5.3 CTE DB HE-0)), and QL is the annual thermal energy losses due to transport, where QL = 2π∙λ∙ΔT/ ln(1 + e/r) ∙ L∙H, λ is the thermal conductivity of the insulator, e is the average thickness of the insulation, r is the outside radius of the pipes, ΔT (temperature variation) = Tinner pipe fluid − Tambient, L is the total length of the piping, and H is the total working hours.
It should be noted that, due to the specific goals of the study (to foster an awareness for changing the current energy model to one based on renewable energies), thermal losses due to transport (e.g., from the boiler to the end points) were not considered. Two key issues should be noted. Firstly, all the facilities studied comply with Spanish Regulations for Thermal Facilities in Buildings (RITE) that states that “global thermal losses will not exceed 4% of the energy transported” (RITE, 2007). Secondly, in all cases evaluated, the pipes run through the interior of the buildings themselves; thus, these heat losses are indirectly reused.
3.1.3. Annual Primary Thermal Energy
Finally, the primary energy is the true value indicative of the energy consumption of a building. This energy and CO2 emissions are calculated with the equations below (see Table A10 in the Appendix A).
where EP is the annual primary thermal energy, EF is the annual final thermal energy, and A is the transfer coefficient associated with the thermal energy source.
where ECO2 is the annual emissions of CO2, EF is the annual final thermal energy consumed, and EM is the CO2 emission factor, associated with the thermal energy source (EM is based on the fuel carbon content. Standard emission factor databases are used to assign values to each combustion technology/fuel combination [35,36]).
3.2. Validation: The Case Study
The simplified calculation method was validated through a case study, using the different buildings managed by one local government of a municipality in the south of the Galicia region (northwest of Spain). Then, the assessment was extended to other municipalities located in the same province. By evaluating the annual consumption of final and primary energy of a further three municipalities selected as reference by the number of inhabitants and the services provided, it is possible to extrapolate the results to all the municipalities of the province (each municipality located in this province is classified in one of the four groups defined by the four reference municipalities analyzed). This global value allows us to estimate the cost savings and local wealth that could be generated if the energy model of the set of municipalities were changed to one based on renewable energies, such as biomass, whose abundance in the region of Galicia should be harnessed [30]. In fact, the potential biomass available in Spain amounts to 34 million tons per year, and the region of Galicia accounts for almost 40% of this, with 13.7 million tons per year [31].
According to the Galician Institute of Statistics [37], the province of Pontevedra, located in the southwest of Galicia (Figure 1), is organized into 57 municipalities with 955,000 inhabitants, and covers an area of 4495 km2, with all its districts having more than 70% of their forest area covered with trees.
The pilot municipality selected, Mondariz, belongs to the most representative population-level typology of the province of Pontevedra, with a considerable number of public buildings. These buildings were identified, as well as the energy used (electricity and diesel fuel) and the type of thermal consumption (heating and/or DHW). The interest shown by the local government was key to selecting the pilot municipality and collecting technical information on the characteristics of the different buildings, active hours of services, and the approximate annual cost for heating and DHW. As for the data required to perform all calculations, the data collection was structured into three steps. Firstly, the district code and location of the different buildings was identified using Google Maps; secondly, technical data, such as the building surface or the year of construction, were obtained from the district code official website; thirdly, direct geometrical measurements on each of the different buildings were carried out by the researchers.
4. Results of the Case Study: Energy Saving in Public Buildings
4.1. Pilot Municipality
The consumption values, the cost, and the environmental impacts shown in Table 1 were obtained using the calculation method described above and by applying the “ideal” parameters (performance, comfort, etc.) based on the parameters described by the Spanish Regulations for Thermal Facilities in Buildings (RITE) [38], and the National Institute for Occupational Safety and Health (INSHT). The RITE establishes the thermal comfort criteria in offices, setting the values endorsed by the Occupational Risk Prevention Law (Law 21/1995 PRRLL), while, in parallel, the INSHT provides a guide to good practices for regulating the working conditions in offices [39].
The application of the calculation method shows a slight comparative discrepancy in the final expenditure with respect to the actual data provided by each institution. This small difference (always less than 5%) was expected since it is assumed that the normal operating values differ from those considered “ideal” and, therefore, does not prevent the validity of the method used and the calculations made. Thus, a further two scenarios are proposed in this study: “realistic”, based on the common functioning values of public buildings, which normally follow economic criteria rather than comfort aspects, and “optimum”, in which a balance is proposed between economic savings and comfort conditions. Table 2 shows the main parameters defining each scenario.
Considering these three scenarios, Figure 2 shows the cost savings and the emissions reductions that could be achieved if the regular fuel was replaced by biomass, i.e., 0.0363 €/kWh, according to IDAE (2008).
As shown, the optimum scenario does not provide the best results. In fact, the realistic scenario seems to be the best option, with a cost consumption (51,622.47 €/year) quite similar to the approximate data provided by the council. However, the savings achieved against the ideal scenario, especially when biomass is the fuel used (12,239.40 €/year), as well as the comfort improvements afforded users, make the optimum scenario the most interesting of the three options.
4.2. Extrapolation
In order to affordably obtain an overall assessment for the 57 municipalities in the province of Pontevedra, they were distributed into four groups, following the criteria of the number of inhabitants, and a municipality type was selected for each of these groups. Then, we applied the same methodology as in the case of the validation. However, the two most populated towns in the province (Vigo and Pontevedra, the capital) were excluded from the study due to the large differences shown by other municipalities belonging to the same group; thus, it was advisable to conduct an individualized study outside of these municipalities. Table 3 shows the four groups, the number of inhabitants, the municipalities belonging to each group, and the municipality selected for applying the calculation method.
Figure 3 shows the comparative results for Group I, as an example, considering the three scenarios and biomass as the fuel alternative to the fuel usually used. These results show that the amount of these savings is different depending on the scenario considered. Moreover, as expected, in all cases, the optimum scenario shows intermediate values (consumption, cost, and emissions) between the other two scenarios.
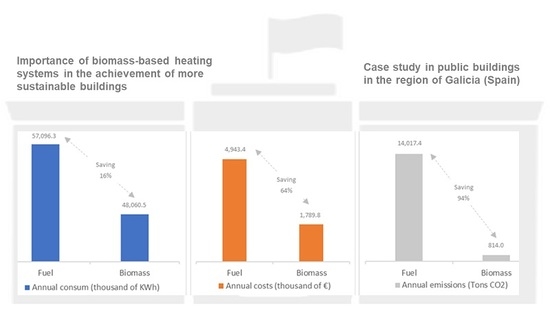
Finally, in order to extrapolate the individual results to the entire province, it was necessary to modify the calculations in case IV. The reason for this change is that some of the buildings in this municipality, i.e., those dedicated to the use of renewable energies, are already using biomass instead of fossil fuels. Thus, the calculations were made by simulating the hypothetical use of electricity and diesel to avoid a non-realistic situation when extrapolating to the rest of the municipalities in group IV. Figure 4 shows the final results of extrapolation focused on the optimum scenario. More than 60% savings in cost and a 90% reduction in CO2 emissions could be achieved if all municipalities in the province made these changes in their energy management.
5. Conclusions
5.1. Theoretical Contributions
A simplified method for calculating total primary thermal energy was developed. It provides local governments with a tool for simulating different options, supporting the decision-making process. Thus, in addition to assessing the effects of market prices for different fuels or variable comfort conditions (alternative scenarios) when analyzing the effect on total energy consumption, it would also be highly desirable to consider the importance of rehabilitating the less energy-efficient buildings, and the economic savings of these actions could contribute to this consideration. Transmittance coefficients of building materials would have a significant impact on the level of isolation and, consequently, on heat losses.
The case study bears out the improving potential which ES practices have within sustainable development. Our results show a huge impact on CO2 emission reduction just by adapting the kind of fuel use, without compromising activities and comfort.
5.2. Managerial Implications and Recommendations to Policymakers
The results of this research show that meeting the thermal demands of public service buildings using the current model (based on the use of fossil fuels) involves a considerable annual cost and CO2 emissions. In addition, the current policy of reducing public expenditure implies, on the one hand, reducing comfort conditions (Ta, operating hours, etc.) for users (employees and citizens). However, to avoid situations of non-comfort and, at the same time, to reduce the annual expenditure on heating and DHW, we recommend using the so-called “optimum scenario”, which replaces the usual fossil fuels with other cleaner and cheaper sources of energy.
Our proposal for an alternative is biomass due to its significant growth potential for thermal purposes and due to the wealth of this resource in Galicia. However, changing the energy model is not without difficulties. In this regard, we point out several barriers to this energy resource exploitation below. Firstly, there is the complex structure of forest ownership, highly fragmented among smallholders, which hampers the exploitation of the resource. Secondly, there is the limited development of an industrial and logistics infrastructure to ensure efficient availability and fuel supply. Thirdly, institutional support is insufficient, and government agencies should take a more active role as facilitator, both in terms of financing the implementation of this industrial activity and in terms of promoting the use of biomass. We encourage governments to support the transition toward cleaner sources of energy, acting as first movers toward a locally produced and renewable-based energy supply. The negative impacts of biomass could be mitigated by applying sustainable forest management (SFM) practices and fostering local production, so that a sustainable source of raw material is guaranteed. Knowledge of the potential savings that could be achieved by replacing the fuel used or by developing the necessary refurbishing of buildings is a key factor in assessing the investments and the repayment period, a process which would foster change in the energy model for municipalities. However, this change involves a new approach and a clear commitment to renewable energies, in contrast to the current policy of containment of public spending, which entails reducing services to citizens.
Finally, it should also be noted that there is a limit on the use of biomass due not only to its lower energy return compared to fossil fuels, but also taking into account the total biomass available in each region. Our study focuses on the local governments (with medium-low energy demand levels), and on a region (Galicia, Spain) with large forest areas [31]. However, biomass limitations must be taken into account to assess the validity of these solutions with high-energy-demand activities, or in those regions where forest resources may not be as abundant. In these cases, local administrations could ensure the correct management of these forest areas, maintaining the balance with nature, and focusing on the use of forest wastes. These considerations also have implications for carbon emissions from a life-cycle perspective, where the SFM considerations become even more relevant.
5.3. Limitations and Future Research
Despite achieving objectives and contributing to the literature, there are some research limitations. Firstly, there are limitations due to the simplifications made in the method proposed for calculating thermal energy consumptions. The main contribution of this method is its ability to reduce the complexity of the calculations (for example, by not considering losses to transport heat from the boiler to the end points), while maintaining a high level of reliability and, simultaneously, simplicity of implementation, making it a great tool for decision-makers. Secondly, the use of costs in the results is debatable since costs can be skewed, for example, by taxation policies. However, this should not affect the conclusions obtained. On the one hand, the objective of this research is to evaluate the economic impact of this type of action in the field of local administration. We understand that the use of economic values (instead of only physical units) not only illustrates better the impact of this type of initiative, but can also make public administrative officials them take more seriously. On the other hand, in this particular case, if we analyze the evolution of Spanish energy rates, we again note that these calculations are conservative, and that the estimated savings will be even greater in the future. This is especially important in local administrations where an important part of the budget goes to these expenses, thus preventing the development of other public initiatives.
Thirdly, calculations based on extrapolation are always estimates of a studied reality. However, the objective of this study was not to accurately calculate consumption, cost, or CO2 emissions, but to validate a reliable assessment of these values in order to foster an awareness for changing the current energy model in local governments to one based on renewable energies and ES practices.
For future research, it would be interesting to extend the study to other provinces of Galicia and Spain and to analyze how to overcome the three major barriers mentioned above in different contexts. We would like to indicate the importance of assessing the development of an industrial and logistics model that would make possible the efficient use of biomass resources in Galicia.
Author Contributions
J.E.P. and A.M. contributed to the design and implementation of the research, to the analysis of the results and to the writing of the manuscript. A.S. provided critical feedback and helped shape the research and final analysis. All authors have read and agreed to the published version of the manuscript.
Funding
This research received no external funding.
Acknowledgments
The authors wish to express their gratitude to the employees of the four local governments and, especially, their mayors for the support and confidence shown in the project.
Conflicts of Interest
The authors declare no conflicts of interest.
Nomenclature
| CTE | Código Técnico de la Edificación RD 314/2006, of March 17 (Technical Building Code). |
| DITE | Documento de Idoneidad Técnica Europeo (European Technical Approval, ETA). |
| IDAE | Instituto para la Diversificación y Ahorro de Energía (Institute for Diversification and Energy Saving http://www.idae.es). |
| MINETUR | Ministerio de España de Industria, Energía y Turismo (Ministry of Industry, Energy and Tourism http://www.minetur.gob.es). |
| NBE | Normativa Básica de Edificación-RD 2429/79 (Basic Standards of Edification). |
| RITE | Reglamento de Instalaciones Térmicas de los Edificios (EU Directive 2002/91/EC was partially transposed by RD 47/2007 of January 19 (by which the basic procedure is approved for certification of energy efficiency of new buildings) and by RD 1027/2007, of July 20, Regulation for Thermal Installations in Buildings). |
Appendix A

Table A1.
Parameters for heating calculations.
| Parameter | Description | Source | |
|---|---|---|---|
| Outdoor weather conditions | The monthly average outdoor temperature determines the heat loss that takes place with respect to indoor design conditions |
| |
| Indoor design conditions | Depending on the degree of comfort and the activity that takes place in the space | Generic building (1) | T.I. 1.1.4.1.2: Table 1.4.1.1 (RITE) |
| Heated pool (pool basin zone) | T.I. 1.1.4.1.2 Section 3 (RITE) R.D.742/2013 | ||
| Clinic | UNE-100713:2005 | ||
| Building envelope | Overall heat transfer coefficient (U) according to the type of construction. If details of the constructive element are not known, the U value is considered equal the maximum allowed value according to national regulations | Exterior walls (EWa) | IDAE Guide: Technical Foundations Manual of buildings energy rating CE3X |
| Roof (R) | |||
| Below-grade or on-grade surface (G) | |||
| Exterior windows (EWi) | |||
| Exterior doors (ED) | |||
| Occupancy | Depending on the type of space, minimum ventilation air flow that defines a heat input which adds to the total demand is required | Generic building | T.I 1.1.4.2.3: Table 1.4.2.1 (RITE) |
| Heated pool (pool basin zone) | T.I. 1.1.4.2.3 Section 3 (RITE) | ||
| Clinic | UNE-100713:2005 | ||
| Correction factor orientation/intermittence | Discretion of designer involves additional losses in the building; the percentage increased must be specified | ||
(1) Town halls, libraries, schools, etc. (excluding pools and clinics).
Table A2.
Reference values of the different parameters of the heating model.
| Parameter | Reference Values | ||||||||||||
|---|---|---|---|---|---|---|---|---|---|---|---|---|---|
| Indoor design conditions | Generic building | = 21 °C | |||||||||||
| Heated pool (pool basin zone) | = 27 °C | ||||||||||||
| Clinic | = 24 °C | ||||||||||||
| Building envelope (U, W/m2·K) | Chronological range | (before 1987) | (1987–2007) | (after 2007) | |||||||||
| Climatic zone (1) | V y W | X | Y | Z | A | B | C | D | E | ||||
| UEWa | 3.0 | 1.8 | 1.6 | 1.4 | 1.4 | 0.94 | 0.82 | 0.73 | 0.66 | 0.57 | |||
| UR | Flat roof (2) | Pitched roof (2) | 1.4 | 1.2 | 0.9 | 0.7 | 0.5 | 0.45 | 0.41 | 0.38 | 0.35 | ||
| 3.8 | 2.5 | ||||||||||||
| UG | Depth ≤ 0.5 m | 1 | 1 | 1 | 1 | 1 | 0.53 | 0.52 | 0.5 | 0.49 | 0.48 | ||
| Depth >0.5 m | 1 | 1 | 1 | 1 | 1 | 0.94 | 0.82 | 0.73 | 0.66 | 0.57 | |||
| UEWi | 5.7 | 5.7 | 5.7 | 5.7 | 5.7 | 3.3 | 3.3 | 3.3 | 3.3 | 3.3 | |||
| UED | 5.7 | 5.7 | 5.7 | 5.7 | 5.7 | 3.3 | 3.3 | 3.3 | 3.3 | 3.3 | |||
| Occupancy (4) | Generic building | IAQ 1 (3) 20 dm3/s·person | IAQ 2 (3) 12.5 dm3/s·person | IAQ 3 (3) 8 dm3/s·person | IAQ 4 (3) 5 dm3/s·person | ||||||||
| Heated pool (pool basin zone) | |||||||||||||
| Clinic | |||||||||||||
| Correction factor orientation | North | 20% | |||||||||||
| West | 10% | ||||||||||||
| East | 5% | ||||||||||||
| South | 0% | ||||||||||||
| Correction factor intermittence | 9–12 h | 5% | |||||||||||
| More than 12 h | 10% | ||||||||||||
(1) Climatic zone: old buildings → See NBE-CT-79 Map 2; new buildings → See CTE-DB-HE-1 Appendix A: climatic zones. (2) Flat roof → slope ≤ 15°; pitched roof → slope > 15° to 60°. (3) IAQ (indoor air quality): category of indoor quality air (see RITE); IAQ 1: hospitals, clinics, laboratories, kindergartens; IAQ 2: offices, hostels, reading rooms, museums, courtrooms, classrooms, and pools; IAQ 3: shopping centers, cinemas, restaurants, gyms, sports centers (excluding pools), and computer rooms; IAQ 4: poor air quality. (4) Part of the energy is recovered, when air flow expelled by mechanical means is greater than 0.5 m3/s, with the following minimum efficiencies (Table 2.4.5.1; RITE, see Table 3).
Table A3.
Recovery efficiency (%RE).
| Annual Operating Hours | Extraction Rate (m3/s) | ||||
|---|---|---|---|---|---|
| >0.5 to 1.5 | >1.5 to 3.0 | >3.0 to 6.0 | >6.0 to 12.0 | >12.0 | |
| % | % | % | % | % | |
| ≤2000 | 40 | 44 | 47 | 55 | 60 |
| >2000 to 4000 | 44 | 47 | 52 | 58 | 64 |
| >4000 to 6000 | 47 | 50 | 55 | 64 | 70 |
| >6000 | 50 | 55 | 60 | 70 | 75 |
Table A4.
Heat load for heating.
| Parameter | Description | |
|---|---|---|
| Thermal load_transmission | : Thermal load by transmission, month i, kW : Transmission coefficients, K = 1 except for
: Element area j, m2 : Indoor design temperature : Average temperature: Walls/roof/Windows and doors: - (1); - Below-grade and on-grade surfaces (2); S1: Correction factor (orientation), fraction of unity | |
| Thermal load_ventilation | (a) Generic buildings: | = Thermal load_ventilation, month_i = Ventilation flow rate, m3/s = Minimum ventilation flow rate (per person or surface area), m3/s = Occupancy, m2 per person = Occupiable floor area or water zone surface, m2 = Air density, 1.204 kg/m3 = Specific heat of air, 1 kJ/kg∙°C = Temperature difference, °C: ; = Recovery efficiency (fraction of unity), see Table 3 |
| (b) Heated pools/Clinics: | ||
| Total thermal load per month | = Total thermal load = Thermal load_transmission = Thermal load_ventilation S2 = Correction factor (intermittence), fraction of unity | |
(1) Using the average temperature involves some inaccuracy; however, the problem is simplified and the results are acceptable. (2) For calculating the average temperature of soil depending on the location, use .
Table A5.
Parameters for domestic hot-water calculations.
| Parameter | Description | Source |
|---|---|---|
| Thermal demand for domestic hot water, month_i. The average daily hot water consumption associated with a reference temperature of 60 °C | CTE DE HE-4 | |
| DHW volume demanded at = ; CDHW = Flow rate DHW, 1/day-person; = occupation density, m2/person (occupancy and utilization percentage defined in the project) = Useful area of the building, m2. | CTE DB SI-3 | |
| Specific heat of water, 1.16 Wh/L∙°C | ||
| DHW storage temperature reference value | R.D.865/2003 = 60 °C | |
| It is the monthly average daily temperature of cold water from general supply | In case of capital municipalities (TW_CM) see Table 3 UNE-94002:2005 In case of non-capital municipalities (TW_NCM) use TW_NCM = TW_CM − B × Δz = altitude of the municipality = altitude of the province B = 0.010 October to March B = 0.05 April to September |
Table A6.
Daily hot-water consumption and occupation density.
| Building Type | Liters/Day-Person | m2/Person |
|---|---|---|
| Cloakrooms | 21 | 2 |
| Clinic | 41 | 10 |
| School | 4 | |
| Offices | 2 |
Table A7.
Heat load for heated pools.
| Parameter | Description | Source | Reference Values | |
|---|---|---|---|---|
| Design conditions | Water temperature in pool basin zone and indoor air conditions | T water_basin zone | Anexo I R.D.742/2013 | 25 °C |
| Tindoor_air Humidityindoor_air | T.I 1.1.4.1.2 Section 3 (RITE) | 27 °C 60% | ||
| Occupancy | Heat losses by evaporation are directly proportional to the number of bathers | DITE 10.06 | ||
Table A8.
Thermal load by evaporation ( ).
| Calculations | ||
|---|---|---|
| Evaporation of water | = Water rate of evaporation, kg/h = Water zone surface, m2 = Absolute humidity of saturated air at the pool water temperature: 0.0201 kgwater/kgair (barometric pressure, 101,325 Pa = Absolute humidity of indoor air at design conditions: 0.0134 kgwater/kgair n: 0.16 bathers/m2 | |
| Thermal load_evaporation | = Latent heat of vaporization of water, 0.680 kWh/kg (25 °C) | |
Table A9.
Thermal load by water renewal (.
| Calculations | ||
|---|---|---|
| Thermal load_renewal | = volume of water to renew (5% volume of pool basin), m3/day = Water density, 1000 kg/m3 = Specific heat of water, 1.16 Wh/kg∙°C =Pool water temperature, °C = Temperature of cold water from general supply, °C | |
Table A10.
Transfer coefficients and emission factors [40]. LPG—liquid petroleum gas.
Table A10.
Transfer coefficients and emission factors [40]. LPG—liquid petroleum gas.
| Source of Energy | ||
|---|---|---|
| Electricity | 2.461 | 0.399 |
| Diesel fuel | 1.182 | 0.311 |
| Natural gas | 1.195 | 0.25 |
| LPG | 1.204 | 0.254 |
| Coal | 1.084 | 0.472 |
| Biomass | 1.037 | 0.018 |
| Densified biomass (pellets) | 1.113 | 0.018 |
Table A11.
Comparative results in municipalities selected.
| Group | kWh/year | Ideal €/year | Kg CO2/year | kWh/year | Realistic €/year | Kg CO2/year | kWh/year | Optimum €/year | Kg CO2/year |
|---|---|---|---|---|---|---|---|---|---|
| Group I | |||||||||
| Fuel used | 610.0 | 104.1 | 108.3 | 301.8 | 51.6 | 54.8 | 463.9 | 79.2 | 83.4 |
| Biomass | 360.1 | 15.2 | 7.9 | 188.0 | 8.97 | 5.1 | 278.1 | 12.2 | 6.5 |
| Group II | |||||||||
| Fuel used | 355.8 | 49.6 | 69.0 | 284.3 | 45.5 | 50.2 | 323.1 | 47.7 | 60.4 |
| Biomass | 225.2 | 8.18 | 3.6 | 157.9 | 5.7 | 2.6 | 194.4 | 7.1 | 3.1 |
| Group III | |||||||||
| Fuel used | 1856.5 | 116.95 | 478.8 | 1623.6 | 103.7 | 417.4 | 1742.0 | 110.4 | 468.7 |
| Biomass | 1705.1 | 61.87 | 27.6 | 1485.3 | 53.9 | 24.0 | 1597.3 | 57.9 | 25.8 |
| Group IV | |||||||||
| Fuel used | 2451.0 | 131.2 | 440.3 | 2032.5 | 112.8 | 401.3 | 2258.0 | 122.7 | 422.6 |
| Biomass | 2298.5 | 84.4 | 37.2 | 1891.4 | 69.6 | 30.6 | 2110.7 | 77.6 | 34.1 |
Table A12.
Extrapolation to the Pontevedra province (optimum scenario).
| Group | kWh/year (thousand of) | Town Selected k€/year | Tons CO2/year | kWh/year (Thousands of) | Extrapolation k€/year | Tons CO2/year |
|---|---|---|---|---|---|---|
| Group I | ||||||
| Fuel used | 463.9 | 79.2 | 83.4 | 8350.2 | 1424.9 | 1500.4 |
| Biomass | 278.1 | 12.2 | 6.5 | 5006.6 | 220.3 | 117,749.3 |
| Group II | ||||||
| Fuel used | 323.1 | 47.7 | 60.4 | 4,523.7 | 47.7 | 60.4 |
| Biomass | 194.4 | 7.1 | 3.1 | 2721.8 | 98.8 | 44.0 |
| Group III | ||||||
| Fuel used | 1742.0 | 110.4 | 468.7 | 27,872.0 | 1767.1 | 7499.2 |
| Biomass | 1597.3 | 58.0 | 25.8 | 25,557.3 | 927.7 | 413.3 |
| Group IV | ||||||
| Fuel used (1) | 2335.8 | 154.7 | 596.1 | 16,350.3 | 1083.0 | 4172.6 |
| Biomass | 2110.7 | 77.6 | 34.1 | 14,774.9 | 543.0 | 238.9 |
| TOTAL | ||||||
| Fuel used | 57,096.2 | 4943.3 | 14,017.4 | |||
| Biomass | 48,060.5 | 1789.8 | 814.0 | |||
| SAVINGS | 16% | 64% | 94% |
(1) Modified calculations in town selected.
References
- Sartal, A.; Rodríguez, M.; Vázquez, X.H. From efficiency-driven to low-carbon operations management: Implications for labor productivity. J. Oper. Manag. 2019. [Google Scholar] [CrossRef]
- Marini, D. Optimization of HVCA systems for distributed generation as a function of different types of heat sources and climatic conditions. Appl. Energy 2013, 103, 813–826. [Google Scholar] [CrossRef]
- Quintás, M.; Martínez-Senra, A.I.; Sartal, A. The Role of SMEs’ Green Business Models in the Transition to a Low-Carbon Economy: Differences in Their Design and Degree of Adoption Stemming from Business Size. Sustainability 2018, 10, 2109. [Google Scholar] [CrossRef] [Green Version]
- Sartal, A.; Ozcelik, N.; Rodríguez, M. Bringing the circular economy closer to small and medium entreprises: Improving water circularity without damaging plant productivity. J. Clean. Prod. 2020, 10, 2109. [Google Scholar]
- Cho, J.; Shin, S.; Kim, J.; Hong, H. Development of an energy evaluation methodology to take multiple predictions of the HVAC&R system energy demand for office buildings. Energy Build. 2014, 80, 169–183. [Google Scholar]
- Bulkeley, H. Cities and Low Carbon Transitions; Routledge: Abingdon, UK, 2010; Volume 35. [Google Scholar]
- Iodice, P.; Senatore, A. Industrial and Urban Sources in Campania, Italy: The Air Pollution Emission Inventory. Energy Environ. 2015, 26, 1305–1317. [Google Scholar] [CrossRef]
- Iodice, P.; Langella, G.; Amoresano, A. Modeling and energetic-exergetic evaluation of a novel screw expander-based direct steam generation solar system. Appl. Therm. Eng. 2019, 155, 82–95. [Google Scholar] [CrossRef]
- Allouhi, A.; El Fouih, Y.; Kousksou, T.; Jamil, A.; Zeraouli, Y.; Mourad, Y. Energy consumption and efficiency in buildings: Current status and future trends. J. Clean. Prod. 2015, 109, 118–130. [Google Scholar] [CrossRef]
- European Parliament, European Council. EU Directive 2006/32/EC on the Energy End-use Efficiency and Energy Services; European Parliament, European Council: Brussels, Belgium, 2006. [Google Scholar]
- European Council. EU Directive 2009/32/28 on the Promotion of the Use of Energy from Renewable Sources; European Council: Brussels, Belgium, 2010. [Google Scholar]
- European Parliament, European Council. EU Directive 2002/91/EC of the European Parliament and of the Council of 16 December 2002 on the Energy Performance of Buildings; European Parliament, European Council: Brussels, Belgium, 2002. [Google Scholar]
- European Parliament, European Council. EU Directive 2010/31/EU of the European Parliament and of the Council of 19 May 2010 on the Energy Performance of Buildings; European Parliament, European Council: Brussels, Belgium, 2010. [Google Scholar]
- European Parliament, European Council. EU Directive 2012/27/EU of the European Parliament and of the Council of 25 October 2012 on Energy efficiency, Amending Directives 2009/125/EC and 2010/30/EU and Repealing Directives 2004/8/EC and 2006/32/EC; European Parliament, European Council: Brussels, Belgium, 2012. [Google Scholar]
- European Parliament, European Council. Directive (EU) 2018/844 of the European Parliament and of the Council of 30 May 2018 Amending Directive 2010/31/EU on the Energy Performance of Buildings and Directive 2012/27/EU on Energy Efficiency; European Parliament, European Council: Brussels, Belgium, 2018. [Google Scholar]
- Capros, L.; Mantzos, V.; Papandreou, N. Tasios, EU Energy and Transport Trends 2030—Update 2007; Office for Official Publications of the EU Communities: Luxemburg, 2008; 158p. [Google Scholar]
- Pérez-Lombard, L.; Ortiz, J.; Poutb, C. A review on buildings energy consumption information. Energy Build. 2008, 40, 394–398. [Google Scholar] [CrossRef]
- Gaitani, N.; Lehmann, C.; Santamouris, M.; Mihalakakou, G.; Patargias, P. Using principal component and cluster analysis in the heating evaluation of the school building sector. Appl. Energy 2010, 87, 2079–2086. [Google Scholar] [CrossRef]
- Chung, M.H.; Rhee, E.K. Potential opportunities for energy conservation in existing buildings on university campus: A field survey in Korea. Energy Build. 2014, 78, 176–182. [Google Scholar] [CrossRef]
- European Commission. Communication from the Commission to the European Parliament, the Council, the European Economic and Social Committee and the Committee of the Plan. In Energy Efficient Plan; European Commission: Brussels, Belgium, 2011. [Google Scholar]
- Joint Research Centre, Institute for Energy, European Comission. Developing a Plan of Action for Sustainable Energy; Joint Research Centre, Institute for Energy, European Comission: Luxembourg; Brussels, Belgium, 2010. [Google Scholar]
- Droege, P. Renewable Energy and the City: Urban Life in an Age of Fossil Fuel Depletion and Climate Change. Bull. Sci. Technol. Soc. 2002, 22, 87–99. [Google Scholar] [CrossRef]
- Pereira, E.; Da Silva, J.N.; De Oliveira, J.L.; Machado, C.S. Sustainable energy: A review of gasification technologies. Renew. Sustain. Energy Rev. 2012, 16, 4753–4762. [Google Scholar] [CrossRef]
- European Commission. A Sustainable Bioeconomy for Europe: Strengthening the Connection between Economy, Society and the Environment; European Commission: Brussels, Belgium, 2018. [Google Scholar] [CrossRef]
- Catalina, T.; Virgone, J.; Blanco, E. Development and validation of regression models to predict monthly heating demand for residential buildings. Energy Build. 2008, 40, 1825–1832. [Google Scholar] [CrossRef]
- Chiela, F.; Husaunndee, A.; Inard, C.; Riederer, P. A new methodology for the design of low energy buildings. Energy Build. 2009, 41, 982–990. [Google Scholar]
- Praznik, M.; Butala, V.; Zabasnik, M. Simplified evaluation method for energy efficiency in single-familiy houses using key quality parameters. Energy Build. 2013, 67, 489–499. [Google Scholar] [CrossRef]
- Jaffal, I.; Inard, C.; Ghiaus, C. Fast method to predict building heating demand based on the design of experiments. Energy Build. 2009, 41, 669–677. [Google Scholar] [CrossRef]
- Adıgüzel, N.; Çomakli, Ö.; Ekmekci, I.; Pusat, S. Economical evaluation of a cogeneration system for a building complex. Adv. Mech. Eng. 2015, 7, 1–7. [Google Scholar] [CrossRef] [Green Version]
- Silvaplus Project. Promoting Sustainable Use of Forest Biomass for Energy Purposes in Norther Portugal and Southern Galicia. Available online: http://www.silvaplus.com (accessed on 13 May 2015).
- IDAE. Evaluación del potencial de energía de la biomasa. In Estudio Técnico PER 2011–2020; Institute for Diversification and Energy Savings: Madrid, Spain, 2014. [Google Scholar]
- Spanish Technical Association of Air-Conditioning and Refrigeration (AEFYT). Yearbook of Air Conditioning and Refrigeration 2017; AEFYT: Madrid, Spain, 2018. [Google Scholar]
- IDAE. Energy optimization in sports centers. In Municipal Energy Management Notebook; Institute for Diversification and Energy Savings: Madrid, Spain, 1998; ISBN 84-86850-15-0. (In Spanish) [Google Scholar]
- US Army. Swimming pool: Operation and maintenance. In Technical Manual (TM5–662); Headquarters Department of the Army: Washington, DC, USA, 1986. [Google Scholar]
- Gurney, K.R.; Mendoza, D.L.; Zhou, Y.; Fischer, M.L.; Miller, C.C.; Geethakumar, S.; Can, S.D.L.R.D. High Resolution Fossil Fuel Combustion CO2Emission Fluxes for the United States. Environ. Sci. Technol. 2009, 43, 5535–5541. [Google Scholar] [CrossRef] [PubMed] [Green Version]
- Kahforoushan, D.; Fatehifar, E.; Soltan, J. The Estimation of CO2 Emission Factors for Combustion Sources in Oil and Gas Processing Plants. Energy Sources Part A Recover. Util. Environ. Eff. 2010, 33, 202–210. [Google Scholar] [CrossRef]
- Galician Institute of Statistics (GIS) Databases, Spain. Available online: https://www.ige.eu/igebdt/selector.jsp?COD=5230&paxina=001&c=0201001006 (accessed on 15 January 2019).
- Spanish Regulations for Thermal Facilities in Buildings (RITE). Gobierno de España; Ministerio de la Presidencia, Ed.; Marcombo, SA: Barcelona, Spain, 2008. [Google Scholar]
- NTP 501. Thermal Environment: Local Thermal Discomfort. National Institute for Occupational Safety and Health (INSHT). Available online: https://www.insst.es/documents/94886/327064/ntp_501.pdf/24b8f22e-7ce7–43c7-b992-f79d969a9d77 (accessed on 15 January 2019).
- CO2 Emission Factors and Transfer Coefficients to Primary Energy of Different Sources of Final Energy Consumed in Spanish Buildings MINETUR (March, 2014) Based on Data Published by the Joint Research Center (JRC) of EU: Walk to tank Report, 4.0. Available online: http://www.minetur.gob.es/energia/desarrollo/EficienciaEnergetica/RITE/propuestas/Documents/2014_03_03_Factores_de_emision_CO2_y Factores_de_paso_Efinal_Eprimaria_V.pdf (accessed on 23 February 2020).
Figure 1.
Galicia and the province of Pontevedra.

Figure 2.
Comparative cost consumption and CO2 emissions when biomass replaces the fuel used.

Figure 3.
Comparative results in municipalities selected for Group I considering the three scenarios and biomass as alternative to the use of fuel (complete results in Table A11 in the Appendix A).
Figure 3.
Comparative results in municipalities selected for Group I considering the three scenarios and biomass as alternative to the use of fuel (complete results in Table A11 in the Appendix A).
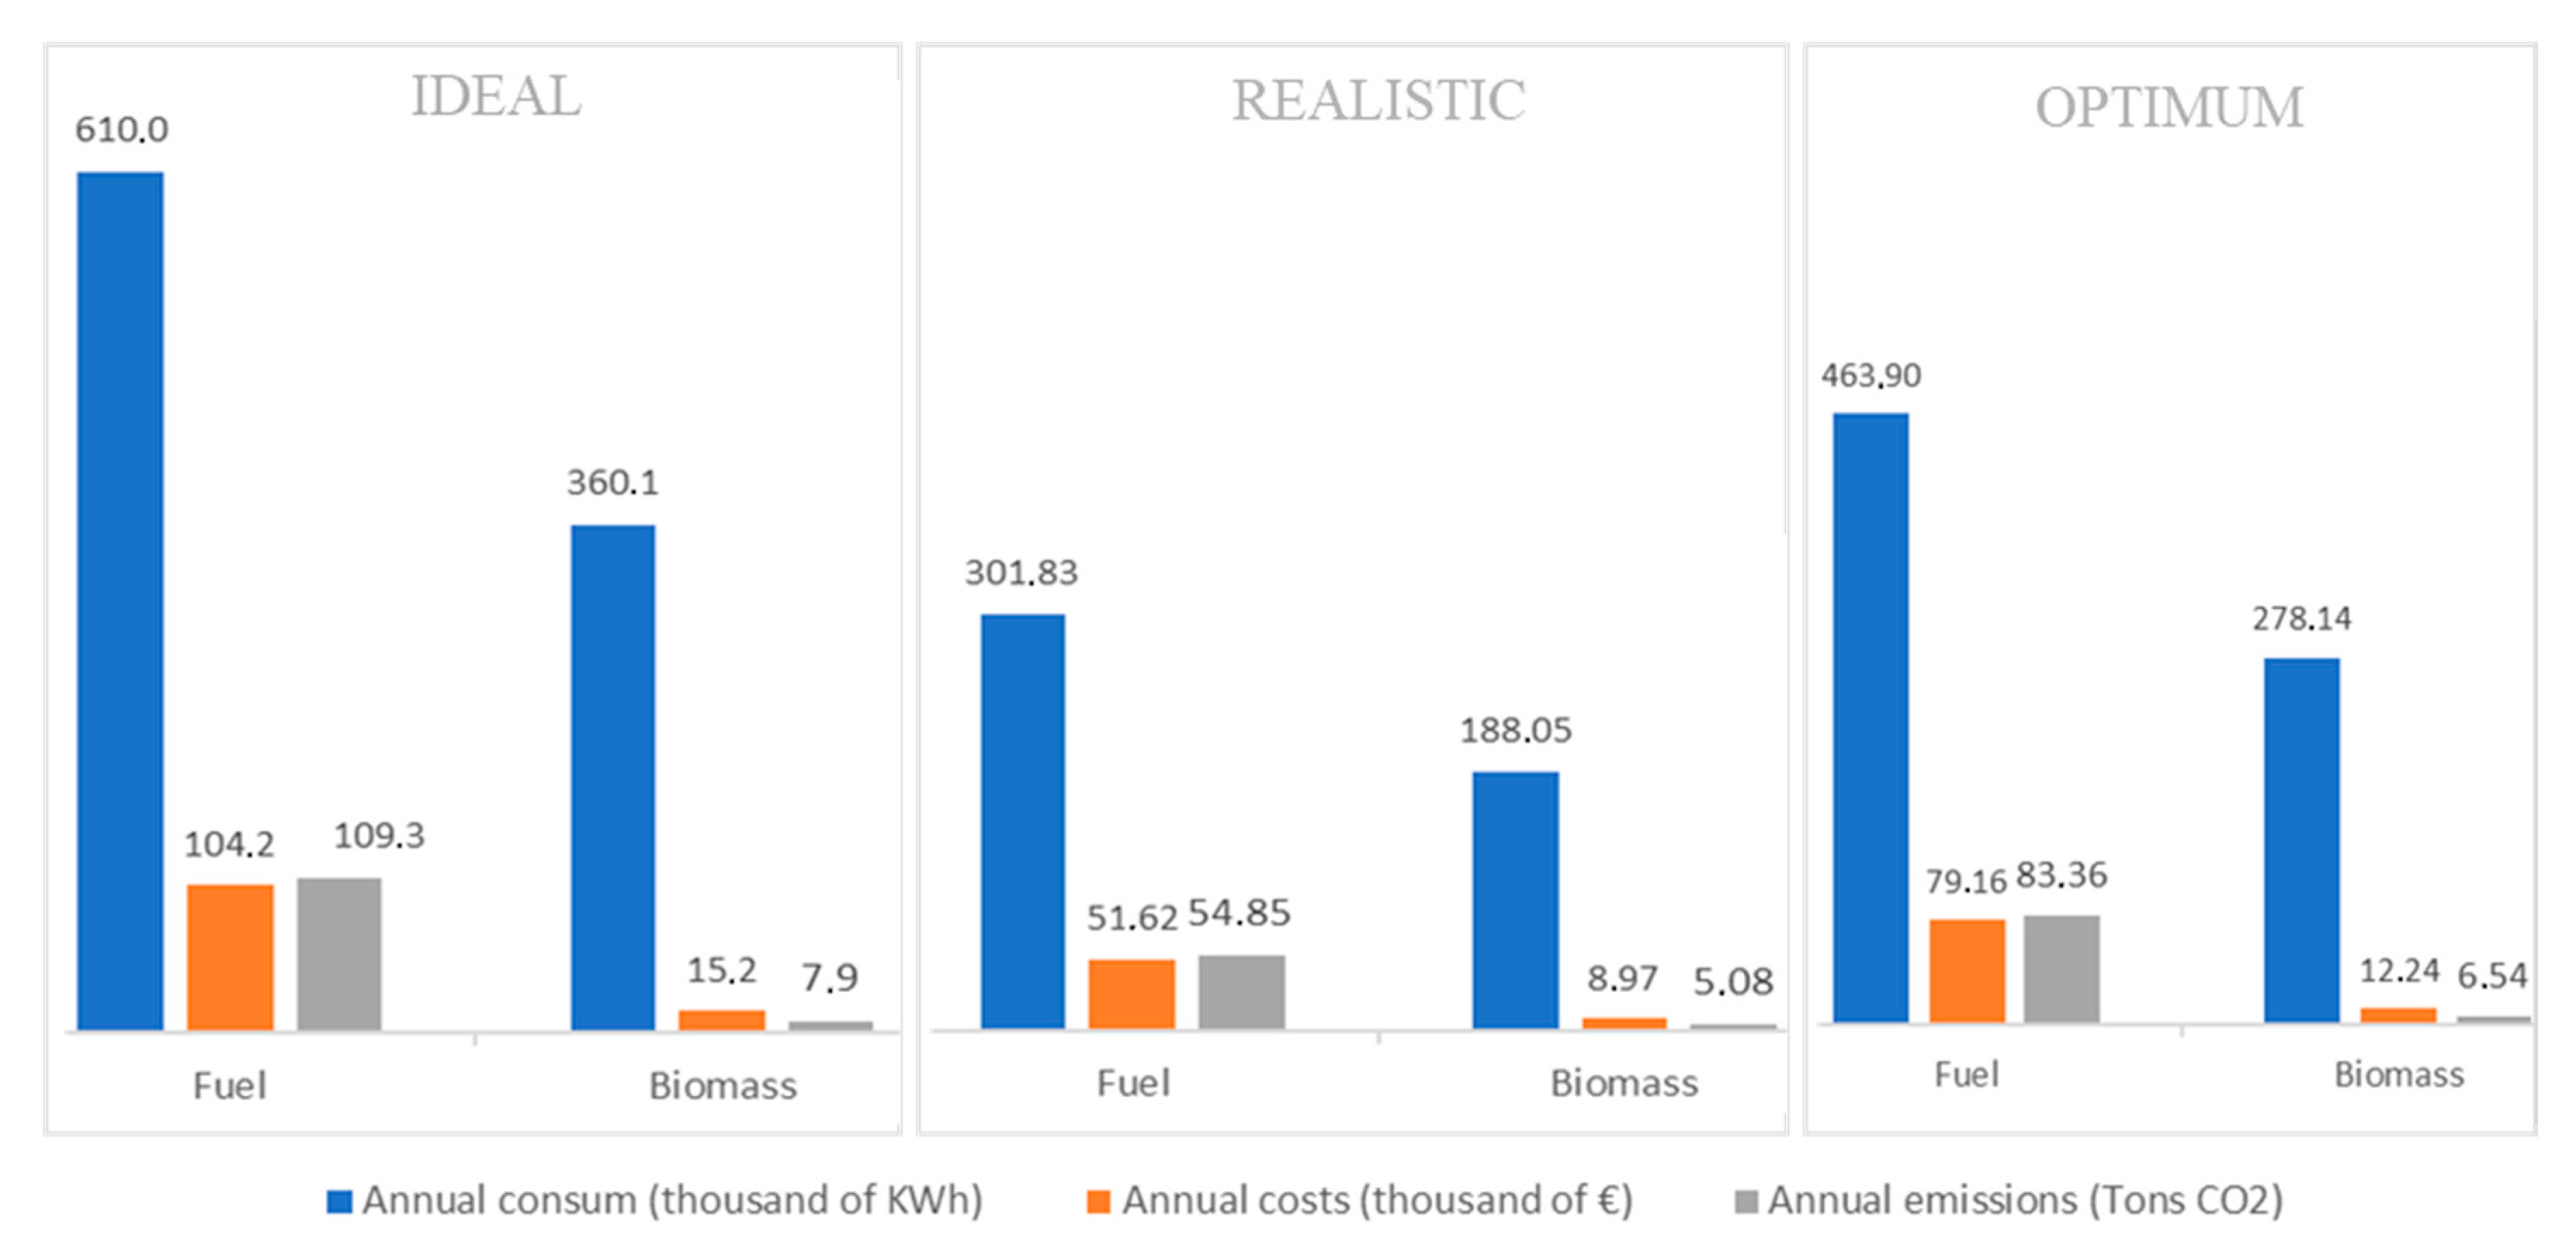
Figure 4.
Extrapolation to the entire Pontevedra province. Optimum scenario (complete results in Table A12 in the Appendix A).
Figure 4.
Extrapolation to the entire Pontevedra province. Optimum scenario (complete results in Table A12 in the Appendix A).
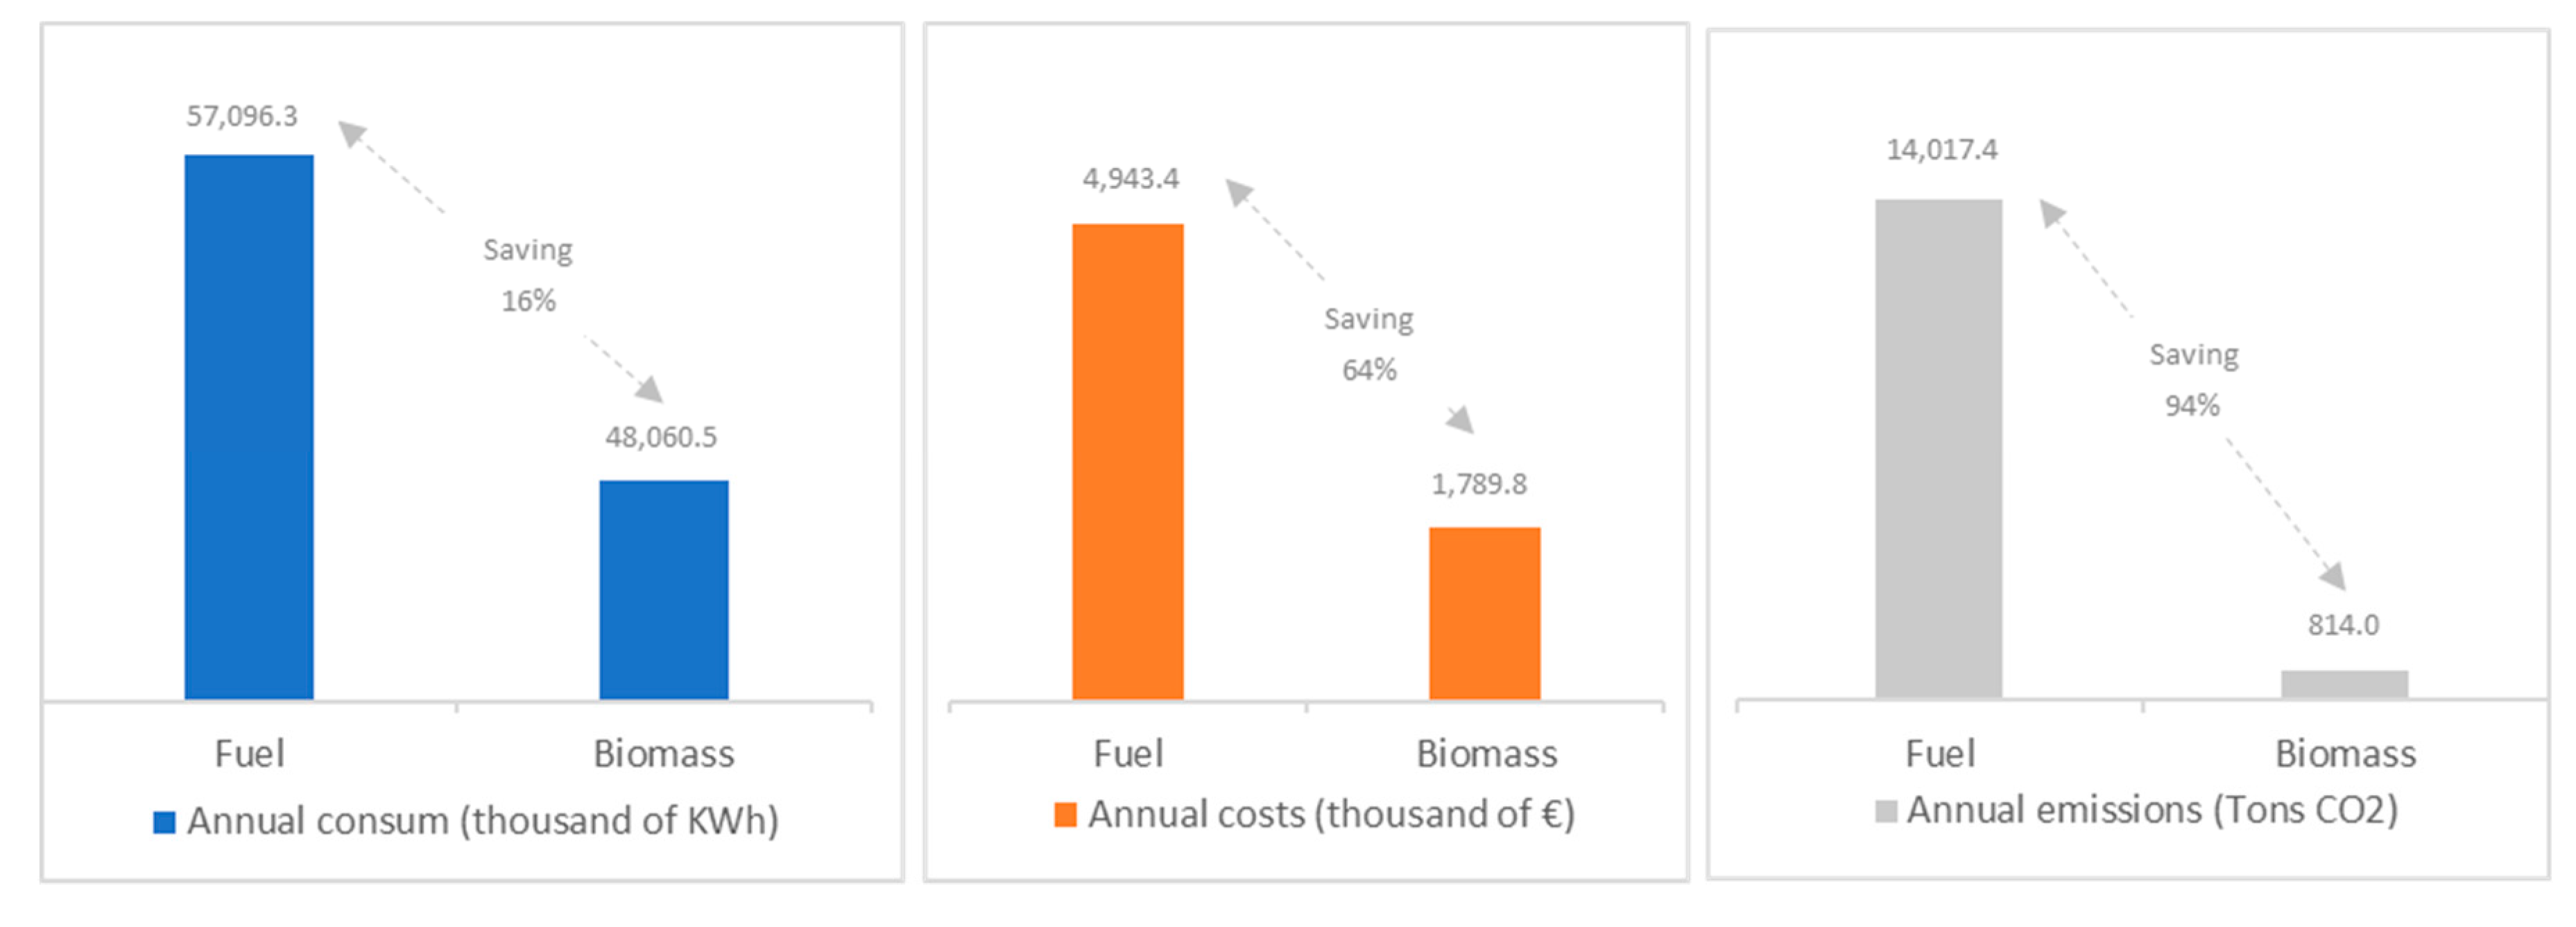
Table 1.
Pilot municipality calculations: ideal scenario.
| Building | Ep (kWh/year) | Cost (euros/year) * | kgCO2/year |
|---|---|---|---|
| City hall | 109,723.30 | 20,781.59 | 17,789.35 |
| Library | 100,864.33 | 19,103.70 | 16,353.05 |
| Social center | 191,713.70 | 36,319.57 | 31,082.39 |
| School of music | 63,266.37 | 5187.84 | 16,646.23 |
| Care center | 25,707.85 | 2108.04 | 6764.08 |
| Sports center | 81,673.90 | 15,469.04 | 13,241.73 |
| Football stadium (1) | 13,995.98 | 2650.84 | 2269.16 |
| Football stadium (2) | 23,056.32 | 2543.11 | 5136.21 |
| Total | 610,001.75 | 104,154.73 | 109,282.2 |
* For the calculation of the costs, it was necessary to determine both the consumption and the unit price of each fuel used in the different municipal buildings. Once the consumptions for each type of installation were established using the model developed, the unit price was obtained from the different invoices of each building, and then compared with the rates collected by the Institute for Energy Diversification and Saving (IDEA). While this information cannot be provided due to the confidentiality of the invoices, we can confirm that all prices paid were within the standard prices in the Spanish energy market (IDAE, 2013).
Table 2.
Parameters of the proposed scenarios.
| Parameter | Ideal Scenario | Realistic Scenario | Optimum Scenario * |
|---|---|---|---|
| Indoor design Ta | 21 °C | 18 °C | 21 °C |
| Heating use (hours/day) | 100% | 60% | 80% |
| Heating use (months) | November to May | November to March | November to mid-April |
* Based on Spanish Regulations for Thermal Facilities in Buildings (RITE) (2008, 2014) and National Institute for Occupational Safety and Health (INSHT) (1998) parameters described previously.
Table 3.
Groups of municipalities.
| Group | Number of Inhabitants | Number of Municipalities | Municipality Selected | Buildings Analyzed |
|---|---|---|---|---|
| I | 2000–5000 | 18 | Mondariz | 8 |
| II | 5001–10,000 | 14 | Salvaterra do Miño | 7 |
| III | 10,001–20,000 | 16 | O Porriño | 8 |
| IV | >20,001 | 7 (2 exclusions) | Vilagarcía de Arousa | 10 |
© 2020 by the authors. Licensee MDPI, Basel, Switzerland. This article is an open access article distributed under the terms and conditions of the Creative Commons Attribution (CC BY) license (http://creativecommons.org/licenses/by/4.0/).
Share and Cite
MDPI and ACS Style
Pardo, J.E.; Mejías, A.; Sartal, A. Assessing the Importance of Biomass-Based Heating Systems for More Sustainable Buildings: A Case Study Based in Spain. Energies 2020, 13, 1025. https://doi.org/10.3390/en13051025
AMA Style
Pardo JE, Mejías A, Sartal A. Assessing the Importance of Biomass-Based Heating Systems for More Sustainable Buildings: A Case Study Based in Spain. Energies. 2020; 13(5):1025. https://doi.org/10.3390/en13051025
Chicago/Turabian StylePardo, Juan E., Ana Mejías, and Antonio Sartal. 2020. "Assessing the Importance of Biomass-Based Heating Systems for More Sustainable Buildings: A Case Study Based in Spain" Energies 13, no. 5: 1025. https://doi.org/10.3390/en13051025
Note that from the first issue of 2016, this journal uses article numbers instead of page numbers. See further details here.