Article

Paleoenvironment and Organic Matter Accumulation of the Upper Ordovician-Lower Silurian, in Upper Yangtze Region, South China: Constraints from Multiple Geochemical Proxies

1
School of Geoscience and Technology, Southwest Petroleum University, Chengdu 610500, China
2
State Key Laboratory of Oil and Gas Reservoir Geology and Exploitation, Southwest Petroleum University, Chengdu 610500, China
3
Research Institute of Petroleum Exploration&Development, PetroChina, Beijing 100083, China
4
College of Geophysics and Petroleum Resources, Yangtze University, Wuhan 430100, China
5
Shale Gas Research Institute, PetroChina Southwest Oil&Gas Field Company, Chengdu 610051, China
*
Author to whom correspondence should be addressed.
Energies 2020, 13(4), 858; https://doi.org/10.3390/en13040858
Submission received: 18 January 2020 / Revised: 12 February 2020 / Accepted: 14 February 2020 / Published: 16 February 2020

Abstract

:
The origin of the organic-rich shale in the Upper Ordovician Wufeng Formation and Lower Silurian Longmaxi Formation is complex and controversial. This paper reports the geochemical data of Wufeng-Longmaxi Formations in the Upper Yangtze region to restore the paleoenvironment and explore the accumulation mechanism of organic matter. The total organic carbon (TOC) content of the Wufeng Formation was relatively high, with an average of 2.86%. The Lower Longmaxi Formation showed the highest TOC content, with an average of 3.99%, and the upper part was a continuously low value with an average of 1.22%. The paleoproductivity proxies (Babio, Cu/Al, Ni/Al, Siexcess) showed that in the Katian and Rhuddanian-Aeronian Stages, the Upper Yangtze Sea had high primary productivity, indicating that organic matter accumulation was more affected by terrigenous influx and redox conditions. Al, Zr, and Zr/Al indicated that terrigenous influx was relatively high in the Kaitian-Hirnantian Stages, it was at a constant low in the Rhuddanian Stage, and increased again in the Aeronian Stage. The correlations between redox-sensitive trace elements (Mo, U, V) and TOC indicate that the organic-rich shale of the Wufeng Formation was deposited in the anoxic–euxinic environment. In the Longmaxi Formation, organic-rich shales formed in a more hypoxic environment, and overlying organic-lean shales formed in a suboxic environment. Therefore, the anoxic–euxinic conditions of the Late Ordovician Yangtze Sea were the main reason for the organic matter accumulation, but the high terrigenous influx caused by regression and/or structural controls diluted the organic matter to some extent. For the Early Silurian, a complete transgression–regression cycle changed terrigenous influx and redox conditions, resulting in significant differences in organic matter accumulation.

1. Introduction

In specific geological periods and sedimentary environments, the Earth has formed organic-rich shales with strong heterogeneity (mineral composition, geochemical elements, organic content, etc.) [1]. Organic-rich shale is a result of the synergistic effect of paleoclimatology, paleoceanology, and paleontology caused by geological events [2,3]. Previous studies have shown that factors affecting organic matter accumulation may include sea level rising, anoxic events, plankton proliferation, and seawater stratification [4,5,6]. However, there is no widely accepted accumulation mechanism of organic matter. The key to the debate is whether productivity plays a major controlling role or other factors such as anoxic events [7,8,9,10].
Environmental evolution has a great influence on the geochemical elements of shale [11,12], which provides a feasible method for reconstructing the paleoenvironment and exploring the accumulation mechanism of organic matter. U, V, and Mo, as commonly used redox-sensitive elements (RSTEs), show significant enrichment in a reducing environment and are considered to be reliable indicators for restoring paleoredox conditions [12,13,14]. Recent studies have shown that the correlations of MoEF-UEF and redox-sensitive trace elements-total organic carbon can further reflect the restriction degree and redox conditions [11,13]. Elements such as Ba, Cu, and Ni are closely related to the flourish degree of plankton in the ocean, and can be used to indicate the strength of primary productivity [13,15,16]. In addition, due to the influence of paleoclimate and/or structural controls, terrigenous influx is also one of the important factors controlling the accumulation of organic matter, and Al, Zr and their ratio are often used as reliable proxies [4,12].
The Ordovician-Silurian transition (about 448–438 Ma) is an important period in geological history, characterized by tectonic events, large-scale glaciation, mass extinction, and volcanic activity [5,17,18,19]. The Wufeng-Longmaxi Formations’ shale in the Upper Yangtze region is a complete record of the transition period [20], and is also the main exploration target for shale gas in China [1]. There have been many studies on stratigraphy, paleontology, and lithofacies paleogeography [21,22,23], which have laid the foundation for the study of the organic matter accumulation mechanism. In this study, three boreholes (W201, N216, and YZ1) were selected to establish the chemical stratigraphic framework, and the paleoenvironment was restored to clarify the accumulation mechanism of organic matter. The following are specifically discussed: (1) geochemical characteristics of the Wufeng-Longmaxi Formations; (2) the evolutionary characteristics of terrigenous influx, redox conditions and productivity; and (3) the controlling factors and modes of organic matter accumulation.

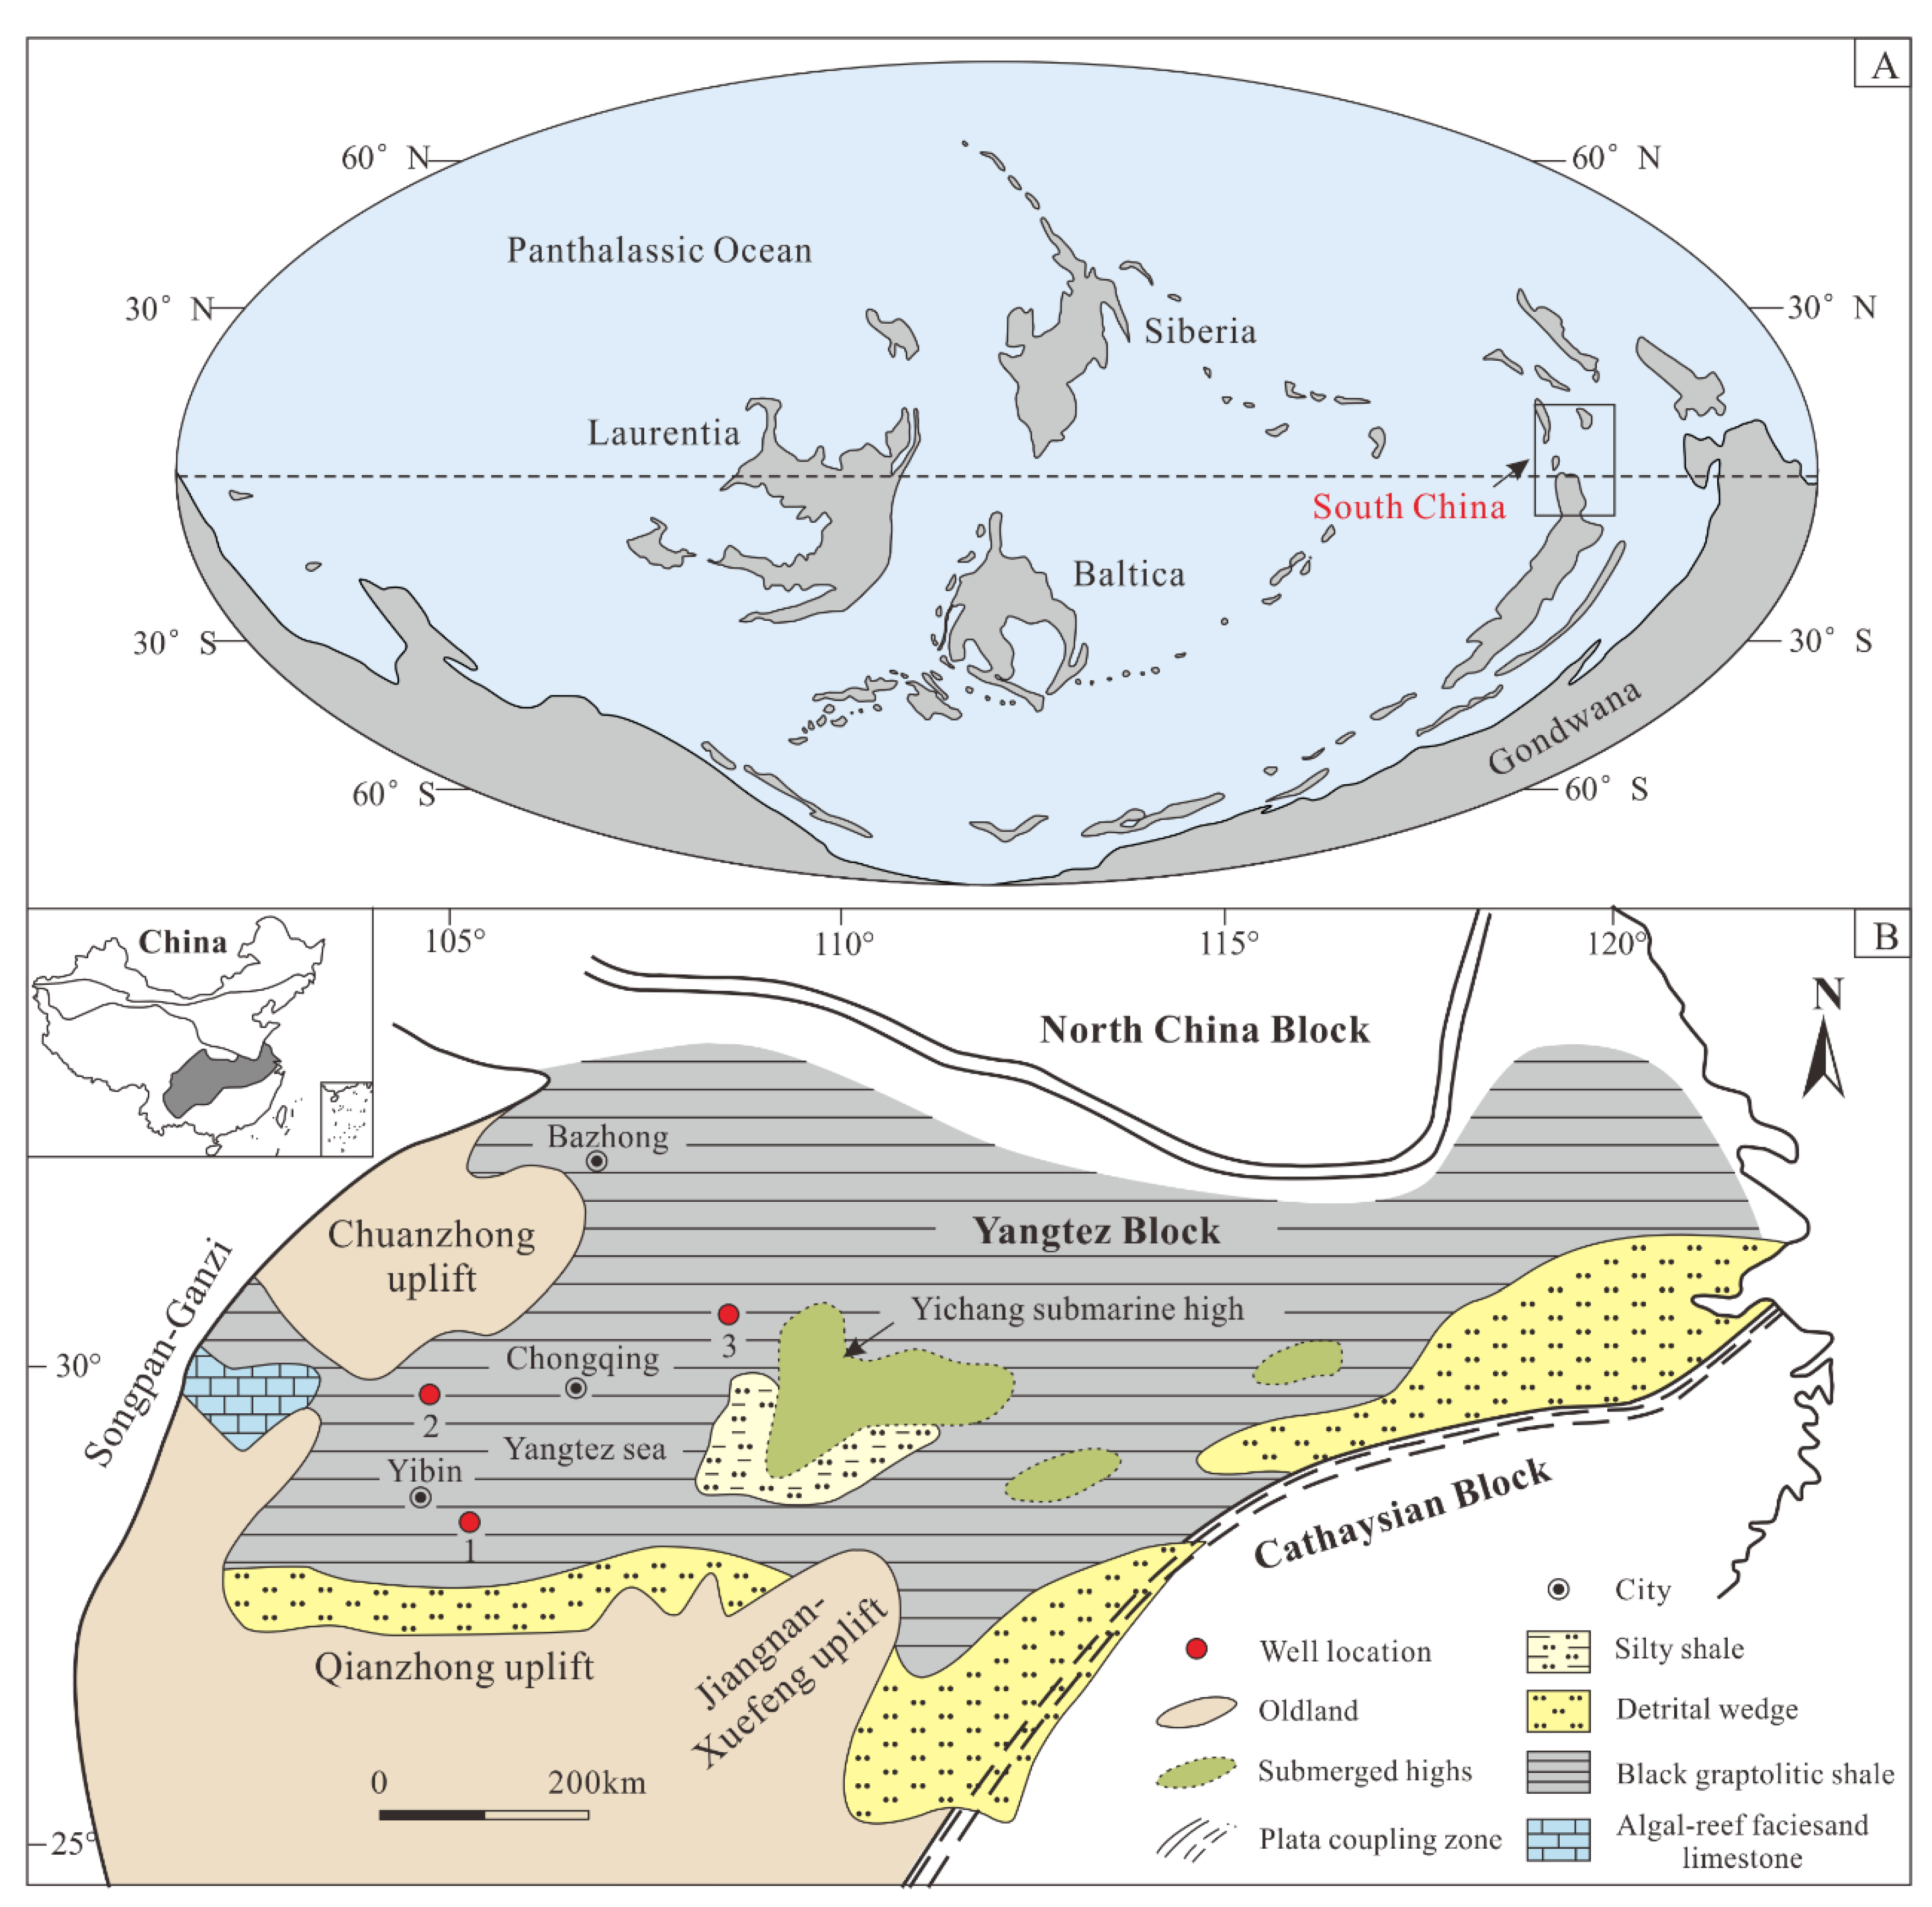
2. Geological Setting

In the Late Ordovician to Early Silurian, South China was located near the ancient equator (Figure 1A) [24]. The Yangtze Sea was overlying on the block and bordered the Pearl River Sea in the southeast of the block, and it may have been interconnected with the global ocean [17]. During this period, the Caledonian Movement reached its peak, and the Chuanzhong uplift, the Qianzhong uplift, and the South China Xuefeng uplift formed in the Upper Yangtze region due to strong compressive stress (Figure 1B) [21]. Influenced by these uplifts, the Yangtze Sea was confined to a semi-closed bay, resulting in sea level rising and sea area decreasing [22]. Under this background of geology, a set of thick-bedded organic-rich black shale was deposited in a relatively low-energy and anoxic environment in the Upper Yangtze region [16].
The shale sequence deposited on the Upper Yangtze region during the transitional period is composed of the Upper Ordovician Wufeng Formation and the Lower Silurian Longmaxi Formation (Figure 2). The Wufeng Formation can be divided into the graptolite shale (GS) member in the lower part and the overlying Guanyinqiao (GYQ) member [4,25]. Deposition of the GS member began with a transgression event occurring simultaneously with the Dicelograptus complexus zone at the mid-Katian Stage [5,20]. The lithology of the GS member is organic-rich siliceous shale, about 10 m thick. The deposition of the GYQ member is attributed to the large drop in sea level caused by the Hirnantian glaciation. The lithology of the GYQ member is calcareous mudstone and limestone, about 1 m in thickness, corresponding to the Normalograptus extraprdomarius, and Hirnantia Fauna zone [1,20]. The Longmaxi Formation can be subdivided into two units: the upper part and the lower part. The deposition of the Lower Longmaxi Formation was synchronized with a global transgression event, and the lithology is a set of organic-rich black siliceous shale, about 15 m in thickness, corresponding to the zone between Nomalograptus Persculptus and Coronograptus cyphus [1,20]. The sediments in the upper Longmaxi Formation are marked by the appearance of the Demirastrites triangulatus zone, and a set of organic-lean grey silty shale with siltstone layers were deposited under the global regressive background [5,20,26].

3. Samples, Procedures, and Data Analysis

3.1. Analytical Procedures

In this study, a total of 71 rock samples were analyzed. The actual testing work included 34 rock samples from N216 and 18 rock samples from W201. The data of 19 samples from YZ1 were cited from Zhao et al. [16]. For each sample, two equal weight samples were weighed and ground into about 80 mesh and < 200 mesh powders, respectively. Afterward, the 80 mesh powder was sent to the Analytical Experiment Center of the Exploration and Development Research Institute of Southwest Oil and Gas Field Company of Chengdu City, Sichuan Province, where the total organic carbon content (TOC) was measured using a LECO CS230 carbon sulfur analyzer. The powder samples that were ground to < 200 mesh were sent to ALS Minerals–ALS Chemex, Guangzhou, Guangdong Province for major and trace elements testing.
Major element (Si, Al, Ca, etc.) analysis involved burning the sample in a muffle oven at 1000 °C for 3–4 h. After the crucible was cooled, the ashed sample was weighed and the loss on combustion was calculated for correction. About half of the ashed sample was mixed with 8-fold lithium tetraborate (Li2B4O7) and fused into glass beads, and then analyzed using a PANalytical PW2424 x-ray fluorescence (XRF). The analysis error was less than 5%.
Measurements of trace elements (Mo, U, V, etc.) require two samples. One sample was taken and digested with perchloric acid, nitric acid, and hydrofluoric acid. After evaporation, dilute hydrochloric acid was added to dissolve to a constant volume, and then an Agilent VISTA plasma emission spectrometer (ICP-AES) and an Agilent 7900 plasma mass spectrometer (ICP-MS) were used for the analysis. LiBO2/Li2B4O7 solvent was added to another sample and melted at 1025 °C. After cooling and diluting to a constant volume with dilute hydrochloric acid, it was analyzed with an Agilent 7900 Plasma Mass Spectrometer (ICP-MS). According to the results of the two measurements, the concentration of trace elements was obtained, and the error was less than 10%.

3.2. Data Presentation

The trace elements in marine shale are usually a mixture of autogenous components and terrigenous clastic components, of which only the concentration of autogenous components varies with the redox conditions of the sedimentary water mass [27]. Biogenic silica in sediments or sedimentary rocks can dilute trace elements in rock samples. In order to minimize this dilution effect, aluminum normalization is usually used. This is due to the fact that aluminum is a reliable proxy for clay mineral content in fine-grained clastic deposits, and the concentration of which is largely unaffected by weathering and post-deposition alterations [12]. The trace element concentration is given in the form of an enrichment factor (EF), obtained by comparing the normalized concentration of aluminum with that of the average shale (AS) [28], and it is calculated as follows:
XEF = (X/Al)sample/(X/Al)average shale
where X and Al represent the weight concentrations of the elements X and Al, respectively, and average shale represents the composition of the Paleozoic to Cenozoic shale [28]. When XEF > 3, it was considered that element X was autogenously enriched relative to the average shale; XEF > 10 indicates strong autogenous enrichment; and XEF < 1 indicates element concentration was consumed [12].
The Ba concentration required for vital activities (Babio) was calculated by Murray and Leinen [29].
Babio = Batot − (Altot × Ba/Alalu)
where Batot and Altot are the measured volume concentrations; and Ba/Alalu represents the Ba/Al ratio of aluminosilicate debris in the surface rock, which can represent the terrigenous influx of the sediments. The Ba/Al ratio of the aluminosilicate component in surface rock is between 0.005 and 0.01 [30], and the intermediate value, 0.0075, is used to calculate the Babio content [31].
Through previous studies, it has been proven that, compared with the average shale, excess silica in the shale of the study area is biogenetic [16]. Therefore, its value can reflect the strength of productivity. The calculation formula is as follows [32]:
Siexcess = Sisample − [(Si/Al) background × Alsample]
where Si and Al represent the weight concentrations of the elements Si and Al, respectively; and the (Si/Al) background is calculated by shale from the Paleozoic to Cenozoic, with an average of 3.11 [28].

4. Results

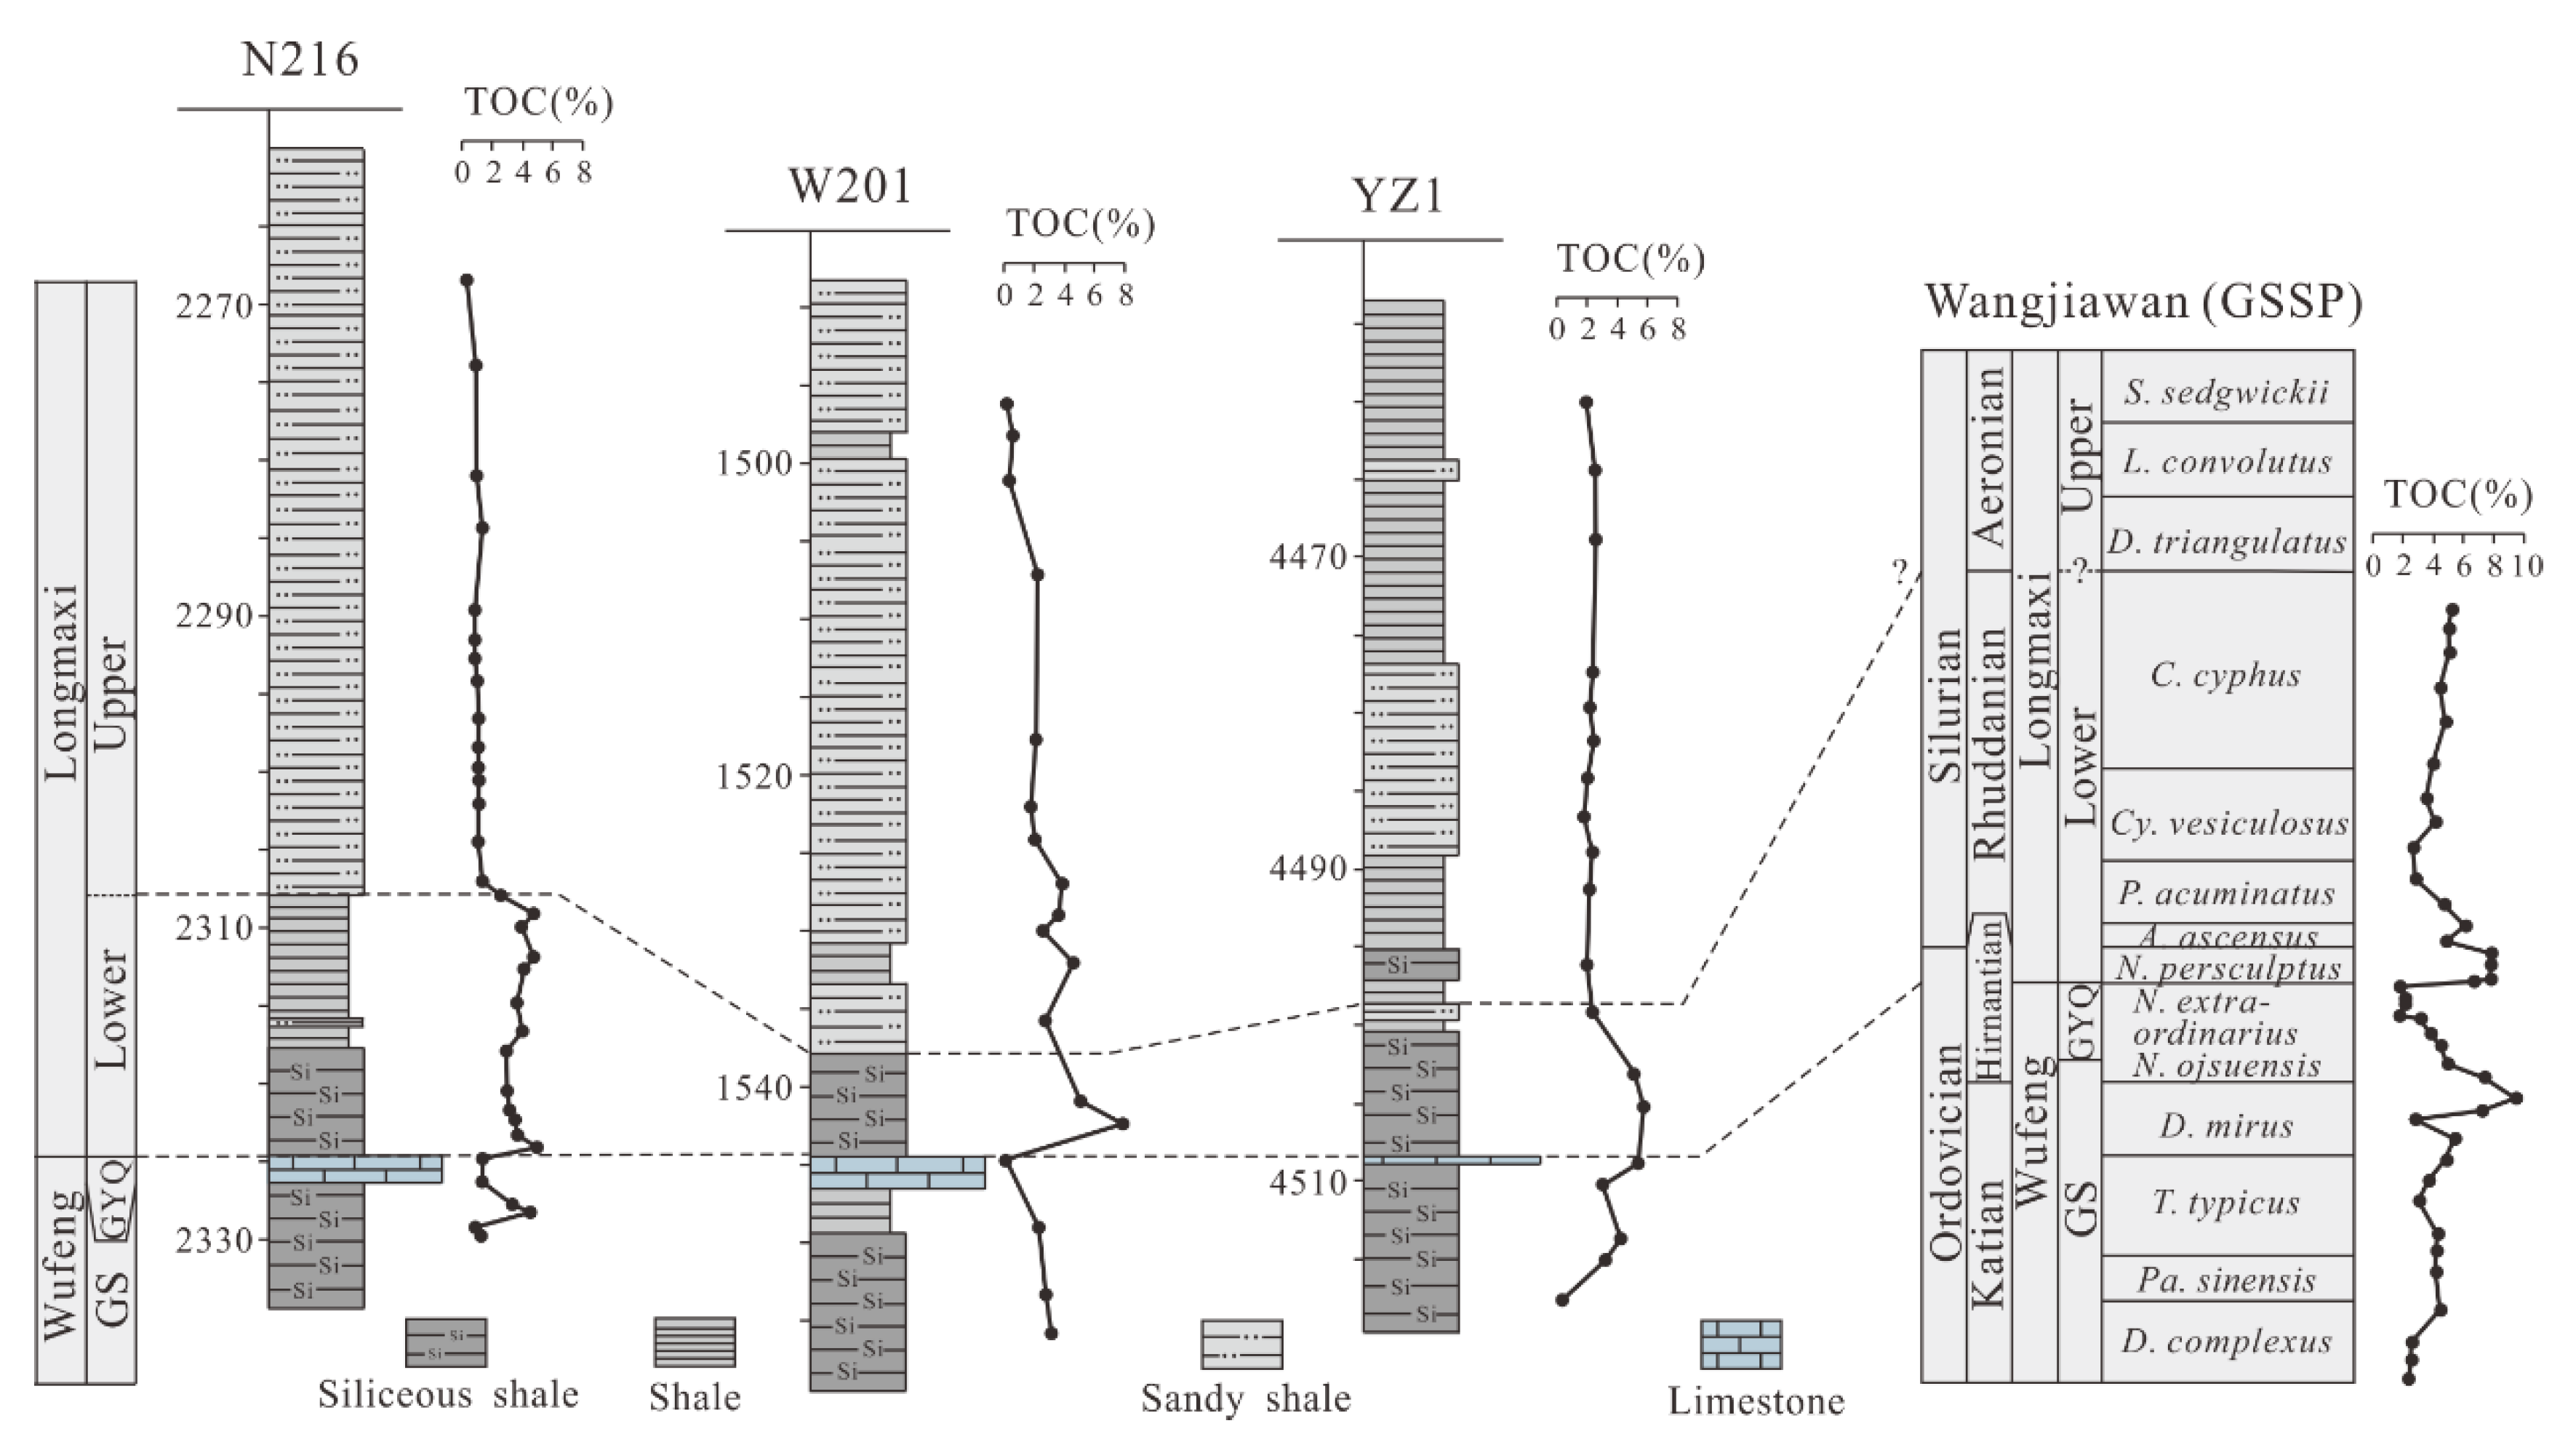
4.1. Total Organic Carbon Content
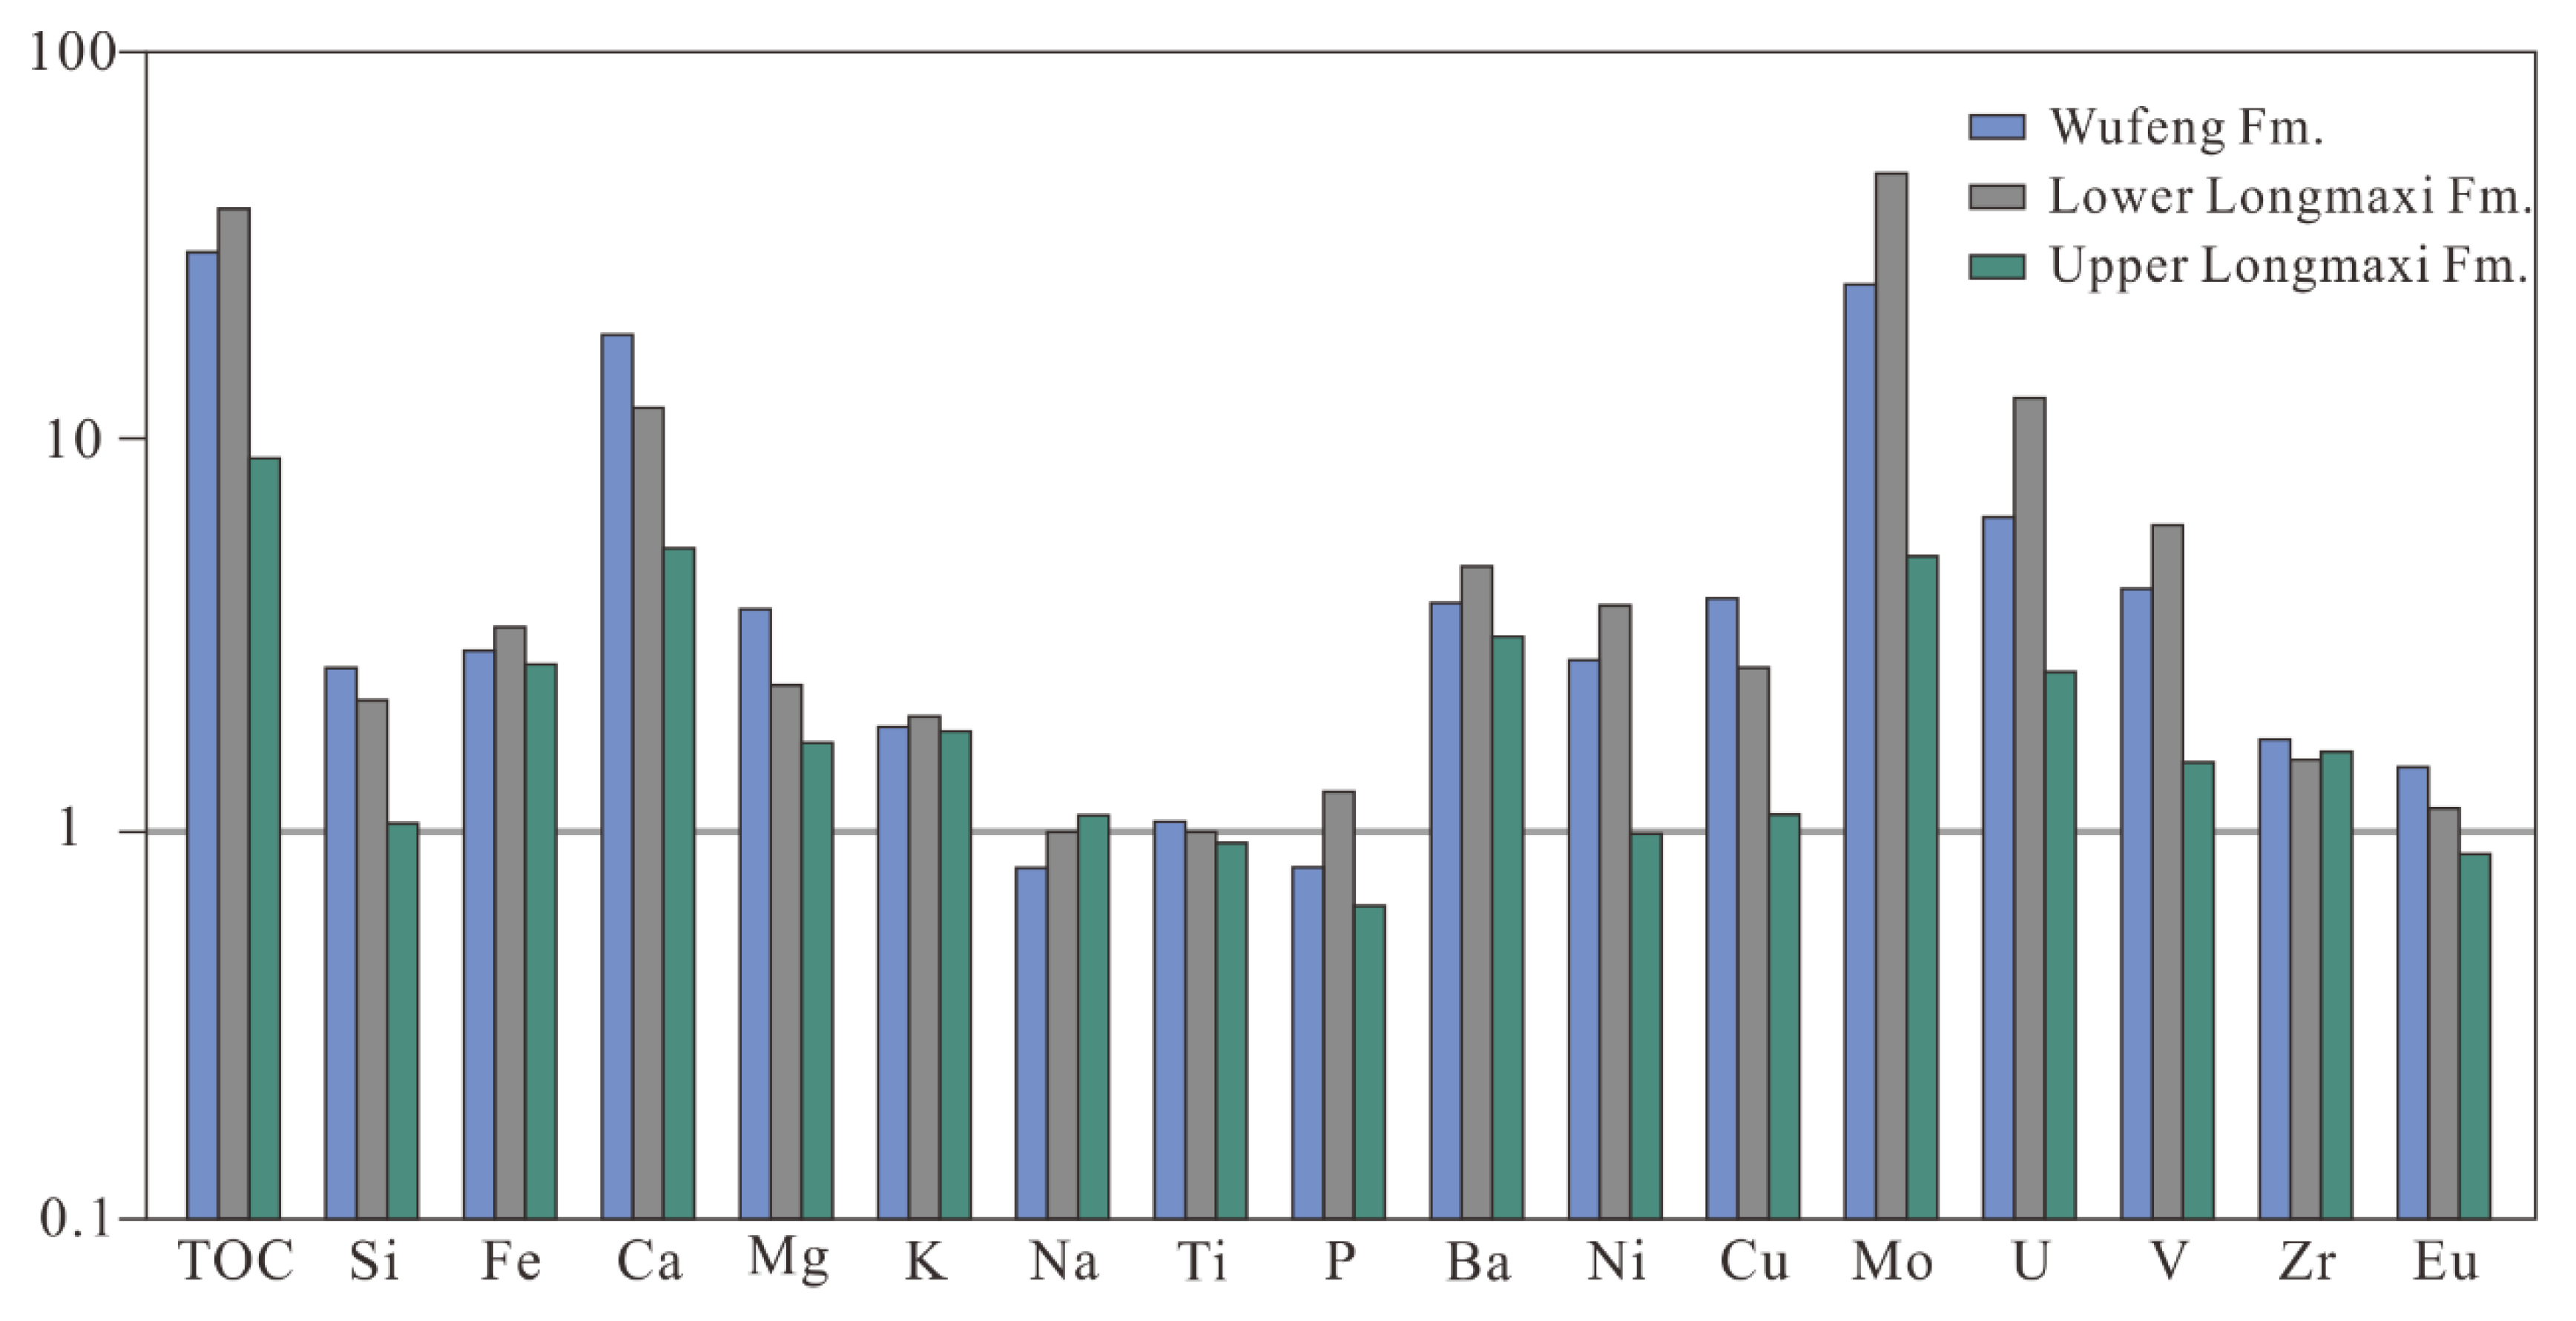
The total organic carbon content showed obvious vertical variation and a similar trend in the three boreholes. On the basis of a combination of petrology and biostratigraphy study, the deposits during the Ordovician-Silurian transition period were divided into four units (Figure 2) [20,25]. The TOC content of the Wufeng Formation of the Upper Ordovician was relatively high (avg. 2.86%), ranging from 0.10% to 5.40%. The Lower Longmaxi Formation had the highest TOC content (avg. 4.22%), ranging from 2.26% to 7.90%. The upper Longmaxi Formation had the lowest TOC content (avg. 1.76%), and the content was constant, ranging from 0.24% to 4.64%. Compared with the average shale, shale in the Wufeng and Longmaxi Formations were significantly enriched in TOC (Table 1, Figure 3).

4.2. Major Elements

SiO2 (detrital quartz and/or biogenic silica), Al2O3 (clay), and CaO (carbonate) were the main components of shale. Among them, SiO2, the content of which mostly ranged from 22.61% to 81.99%, with an average of 56.53%, was the most prevailing component. Second, the content of Al2O3 was between 2.34% and 19.83%, with an average of 0.75%. The CaO content was lower, ranging from 0.24% to 30.5%, with an average of 7.78%. In addition, the average contents of Fe2O3, K2O, and MgO were 3.82%, 2.80%, and 2.87%, respectively. The concentrations of Na2O, P2O5, and TiO2 were all lower than 1%. Compared with the average shale, major elements including CaO, SiO2, Fe2O3, K2O, and MgO were more enriched in the shale strata, while Na2O, P2O5, and TiO2 showed a partial loss (Table 1, Figure 3).

4.3. Trace Earth Elements

The detrital proxies Al and Zr had similar variation trends (Figure 4). The concentration of Al and Zr in the Wufeng Formation fluctuated drastically, with an average content of 4.39% and 124.77 ppm, respectively. The concentration of Al and Zr in the Lower Longmaxi Formation was constant, with an average of 4.19% and 111.53 ppm, respectively. The concentration of Al and Zr in the upper Longmaxi Formation was the highest, with an average concentration of 7.13% and 204.58 ppm, respectively. Compared with the average shale, the Zr element was more enriched in these strata (Table 1, Figure 3).
The redox-sensitive trace element (RSTE) concentrations showed a similar change trend with that of the TOC content (Figure 4). In the Wufeng Formation, the concentrations of Mo, U, and V were relatively high. In the Lower Longmaxi Formation, the average concentrations of Mo, U, and V were the highest. In the Upper Longmaxi Formation, these elements were low in concentration and had no large fluctuations. The average values of MoEF, UEF, and VEF were greater than 1, indicating that the shale studied was more enriched with RSTEs than the average shale (Table 1, Figure 3). In addition, W201 showed a lower enrichment of RSTEs than the other two boreholes. This was because W201 was close to the Chuanzhong uplift and was in a relatively shallow position of the water mass, which was vulnerable to terrigenous materials and the turbulence of seasonal water mass, resulting in an unstable variation trend of RSTE concentration.
Babio is associated with the decay of phytoplankton, and has been proven to be a reliable primary productivity proxy [31]. The BaEF value of shale was greater than 1, indicating the enrichment of the Ba element (Table 1, Figure 3). However, the fitting degree of the Babio curve and the TOC curve was relatively low, and no obvious correlation was seen between them (Figure 4). The Babio concentration gradually decreased during the deposition of the Wufeng Formation and began to rise after entering the sedimentary period of the Longmaxi Formation. The Babio concentration in N216 and YZ1 were significantly higher than that in W201, indicating that the productivity in the deep water area was significantly higher than that of the shallow water area. Other primary productivity proxies such as Cu, Ni, and Siexcess showed similar change laws to that of TOC (Figure 4), where the Cu and Ni elements showed a certain degree of enrichment in the Wufeng-Lower Longmaxi Formations (Table 1, Figure 3).

5. Discussion

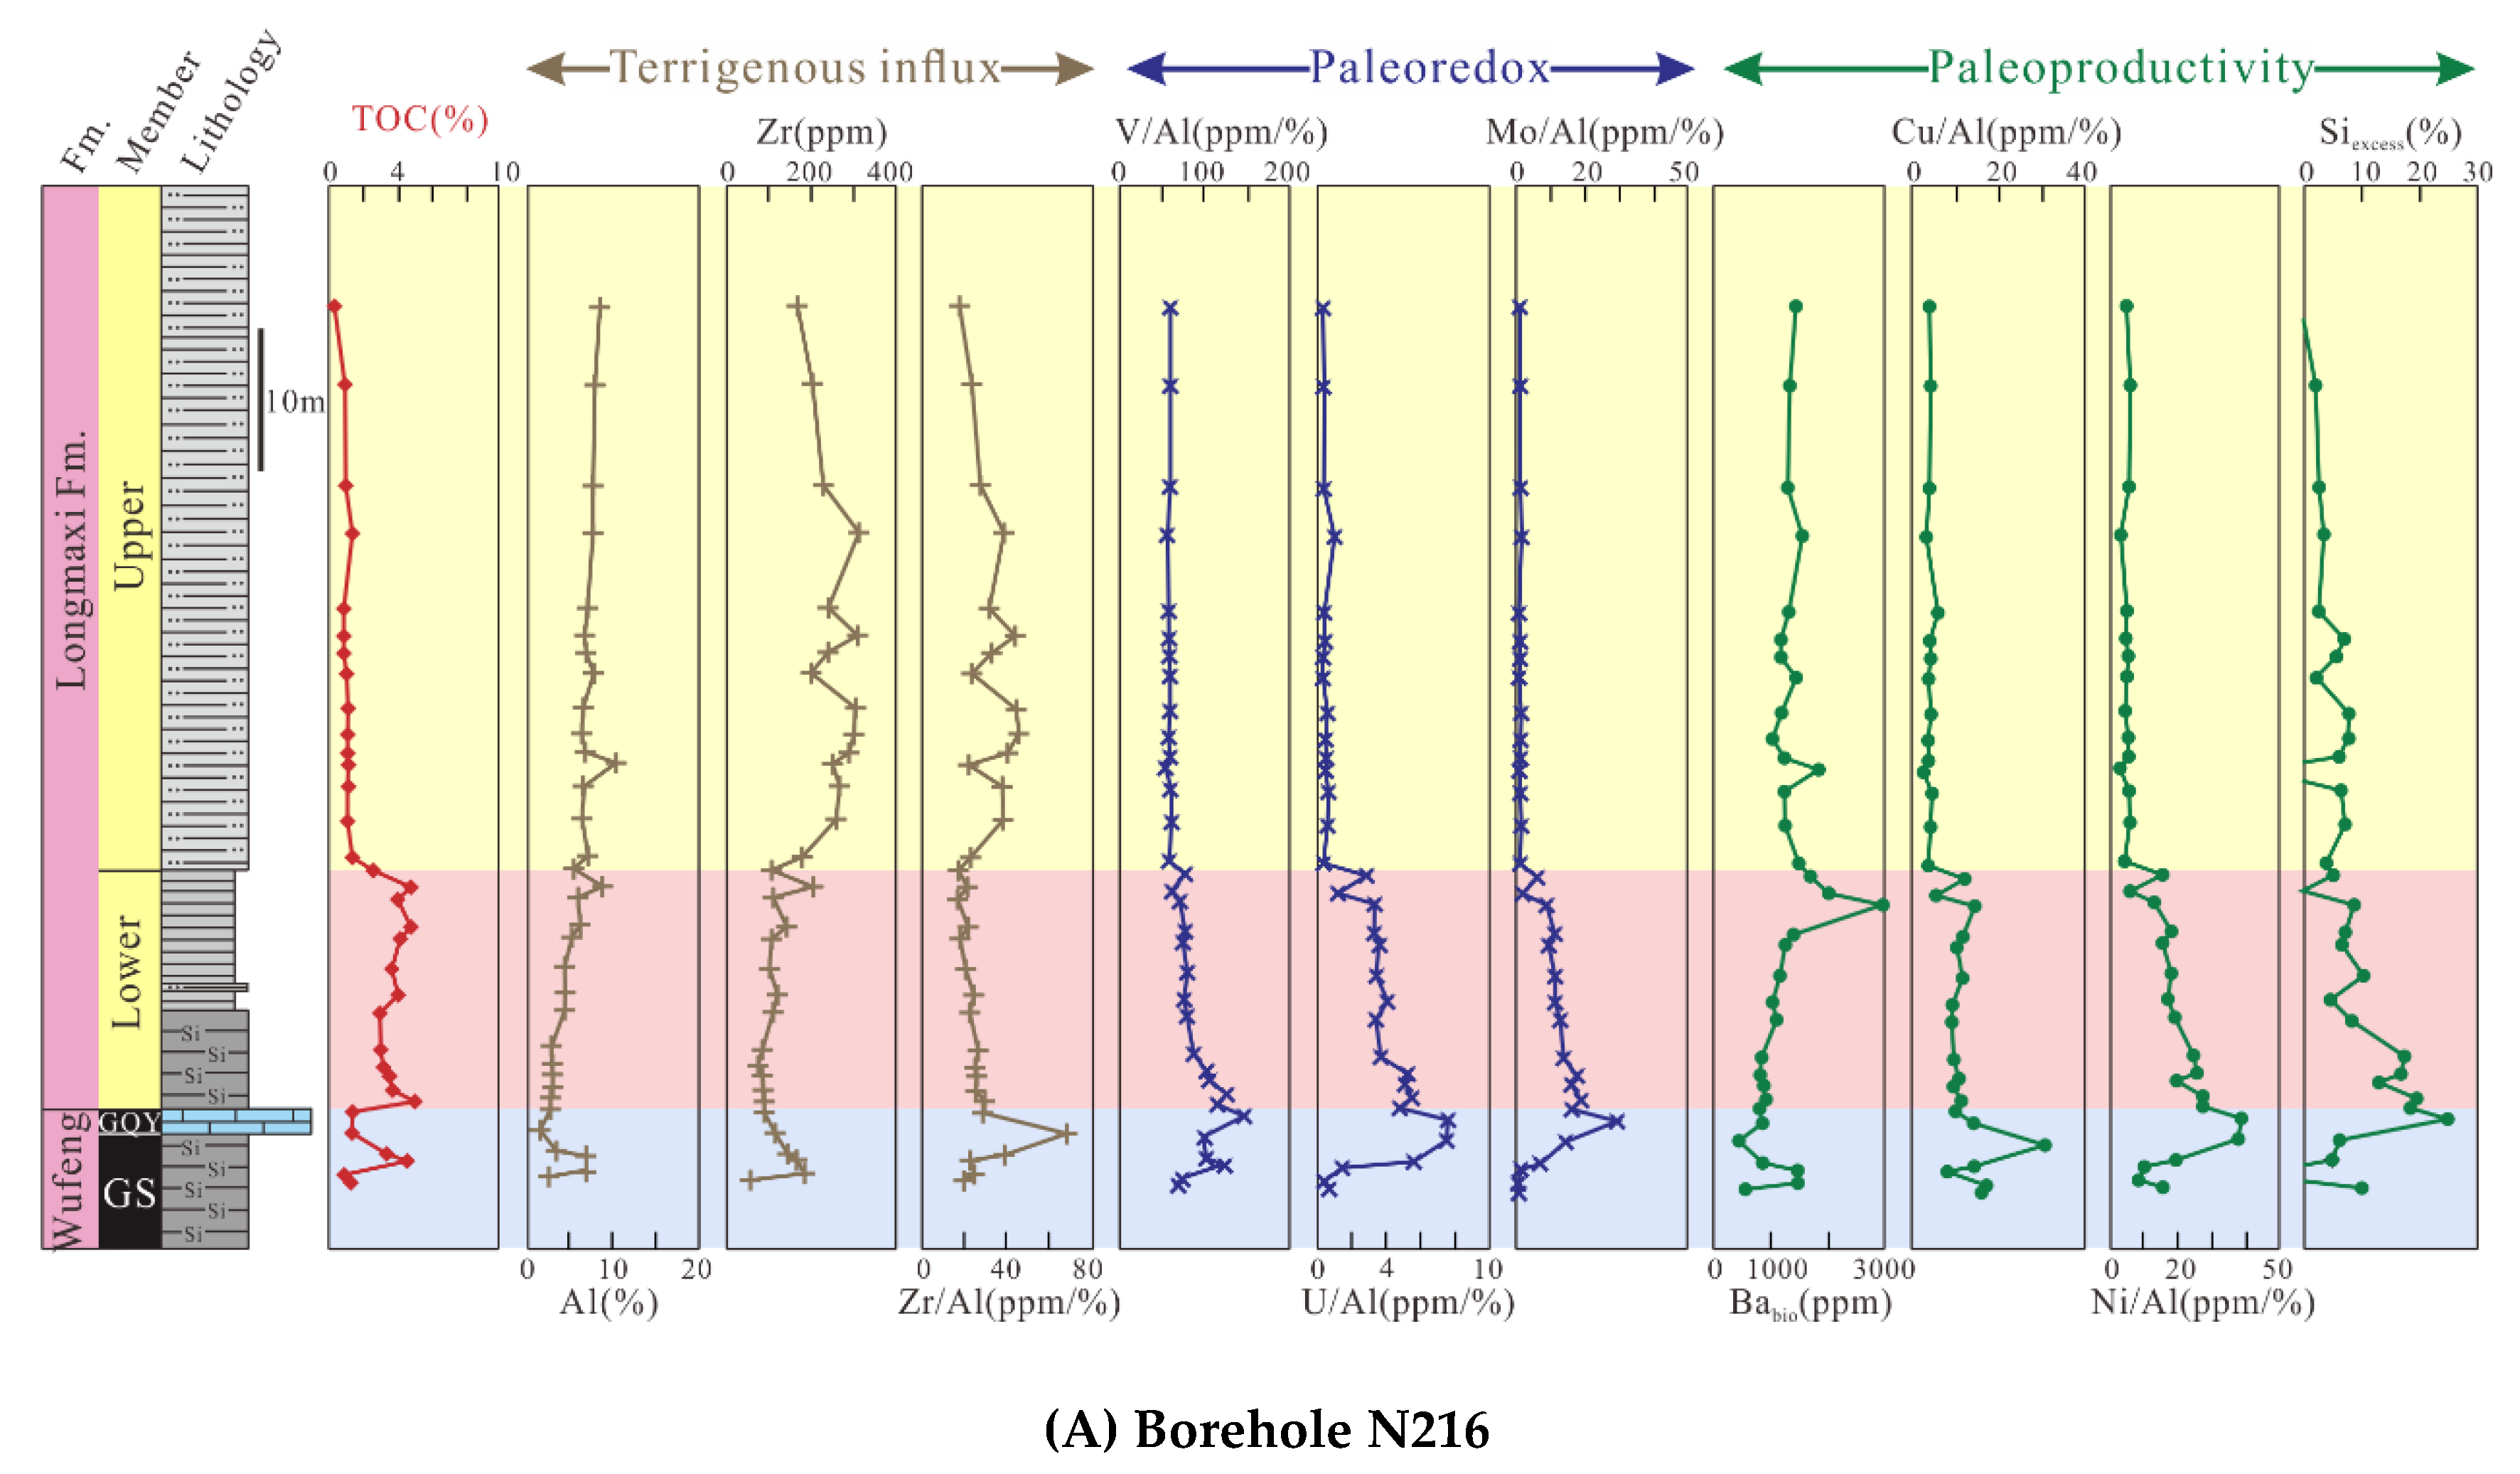
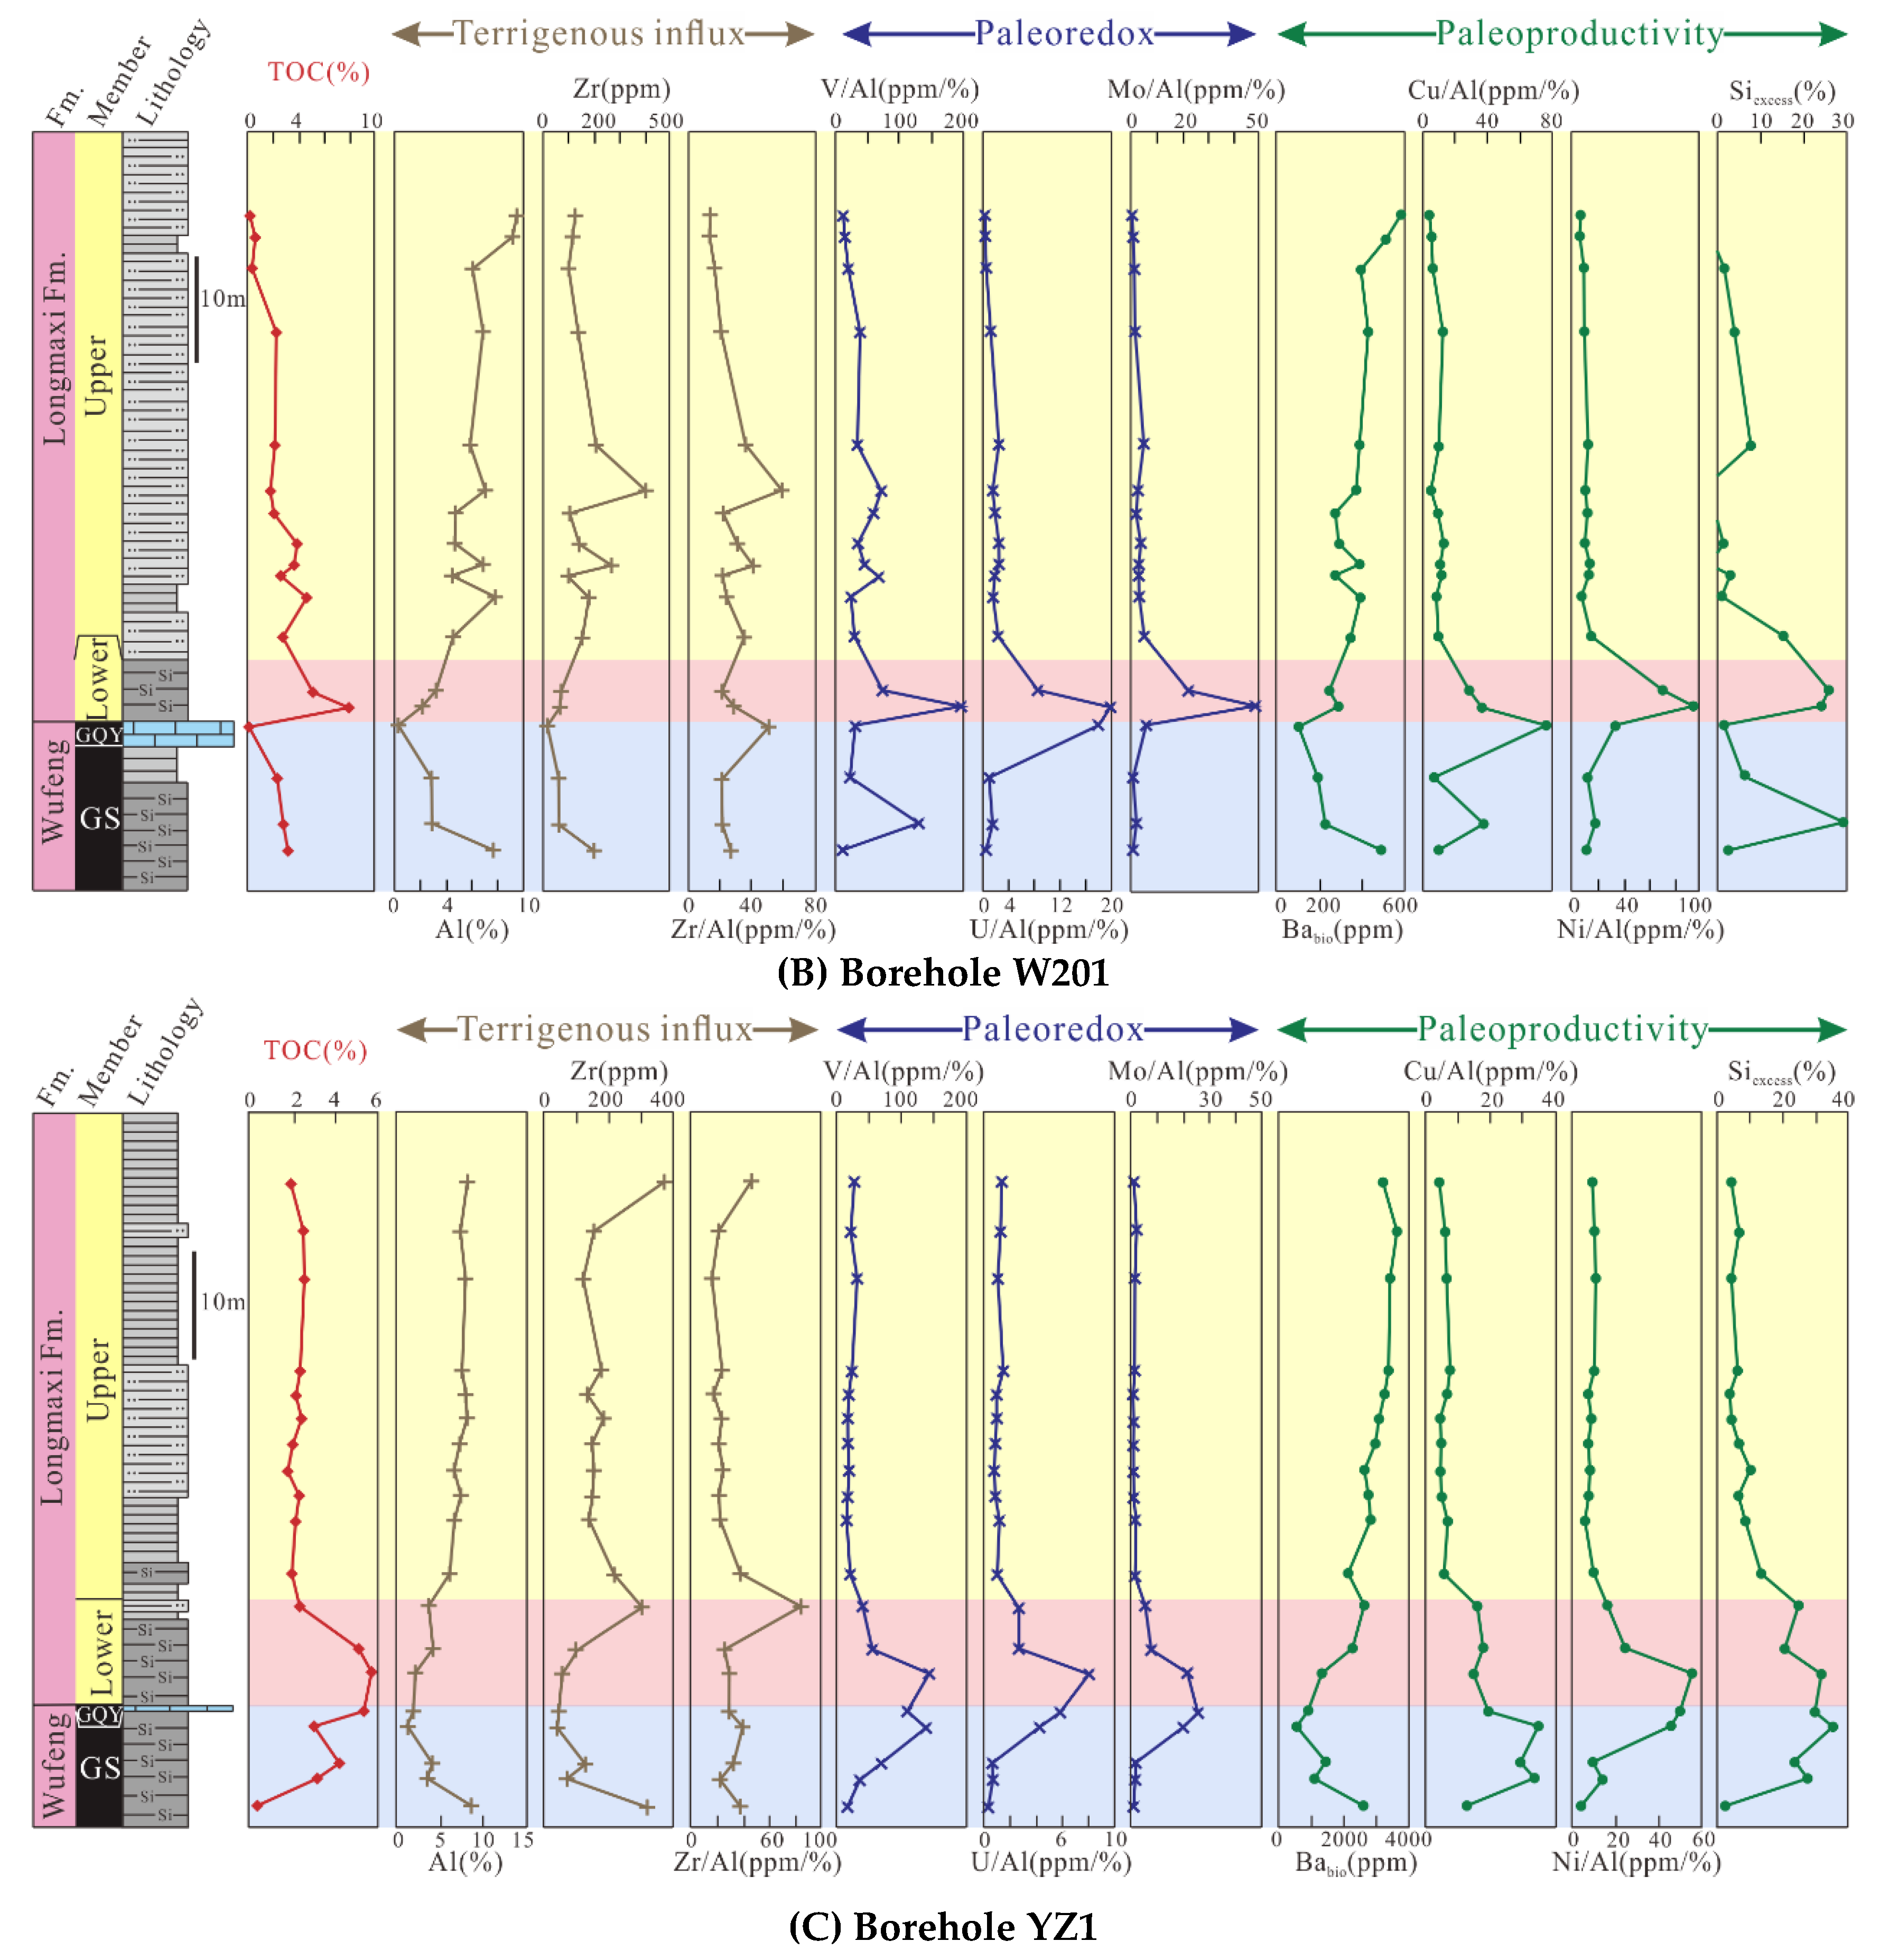
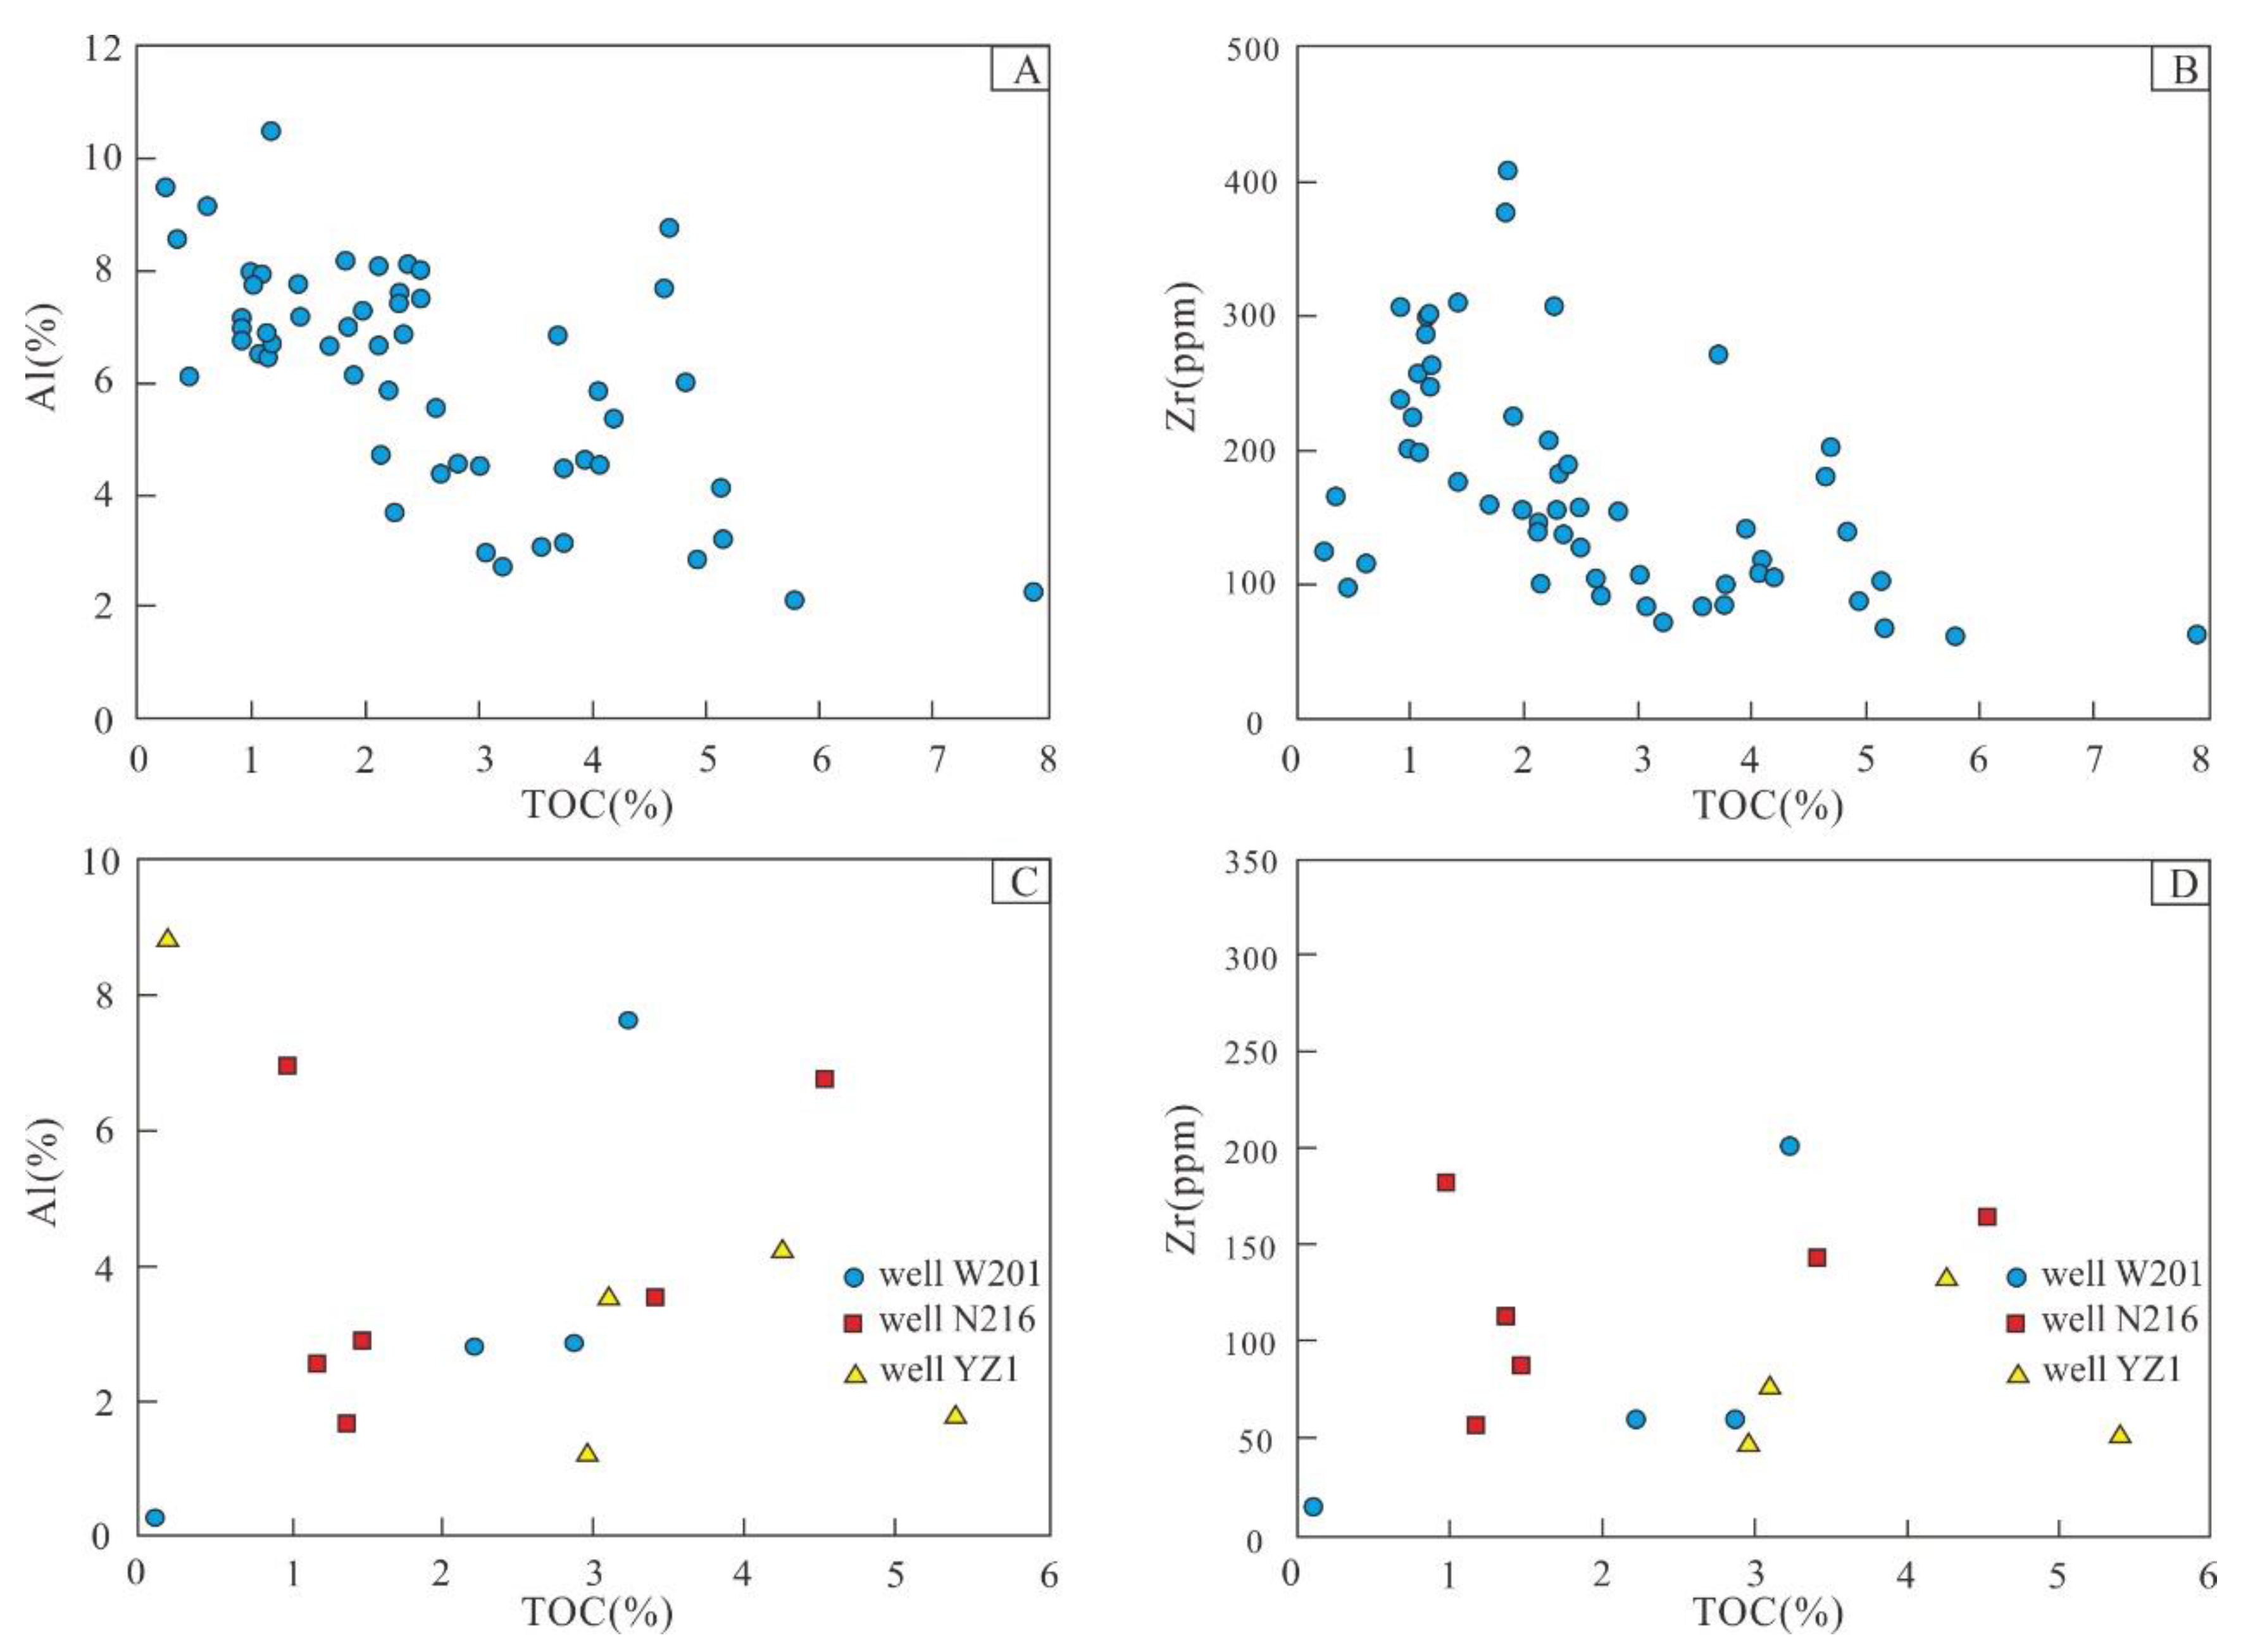
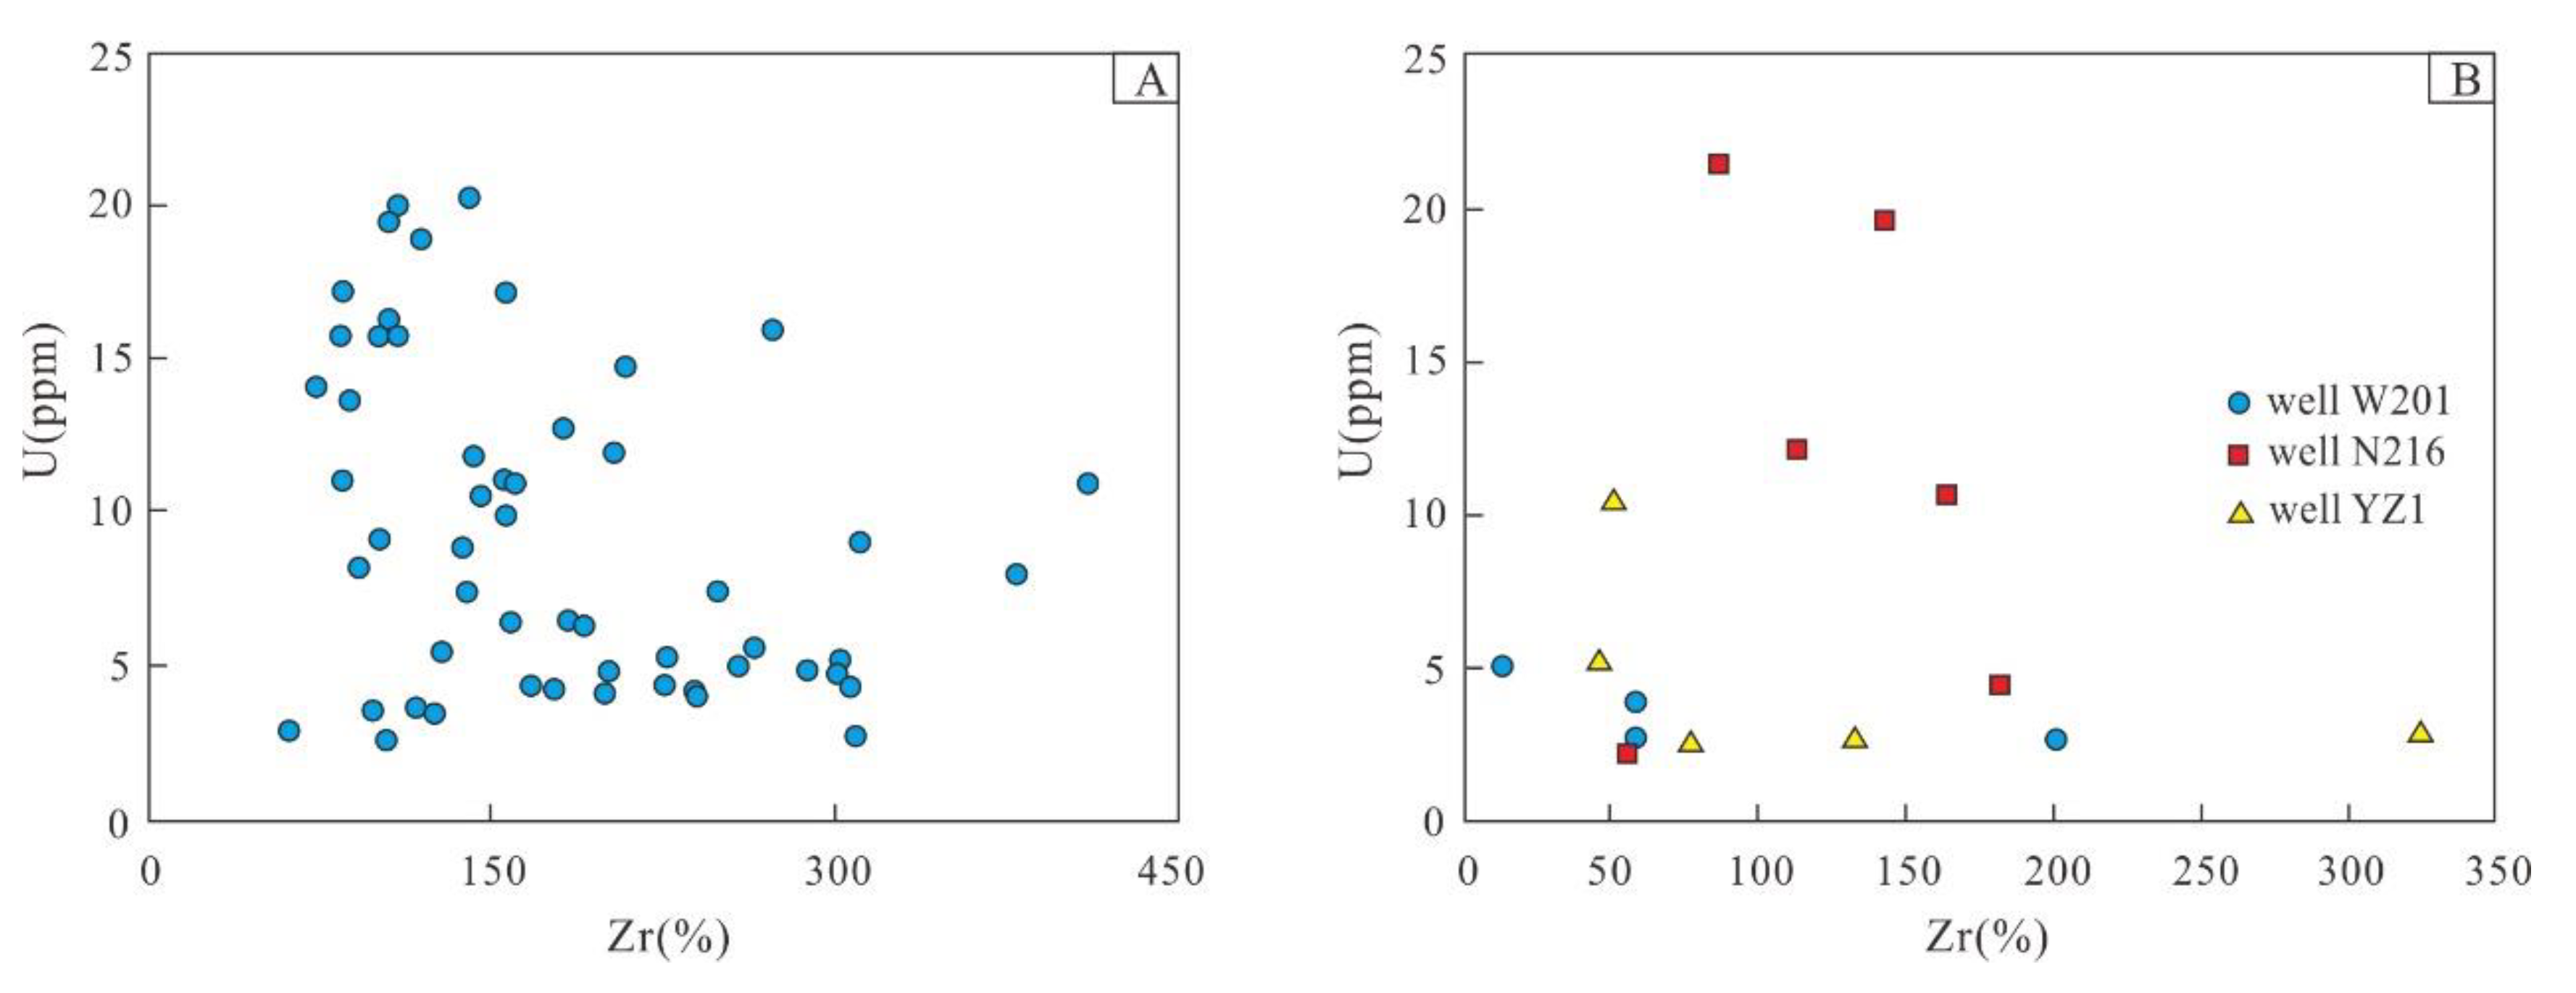
5.1. Terrigenous Influx

Al and Zr are weakly affected by weathering and diagenesis after deposition. Therefore, they are considered to be reliable proxies for the evaluation of terrigenous influx [2,12]. Fine-grained aluminosilicate minerals are the main source of Al [2]. In addition to clay minerals, Zr also originates from silt-sized minerals [33]. Therefore, the ratio of Zr/Al is a proxy that is commonly used to represent the coarser components in the terrigenous material [16,34].
The Al and Zr concentration curves of the Wufeng shale suggest moderate and variable terrigenous influx. In the shale of the Lower Longmaxi Formation, the concentration of Al and Zr was relatively low, indicating a relatively stable sedimentary environment and an overall less terrigenous supply during this period. During the deposition of the Upper Longmaxi Formation, the concentration of Al and Zr increased gradually, suggesting a significant increase in terrigenous influx. In addition, the concentration of Al in the Upper Longmaxi shale of the N216 and the W201 kept rising, and the Zr content and Zr/Al values began to decline. Considering that the input of the terrigenous coarse-grain materials were relatively stable during this period [16], it is inferred that the increased supply of fine-grained minerals diluted the coarser components.
The various parameters for terrigenous influx indicate that during the deposition of the Wufeng Formation, the terrigenous influx in the Upper Yangtze region was moderate but fluctuating, which was caused by rapid regression events and/or structural controls. During the deposition of the top of the Wufeng Formation to the lower part of the Longmaxi Formation, the terrigenous influx always maintained low values, reflecting a rising sea level and a stable sedimentary environment. Afterward, a regression occurred again, and the terrigenous influx of the Upper Longmaxi Formation gradually increased. There was a negative correlation between terrigenous influx and TOC in the Longmaxi Formation (Figure 5), indicating that terrigenous influx had a significant dilution effect on organic matter content. As for the Wufeng Formation, however, in addition to the YZ1, the data of the W201 and the N216 were relatively discrete, and there seems to be no obvious correlation between TOC and proxies for terrigenous influx. The result suggests the accumulation mechanism of organic matter was more complicated during this period, and paleoproductivity and redox condition also influenced the accumulation of organic matter.

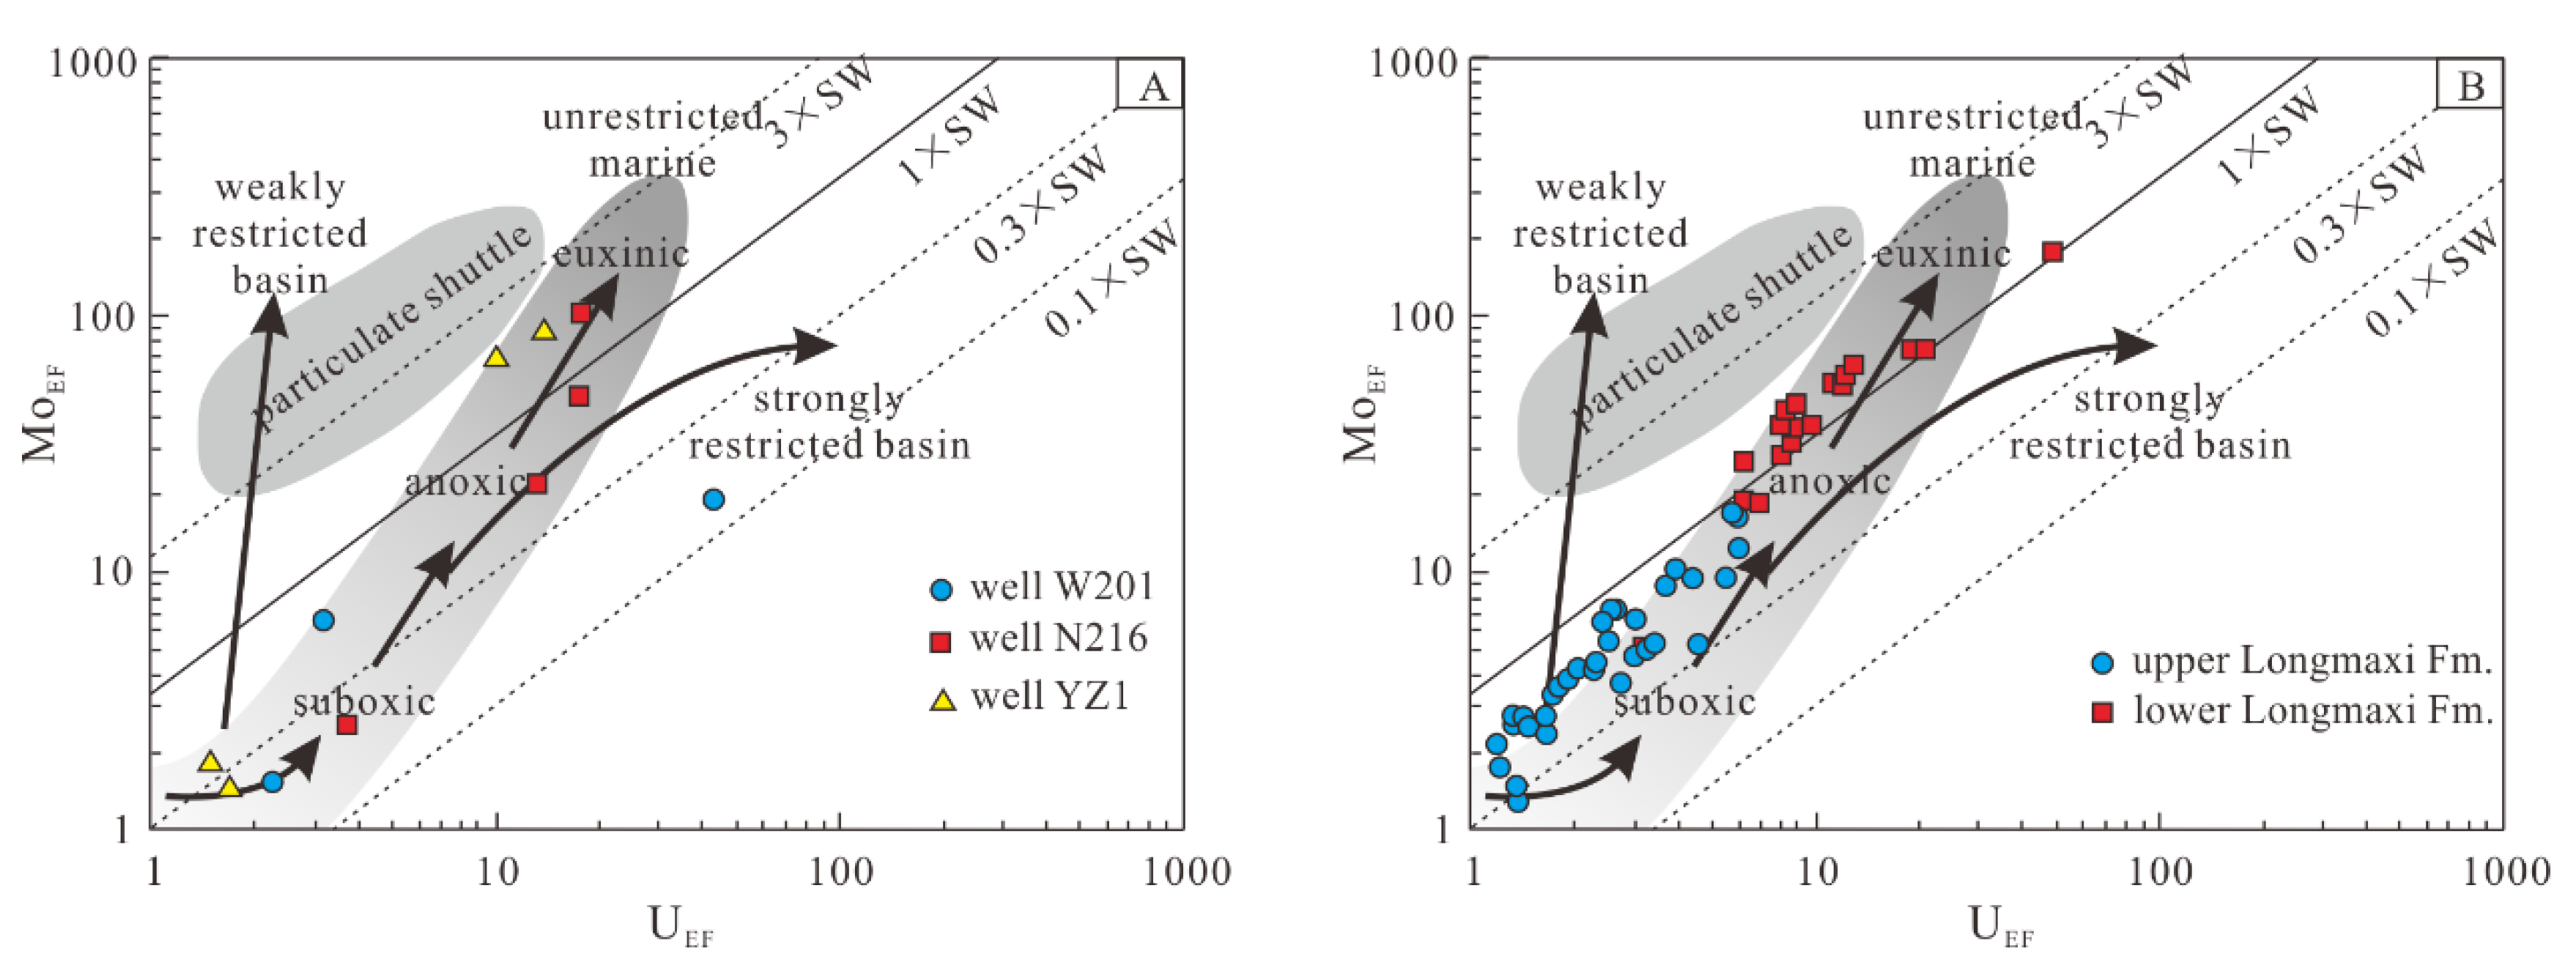
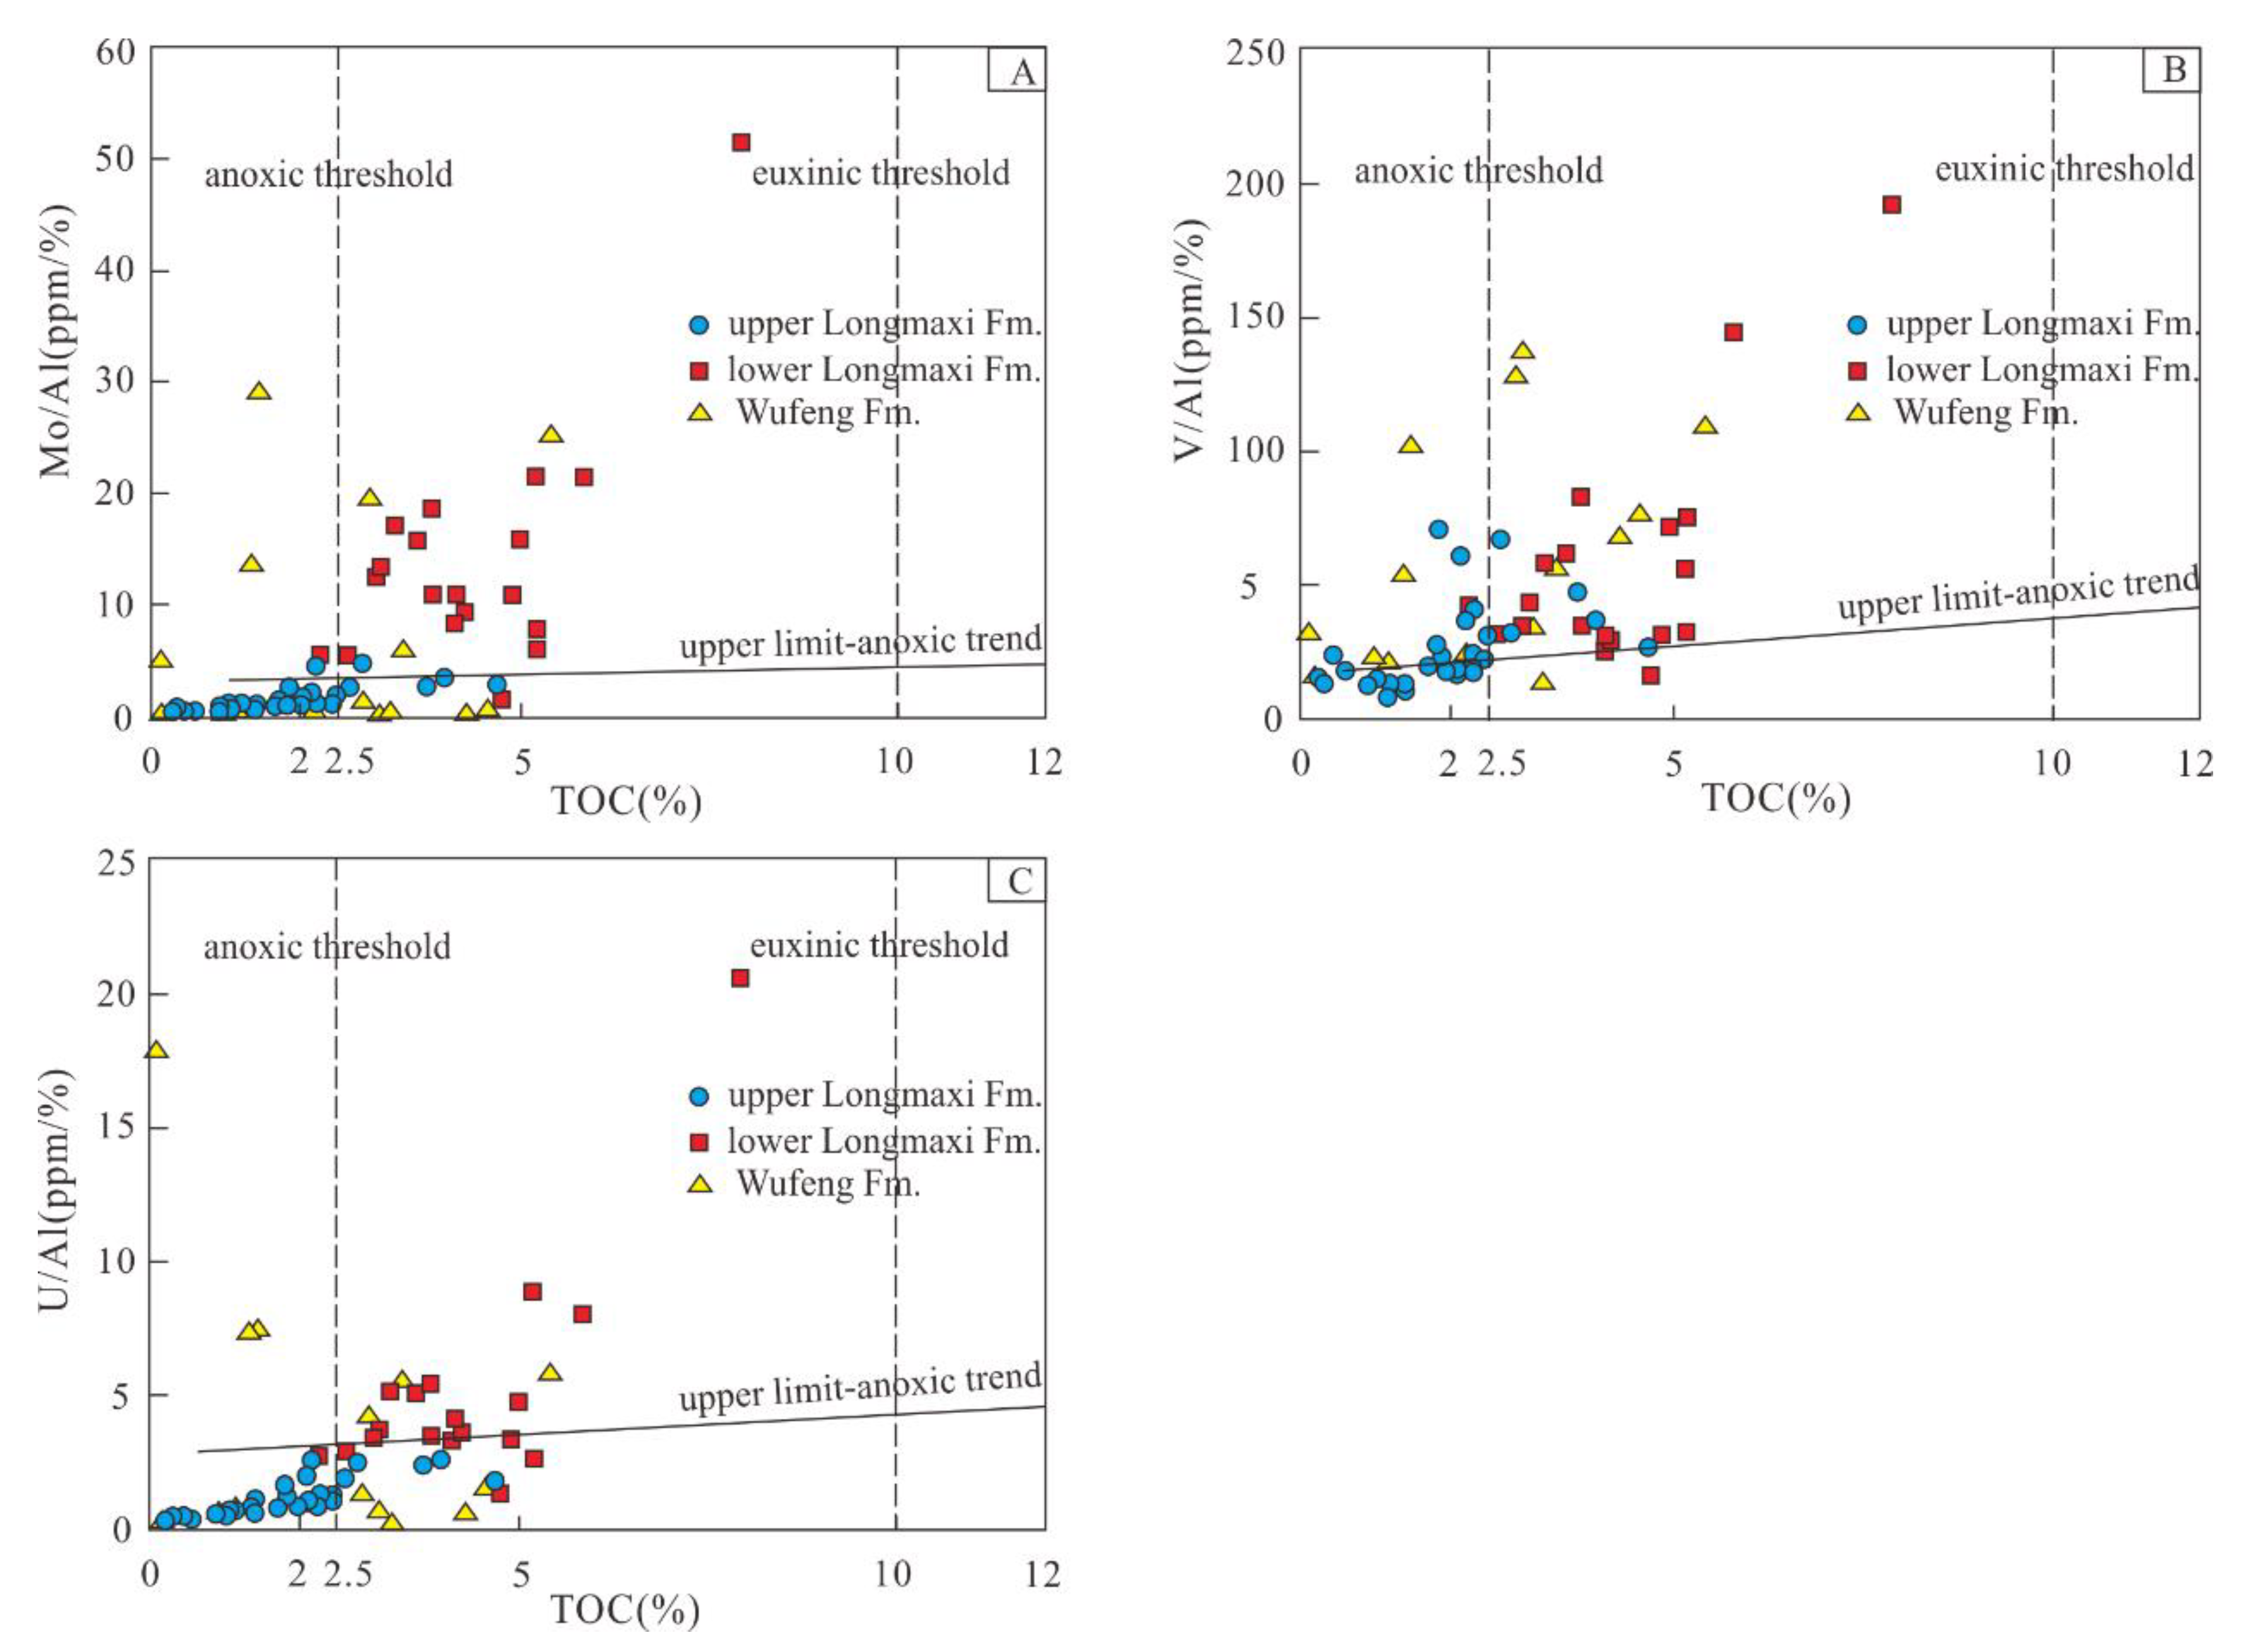
5.2. Paleoredox Conditions

The redox-sensitive trace elements (RSTEs) such as Mo, U, V, etc. have been widely used to restore the redox conditions of ancient oceans [10,11,12,13,14]. Controlled by the redox conditions of the depositional environment, the solubility of RSTEs tend to migrate and self-enrich in reduction water or sediments [35]. It is necessary to evaluate the reliability of RSTE data before these data are used to discriminate the deposition environment. Hydrothermal activity and terrigenous influx are the two main factors that cause changes in RSTEs [36,37]. The EuEF of the shale was close to 1 (Table 1, Figure 3), indicating the absence of hydrothermal alteration. In addition, there was no correlation between U and Zr (Figure 6), excluding the possible effects of terrestrial matter. Therefore, it is believed that the RSTEs of samples can indicate redox conditions.
The variation trend of the RSTEs recorded in the Wufeng-Longmaxi Formations indicates that the redox conditions of the paleoenvironment changed significantly during this period (Figure 4). At the base of the Wufeng Formation, low concentrations of RSTEs may reflect suboxic bottom water. In the upper and middle GS member and the Lower Longmaxi Formation, the concentrations of RSTEs are high, which may be the establishment of anoxic/euxinic conditions. After the deposition of the Lower Longmaxi Formation, the concentration of RSTEs began to decrease, recording the re-establishment of redox conditions, and the decrease continued throughout the Rhuddanian Stage.
The MoEF-UEF covariations can be used to explain the redox conditions and restricted degree of the bottom water [11,14]. Data of the Wufeng Formation suggest that MoEF and UEF are approximately equal when they are at low value, showing a strong covariation relationship. When they become higher, the increase of MoEF is larger than that of UEF, showing a weak covariation relationship (Figure 7). Combined with the changing trends of RSTEs (Figure 4), we found that the bottom water changed from suboxic to anoxic conditions, and even intermittent euxinic conditions. The data of the Longmaxi Formation were divided into two subgroups, indicating that the anoxic/euxinic conditions changed into suboxic conditions from the middle depositional period. Researchers have different views on whether the Yangtze Sea was restricted during the Late Ordovician to Early Silurian [4,6,17]. Almost all MoEF-UEF points are located in the “unrestricted marine” zone, supporting the perspective of “unrestricted ocean” environments. Therefore, we believe that the Yangtze Sea was still connected to the global ocean during this period.
However, the MoEF-UEF covariations can only be used for preliminary analysis of redox conditions, and other evidence is needed. The RSTEs-TOC covariations can be used to further explain the redox conditions (Figure 8) [13]. According to the RSTEs/TOC ratios, the data points can be divided into three subgroups. The first subgroup of data is that the TOC content was less than 2%, and the RSTEs/TOC ratio was low, indicating suboxic conditions. In the second subgroup, the TOC content was about 2%, and the RSTEs/TOC ratio was relatively high. Most points were distributed near the upper limit-anoxic trend line, indicating anoxic conditions. The TOC content of the third subgroup was greater than 2.5%, which had a high RSTEs/TOC ratio. Most data points were distributed above the upper limit-anoxic trend line, indicating euxinic conditions. This is because a high TOC content consumes a large amount of O2, which causes the sulfate reduction zone to rise to the upper water column, resulting in the accumulation of RSTEs in the sediment. It is worth noting that the analysis of a single RSTE may not be accurate, and it is considered accurate only if two or more RSTEs indicate the same result [13]. The scattering RSTEs points of the Wufeng Formation support the results obtained from the analysis of MoEF-UEF covariations. That is, the change of the bottom water from suboxic to anoxic conditions, and even euxinic conditions. For the Lower Longmaxi Formation, the V-TOC and Mo-TOC points were above the limit-anoxic trend line, indicating a continuous euxinic conditions. The RSTEs-TOC points of the Upper Longmaxi Formation were in good agreement, indicating anoxic–suboxic conditions. Therefore, the ocean experienced a transition from euxinic to oxic conditions during the deposition of the Longmaxi Formation.

5.3. Paleoproductivity

During the shale deposition period, paleoproductivity can be reflected by Babio, Cu, Ni, and Siexcess [13,15,16]. Under oxic conditions, Ba is stored in the sediment as barium sulfate [31]. Under reducing conditions, barium sulfate in the sediment will be lost by dissolution [31]. In this case, the Babio calculated based on the concentration of Ba element can better reflect the paleoproductivity under oxic conditions. Ni and Cu are released during the decomposition of organic matter and then are preserved by the capture of pyrite in sediments under sulfate reducing conditions [11]. Therefore, Ni and Cu are ideal indicators of the amount of organic matter entering the sediment under reducing conditions [12]. Siexcess is a part of biogenic silica produced by the effect of high productivity. By identifying the Late Ordovician-Early Silurian radiolarian combination in the Upper Yangtze region, biogenic silica was found in shale [4,16], especially in organic-rich shale intervals, therefore, Siexcess can be taken as a reliable indicator of paleoproductivity.
The average concentration of Babio in the Wufeng Formation and the Lower Longmaxi Formation was lower than that of the Upper Longmaxi Formation. This is because the authigenic barium sulfate was easily dissolved under reducing conditions, resulting in a large amount of Ba loss, and does not represent lower productivity. On the contrary, the relatively higher organic matter content and the high concentrations of Cu, Ni, and Siexcess indicate a high primary productivity during this period. In contrast, the Upper Longmaxi Formation was deposited in an oxic environment. Therefore, Cu and Ni are not ideal indicators of productivity, while Ba can be well preserved as an indicator of the strength of primary productivity. The average Babio concentration in the Upper Longmaxi Formation was 1527.74 ppm, which is close to the productivity of oxic water in modern equatorial regions (1000–5000 ppm) [38], indicating a high paleoproductivity. In addition to that, the variation of Siexcess reflects a higher primary productivity during the deposition of the Wufeng Formation and the Lower Longmaxi Formation. The paleoproductivity proxies of the three boreholes indicate that during the transition period of the Late Ordovician to Early Silurian, N216 and YZ1, which are located in deeper water environments, had higher primary productivity than W201.
During the Katian and Rhuddanian periods, the primary productivity in the ocean showed an increasing trend, which not only facilitated the production of organic matter, but also promoted the preservation of organic matter. On one hand, the increase in productivity accelerated the consumption of oxygen in the water column, causing anoxic conditions in the oceans. On the other hand, high productivity produced a large amount of organic matter influx, which further consumed water oxygen in the process of inputting in marine sediments, thereby maintaining or even strengthening the anoxic conditions of the bottom water. During the deposition of the Upper Longmaxi Formation, marine productivity began to weaken and return to normal levels.

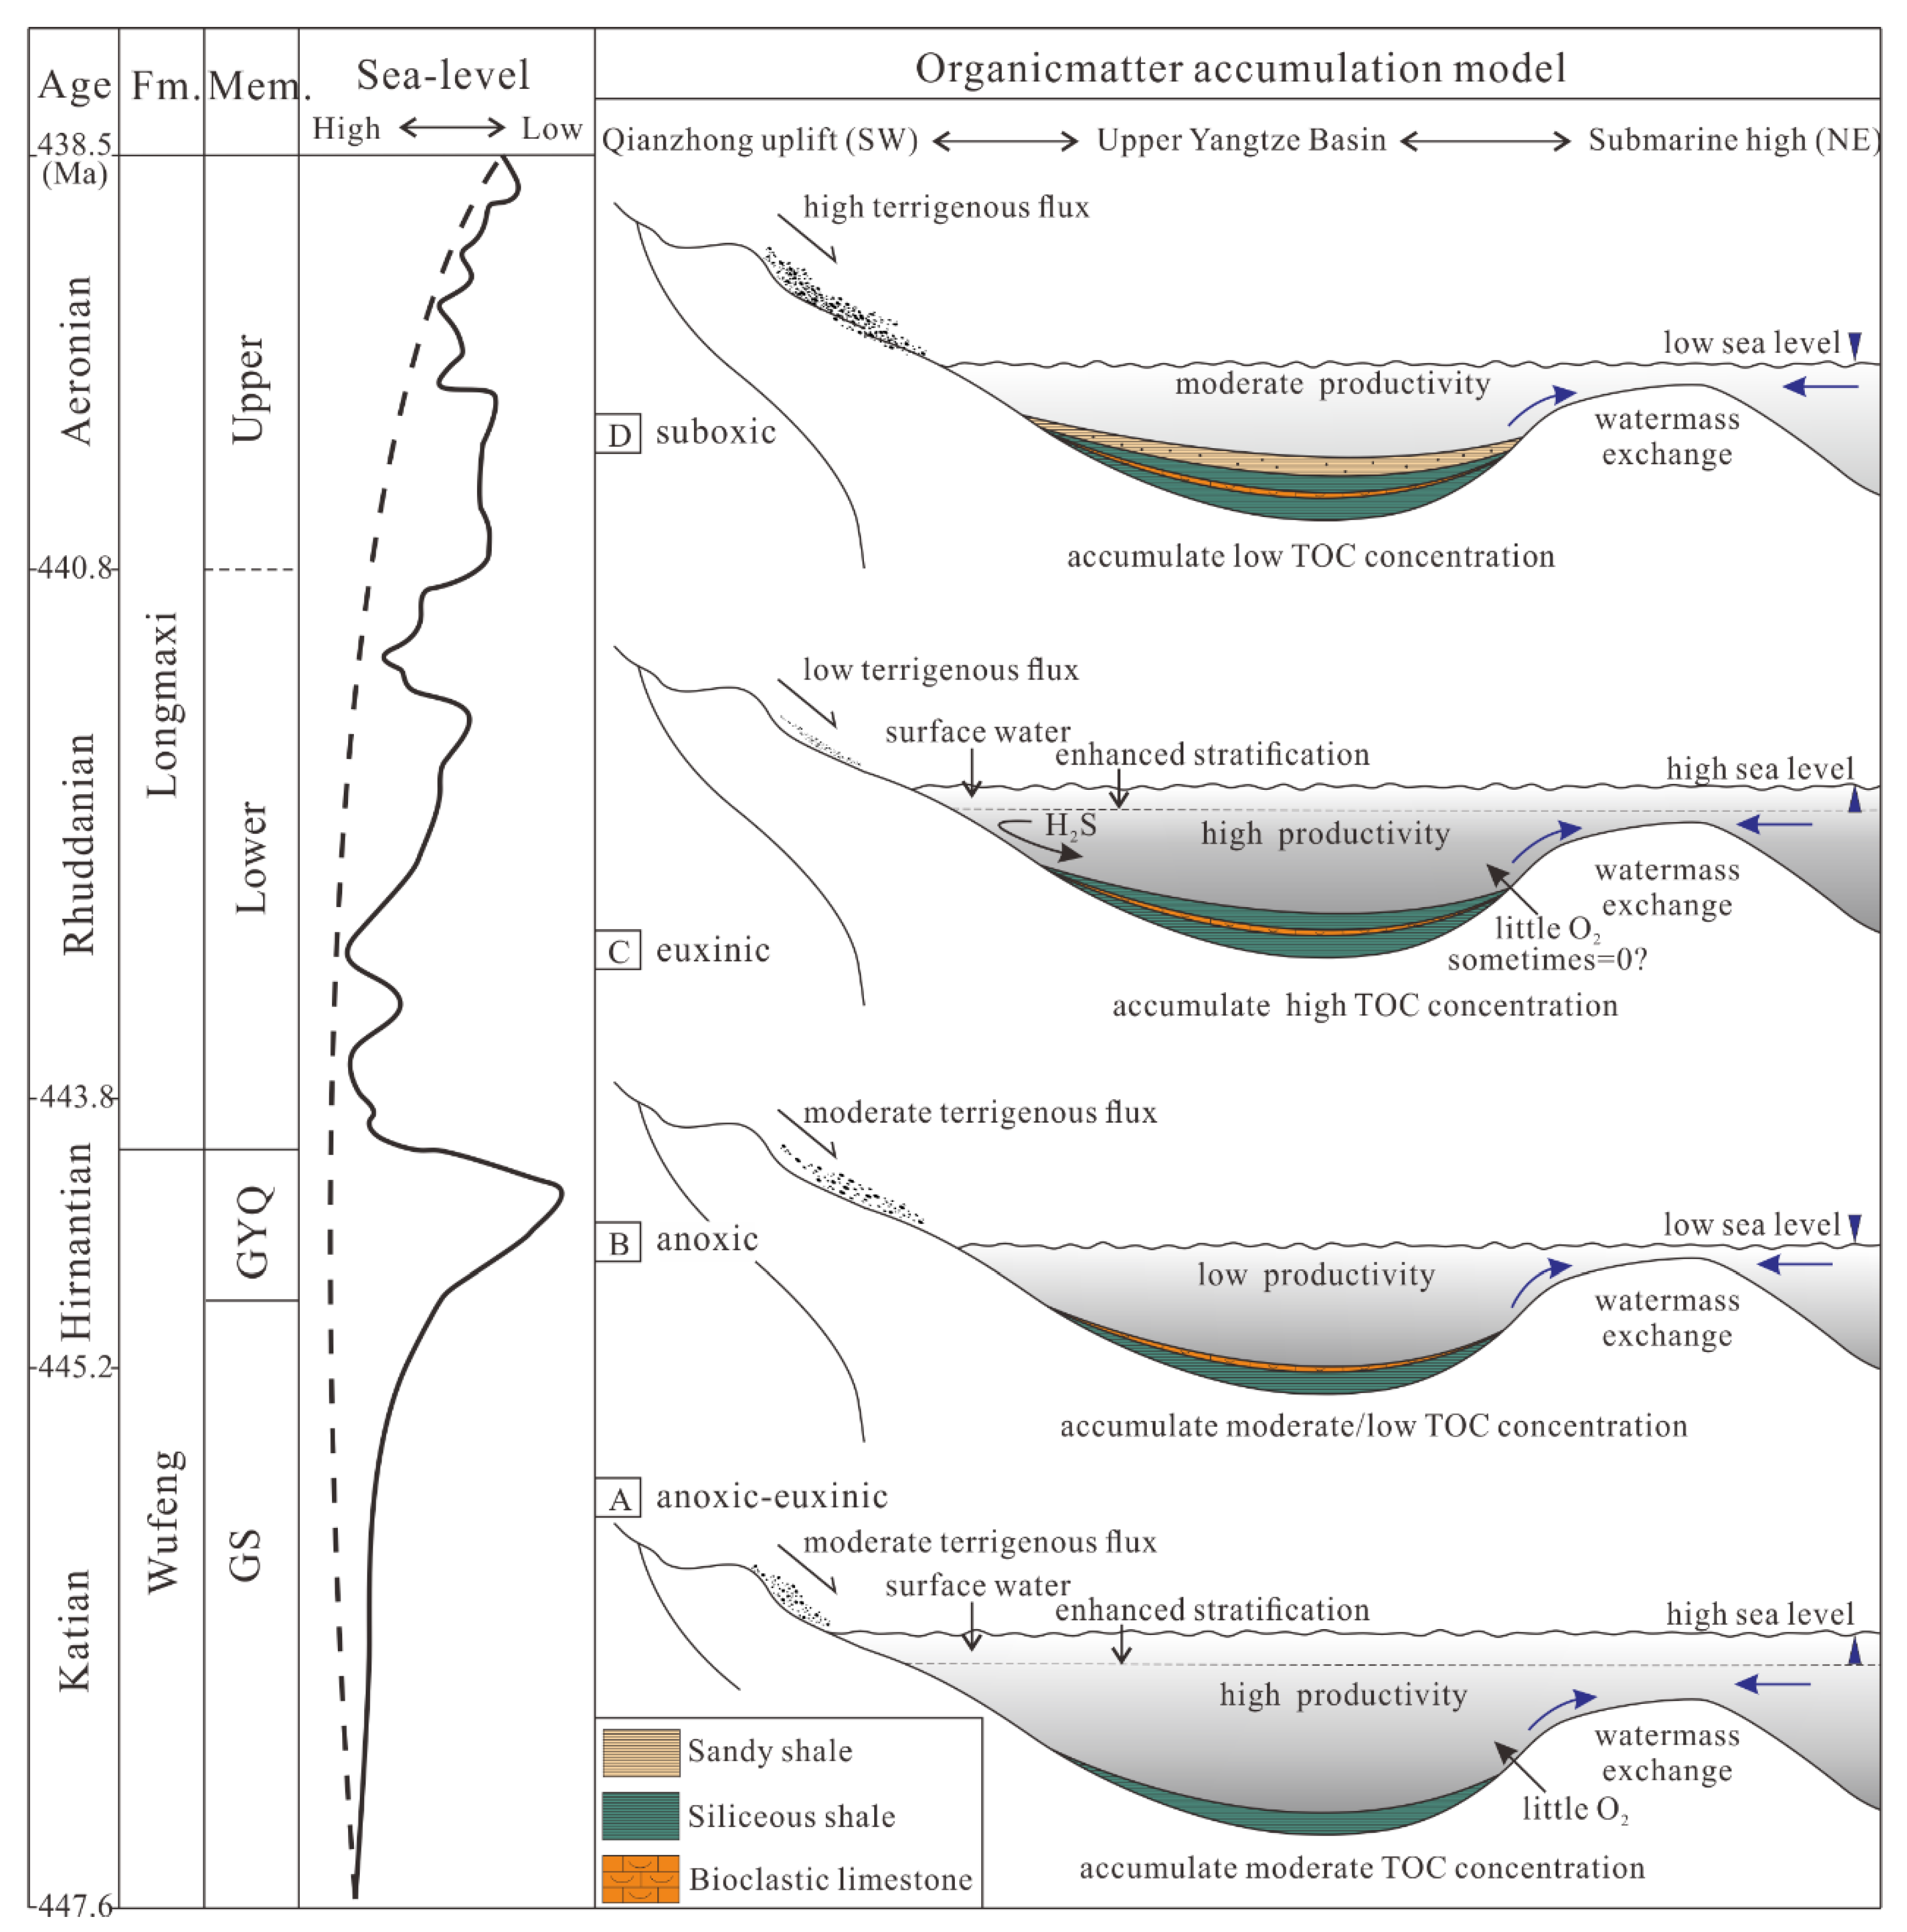
5.4. Accumulation Model of Organic Matter

The sedimentary model of the Late Ordovician-Early Silurian can be established by the three main factors affecting the accumulation of organic matter, which are terrigenous influx, redox conditions, and paleoproductivity, as discussed above (Figure 9).
In the early Katian Stage, black siliceous shale began to deposit in the Upper Yangtze region under high sea level and suboxic water conditions. The correlation between TOC content and terrigenous influx was not obvious. Low RSTEs and relatively high paleoproductivity proxies revealed that the relatively high paleoproductivity level was the main reason for organic matter accumulation. After the early Katian Stage, under the influence of the increasingly primary productivity, a large amount of O2 was consumed in the bottom water, resulting in anoxic and even euxinic water conditions. At the same time, the location of the Yangtze platform at low latitudes led to frequent precipitation [24], and freshwater injection triggered stratification of ocean waters [3], promoting further hypoxia in the bottom water. On the other hand, due to regression and/or structural controls, the supply of terrigenous influx increased, diluting the organic matter in the sediment. Therefore, although there were two favorable factors, namely high paleoproductivity and anoxic water conditions, the high terrigenous influx led to the moderate level of organic matter accumulation in the shale of the Wufeng Formation.
A global sea level decline and an extinction event occurred during the early Hirnantian Stage [18,26]. After the peak of glaciation, the glaciers began to melt and the sea level rose rapidly [5], and marine productivity recovered gradually. In the Early Silurian, relatively high sea levels continued to rise [5,26], and water stratification emerged. The correlation between the MoEF-UEF and the RSTEs-TOC indicates that euxinic water conditions occurred at that time, and the Yangtze Sea was still connected to the global ocean. Paleoproductivity reached the highest level, and formed a positive feedback system with reducing conditions, effectively maintaining or strengthening euxinic conditions. In addition, rising sea level reduced terrigenous influx, resulting in further accumulation of organic matter. Therefore, lack of terrigenous influx, euxinic water, and high productivity controlled the deposition of organic-rich shales in the Lower Longmaxi Formation.
In the late Rhuddanian Stage, water of the Yangtze Sea began to shallow, which was consistent with the trend of global sea level [5,26]. Sea level decline was accompanied by an increase in the supply of terrigenous influx, which diluted the organic flux in the sediment. At the same time, the falling sea level stirred up the ocean water, mixing the upper oxygen-rich surface water with the lower euxinic water, producing a suboxic environment. Although abundant organic matter was produced by normal paleoproductivity, a large number of terrigenous influx and suboxic water conditions prevented the preservation of organic matter. Therefore, the shale deposited during this period had a low organic matter content.

6. Conclusions

Based on the geochemical data of three boreholes, the paleoenvironment during the deposition of the Wufeng-Longmaxi Formations in the Upper Yangtze region was restored to study the mechanism of organic matter accumulation. Except the Hirnantian Stage, the Yangtze Sea generally had high primary productivity in the Late Ordovician to Early Silurian. The variable terrigenous influx and redox conditions were the key to controlling the accumulation of organic matter. Before the Hirnantian Stage, the high primary productivity and stratified water conditions in the Upper Yangtze Sea consumed a large amount of O2 in the bottom water, producing anoxic–euxinic water conditions, allowing the organic matter to be preserved and accumulated in sediments. However, due to the regression and/or structural controls, the supply of terrigenous influx had increased, diluting the organic matter in sediments to some extent. After the Hirnantian Stage, transgression caused a low terrigenous influx. At the same time, the marine productivity gradually recovered and reached its peak, producing euxinic water conditions, leading to the highest accumulation degree of organic matter in the Lower Longmaxi Formation. After that, the sea level began to fall, and the mixed seawater produced suboxic water conditions, accompanied by the injection of a large amount of terrigenous debris, resulting in a low degree of organic matter accumulation in the Upper Longmaxi Formation.

Author Contributions

All authors contributed to the research in this paper. Z.H. wrote the paper. X.W., X.Y., and W.S. analyzed the data. R.Z., J.C., and Y.Z. provided the data and funding. All authors have read and agreed to the published version of the manuscript.

Funding

This study was financially supported by the National Key Science and Technology Planning Project (2016ZX05007004-001 and 2017ZX05001001-002).

Conflicts of Interest

The authors declare no conflict of interest.

References

  1. Zou, C.N.; Zhu, R.K.; Chen, Z.Q.; Ogg, J.G.; Wu, S.T.; Dong, D.Z.; Qiu, Z.; Wang, Y.M.; Wang, L.; Lin, S.H.; et al. Organic-Matter-Rich shales of China. Earth-Sci. Rev. 2019, 189, 51–78. [Google Scholar] [CrossRef]
  2. Calvert, S.E.; Pedersen, T.F. Chapter fourteen elemental proxies for paleoclimatic and palaeoceanographic Variability in marine sediments: Interpretation and application. Dev. Mar. Geol. 2007, 1, 567–644. [Google Scholar]
  3. Yan, D.T.; Chen, D.Z.; Wang, Q.C.; Wang, J.G. Predominance of stratified anoxic Yangtze Sea interrupted by short-Term oxygenation during the Ordo-Silurian transition. Chem. Geol. 2012, 291, 69–78. [Google Scholar] [CrossRef]
  4. Li, Y.F.; Zhang, T.W.; Ellis, G.S.; Shao, D.Y. Depositional environment and organic matter accumulation of Upper Ordovician-Lower Silurian marine shale in the Upper Yangtze Platform, South China. Palaeogeogr. Palaeoclimatol. Palaeoecol. 2017, 466, 252–264. [Google Scholar] [CrossRef]
  5. Liu, Z.H.; Algeo, T.J.; Guo, X.S.; Fan, J.X.; Du, X.B.; Lu, Y.C. Paleo-Environmental cyclicity in the early silurian Yangtze Sea (south China): Tectonic or glacio-eustatic control? Palaeogeogr. Palaeoclimatol. Palaeoecol. 2017, 466, 59–76. [Google Scholar] [CrossRef] [Green Version]
  6. Wang, X.Q.; Zhu, Y.M.; Lash, G.G.; Wang, Y. Multi-Proxy analysis of organic matter accumulation in the Upper Ordovician-Lower Silurian black shale on the Upper Yangtze Platform, south China. Mar. Pet. Geol. 2019, 103, 473–484. [Google Scholar] [CrossRef]
  7. Mort, H.; Jacquat, O.; Adatte, T.; Steinmann, P.; Föllmi, K.; Matera, V.; Berner, Z.; Stüben, D. The Cenomanian/Turonian anoxic event at the Bonarelli Level in Italy and Spain: Enhanced productivity and/or better preservation. Cretac. Res. 2007, 28, 597–612. [Google Scholar] [CrossRef] [Green Version]
  8. Sageman, B.B.; Murphy, A.E.; Werne, J.P.; Straeten, C.A.V.; Hollander, D.J.; Lyons, T.W. A tale of shales: The relative roles of production, decomposition, and dilution in the accumulation of organic-Rich strata, Middle-Upper Devonian, Appalachian basin. Chem. Geol. 2003, 195, 229–273. [Google Scholar] [CrossRef]
  9. Canfield, D.E. Factors influencing organic carbon preservation in marine sediments. Chem. Geol. 1994, 114, 315–329. [Google Scholar] [CrossRef]
  10. Tribovillard, N.; Bout-Roumazeilles, V.; Sionneau, T.; Montero-Serrano, J.C.; Riboulleau, A.; Baudin, F. Does a strong pycnocline impact organic-Matter preservation and accumulation in an anoxic setting? The case of the Orca Basin, Gulf of Mexico. Comptes Rendus Geosci. 2009, 341, 1–9. [Google Scholar] [CrossRef]
  11. Algeo, T.J.; Tribovillard, N. Environmental analysis of paleoceanographic systems based on molybdenum-Uranium covariation. Chem. Geol. 2009, 268, 211–225. [Google Scholar] [CrossRef]
  12. Tribovillard, N.; Algeo, T.J.; Lyons, T.; Riboulleau, A. Trace-Metals as paleoredox and paleoproductivity proxies: An update. Chem. Geol. 2006, 232, 12–32. [Google Scholar] [CrossRef]
  13. Algeo, T.J.; Maynard, J.B. Trace-Element behavior and redox facies in core shales of Upper Pennsylvanian Kansas-type cyclothems. Chem. Geol. 2004, 206, 289–318. [Google Scholar] [CrossRef]
  14. Algeo, T.J.; Lyons, T.W. Mo-Total organic carbon covariation in modern anoxic marine environments: Implications for analysis of paleoredox and paleohydrographic conditions. Paleoceanography 2006, 21, PA1016. [Google Scholar] [CrossRef]
  15. Eagle, M.; Paytan, A.; Arrigo, K.R.; van Dijken, G.; Murray, R.W. A comparison between excess barium and barite as indicators of carbon export. Paleoceanography 2003, 18, 2101–2113. [Google Scholar] [CrossRef]
  16. Zhao, J.H.; Jin, Z.J.; Jin, Z.K.; Geng, Y.K.; Wen, X.; Yan, C.N. Applying sedimentary geochemical proxies for paleoenvironment interpretation of organic-Rich shale deposition in the Sichuan Basin, China. Int. J. Coal Geol. 2016, 163, 52–71. [Google Scholar] [CrossRef]
  17. Wang, K.; Chatterton, B.D.E.; Wang, Y. An organic carbon isotope record of Late Ordovician to Early Silurian marine sedimentary rocks, Yangtze Sea, South China: Implications for CO2 changes during the Hirnantian glaciation. Palaeogeogr. Palaeoclimatol. Palaeoecol. 1997, 132, 147–158. [Google Scholar] [CrossRef]
  18. Delabroye, A.; Vecoli, M.D.E. The end-Ordovician glaciation and the Hirnantian Stage: A global review and questions about Late Ordovician event stratigraphy. Earth Sci. Rev. 2010, 98, 269–282. [Google Scholar] [CrossRef]
  19. Huff, W.D.; Bergström, S.M.; Kolata, D.R. Gigantic Ordovician volcanic ash fall in North America and Europe: Biological, tectonomagmatic, and event-Stratigraphic significance. Geology 1992, 20, 875–878. [Google Scholar] [CrossRef]
  20. Chen, X.; Rong, J.Y.; Mitchell, C.E.; Harper, D.A.T.; Fan, J.X.; Zhan, R.B.; Zhang, Y.D.; Li, R.Y.; Wang, Y. Late Ordovician to earliest Silurian graptolite and brachiopod biozonation from the Yangtze region, South China, with a global correlation. Geol. Mag. 2000, 137, 623–650. [Google Scholar]
  21. Chen, X.; Rong, J.Y.; Li, Y.; Boucot, A.J. Facies patterns and geography of the Yangtze region, South China, through the Ordovician and Silurian transition. Palaeogeogr. Palaeoclimatol. Palaeoecol. 2004, 204, 353–372. [Google Scholar]
  22. Huang, F.X.; Chen, H.D.; Hou, M.C.; Zhong, Y.J.; Li, J. Filling process and evolutionary model of sedimentary sequence of Middle-Upper Yangtze craton in Caledonian (Cambrian-Silurian). Acta Petrol. Sin. 2011, 27, 2299–2317. [Google Scholar]
  23. Guo, R.B.; Zhang, J.C.; Zhao, P.W.; Tang, X.; Liu, Z.Y. Accumulation conditions and an analysis of the origins of natural gas in the lower silurian Shiniulan Formation from Well Anye 1, northern Guizhou province. Energies 2019, 12, 4087. [Google Scholar] [CrossRef] [Green Version]
  24. Melchin, M.J.; Mitchell, C.E.; Holmden, C.; Štorch, P. Environmental changes in the Late Ordovician-Early Silurian: Review and new insights from black shales and nitrogen isotopes. Geol. Soc. Am. Bull. 2013, 125, 1635–1670. [Google Scholar] [CrossRef]
  25. Liang, D.; Guo, T.; Chen, J.; Bian, L.; Zhao, Z. Some progresses on studies of hydrocarbon generation and accumulation in marine sedimentary region, southern China (part 2): Geochemical characteristics of four suits of regional marine source rocks, South China. Mar. Orig. Pet. Geol. 2009, 14, 1–15. [Google Scholar]
  26. Haq, B.U.; Schutter, S.R. A chronology of Paleozoic sea-Level changes. Science 2008, 322, 64–68. [Google Scholar] [CrossRef]
  27. Jiang, S.Y.; Zhao, H.X.; Chen, Y.Q.; Yang, T.; Yang, J.H.; Ling, H.F. Trace and rare earth element geochemistry of phosphate nodules from the lower Cambrian black shale sequence in the Mufu Mountain of Nanjing, Jiangsu province, China. Chem. Geol. 2007, 244, 584–604. [Google Scholar] [CrossRef]
  28. Wedepohl, K.H. Environmental Influences on the Chemical Composition of Shales and Clays; Ahrens, L.H., Press, F., Runcorn, S.K., Urey, H.C., Eds.; Pergamon: Oxford, UK, 1971; pp. 305–331. [Google Scholar]
  29. Murray, R.W.; Leinen, M. Scavenged excess aluminium and its relationship to bulk titaniumin biogenic sediment from the Central equatorial Pacific Ocean. Geochim. Cosmochim. Acta. 1996, 60, 3869–3878. [Google Scholar] [CrossRef]
  30. Taylor, S.R. The abundance of chemical elements in the continental crust-A new table. Geochim. Cosmochim. Acta 1964, 28, 1273–1285. [Google Scholar] [CrossRef]
  31. Dymond, J.; Suess, E.; Lyle, M. Barium in deep-sea sediments: A geochemical proxy for paleoproductivity. Paleoceanography 1992, 7, 163–181. [Google Scholar] [CrossRef] [Green Version]
  32. Ross, D.J.K.M.; Bustin, R.M. Investigating the use of sedimentary geochemical proxies for paleoenvironment interpretation of thermally mature organic-Rich strata: Examples from the Devonian-Mississippian shales, Western Canadian Sedimentary Basin. Chem. Geol. 2009, 260, 1–19. [Google Scholar] [CrossRef]
  33. Rachold, V.; Brumsack, H.J. Inorganic geochemistry of Albian sediments from the Lower Saxony Basin NW Germany: Palaeoenvironmental constraints and orbital cycles. Palaeogeogr. Palaeoclimatol. Palaeoecol. 2001, 174, 121–143. [Google Scholar] [CrossRef]
  34. Young, G.M.; Nesbitt, H.W. Processes controlling the distribution of Ti and Al in weathering profiles, siliciclastic sediments and sedimentary rocks. J. Sediment. Res. 1998, 68, 448–455. [Google Scholar] [CrossRef]
  35. Francois, R. A study on the regulation of the concentrations of some trace metals (Rb, Sr, Zn, Pb, Cu, V, Cr, Ni, Mn and Mo) in Saanich Inlet sediments, British Columbia. Mar. Geol. 1988, 83, 285–308. [Google Scholar] [CrossRef]
  36. Morford, J.L.; Russell, A.D.; Emerson, S. Trace metal evidence for changes in the redox environment associated with the transition from terrigenous clay to diatomaceous sediment, Saanich Inlet, BC. Mar. Geol. 2001, 174, 355–369. [Google Scholar] [CrossRef]
  37. Calvert, S.E.; Pedersen, T.F. Geochemistry of Recent oxic and anoxic marine sediments: Implications for the geological record. Mar. Geol. 1993, 113, 67–88. [Google Scholar] [CrossRef]
  38. Murray, R.W.; Leinen, M. Chemical transport to the seafloor of the equatorial Pacific Ocean across a latitudinal transect at 135 W: Tracking sedimentary major, trace, and rare earth element fluxes at the equator and the Intertropical Convergence Zone. Geochim. Cosmochim. Acta 1993, 57, 4141–4163. [Google Scholar] [CrossRef]
Figure 1. (A) Late Ordovician paleogeographic map showing the location of South China [24]. (B) Paleogeographic map of the Yangtze block [21]. Boreholes studied: 1 = N216; 2 = W201; 3 = YZ1.
Energies 13 00858 g001
Figure 2. Stratigraphic correlation between the boreholes studied and the Wangjiawan section (GSSP) in Yichang, Hubei Province. The paleontological data of the Wangjiawan section are from Chen et al. [20], and the total organic carbon content curve is from Yan et al. [3].
Energies 13 00858 g002
Figure 3. The TOC and elements involved in the study were relative to the enrichment factors (EF) of the average shale. The line of EFaverage = 1 divides the enrichment or loss of elements.
Energies 13 00858 g003
Figure 4. Variation of TOC, terrigenous influx proxies, paleoredox proxies, and paleoproductivity proxies in the Wufeng-Longmaxi Formations of N216, W201, and YZ1.
Energies 13 00858 g004aEnergies 13 00858 g004b
Figure 5. Cross plot of terrigenous influx proxies and TOC. The data in (A,B) are from the Longmaxi Formation, and the data in (C,D) are from the Wufeng Formation.
Energies 13 00858 g005
Figure 6. Cross plot of U and Zr. The data in (A) are from the Longmaxi Formation, and the data in (B) are from the Wufeng Formation.
Energies 13 00858 g006
Figure 7. Cross plot of MoEF and UEF. The data in (A) are from the Wufeng Formation, and the data in (B) are from the Longmaxi Formation. The basic data are cited from Algeo and Tribovillard [11].
Energies 13 00858 g007
Figure 8. Cross plot of redox-sensitive trace elements and TOC. (A)Mo/Al vs. TOC; (B) V/Al vs. TOC; (C) U/Al vs. TOC. The data of anoxic threshold, euxinic threshold, and upper limit-anoxic trend are cited from Algeo and Maynard [13].
Energies 13 00858 g008
Figure 9. Deposition process and organic matter enrichment model of the Wufeng-Longmaxi Formations in the study area. The seal level variation curve of the Yangtze platform is according to Liu et al. [5].
Energies 13 00858 g009
Table 1. Enrichment factors (EF) and the average concentration after Al-normalization of shale in the Wufeng and Longmaxi Formations.
Average ShaleWufeng Fm.n = 12Lower Longmaxi Fm.n = 18Upper Longmaxi Fm.n = 38
Oxide/ElementAbundance–/AlAbundance–/AlEFAbundance–/AlEFAbundance–/AlEF
TOC(wt.%)0.20 0.03 2.86 0.93 31.134.22 1.20 40.06 1.76 0.27 8.91
Al2O3(%)16.70 1.00 8.30 1.00 -7.91 1.00 -13.48 1.00 -
SiO2(%)58.90 3.53 58.90 9.35 2.6559.10 7.77 2.20 56.35 3.76 1.06
Fe2O3(%)2.80 0.17 2.66 0.49 2.913.29 0.58 3.41 4.64 0.46 2.70
CaO(%)2.20 0.13 7.67 2.44 18.88.17 1.58 12.17 6.02 0.70 5.38
MgO(%)2.60 0.16 3.11 0.59 3.672.49 0.38 2.36 3.01 0.27 1.71
K2O(%)3.60 0.22 2.23 0.41 1.872.19 0.43 1.97 3.43 0.40 1.82
Na2O(%)1.60 0.10 0.40 0.08 0.810.54 0.10 1.00 1.06 0.11 1.11
TiO2(%)0.78 0.05 0.37 0.05 1.050.34 0.05 1.00 0.56 0.05 0.95
P2O5(%)0.16 0.01 0.05 0.01 0.810.11 0.01 1.27 0.10 0.01 0.65
Bappm580.00 65.60 986.04 253.45 3.861305.94 318.52 4.86 1527.79 207.90 3.17
Nippm68.00 7.70 56.83 21.12 2.74100.11 29.45 3.82 51.91 7.61 0.99
Cuppm45.00 5.10 74.38 20.10 3.9451.33 13.51 2.65 38.02 5.64 1.11
Moppm2.60 0.29 9.66 7.20 24.849.31 14.37 49.54 9.85 1.50 5.16
Uppm3.70 0.42 5.83 2.70 6.4318.66 5.48 13.04 7.30 1.09 2.59
Vppm130.00 14.70 199.33 61.97 4.22267.17 90.29 6.14 148.94 22.34 1.52
Zrppm160.00 18.10 124.77 31.13 1.72111.53 27.90 1.54 204.58 29.20 1.61
Euppm1.600.180.92 0.26 1.440.86 0.21 1.16 1.07 0.16 0.88

