Numerical Analysis of Heat Transfer Mechanism of Thermal Runaway Propagation for Cylindrical Lithium-ion Cells in Battery Module


1
School of Mechanical Engineering, Hefei University of Technology, Hefei 230009, China
2
School of Automotive and Transportation Engineering, Hefei University of Technology, Hefei 230009, China
*
Authors to whom correspondence should be addressed.
Energies 2020, 13(4), 1010; https://doi.org/10.3390/en13041010
Submission received: 18 January 2020
/
Revised: 16 February 2020
/
Accepted: 19 February 2020
/
Published: 24 February 2020
Abstract
:An electrochemical-thermal coupling model combined with an electrically connected cylindrical cell model was built to produce a structural design that prevents thermal runaway propagation of cells on the battery module. Additionally, the characteristics of different modes of heat transfer of each cell during thermal runaway propagation of the battery module in an open environment were studied by changing the spacing of adjacent cells, the solder joint area, and the cross-sectional area of the electrode tab. Heat conduction is usually the main heat transfer mode for cells directly connected to the thermal runaway cell, while radiation heat transfer is the main heat exchange mode for cells that are not directly connected to thermal runaway cell. Increasing spacing can prevent thermal runaway propagation by the three heat transfer modes. Similarly, a smaller total solder joint area and cross-sectional area of the electrode tab can inhibit thermal runaway propagation through heat conduction transfer modes if conditions permit.
1. Introduction
In recent years, as high-energy, large-capacity lithium-ion cells have become widely used in power fields, including in electric vehicles, ships, and new energy storage, combustion and explosion accidents have occurred frequently. Therefore, the safety of the battery has gradually emerged as a concern, and has become an important technical issue that restricts the scale application of lithium-ion batteries [1,2]. Battery safety accidents basically originate from thermal runaway [3]. Under some improper conditions (e.g., elevated temperature, collision, etc.), when the lithium-ion cell exceeds a certain temperature, its internal exothermic chain reaction is triggered, which causes the temperature of the cell core to rise sharply and results in effects such as fire and explosion, which are referred to as cell thermal runaway. In practical applications, the individual cells are combined in series and parallel to form a battery pack. When a cell in the battery pack is in thermal runaway state, the quantity of heat is quickly transferred to the surrounding cells. At this time, the temperature of the neighboring cell will be beyond its safe range, allowing the thermal runaway of neighboring cells to be then triggered one after another. This phenomenon is called thermal runaway propagation of the battery pack [4]. The energy released by thermal runaway of the cell is limited, but the energy released by thermal runaway of the battery pack is enormous. Both domestic and foreign scholars have carried out fruitful work on the materials, structure, and manufacturing process of cathodes, anodes, diaphragms, and electrolytes to determine the trigger mechanism of thermal runaway in cells [5,6,7,8,9,10,11]. The thermal runaway propagation mechanism of the lithium-ion battery pack and ensuring its thermal safety are also current research foci in the field.
The current research on the thermal runaway propagation of lithium-ion battery packs is mainly carried out from the perspectives of the external environment [12,13,14,15,16], group structure [17,18,19,20,21], prediction models [22,23,24,25], and suppression measures [26,27,28,29]. Fu et al. studied the influence of a low-pressure environment on the thermal runaway propagation in terms of external environmental factors. It was found that the spread was slower than that in the normal pressure environment and the effective fire control time increases. Deng et al. conducted cell thermal runaway trigger experiments in both a semiclosed adiabatic environment and an open environment. It was concluded that the energy accumulation caused by the difference in heat generation and heat dissipation conditions in different environments will affect the speed of thermal runaway propagation. In terms of group structure factors, Lopez et al. conducted a thermal runaway propagation experiment on a battery pack with M-type and S-type plates and examined the influence of cell type and cell spacing on the thermal runaway propagation of the cell. The results demonstrated that increasing the cell spacing can reduce the damage experienced by adjacent cells and decrease the cell temperature and cell voltage loss. Lamb et al. experimentally studied the thermal runaway propagation of 10 series 18650 battery packs and found that heat conduction between the electrode post connections is the main heat transfer mode. In the prediction model of thermal runaway expansion, Larsson et al. proposed a prediction model to determine the thermal runaway/fire propagation path between lithium-ion cells by simulating temperature changes between cells. Feng et al. established a lumped parameter thermal resistance model and a 3D thermal runaway expansion model for thermal runaway propagation, revealing the thermal runaway propagation mechanism of the tandem prism cell. It was proposed to suppress the thermal runaway expansion by increasing the thermal runaway trigger temperature of the cell, reducing the total electrical energy released by the internal short circuit during thermal runaway, enhancing the heat dissipation condition of the battery module, and adding thermal insulation between the cells. Zhang et al. proposed a domino effect thermal runaway propagation model and performed numerical simulations via computational fluid dynamics (CFD) software, verifying the reliability of the revised equivalent heat release rate model. Some researchers have even proposed adding flame retardants to the internal components of the cell for added safety [26].
It is evident that the influencing factors and suppression methods of thermal runaway propagation of the lithium-ion battery pack have been the main foci in the existing research and that the heat transfer modes after thermal runaway in the lithium-ion battery pack have not been as extensively studied. Inside the battery pack, heat transfer between adjacent cells occurs in the forms of heat conduction, convection, and radiation. Different heat transfer modes correspond to the structural design of cell groups for suppressing thermal runaway propagation. Thus, to determine the main influencing factors, it is necessary to quantify the calculation and analysis of the heat transferred by various heat transfer modes during the thermal runaway propagation process and to design a structure that inhibits thermal runaway propagation of the cells in a battery pack according to those conclusions. Feng et al. quantified the heat transfer method for the thermal runaway expansion of prismatic cells in a tight contact cell stack. However, there exist few quantitative studies in this field on battery packs with different cell specifications and configurations.
Therefore, in the present study, the characteristics of different modes of heat transfer of each cell in the thermal runaway propagation of the battery module in an open environment were analyzed based on a combination of a CFD numerical simulation method, an electrochemical-thermal coupling model, and an electrically connected cylindrical cell model; the parameters of the cell spacing of adjacent cells, the solder joint area, and the cross-sectional area of the electrode tab were examined. Quantitative thermal data of different modes of heat transfer of each cell were calculated to describe the cumulative heat obtained or released via each cell by each transfer mode under different working conditions. Therefore, the effects of the three influencing factors on the three heat transfer modes of cells were empirically studied to provide guidance for a structural design that can prevent the thermal runaway propagation of cells on the battery module.
2. Model Establishment
2.1. Battery Module Structure
A battery module was formed through parallel and series connection, and several modules were then combined in series or in parallel to provide the voltage and capacity required for a particular application to provide an electric vehicle with the power it needs. The object is the cylindrical 18650 lithium-ion cell, which is composed of cathode, anode, electrolyte, separator, and external safety valve. The electrode is composed of an electrode active material, a conductive agent, and a binder. The cathode material of the battery is nickel–cobalt–manganese (NCM) ternary material, and the anode material is artificial graphite. The separator material is polypropylene (PP) and the main component of the electrolyte material is LiPF6.
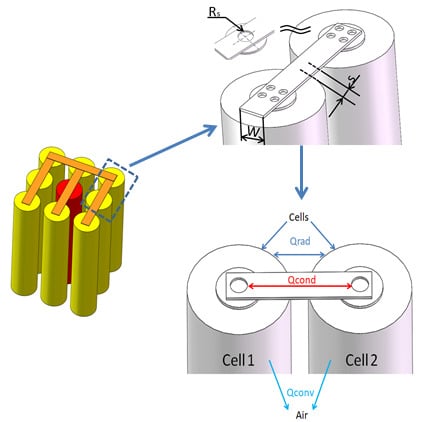
With reference to the 18650 lithium-ion cell thermal runaway propagation experiment conducted by Lopez et al. [17], a battery module with an M-type tab connection in an open environment was composed of nine cells in a 3 × 3 format, as shown in Figure 1. In the module, the cells were connected in parallel using an electrode tab. The three cells in each column were first connected in parallel by a longitudinal electrode tab of nickel. Then, the first cell in each column was connected using the lateral nickel electrode tab, i.e., the three columns of cells were connected in parallel to form a battery module. The cell and the electrode tab were connected by soldering. In the same parallel module, different connection orders also have different effects on thermal runaway expansion. Another S-type tab connection structure was also constructed for a battery pack with nine parallel cells in the study by Lopez et al. [17], but considering that the heat transfer characteristics of the M-type tab structure are more complex than those of the S-type tab structure, only the M-type tab structure is discussed in this paper.
The cell order and numbers of cells are presented in Figure 1. The central cell (Cell 5, hereinafter referred to as C5; the other cells are identified in the same way) was assumed to be a thermal runaway cell. To facilitate the calculation, it was assumed that the thermal runaway cell would not explode during the simulation [23]. In addition, to reduce the calculation time, only half of the cells (C1, C2, C4, C5, C7, and C8) in the symmetrical structure were analyzed. “S” denotes cell spacing, i.e., the distance between two adjacent cells in the horizontal or vertical direction.
Ultrasound welding, resistance welding, and laser welding are commonly used for the welding between the electrode ear and the electrode tab [30]. Regardless of the welding technology, the number of solder joints and the area of a single solder joint are important factors that affect heat transfer [31]. For a single cell, the influence factor can be considered as the area sum of all solder joints on the electrode ear of the cell. In this paper, the equivalent radius of solder joints, i.e., the radius of the circle corresponding to the total area, denoted as “Rs,” is considered as a factor.
The electrode tab is the medium with which to realize the series-parallel connection of cells, and is also an important thermal conductor that affects the heat transfer of thermal runaway cells; its cross-section is the main factor that affects heat transfer performance. The cross-section of the electrode tab is usually rectangular, and its thickness value is basically fixed at about 0.1 mm; therefore, the width of the cross-section, denoted as “W,” is also considered as a discussion factor in this paper.
2.2. Thermal Model
During cell operation, the release of internal chemical energy will cause a rise in temperature, which will affect the electric performance of the cell. The electrochemical-thermal model is a model that describes the thermal characteristics of a cell based on the thermal generation of electrochemical processes combined with the principle of heat transfer. In reality, the interior of the cell is a layered structure. However, the difference between the layered and nonlayered structure is small [32]. Therefore, to reduce the amount of calculation required and to speed up the calculation, a nonhierarchical structure is considered suitable for simulation, and each element was assumed to be a heat concentration model as a whole. Moreover, to better match the model to an actual situation, the battery pack was placed in an iron box during the experiment to simulate the electric vehicle cell case. The corresponding physical model was established by using COMSOL where the temperature field and heat flux of the entire battery module can be simulated. The battery pack was set as a solid domain, and the air between the battery pack and the iron box was set as a fluid domain. The heat transfer modes between the cells in the module were categorized into three forms, namely heat conduction, heat convection, and heat radiation.
The energy conservation equation inside of each cell in the module can be applied as follows:
where , , are the density, the specific heat, and the temperature of cell, respectively. is the rest of the energy inside of the thermal runaway cell. is convective heat transfer between electrolyte and cell internal materials. Assume that the electrolyte inside the battery does not flow, in which . is the heat conduction through the high-temperature heat source outside the cells. is the heat exchanged between the cell and electrode tab via heat conduction, and is the radiation heat transfer between the surfaces of cells. is the heat exchanged between the cell and environment via heat convection. The heat source of the cell mainly includes two parts: the Joule heat , which is caused by the internal resistance of the cell, and the reaction heat , which is added to the battery system as a heat source and is caused by the chemical or electrochemical reactions in the cell. The Joule heat can be ignored here because the remaining power of the cell has been set as 0 in the simulation.
The lithium-ion cell core has spiral geometries and is composed of multiple layers with different materials; the heat conduction in a cylindrical Li-ion cell is consequently anisotropic, as shown in Equation (2) [33,34]:
where, , and are the thermal conductivities in the radial direction, the circumferential direction, and the axial direction, respectively. In the radial direction, the heat flux passes through each layer of battery material in turn; for the circumferential and axial directions, the heat flux passes each layer of material in parallel. Thermal conductivities are calculated as follows [35]:
where is the thermal conductivity of the ith layer material. is the thickness of the ith layer material in radial direction of a battery. The ith layer material in axial direction of a cell includes the cathode electrode active material (pos), the positive current collector (poscc), the anode electrode material (neg), the negative current collector (negcc), and the battery separator (sep).
2.2.1. Electrochemical Model
In terms of thermal runaway incentives, in the cell on overcharge or internal short circuit or nail penetration condition, the internal current of the cell is greater than the rated current, and the cell is heated to a serious temperature. However, at an elevated temperature, direct heating can also lead to an increase in the internal temperature of cells. In either case, the mechanism is the same, and the heat generation process occurs during the thermal runaway in the cell.
The thermal runaway process is accompanied by abusive reactions. The abusive reactions of the cell are mainly composed of the heat from solid electrolyte interface decomposition QSEI, negative active material and electrolyte reaction Qne, positive active material and electrolyte reaction Qpe, electrolyte decomposition Qe, and negative active material and binder reaction QPVDF. The abusive reactions are shown in Equation (6) [25,36]:
When the cell temperature rises to 70 °C (343 K), the solid electrolyte interface (SEI) membrane begins to decompose and releases a large amount of heat, and the temperature increase rate of the cell increases significantly:
where HSEI (J kg−1) is the SEI decomposition heat, Wc (kg m−3) is the volume-specific carbon content before abusive reactions, ASEI (s−1) is the SEI decomposition frequency factor, Ea,SEI (J mol−1) is the SEI decomposition activation energy, CSEI is the dimensionless amount of lithium containing metastable species in the SEI, and mSEI is the reaction order for CSEI.
The cell temperature rises rapidly to 120 °C (393 K) in a short time. With the end of the SEI decomposition reaction, the lithium metal embedded in the negative electrode reacts with the electrolyte in the case of the loss of SEI membrane protection [23]:
where Hne (J kg−1) is the negative-solvent reaction heat, Wc (kg m−3) is the volume-specific carbon content before abusive reactions, Ane (s−1) is the negative-solvent frequency factor, Ea,ne (J mol−1) is the negative-solvent activation energy, Cne is the dimensionless amount of lithium within the carbon, mne is the reaction order for Cne, tSEI (mm) is the thickness of the SEI, and tSEI,ref is the dimensionless amount of SEI thickness.
When the temperature rises above 200 °C (473 K), the positive active material and electrolyte reaction is decomposed:
where Hpe (J kg−1) is the positive-solvent reaction heat, Wp (kg m−3) is the volume-specific active material content in the cathode before abusive reactions, Ape (s−1) is the positive-solvent frequency factor, Ea,pe (J mol−1) is the positive-solvent activation energy, is the inversion rate, mpe,1 is the reaction order for , and mpe,1 is the reaction order for .
The negative active material and binder reaction starts at around 240 °C (513 K):
where HPVDF (J kg−1) is the binder reaction heat, Wc (kg m−3) is the volume-specific carbon content before abusive reactions, APVDF (s−1) is the bind decomposition frequency factor, Ea,PVDF (J mol−1) is the bind activation energy, CPVDF is the dimensionless amount of lithium within the binder, and mPVDF is the reaction order for CPVDF.
When the cell temperature reaches 250 °C (523 K), the electrolyte decomposition reaction occurs:
where He (J kg−1) is the electrolyte decomposition heat, We (kg m−3) is the volume-specific electrolyte content before abusive reactions, Ae (s−1) is the electrolyte decomposition frequency factor, Ee (J mol−1) is the electrolyte decomposition activation energy, Ce is the dimensionless concentration of the electrolyte, and me is the reaction order for Ce.
The temperature of the electrolyte decomposition reaction is close to those of the positive electrode active material decomposition reaction and the negative active material and binder reaction. The electrolyte reaction occurs immediately when the two reactions occur. The three reactions occur almost simultaneously, and together release a large amount of heat. The temperature of the cell rises sharply and propels the entire thermal runaway process. Parameter settings are shown in Table 1, data from [37].
2.2.2. Heat Transfer Model
The cell is affected by three heat exchange modes in practical applications; thus, the coupling calculation method should be used. The heat conduction includes heat conduction in the solder joint and heat conduction on the surface of the cell. All heat conduction is calculated by the following formula:
where is the heat quantity via conduction and is the thermal conductivity. For heat conduction in the solder joint, is the area of the solder joint and is the thickness of the welding point. However, for heat conduction on the cell surface, is the side surface area of the cell and is the thickness of the cell shell. is the temperature difference between two adjacent cells.
Equation (13) is the formula for convective heat transfer, during which heat is exchanged between solids and fluids. Air is the heat-exchange medium for the whole process, and the convection heat transfer coefficient in natural convective heat transfer has a range of 5–10 .
where is the heat quantity through convection, is the area of side surface of the cell, represents the temperature of an arbitrary cell in the module, and is the temperature of air. The radiation heat transfer between the surfaces of cells is mainly simulated. Radiation is heat transfer caused by electromagnetic motion and is given by Equations (14)–(16):
where is the heat quantity through radiation, which is related to the fourth power of the cell surface and the ambient temperature, is the Stefan–Boltzmann constant, which is , and are the surface emissivities of cells, which are related to the cell shell material made of steel, is the view factor for a system with two cells, is the cell radius, and is the cell spacing.
2.2.3. Boundary Conditions of Heat Transfer
Heat transfer modes include heat conduction, convection, and radiation. There is contact thermal resistance between adjacent solid components and between solid and air. These thermal resistances can be simplified to the boundary conditions of the equivalent thermal resistance layer during the actual simulation modeling process.
There is thermal resistance between the cell case and the solder joint, and between the cell core and the cell case, which can be described by Equation (17):
where represents the heat flux density of the solid component to transfer outward and is the solid contact surface. represents the thermal conductivity of the material in solder joint. It is assumed that the solid components on both sides of the equivalent thermal resistance are labeled 0 and 1, respectively. However, for the shell of the cell, the boundary conditions of complex heat transfer are called nonlinear boundary conditions, which are superimposed by convection transfer and radiation transfer:
where represents the vertical cell surface vector direction. represents the thermal conductivity of the shell material in cell, 44.5. is the surface of cell that is superimposed by convection transfer and radiation transfer and is the radiation heat flux. The boundary conditions of complex heat transfer are called nonlinear boundary conditions.
2.3. Model Verification
To verify the correctness of the model settings and ensure the accuracy of the model results, the simulation temperatures of six cells with S = 4 mm were compared with the experimental results published by Lopez et al. [17], and the results are presented in Figure 2. Both in the experiment and in the simulation, the capacity of the simulated cell is 2600 mAh; the initial SOC of cells is 0%; the initial voltage of cells is 2.98 V and the initial temperature of air and cells is 293.15 K.
It can be observed that the calculation results are in good accordance with the experimental results, except for the temperature of C5 in the first 561 s. This is mainly due to the different triggering conditions for thermal runaway of C5. According to the experiment by Lopez et al. [17], the cell C5 is heated by a resistance wire wound around its side wall at a heating power of 20 W; however, in the corresponding simulation settings, the resistance wire is equivalent to the elevated temperature and triggers the thermal runaway of C5. The method of triggering thermal runaway in simulation is to apply a high-temperature heat source on the side of the cell. The temperature of the heat source on the cell shell was 423 K, which was applied to the cell from the beginning of the simulation. According to the partial enlarged view of Figure 2, it can be seen that the temperature curves between simulation and experiment still have small differences. Through calculation, the maximum relative error between the experimental and simulated temperature is approximately 1.8%, which can be considered negligible. Because the focus of this study is on the heat transfer characteristics after the thermal runaway of C5, this difference can be ignored. In other words, the comparison between the simulation model and the experimental results demonstrates that the temperature distributions are almost the same after 561 s. Therefore, the simulation of the thermal runaway propagation model that is adopted in this study is reasonable.
3. Results and Discussion
From Figure 2, it can also be seen that only C5 was triggered to thermal runaway at 561 s; a series of chemical reactions inside C5 was initiated, which resulted in a sudden increase of temperature from about 440 to 869 K for an instant, and thermal runaway expansion did not occur in the comparative working condition. After 800 s, the temperatures of each cell from greatest to least belonged to C5, C8, C2, C4, C1 and C7.
During the heating process, C5 was triggered to thermal runaway, resulting in a sudden increase of the cell temperature to 869 K in a very short amount of time at 561 s. Due to the temperature difference, C5 released heat via heat conduction of the electrode tab and radiation heat transfer.
The thermal runaway propagation of lithium-ion cells is complicated, and there are many influencing factors, primarily the cell materials and types [18], the battery SOC [38] and the cell spacing [39]. This section presents and analyzes the numerical results of heat transfer during the thermal runaway expansion of the battery as influenced by the cell spacing “S”, the equivalent radius “Rs” of the solder joints between the cell and the electrode tab and the width “W” of the cross-section of the electrode tab. The heat transfer characteristics that are analyzed mainly include the heat radiated and convected by the surface of the cells and the heat conducted by the electrode tabs and the solder joints.
3.1. Effect of Cell Spacing
The spacing between neighboring cells is an important factor that affects the heat transfer of the battery pack. Figure 3 presents the heat transfer characteristics of three different spacings (S = 2 mm, S = 3 mm and S = 4 mm) when Rs = 5 mm and W = 10 mm. Figure 3a–f respectively represent the heat transfer rates of C1, C2, C4, C5, C7 and C8 in different heat transfer modes. The three types of heat transfer correspond to the heat transfer rates of heat conduction through the electrode tab (), convective heat transfer between the surface of the cell and the air () and radiation heat transfer in the cell surface (). The total heat transfer data of the whole simulation process were calculated by integrating each curve in the graphs, as shown in Table 2, where , and represent the total heat exchanged quantity of cells by heat conduction, convection and radiation, respectively, and a negative sign before a datum indicates that the cell releases heat.
C5 is a thermal runaway cell whose surface is heated by high-temperature resistance wire; it is the heat source for the entire battery module. Figure 3d shows the heat transfer characteristics of C5, which are different from those of other cells. Due to the temperature difference, C5 transfers heat to other cells through heat conduction of the electrode tab, convection, and radiation heat transfer. There are slight differences in heat transfer rates for each heat transfer mode at different cell spacings, but the total heat for each mode as calculated by integration is obviously different. The amount of heat conduction released by the electrode tab reduces in turn at S = 2, 3 and 4 mm, and the amount of radiation heat exchange rises slightly (by about 11 kJ throughout the process) when S = 4 mm. Finally, the amount of convection heat transfer remains basically unchanged in all spacing conditions and is about 8730 10 J.
Except for C5, as illustrated in Figure 3, the relationships between the amount of radiation heat exchange of the remaining cells and time for the three different cell spacings are basically consistent with the trend of the temperature curve of cell C5 as a function of time. In other words, when C5 starts to be heated, the amount of radiation heat exchange increases slowly. At about 561 s, when thermal runaway of C5 occurs, the radiation value instantaneously increases and then rapidly decreases after reaching a certain peak value. The radiation heat transfer of all cells is derived from the radiation of C5, and its value is calculated to be proportional to the fourth power of its temperature, which can be seen from Equation (10). For heat conduction, because C2 and C8 are closest to the position of C5 due to the connection through the electrode tab, these two cells are symmetrical to C5, and therefore the amounts of conduction heat exchange of C2 and C8 are the largest and the same. The relationship between the heat conduction transfer rate and time for both C2 and C8 is the same as the trend of temperature change in C5. For C1, C4 and C7, which are connected to C5 by the electrode tab from nearest to farthest, their heat transfer rates of heat conduction decrease in turn. However, because C4 receives a large amount of radiation heat transfer from C5, and because its temperature is higher than those of C1 and C7, its heat conduction transfer is negative, i.e., it conducts heat to C1 and C7 through the electrode tab. In terms of convection heat transfer, the temperatures of C1, C2, C4, C7 and C8 increased slightly after C5 was triggered to thermal runaway.
C1 is in a diagonal position to C5 and is connected with C5 by the electrode tab, which is separated by C2. From Figure 3a, it can be seen that when the spacing increases from 2 mm to 3 mm and 4 mm, the heat transfer rates of the three heat exchange modes of C1 all decrease with the increase of spacing. Therefore, under the three spacing conditions, heat transfer from heat conduction is the largest, followed by radiation heat transfer. Overall, it can be determined that with the increase of the distance, the external performance of C1 is characterized by a gradually decreasing temperature as well as a gradually decreasing total heat exchange. This change trend is similar to that reported in the existing literature [17].
C2 is the nearest cell to C5, and is connected to C5 through the electrode tab. From Table 2, it is found that the values of heat exchange of C2 through all three heat transfer modes decrease with the increase of spacing. Furthermore, the values of heat exchange of C2 through the electrode tab are always greater than 1 kJ. Therefore, for the three different spacing conditions, heat conduction occupies a dominant position for C2, while radiation has a smaller share.
Figure 3c presents the heat transfer rates of C4 under the three heat transfer modes with the increase of cell spacing. Spatially, C4 is on the left of C5 and is connected with C5 by the electrode tab, which is separated by C1 and C2. With the increase of spacing, i.e., at 2, 3 and 4 mm spacings, the heat transfer values of C1 through conduction are 92, 71 and 61 J, those through radiation are 1209, 1069 and 950 J, and those through convection are 457, 377 and 338 J, respectively. It should be noted that heat conduction is negative, i.e., C4 transfers heat outward through the electrode tab. This is because C4 absorbs a lot of radiation heat, and the temperature of C4 is higher than those of C1 and C7, which connect the upstream and downstream of the electrode tab. Additionally, regardless of the spacing, the radiation heat transfer of C4 plays a dominant role.
Figure 3e shows that C7 exchanges heat under the three heat exchange modes of heat conduction, convection, and radiation when the cell spacings are 2, 3 and 4 mm, respectively. Although C7 is also on a diagonal line with the C5, which is the same as C1, it has the longest heat conduction distance from C5 through the electrode tab. The total heat quantities of thermal conduction of C7 when the cell spacings are 2, 3 and 4 mm are 82, 62 and 51 J, those of radiation are 552, 511 and 468 J, and those of convection are 226, 192 and 176 J, respectively. All heat transfer modes therefore exhibit decreasing trends when the spacing is increased. Under the three spacing conditions, the largest share of heat transfer of C7 is radiation.
C8 is the highest temperature cell except for the thermal runaway cell C5, which can be seen from Figure 2. The heat transfer characteristics of C8 are shown in Figure 3f and are similar to those of C2. This is because C8 is the only cell that is connected nearest to the C5 at the other end of the electrode tab. According to the corresponding datum in Table 2, heat conduction occupies the majority position for C8, whereas radiation exhibits the opposite trend regardless of the spacing variation; this is exactly the same scenario as that for C2.
It can be concluded from the preceding analysis that the spacing distances of C2, C4, C8 and thermal runaway cell C5 are the same, but the distances between them and C5 through the electrode tab are different; this results in the change of the heat transfer mode of these three cells receiving the heat from C5. In other words, the closer connections of C2 and C8 through the electrode tab are mainly affected by thermal conduction, while the longer connection of the electrode tab is mainly affected by heat radiation.
3.2. Effect of the Equivalent Radius of Solder Joints
Figure 4 presents the heat transfer characteristics of the different heat transfer modes of each cell when the equivalent radius of the solder joint is Rs = 1 mm, Rs = 3 mm, Rs = 5 mm and S = 4 mm, W = 10 mm. Similar to the previous table, the total heat exchange calculated by integrating is shown in Table 3.
The thermal runaway cell C5 is first discussed. As presented in Figure 4d, when the equivalent radius increases, the heat transfer rates and integral calculations of the three heat transfer modes are obviously different. The heat conduction released by the electrode tab increases obviously, the calculated values of which increase with the equivalent radius increases as shown in Table 3, but the increasing range decreases gradually. From the curve trend, it is evident that the heat transfer rates of radiation and convection are not affected by the change of the equivalent radius; however, in terms of total heat transfer, convection heat transfer decreases slightly with the increase of the solder joint equivalent radius, while radiation heat transfer increases slightly.
For C1, as can be seen in Figure 4a, with the increase of the equivalent radius of the solder joint, the heat conduction rate increases, the convection rate increases slightly and the radiation rate appears to be basically unchanged.
As presented in Figure 4b, the main heat transfer mode of C2 is heat conduction, the maximum heat conduction rates of which are respectively 1.4, 2.4 and 3.1 W with the increase of the equivalent radius through the electrode tab after thermal runaway of C5 is triggered. The values of integral heat conduction exhibit a rapid increase. The total convective heat dissipation values presents a gradual increasing trend. The smallest amount of heat transfer is from radiation, the calculated results for which are 273, 194 and 133 J for radius values of 1, 3 and 5 mm, respectively, and it therefore presents a decreasing trend.
Figure 4c, which represents the heat transfer of C4, indicates that with the increase of the equivalent radius, the changes of the heat transfer rate of all three heat transfer modes are all very small. The total convective heat dissipation values of C4 are 369, 348 and 338 J, and the total radiation heat quantities are 929, 942 and 949 J; the change rate of adjacent values is within 5%. It should be noted that the heat conduction rates exhibit a modest decrease with the increase of the equivalent radius; all three curves slightly cross the zero line of the y-axis from top to bottom, and the change of the solder joint radius leads to the direction change of the heat conduction of C4. When Rs = 1 mm, C4 exhibits endothermic heat conduction, i.e., the total heat conduction is positive; when Rs = 3 and 5 mm, C4 exhibits exothermic heat conduction, i.e., the total heat conduction is negative. In the two cases, the mode of heat transfer that causes the temperature of C4 to rise is only the radiation mode.
C7 is the last cell connected at one end of the electrode tab, and its heat transfer characteristics are presented in Figure 4e. It is evident that the area size of the solder joint has little effect on the three heat transfer modes, which is similar to the effect on C4 in Figure 4. The difference is that the heat conduction rates of C7 under the three radius conditions are all greater than 0, i.e., the heat conduction of C7 is endothermic.
The heat transfer characteristics of C8 are similar to those of C2, as shown in Figure 4f. When the equivalent radius increases from 1 to 3 and 5 mm, the values of heat exchange of C8 through conduction are 792, 1287 and 1701 J, those through convection are 436, 626 and 792 J, and those through radiation are 236, 145 and 60 J, respectively. Therefore, with the increase of the equivalent radius, heat conduction occupies a dominant position for C8 and increases by a large margin, convection increases slightly and radiation occupies the smallest share and decreases dramatically.
From the preceding analysis, it is evident that the total area of the solder joint primarily affects heat conduction. When the cell C5 is triggered out of control, most of its heat is quickly transferred to C2 and C8 upstream and downstream of the electrode tab through thermal conduction, which causes the temperature of the two cells to rise rapidly; therefore, the two cells are greatly affected by the solder joint area. At the same time, C2 also continues to transfer heat along the electrode tab to C1 at the other end, making its temperature rise significantly. The influence degree of the total area of the solder joints is the second-largest. C4 and C7 are far away from C5 on the electrode tab and receive little heat conduction, so they are less affected by the total area of the solder joints. Therefore, the total welding area should be minimized under the requirement of guaranteeing the welding strength between the conductive tab and the cell ear.
3.3. Effect of the Width of the Cross-Section of the Electrode Tab
Figure 5 presents the heat transfer rates of three heat transfer modes for each cell with different cross-section widths (W = 2, 6 and 10 mm) of the electrode tab and when S = 4 mm and Rs = 1 mm. Table 4 shows the total heat exchange calculated by integrating in this section.
The heat release characteristics of thermal runaway cell C5 are presented in Figure 5d. When the width of the electrode tab increases from 2 to 6 and 10 mm, the rate of heat released by conduction via the solder joint increases evidently, but the heat release rates of convection and radiation are almost unchanged. It can be determined by integral calculation that the respective values of total conductive heat are 578, 1486 and 2055 J, while the total convective heat is about 8.9 kJ and the radiation heat is about 11 kJ.
For C1, which is described in Figure 5a, with the increase of the electrode tab width from 2 to 6 and 10 mm, the heat absorbed by thermal conduction increases continuously, the quantified values of which are 33, 156 and 278 J, respectively. The heat released by convection also continuously increases, and the quantified values are 164, 209 and 253 J with the increase of the electrode tab width from 2 to 6 and 10 mm, respectively. The radiation rate and amount remain basically unchanged.
For C2, corresponding to Figure 5b, it can be seen that with the increase of the width, the heat transfer rates of conduction and convection both increase obviously, while that of radiation reduces slightly. As determined by integral calculation, with the increase of the electrode tab width from 2 to 6 and 10 mm, the values of heat absorbed by thermal conduction are 230, 496 and 584 J, those released by convection are 216, 321 and 359 J and the values of heat released by radiation are 338, 290 and 273 J, respectively.
As shown in Figure 5c, the heat transfer characteristic curves of the three heat transfer modes of C4 are almost unchanged in relation to the electrode tab width. However, it is important to note that all three curves slightly cross the zero line of the y-axis from top to bottom, which is the same as the phenomenon that occurs for C4 in Figure 4c. In contrast, the heat conduction rates slightly increase with the increase of the width, and therefore C4 releases heat via heat conduction when L = 2 mm and 6 mm, whereas it absorbs heat to itself when W = 10 mm.
C7 is described in Figure 5e. It can be seen that the electrode tab width has little effect on the three heat transfer modes of C7, which is the same as the effect of the solder joint area on C7.
As shown in Figure 5f, the influences of the width on the heat transfer characteristics of C8 are similar to those of C2. With the increase of the width, the heat conduction increases rapidly and occupies the largest share of heat transfer, followed by heat convection, which increases gradually, while the heat radiation slowly decreases.
From the analysis in this section, it can be concluded that the cross-sectional area of the electrode tab also mainly affects the mode of heat conduction. When C5 is triggered to thermal runaway, most of its internal chemical heat is transferred to the upstream and downstream of the electrode tab via heat conduction. The farther away from C5, the less heat conduction it receives. At the same time, in the presence of radiation and convection, the coupling effect changes the temperature of the cell at different locations. Therefore, from the point of view of restraining thermal runaway, the cross-sectional area of electrode tab should be reduced to guarantee the electrical and mechanical properties of the connection.
4. Conclusions
The numerical results of the heat transfer rates of three heat transfer modes (heat conduction, heat convection and heat radiation) of each cell in the thermal runaway propagation of the battery module were obtained by changing the spacing of adjacent cells, the solder joint area and the cross-sectional area of the electrode tab. The conclusions are as follows.
With the increase of cell spacing, the heat transfer capacity of the three heat transfer modes decreases for all cells. For the cells that are directly connected with thermal runaway cell through the electrode tabs, the main heat transfer mode is heat conduction, while that for cells that are not directly connected is heat radiation. Therefore, on the premise of meeting the energy density requirement of the battery pack, properly increasing the cell spacing can restrain the thermal runaway propagation from three heat transfer modes.
The total area of solder joints has the most significant effect on the heat conduction of the cell, especially on those which are directly connected to the thermal runaway cell. Additionally, the heat exchange of conduction increases as the increase of the total area of solder joints. Therefore, under the condition of guaranteeing welding stability, the area of the solder joints can be reduced appropriately to inhibit thermal runaway propagation via thermal conduction.
Heat conduction is affected by the cross-sectional area of the electrode tab; heat dissipation by conduction increases with the increase of the cross-sectional area of the electrode tab. However, the convection and radiation ability of cells are basically independent of the cross-sectional area. Therefore, proper reduction of the cross-sectional area of the electrode tab can effectively prevent thermal runaway propagation.
Author Contributions
Conceptualization, Z.T. and A.S.; Investigation, S.W.; Methodology, A.S.; Supervision, J.C. and C.T.; Writing—original draft, Z.T. and A.S.; Writing—review & editing, Z.T., A.S., S.W., J.C. and C.T. All authors have read and agreed to the published version of the manuscript.
Funding
The authors did not receive any funds for covering the costs to publish in open access.
Conflicts of Interest
The authors declare no conflicts of interest.
References
- Fu, Y.; Lu, S.; Li, K.; Liu, C.; Cheng, X.; Zhang, H. An experimental study on burning behaviors of 18650 lithium ion batteries using a cone calorimeter. J. Power Sources 2015, 273, 216–222. [Google Scholar] [CrossRef]
- Spotnitz, R.; Franklin, J. Abuse behavior of high-power, lithium-ion cells. J. Power Sources 2003, 113, 81–100. [Google Scholar] [CrossRef]
- Feng, X.; Sun, J.; Ouyang, M.; Wang, F.; He, X.; Lu, L.; Peng, H. Characterization of penetration induced thermal runaway propagation process within a large format lithium ion battery module. J. Power Sources 2015, 275, 261–273. [Google Scholar] [CrossRef]
- Wilke, S.; Schweitzer, B.; Khateeb, S.; Al-Hallaj, S. Preventing thermal runaway propagation in lithium ion battery packs using a phase change composite material: An experimental study. J. Power Sources 2017, 340, 51–59. [Google Scholar] [CrossRef]
- Liu, X.; Wu, Z.; Stoliarov, S.I.; Denlinger, M.; Masias, A.; Snyder, K. Heat release during thermally-induced failure of a lithium ion battery: Impact of cathode composition. Fire Saf. J. 2016, 85, 10–22. [Google Scholar] [CrossRef]
- Feng, X.; Zheng, S.; Ren, D.; He, X.; Wang, L.; Cui, H.; Hsu, H.; Gao, S.; Chen, T.; Li, Y.; et al. Investigating the thermal runaway mechanisms of lithium-ion batteries based on thermal analysis database. Appl. Energy 2019, 246, 53–64. [Google Scholar] [CrossRef]
- Golubkov, A.W.; Scheikl, S.; Planteu, R.; Voitic, G.; Wiltsche, H.; Stangl, C.; Fauler, G.; Thaler, A.; Hacker, V. Thermal runaway of commercial 18650 Li-ion batteries with LFP and NCA cathodes-impact of state of charge and overcharge. RSC Adv. 2015, 5, 57171–57186. [Google Scholar] [CrossRef] [Green Version]
- Yang, Y.; Huang, X.; Cao, Z.; Chen, G. Thermally conductive separator with hierarchical nano/microstructures for improving thermal management of batteries. NANO Energy 2016, 22, 301–309. [Google Scholar] [CrossRef] [Green Version]
- Wang, Q.; Ping, P.; Zhao, X.; Chu, G.; Sun, J.; Chen, C. Thermal runaway caused fire and explosion of lithium ion battery. J. Power Sources 2012, 208, 210–224. [Google Scholar] [CrossRef]
- Chen, M.; Zhou, D.; Chen, X.; Zhang, W.; Liu, J.; Yuen, R.; Wang, J. Investigation on the thermal hazards of 18650 lithium ion batteries by fire calorimeter. J. Therm. Anal. Calorim. 2015, 122, 755–763. [Google Scholar] [CrossRef]
- Inoue, T.; Mukai, K. Roles of positive or negative electrodes in the thermal runaway of lithium-ion batteries: Accelerating rate calorimetry analyses with an all–inclusive microcell. Electrochem. Commun. 2017, 77, 28–31. [Google Scholar] [CrossRef]
- Fu, Y.; Lu, S.; Shi, L.; Cheng, X.; Zhang, H. Ignition and combustion characteristics of lithium ion batteries under low atmospheric pressure. Energy 2018, 161, 38–45. [Google Scholar] [CrossRef]
- Deng, Z.; Sun, Q.; He, Y. Experimental study on the trigger conditions of 18650 type lithium-ion battery thermal runaway fire extension. Fire Sci. Technol. 2018, 37, 690. [Google Scholar]
- Feng, X.; Sun, J.; Ouyang, M.; He, X.; Lu, L.; Han, X.; Fang, M.; Peng, H. Characterization of large format lithium ion battery exposed to extremely high temperature. J. Power Sources 2014, 272, 457. [Google Scholar] [CrossRef]
- Rong, L.; Zhang, H.; Fu, Y.; Cheng, X.D. Effect of Heating Temperature on Thermal Stability of Lithium-ion Battery. DEStech Trans. Environ. Energy Earth Sci. 2017. [Google Scholar] [CrossRef]
- Hofmann, A.; Uhlmann, N.; Ziebert, C.; Wiegand, O.; Schmidt, A.; Hanemann, T. Preventing Li-ion cell explosion during thermal runaway with reduced pressure. Appl. Therm. Eng. 2017, 124, 539–544. [Google Scholar] [CrossRef]
- Lopez, C.F.; Jeevarajan, J.A.; Mukherjee, P.P. Experimental analysis of thermal runaway and propagation in lithium-ion battery modules. J. Electrochem. Soc. 2015, 162, A1905–A1915. [Google Scholar] [CrossRef]
- Lamb, J.; Orendorff, C.J.; Steele, L.A.M.; Spangler, S.W. Failure propagation in multi-cell lithium ion batteries. J. Power Sources 2015, 283, 517–523. [Google Scholar] [CrossRef] [Green Version]
- Wang, Z.; Yang, H.; Li, Y.; Wang, G.; Wang, J. Thermal runaway and fire behaviors of large-scale lithium ion batteries with different heating methods. J. Hazard. Mater. 2019, 379, 120730. [Google Scholar] [CrossRef]
- Coman, P.T.; Darcy, E.C.; Veje, C.T.; White, R.E. Numerical analysis of heat propagation in a battery pack using a novel technology for triggering thermal runaway. Appl. Energy 2017, 203, 189–200. [Google Scholar] [CrossRef]
- Spotnitz, R.M.; Weaver, J.; Yeduvaka, G.; Doughty, D.H.; Roth, E.P. Simulation of abuse tolerance of lithium-ion battery packs. J. Power Sources 2007, 163, 1080–1086. [Google Scholar] [CrossRef]
- Larsson, F.; Anderson, J.; Andersson, P.; Mellander, B.E. Thermal modelling of cell-to-cell fire propagation and cascading thermal runaway failure effects for lithium-ion battery cells and modules using fire walls. J. Electrochem. Soc. 2016, 163, 2854–2865. [Google Scholar] [CrossRef]
- Feng, X.; Lu, L.; Ouyang, M.; Li, J.; He, X. A 3D thermal runaway propagation model for a large format lithium ion battery module. Energy 2016, 115, 194–208. [Google Scholar] [CrossRef]
- Zhang, Q.; Cao, W.; Luo, X.; Jiang, N. Analysis method of heat release rate of lithium-ion battery based on domino effect. J. Beijing Univ. Aeronaut. Astronaut. 2017, 43, 902. [Google Scholar]
- Kim, G.-H.; Pesaran, A.; Spotnitz, R. A three–dimensional thermal abuse model for lithium-ion cells. J. Power Sources 2007, 170, 476–489. [Google Scholar] [CrossRef]
- Mandal, B.K.; Padhi, A.K.; Shi, Z.; Chakraborty, S.; Filler, R. Thermal runaway inhibitors for lithium battery electrolytes. J. Power Sources 2006, 161, 1341–1345. [Google Scholar] [CrossRef]
- Liu, R.; Chen, J.; Xun, J.; Jiao, K.; Du, Q. Numerical investigation of thermal behaviors in lithium-ion battery stack discharge. Appl. Energy 2014, 132, 288–297. [Google Scholar] [CrossRef]
- Kshetrimayum, K.S.; Yoon, Y.-G.; Gye, H.-R.; Lee, C.J. Preventing Heat Propagation and Thermal Runaway in Electric Vehicle Battery Modules using Integrated PCM and Micro–channel Plate Cooling System. Appl. Therm. Eng. 2019, 159, 113797. [Google Scholar] [CrossRef]
- Wu, P.; Jan, R.; FENG, X.; Zhang, M.; Lu, L.; He, X.; Ouyang, M. Thermal Runaway Propagation within Module Consists of Large Format Li-Ion Cells; SAE-China Congress 2015; Selected Papers 2016; Springer: Singapore, 2015. [Google Scholar]
- Yang, J.; Yan, H.; Tian, C.; Li, J. Exploration on Automatic Welding Methods for Battery Pack of New Energy Automobiles. Adv. Mater. Res. 2014, 986, 923–926. [Google Scholar] [CrossRef]
- Yang, J.; Tian, C.; Hu, H.; Yan, H. Research on the Orthogonal Test of Spot Welding Parameters of power battery packs. Appl. Mech. Mater. 2015, 716, 1118–1122. [Google Scholar] [CrossRef]
- Feng, X.; He, X.; Ouyang, M.; Lu, L.; Wu, P.; Kulp, C.; Prasser, S. Thermal runaway propagation model for designing a safer battery pack with 25 Ah LiNixCoyMnzO2 large format lithium ion battery. Appl. Energy 2015, 154, 74–91. [Google Scholar] [CrossRef]
- Ma, Y.; Teng, H.; Thelliez, M. Electro–Thermal Modeling of a Lithium-ion Battery System. SAE Int. J. Eng. 2010, 3, 306–317. [Google Scholar] [CrossRef]
- Lee, K.J.; Smith, K.; Pesaran, A.; Kim, G.H. Three dimensional thermal-, electrical-, and electrochemical-coupled model for cylindrical wound large format lithium-ion batteries. J. Power Sources 2013, 241, 20–32. [Google Scholar] [CrossRef]
- Lai, Y.; Wu, W.; Chen, K.; Wang, S.; Xin, C. A compact and lightweight liquid-cooled thermal management solution for cylindrical lithium-ion power battery pack. Int. J. Heat Mass Transf. 2019, 144, 118581. [Google Scholar] [CrossRef]
- Hatchard, T.D.; MacNeil, D.D.; Basu, A.; Dahn, J.R. Thermal model of cylindrical and prismatic lithium-ion cells. J. Electrochem. Soc. 2001, 148, 755–761. [Google Scholar] [CrossRef]
- Dong, T.; Peng, P.; Jiang, F. Numerical modeling and analysis of the thermal behavior of NCM lithium-ion batteries subjected to very high C-rate discharge/charge operations. Int. J. Heat Mass Transf. 2018, 117, 261–272. [Google Scholar] [CrossRef]
- Larsson, F.; Andersson, P.; Blomqvist, P.; Lorén, A.; Mellander, B.E. Characteristics of lithium-ion batteries during fire tests. J. Power Sources 2014, 271, 414–420. [Google Scholar] [CrossRef]
- Kizilel, R.; Sabbah, R.; Selman, J.R.; Al-Hallaj, S. An alternative cooling system to enhance the safety of Li–ion battery packs. J. Power Sources 2009, 194, 1105–1112. [Google Scholar] [CrossRef]
Figure 1.
Battery module structure with M-type tab.

Figure 2.
Verification of the correctness of the simulation results via experimentation.

Figure 3.
Heat transfer rates of different heat transfer modes of each cell when S = 2, 3 and 4 mm (Rs = 5 mm, W = 10 mm); (a) C1, (b) C2, (c) C4, (d) C5, (e) C7, (f) C8.
Figure 3.
Heat transfer rates of different heat transfer modes of each cell when S = 2, 3 and 4 mm (Rs = 5 mm, W = 10 mm); (a) C1, (b) C2, (c) C4, (d) C5, (e) C7, (f) C8.


Figure 4.
Heat transfer rates of different heat transfer modes of each cell when Rs = 1, 3 and 5 mm (S = 4 mm, W = 10 mm); (a) C1, (b) C2, (c) C4, (d) C5, (e) C7, (f) C8.
Figure 4.
Heat transfer rates of different heat transfer modes of each cell when Rs = 1, 3 and 5 mm (S = 4 mm, W = 10 mm); (a) C1, (b) C2, (c) C4, (d) C5, (e) C7, (f) C8.

Figure 5.
Heat transfer rates with different heat transfers of each cell when W = 2, 6 and 10 mm (S = 4 mm, Rs = 1mm); (a) C1, (b) C2, (c) C4, (d) C5, (e) C7, (f) C8.
Figure 5.
Heat transfer rates with different heat transfers of each cell when W = 2, 6 and 10 mm (S = 4 mm, Rs = 1mm); (a) C1, (b) C2, (c) C4, (d) C5, (e) C7, (f) C8.


Table 1.
Physical and kinetic parameters for abusive reactions.
| 2.57 × 10⁵ (J kg−1) | 0.15 | ||
| 1.714 × 10⁶ (J kg−1) | 0.75 | ||
| 7.9 × 10⁵ (J kg−1) | 0.44 | ||
| 1.55 × 10⁵ (J kg−1) | 1 | ||
| 1.5 × 10⁶ (J kg−1) | 1 | ||
| 2.25 × 10¹⁵ (s−1) | 0.033 | ||
| 2.5 × 10¹³ (s−1) | 1 | ||
| 2.55 × 10¹⁴ (s−1) | 1 | ||
| 5.14 × 1025 (s−1) | 1 | ||
| 1.917 × 1025 (s−1) | 1 | ||
| 1.3508 × 10⁵ (J mol−1) | 1 | ||
| 1.3508 × 10⁵ (J mol−1) | 1 | ||
| 1.5888 × 10⁵ (J mol−1) | 1.39 × 10³ (kg m−3) | ||
| 2.74 × 10⁵ (J mol−1) | 1.5 × 10³ (kg m−3) | ||
| 2.86 × 10⁵ (J mol−1) | 5 × 10² (kg m−3) |
Table 2.
Heat exchange quantities of each cell when S = 2, 3 and 4 mm.
| Heat Exchange Quantities of Each Cell | ||||||
|---|---|---|---|---|---|---|
| S = 2 mm | C1 | C2 | C4 | C5 | C7 | C8 |
| Qcond/J | 581 | 1423 | −92 | −4231 | 82 | 1904 |
| Qconv/J | −394 | −779 | −457 | −8734 | −226 | −965 |
| Qrad/J | 492 | 220 | 1209 | −10,830 | 552 | 127 |
| S = 3 mm | C1 | C2 | C4 | C5 | C7 | C8 |
| Qcond/J | 499 | 1380 | −71 | −4004 | 62 | 1803 |
| Qconv/J | −333 | −689 | −377 | −8724 | −192 | −848 |
| Qrad/J | 460 | 179 | 1069 | −10,999 | 511 | 100 |
| S = 4 mm | C1 | C2 | C4 | C5 | C7 | C8 |
| Qcond/J | 444 | 1314 | −61 | −3799 | 51 | 1701 |
| Qconv/J | −301 | −647 | −338 | −8740 | −176 | −792 |
| Qrad/J | 423 | 133 | 950 | −11,152 | 468 | 60 |
Table 3.
Heat exchange quantities of each cell when Rs = 1, 3 and 5 mm.
| Rs =1 mm | C1 | C2 | C4 | C5 | C7 | C8 |
| Qcond/J | 278 | 585 | 9 | −2055 | 38 | 792 |
| Qconv/J | −253 | −359 | −369 | −8895 | −173 | −436 |
| Qrad/J | 432 | 273 | 929 | −11,117 | 458 | 236 |
| Rs = 3 mm | C1 | C2 | C4 | C5 | C7 | C8 |
| Qcond/J | 380 | 1011 | −41 | −3044 | 41 | 1287 |
| Qconv/J | −282 | −526 | −348 | −8848 | −174 | −626 |
| Qrad/J | 427 | 194 | 942 | −11,128 | 465 | 145 |
| Rs = 5 mm | C1 | C2 | C4 | C5 | C7 | C8 |
| Qcond/J | 444 | 1314 | −6 | −3800 | 51 | 1701 |
| Qconv/J | −301 | −647 | −338 | −8740 | −175 | −792 |
| Qrad/J | 424 | 133 | 950 | −11,154 | 468 | 60 |
Table 4.
Heat exchange quantities of each cell when W = 2, 6 and 10 mm.
| W = 2 mm | C1 | C2 | C4 | C5 | C7 | C8 |
| Qcond/J | 33 | 230 | −22 | −578 | 9 | 260 |
| Qconv/J | −164 | −216 | −339 | −8907 | −156 | −228 |
| Qrad/J | 452 | 338 | 928 | −11,137 | 456 | 332 |
| W = 6 mm | C1 | C2 | C4 | C5 | C7 | C8 |
| Qcond/J | 156 | 496 | −27 | −1486 | 22 | 625 |
| Qconv/J | −209 | −321 | −351 | −8903 | −166 | −368 |
| Qrad/J | 443 | 290 | 931 | −11,122 | 458 | 267 |
| W = 10 mm | C1 | C2 | C4 | C5 | C7 | C8 |
| Qcond/J | 278 | 584 | 9 | −2055 | 38 | 792 |
| Qconv/J | −253 | −359 | −369 | −8895 | −173 | −436 |
| Qrad/J | 432 | 273 | 929 | −11,117 | 458 | 236 |
© 2020 by the authors. Licensee MDPI, Basel, Switzerland. This article is an open access article distributed under the terms and conditions of the Creative Commons Attribution (CC BY) license (http://creativecommons.org/licenses/by/4.0/).
Share and Cite
MDPI and ACS Style
Tang, Z.; Song, A.; Wang, S.; Cheng, J.; Tao, C. Numerical Analysis of Heat Transfer Mechanism of Thermal Runaway Propagation for Cylindrical Lithium-ion Cells in Battery Module. Energies 2020, 13, 1010. https://doi.org/10.3390/en13041010
AMA Style
Tang Z, Song A, Wang S, Cheng J, Tao C. Numerical Analysis of Heat Transfer Mechanism of Thermal Runaway Propagation for Cylindrical Lithium-ion Cells in Battery Module. Energies. 2020; 13(4):1010. https://doi.org/10.3390/en13041010
Chicago/Turabian StyleTang, Zhiguo, Anqi Song, Shoucheng Wang, Jianping Cheng, and Changfa Tao. 2020. "Numerical Analysis of Heat Transfer Mechanism of Thermal Runaway Propagation for Cylindrical Lithium-ion Cells in Battery Module" Energies 13, no. 4: 1010. https://doi.org/10.3390/en13041010
Note that from the first issue of 2016, this journal uses article numbers instead of page numbers. See further details here.