Article

A Systematic Methodology for Optimal Design of Wireless Power Transfer System Using Genetic Algorithm

1
School of Electrical Engineering, Iran University of Science and Technology (IUST), Iran Neural Technology Research Centre, Tehran 15614, Iran
2
School of Electrical Engineering, Iran University of Science and Technology (IUST), Tehran 15614, Iran
*
Author to whom correspondence should be addressed.
Energies 2020, 13(2), 383; https://doi.org/10.3390/en13020383
Submission received: 6 November 2019 / Revised: 25 December 2019 / Accepted: 26 December 2019 / Published: 13 January 2020
(This article belongs to the Special Issue Future Wireless Power Transfer and Communications)

Abstract

:
This paper presents a systematic methodology for the optimal design of wireless power transfer (WPT) systems. To design a WPT for a specific application, the values of coil geometric parameters and the number of resonators should be chosen such that an objective function is maximized while satisfying all the design constraints. The conventional methodologies, which are based on cyclic coordinate optimization, are not comprehensive and efficient methods. This paper presents a design methodology based on the genetic algorithm (GA). The optimization method has been applied to designing different WPTs with series and parallel connections of load and different design constraints. Moreover, the number of resonators is considered as the design parameters. In addition, WPTs with parallel and series connections of load are compared from different aspects. The results of calculation, simulation and measurements demonstrate that the 2-coil WPT can be optimized to achieve maximum efficiency compared to the previously reported 2-coil and multi-coil WPTs. In a fabricated 2-coil configuration, a power transfer efficiency (PTE) of 82.7% and a power delivered to the load (PDL) of 173.89 mW are achieved.

1. Introduction

Wireless implantable microelectronic devices (IMDs) are being widely used today in diagnostic as well as therapeutic purposes [1,2]. A critical issue in the design of IMDs is the transferring of the required power to the implanted microelectronic device. To overcome the limitations of the current battery technologies and transcutaneous energy transfer for implanted devices, the wireless power transfer (WPT) system using inductively coupled coils has received considerable attention in recent years, not only in biomedical implants but also in a variety of industrial applications [3,4,5,6,7,8]. A WPT system consists of a highly efficient power amplifier (PA) connected to the transmitter (Tx) coil on the external side of the body and a secondary power receiver (Rx) coil on the internal side of the body. A critical issue in designing an inductively coupled power transfer is the power transfer efficiency (PTE) which requires to be high while the size of coils need to be minimized, voltage transfer gain to be maximized, power delivered to the load (PDL) to be maximized and to obtain larger bandwidth of operation. High efficiency is especially important for the wireless power transfer in biomedical applications. High PTE is required to satisfy the tissue safety requirements and electromagnetic compatibility between the powering link and other nearby communication devices [9,10].
Over the past decades, several methods have been proposed for the design and geometrical optimization of coupled coils [4,10,11,12,13]. In References [10,12], an iterative design procedure was employed to optimize the geometries of different pairs of printed spiral coils (PSCs) and multi-coil inductive links with the aim of improving PTE. In Reference [4], with the guide of the iterative design procedure [11], different wire-wound multi-coil inductive power transmission links were designed for industrial applications to provide sufficient PDL while maintaining a high PTE. RamRakhyani et al. designed a 4-coil power transmission link for biomedical applications based on a model of a multilayer helical coil that uses Litz wire [13]. Based on the analysis on the effect of design parameters on power transfer efficiency, the design constraints and a heuristic search method, they determined the number of layers and turns per layer to obtain an efficient power transfer system.
All the above-mentioned design methods used a search algorithm, which is based on the cyclic coordinate optimization method [14]. In this method, the coordinate axes are used as the search directions. Along each search direction, the corresponding variable is the only variable that is changed and the objective function is maximized; the rest of the parameters remain fixed at their previous values. However, this iteration search method may get stuck in a local minimum if the level curves of a function are not smooth. Moreover, as the number of parameters to be optimized increases, the size of the search space increases exponentially, requiring excessive simulation making the problem intractable. These facts serve as a motivation to pursue a systematic approach for optimal design of the WPT system. To deal with this problem, Genetic algorithm (GA) has been already employed for optimization of the WPT system [15,16]. In Reference [15], GA was used to first determine the value of equivalent circuit parameters of the WPT system to overcome the frequency splitting phenomenon and then to extract the optimal values of two added capacitors at the source and the load. However, the GA was not used in determining the coil parameters. In Reference [16], the GA was used to determine the parameters of the printed spiral coils (PSCs) to maximize the power transmission efficiency in the dual band power and data telemetry system. A PTE of 69.8% was reported. To define the design constraints, a minimum value was considered for the conductor space and no constraint was defined for the number of turns (n). This may result in an infeasible solution and inaccuracy of the model. It should be noted that the accuracy of the model degrades with n ≤ 2 [12]. The authors did not report the number of turns and the GA was used to determine the values of the conductor space and thickness. Moreover, the simulation and measurement values for L, R and C of the designed coils were not reported. Hence, it is not possible to determine how much the measurement values agree with the values obtained by the GA. In addition, self-resonance frequency (SRF), which is a key factor in determining the power carrier frequency, was not considered in the design process.
To design an optimal WPT for a specific application, there are a number of parameters (e.g., the number of turns, thickness, the line width and the spacing between the metal traces of the inductor, load and operating frequency) from which the optimal values should be chosen so that certain objective functions (e.g., PTE, PDL, voltage gain, bandwidth of operation) are maximized while satisfying all the required design constraints (e.g., coil size, SRF, fabrication limitation, tissue safety requirements and electromagnetic compatibility). Moreover, the nonlinearity of the constraints, coupled with the combinatorial possibilities for the WPT design, make it difficult to solve the optimization problem by means of empirical cyclic coordinate optimization or traditional optimization methods [17].
To overcome the aforementioned limitations of the design method, in the current study, we use the GA for the optimal design of WPT links. Although, the GA can provide an optimal solution with respect to the defined figure-of-merit, the solution may not be a practical solution. To provide an optimal practical solution, a suitable range of designed parameters should be defined. In this paper, the effects of different ranges of the design parameters on the solutions optimized by the GA are investigated. For this purpose, different inductive WPTs with a pair of printed spiral coils are designed and simulated using an electromagnetic solver (EM solver) (i.e., high-frequency structure simulator (HFSS)) and the practical optimal solutions are fabricated on a printed circuit board.
Series-resonant and shunt-resonant structures are two common circuit models which are widely used in WPT. In this paper, the advantages and shortcomings of the two models, which are optimized by GA, are presented. The effects of different parameters including the load and source resistance variations, coupling distance and operation frequency variations, for both models are presented and compared. Moreover, the effects of the load resistance and coupling distance variations on the reflected impedance and the load resistance on the input power for both resonant coupling structures are investigated. These investigations help the designer to select a suitable structure for a give specific application.

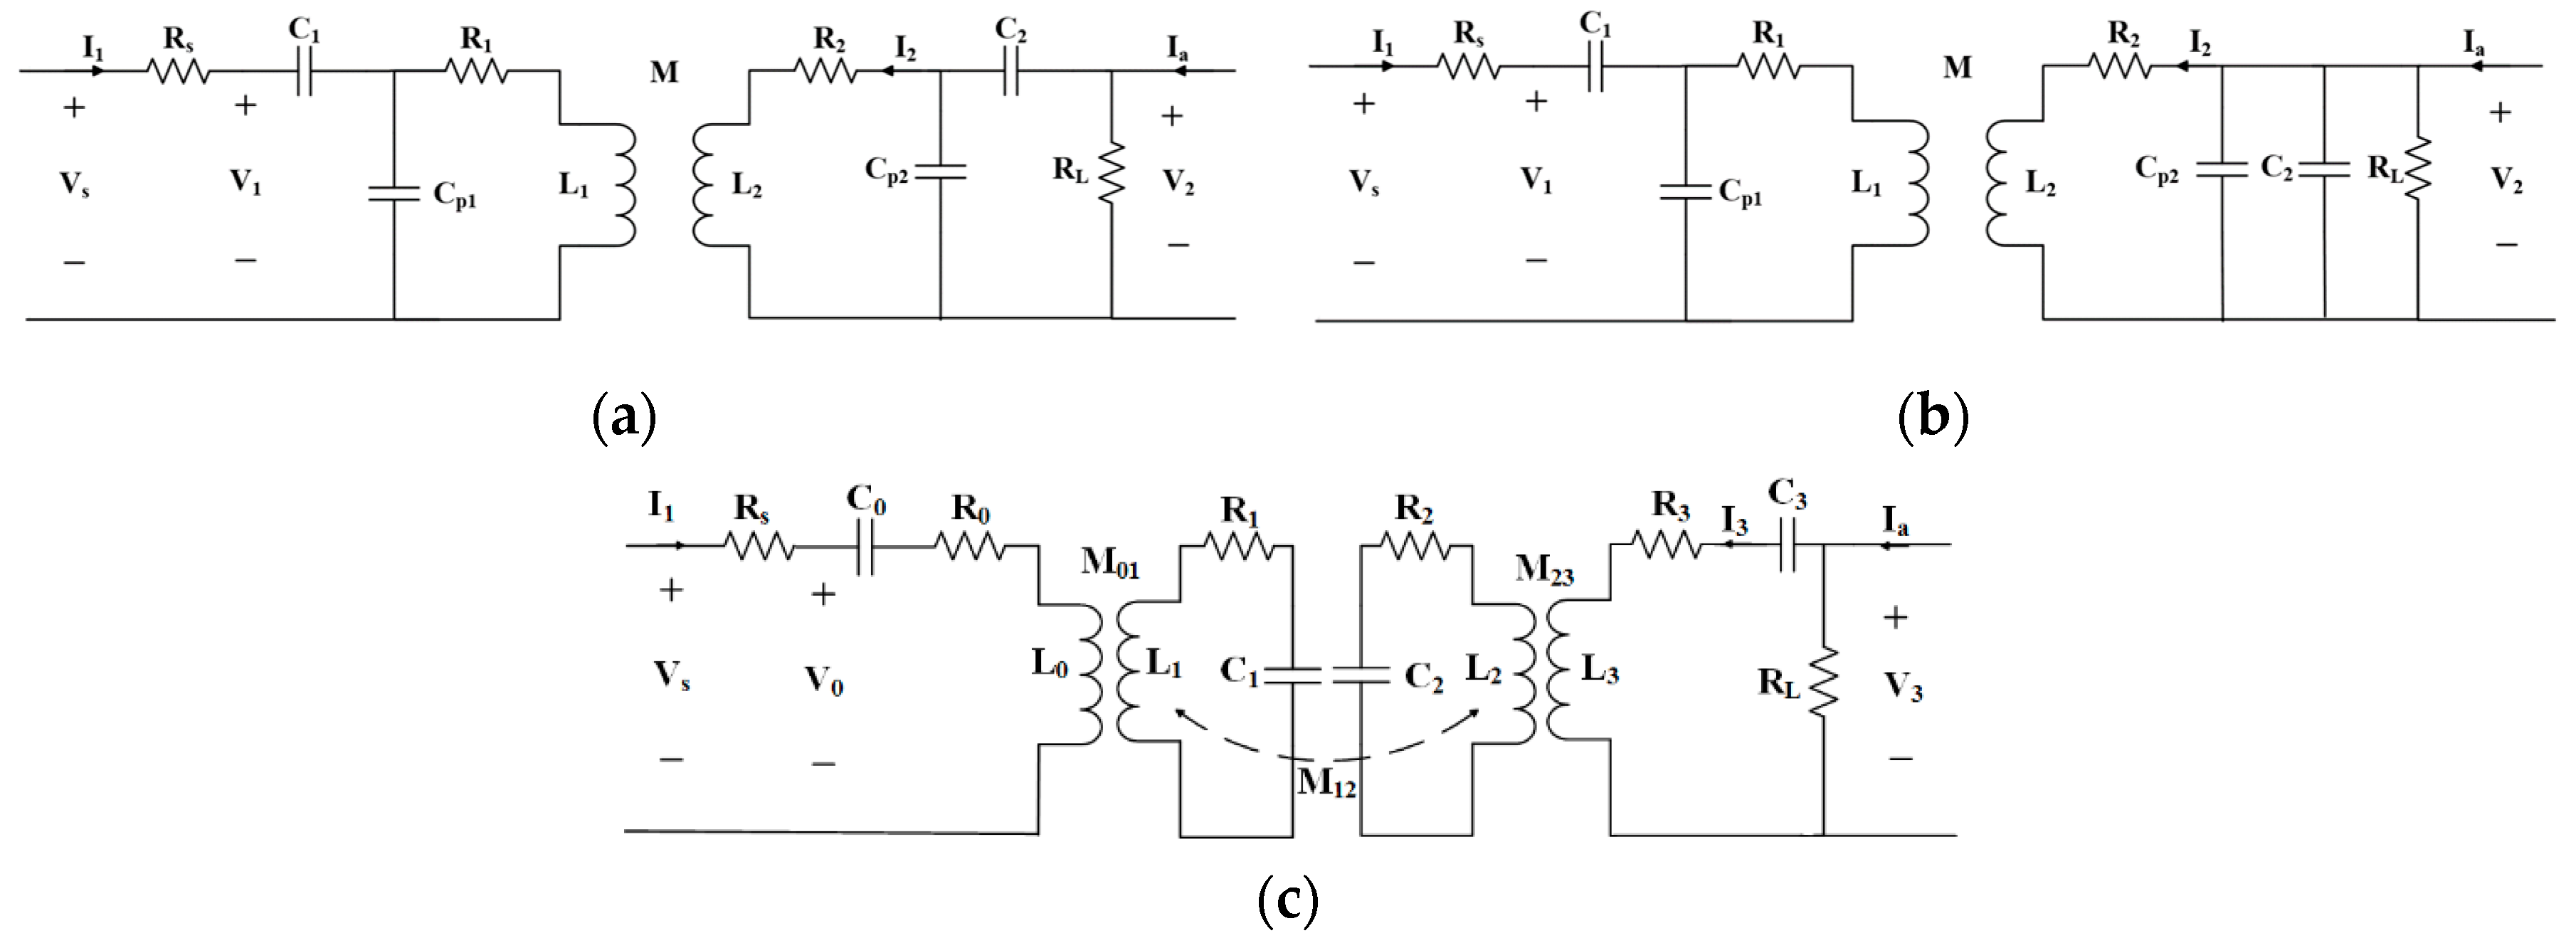
2. Inductive Link Model

An equivalent circuit of a WPT using the 2-coil inductive link with parallel and series connection of load is shown in Figure 1. Where L 1 and L 2 are the self-inductance of the Tx and the Rx coils, respectively. Capacitors C 1 and C 2 are also added to form a pair of resonant LC-tank circuits with L 1 and L 2 , respectively, at the power carrier frequency. Lumped elements R 1 , R 2 , C p 1 and C p 2 represent the distributed parasitic resistance and capacitance of the coils. A power source, V S , drives the Tx coil at the carrier frequency, while R s is the internal resistance of the source. The Rx coil is loaded by R L . For the sake of simplicity, the parasitic capacitances C p 1 and C p 2 are neglected in the following analysis. Then Kirchhoff’s voltage law (KVL) can be applied to determine the currents in each resonant circuit as follows:
I 1 R s + I 1 1 C 1 ω j + I 1 L 1 ω j + I 1 R 1 + j ω M I 2 = V S
I 2 R 2 + I 2 1 C 2 ω j + I 2 L 2 ω j + j ω M I 1 = V L
I 1 1 C 1 ω j + I 1 L 1 ω j + I 1 R 1 + j ω M I 2 = V 1 ,
where M = k . L 1 L 2 ( 0 k 1 ) is the mutual inductance between the Tx and Rx coil. From (1)–(3), we have
I 1 = V s ( R S + 1 C 1 ω j + L 1 ω j + R 1 ) + ( ω M ) 2 ( R L + R 2 + 1 C 2 ω j + L 2 ω j )
I 2 = ( j ω M R L + R 2 + j ω L 2 + 1 j ω C 2 ) × ( V s ( R S + 1 C 1 ω j + L 1 ω j + R 1 ) + ( ω M ) 2 ( R L + R 2 + 1 C 2 ω j + L 2 ω j ) )
To calculate the power transmission efficiency ( η s ) for series connection of the load using the equivalent circuit model at resonance, the following definitions are presented:
Q 1 = ω L 1 ( R 1 + R S ) ,   Q 2 = ω L 2 R 2 ,   ω = 1 L C ,
where Q 1 is loaded quality factor of the Tx coil and Q 2 is unloaded quality factor of the Rx coil. The η s can be expressed as:
η s = P L P S = K 2 Q 1 Q 2 ( R L R 2 + 1 + K 2 Q 1 Q 2 ) × R L ( R L + R 2 ) ,
where P S is the active input power delivered from the source and P L is the active power consumed by the load (i.e., P L = R L | I 2 | 2 ). It can be shown that P D L = P L = η s P S . Note that at the carrier frequency, LC tanks operate at resonance frequency. Therefore, self-inductances and capacitors of coils act as short circuits and only parasite resistances remain. The value of the parasite capacitances is small and is neglected [4,10,11,13,16,18,19]. The power transmission efficiency ( η p ) for parallel connection of the load is expressed as [4]:
η p = k 2 Q 1 Q 2 L 1 + k 2 Q 1 Q 2 L × Q 2 L Q L ,
where Q 2 L = Q 2 Q L / ( Q 2 + Q L ) and Q L = R L / ω L 2 . Note that Equations (7) and (8) can be extended to apply for multi-coil WPTs. For example, Equation (8) in multi-coil WPTs can be written as [4]:
η p multi - coil = i = 1 m 1 η p i , i + 1 Q m L Q L ,
where m is the number of coils in multi-coil WPT, Q m L = Q m Q L / ( Q m + Q L ) and η p i , i + 1 is the PTE from ith coil to (i + 1)th coil and expressed as [4]:
η p i , i + 1 = R r e f i , i + 1 R i + R r e f i , i + 1 = k i , i + 1 2 Q i Q ( i + 1 ) L 1 + k i , i + 1 2 Q i Q ( i + 1 ) L .
R r e f i , i + 1 , k i , i + 1 and Q ( i + 1 ) L are reflected impedance, coupling coefficient and loaded quality factor between the ith coil and (i + 1)th coil, respectively. The quality factor and parasitic resistance of the ith coil are Q i and R i . The reflected impedance, which is the transformed load impedance by the inductive link from the (i + 1)th coil to the ith coil is modeled as follows [4]:
R r e f i , i + 1 = k i , i + 1 2 ω L i Q ( i + 1 ) L i = 1 , 2 , ,   m 1 .
The PSC geometrical parameters that affect the circuit parameters and, consequently, the figures of merit are the line width ( w ) , the spacing between the metal traces of the inductor ( s ) , line thickness ( t c ) , inner diameter ( d i ) , outer diameter ( d o ) and the number of turns ( n ) (Figure 2). The relationship between the circuit parameters and the coil geometries is presented in Appendix A.

3. Design Procedure

This section presents steps of the WPT system using GA. GAs are direct, parallel, probabilistic methods for global search and optimization. GAs are initiated with a randomly generated population of chromosomes (or individuals). Then, the fitness-based selection principle is applied to select the best individuals (solutions) in a population. Selected individuals are chosen for reproduction (crossover), with an appropriate mutation factor to randomly modify the genes of an individual, and, consequently, develop the new population. This process is iterated until certain stopping criteria are satisfied. In the current study, the MATLAB GA toolbox is used to find the optimal solution. The steps for implementing GA towards the optimal design of a wireless power transmission link can be summarized as follows:
  • Define the Fitness Function: The fitness function, an objective function, which evaluates the quality of the chromosome as a solution to a particular problem, will be optimized. For the design of a WPT link, the PTE, voltage gain, PDL or combination of these figure of merits can be considered as the fitness function in GA.
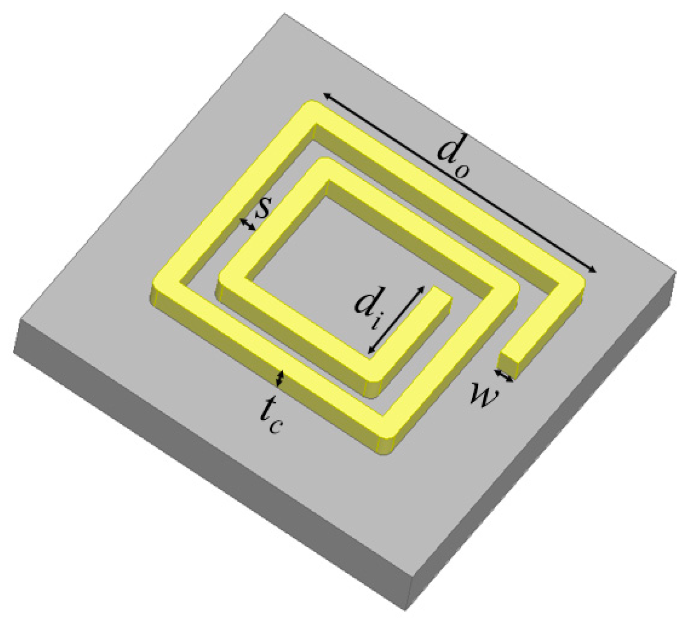
  • Define Design Parameters: In the next step, the design parameters (i.e., the geometrical parameters that their values are determined by the proposed algorithm) and constants are defined according to the application and coil types. For example, the parameters n , t c , w , s , R L and operating frequency ( f ) can be considered as the design parameters of the PSC.
  • Define Constraints: To obtain a feasible solution for the fitness function, we should take into account the major design constraints imposed by regulations, application and the PSC fabrication technology. For this purpose, it is necessary to select an acceptable range for the design parameters. The lower and upper bounds of the variables should be selected such that the implementation of the PSC can be realistically achieved and an acceptable HFSS simulation is obtained for verifying the values suggested by theoretical calculations. To achieve the maximum magnetic field strength, the outer diameter of the Tx coil ( d o 1 ) should satisfy the constraint d o 1 d · 2 2 [11]. Increasing the size of the receiver coil enhances the PTE, however, there is a limitation on the coil size in IMDs. Another important constraint is the constraint on the SRF, which is a key factor in determining the power carrier frequency. Reducing the SRF limits the power carrier frequency. The inductance of the coil and its parasite capacitance determine the SRF ( f S R F = ( 2 π L C p ) 1 ).
  • Generate an Initial Random Population of Chromosomes: Before generating the population, the type of encoding should be defined. In the current study, the real encoding was used to encode the chromosomes.
  • Calculate the Fitness of Each Chromosome: The fitness score of each chromosome is calculated by the fitness function and then converted to a value within a range that is suitable for the selection function by the scaling function.
  • Selection: The selection function chooses chromosomes for recombination on the basis of fitness. Those with higher fitness should have a greater chance of selection than those with lower fitness.
  • Reproduction: In this step, a new population with new chromosomes is created from the above selected individuals by using the crossover (recombination) and mutation operations.
  • Evolution: After recombination, the resultant chromosomes are passed into the successor population. The processes of selection and recombination are then iterated until a complete successor population is produced. At that point, the successor population becomes a new source population (i.e., the next generation).
  • Repeat from step 5 until the appropriate stopping criteria are met, for example, an upper limit on the number of generations is reached.

4. Design Examples

In this section, we used the method presented in Section 3 to design different sets of 2-coil and multi-coil inductive links for the WPT (Figure 1). Both parallel and series connections of load resistance were considered and the effects of constraint on feasible optimal solution were investigated. Results of the HFSS simulation and experiment are presented in the next section. Moreover, the results of the multi-coil design were presented. In this case the number of resonators was also considered as the design parameter.
Table 1 summarizes the design parameters and defines the constraints for each WPT system. Equations (7) and (8) were considered as the fitness function for the optimal design of the inductive link system with the series and parallel connections of the load, respectively. One important factor in designing a WPT system is defining a set of realistic design constraints imposed by conditions, application and PSC fabrication technology to derive a feasible solution. To evaluate the effects of the design constraints on deriving a feasible solution, different constraints were considered. For the first WPT system, the optimal solution was obtained for a given fixed conductor thickness, t c = 35 μm, while for the second and third ones, a range of conductor thicknesses was considered for determining the optimal solution. Moreover, two WPT designs with parallel connection of load resistance were considered (Table 1): one with no constraint on the Rx coil parasitic resistance (i.e., R 2 ) (WPT4) and another with a constraint (WPT5).
Table 2 summarizes the results of the inductive link design using the proposed design procedure in Section 2. The results show that the PTEs of about 83% and 95% were obtained using the series and parallel connections of the load resistance, respectively, while the defined constraints on the designed parameters were satisfied. It is observed that the PTE achieved by the WPT4 is higher than that obtained by the WPT5. The PTEs achieved by the WPT4 and WPT5 are 98% and 91%, respectively. This is because no constraint was considered on the Rx coil parasitic resistance to determine the optimal solution for the WPT4, while a maximum range of 0.2 Ω was imposed for the WPT5. The obtained Rx coil parasitic resistance values were 0.002 Ω and 0.2 Ω for the WPT4 and WPT5 designs, respectively. It should be noted that a low Rx value (i.e., 0.002 Ω) provides a high-quality factor (i.e., 1899.9) for WPT4 (see (6)). Moreover, a low Rx value imposes a fabrication limitation for PSC implementation. By comparing (7) and (8), it can be seen that the Rx coil parasitic resistance has a more severe effect on the inductive link with a parallel connection than that with series connection. While the SRFs obtained for the Rx and Tx coils used in the WPTs with series connection of the load were about 100 MHz, the SRFs obtained for the Rx coil used in the WPT4 and WPT5 were 3.27 GHz and 948 MHz, respectively. The lower constraint considered for SRF was 100 MHz.
It can be seen in Equations (6) and (8) that the PTE for the inductive links with parallel connection of the load decreases with increasing the value of L 2 . As a result, the optimization algorithm selected the design parameters such that a low value of L 2 was obtained, which in effect increased the SRF. In contrast, the PTE increases with increasing the value of L 2 for the inductive links with series connection of the load.
Two solutions (i.e., WPT6 and WPT7) were considered for the multi-coil design with series connections of the load resistance. In this case, the number of coils was also considered as the design parameter. For multi-coil inductive link optimization, the fitness function (6) was selected. The constraints considered for the WPT6 design were the same as the 2-coil configuration (i.e., WPT1). The multi-coil inductive link model presented in Reference [4] was used to design the link using the proposed optimization algorithm. In the multi-coil inductive link, the driver and load coils were added to the 2-coil inductive link in a co-planar and co-centric fashion. The driver coil ( L 0 ) was connected to the source placed in the middle of L 1 . On the internal side, the load coil ( L 3 ) was connected to the load and placed in the middle of L 2 (Figure 1). Since the driver and load coils should be smaller than the Tx and Rx coils, the inner diameter of Tx and Rx coils were constrained to be greater than the outer diameter of the driver and load coils ( d o 0 < d i 1 and d o 3 < d i 2 ). Also, due to fabrication limitations, all parasite resistances were constrained and set to be R 0.5 Ω. The results of the optimization show that the WPT with 3 coils is the optimal solution for the given constraints. The PTE obtained was 86.32%. The same constraints as the WPT1, except the inner and outer diameters of the Tx and deriver coils, which were set to be 1 d i 1 60 , 1 d o 1 60 , 1 d i 0 60 , 1 d i o 60 (WPT7), were considered for another multi-coil design. In this case, the 4-coil configuration was obtained as the optimal solution with a PTE of 87.46%. The SRFs obtained were more than 100 MHz for both the 3-coil and 4-coil structures.

5. Simulation Results

To evaluate the model-based theoretical results obtained by the proposed optimization method, the designed wireless power links were simulated by HFSS. The inductive links were exactly simulated based on the values listed in Table 2.
Table 3 summarizes the results. It is observed that the theoretical and HFSS simulation results for the WPT1 and WPT2 systems were very close. The PTEs are 82% and 83% for the WPT1 and WPT2, respectively. The HFSS simulation results show that the Rx coil of the WPT3 behaves as a capacitor. Other than the constraint on the metal thickness, all defined constraints for the WPT2 and WPT3 were similar. Ranges 35 t C 100 and 1 t C 50 were considered for the optimal design of the WPT2 and WPT3, respectively. The optimal thicknesses obtained for the Rx coils of WPT2 and WPT3 were 35 μm and 18 μm, respectively. The results of HFSS simulation show that the obtained optimal solution for the WPT3 was not a feasible solution because the Rx coil of the WPT3 behaved as a capacitor for the thickness of less than 35 µm. The PTEs obtained for WPT6 and WPT7 were 83.22% and 85.99%, respectively. The performance obtained using a 3-coil configuration was almost the same as that obtained by the 2-coil configurations of the WPT1 and WPT2. However, the 4-coil link provided higher performance than the WPT1 and WPT2. The PTE obtained by HFSS simulation of the 4-coil link was 85.99%.

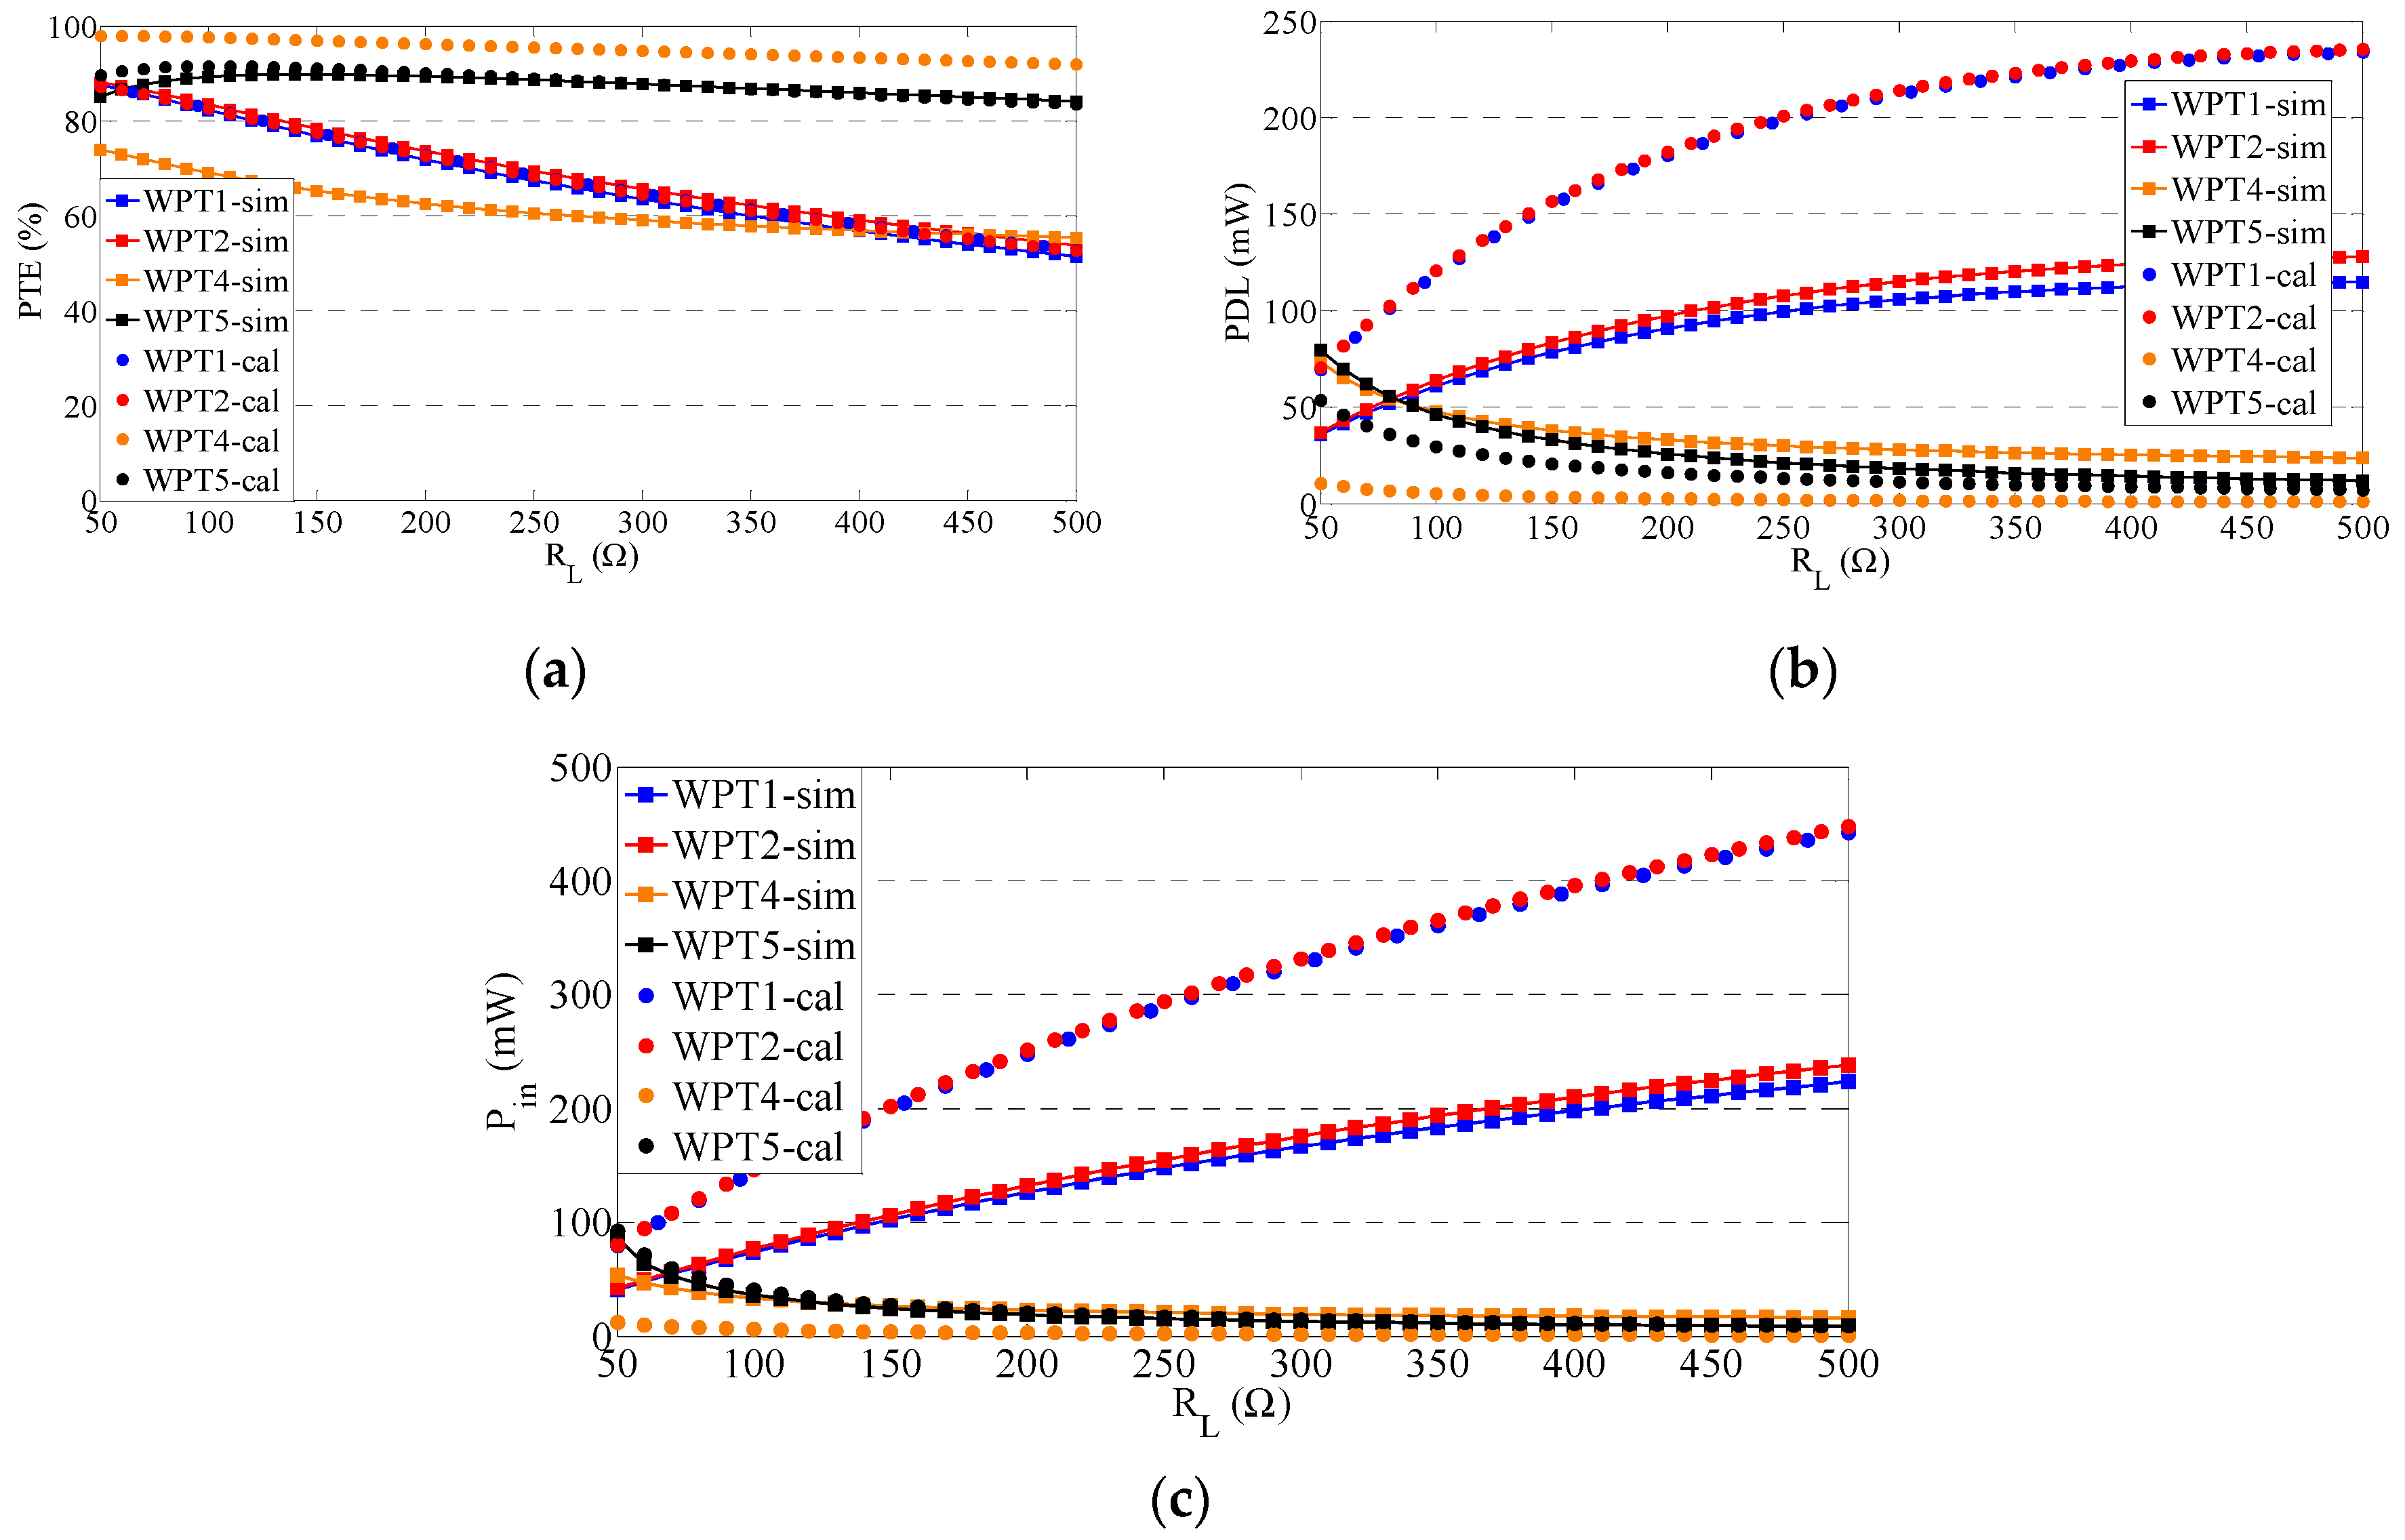
5.1. Effects of Load Resistance

Figure 3a illustrates the PTE versus load resistance for different designed WPTs. It is observed that the HFSS simulation results are in very good agreement with the theoretical results for the WPT1, WPT2 and WPT5; however, a significant difference between the theoretical and simulation results is observed for the WPT4 design, which is not a feasible design. The PTE obtained by the WPT5 is higher than that obtained by the inductive links with series connection of load (WPT1 and WPT2). However, it should be noted that the PDL obtained by the inductive link with parallel connection of load was lower than that obtained by the series connection (Figure 3a). Moreover, the PDL versus the load resistance for different designed inductive links is shown in Figure 3b. It is observed that the PDL decreases with increasing the load resistance for the inductive link with parallel connection of load, while the PDL increases and becomes saturated with increasing the load for the series connection. This is because R 2 and R L are parallel in the inductive links with parallel connections of load at the resonance frequency. It can be seen from Figure 3c that input power decreases with increasing R L in the inductive link with parallel connection of load. The results of these analyses demonstrate that there is a major difference between the behavior of the inductive links with parallel and series connections of load during load variations.
Note that C 2 was computed such that the second circuit resonated for each load resistance. The value of C 2 was computed from f = ( 2 π L 2 C 2 ) 1 for the inductive link with series connection of load and from f = ( 2 π 1 C 2 L 2 1 C 2 2 R L 2 ) 1 for the link with parallel connection. It is worthy to note that the resonant frequency does not depend on R L for the link with series connection, while it is related to R L for the parallel connection.

5.2. Effects of Source Resistance

The effects of source resistance, R s , in the optimization of the inductive link was investigated in References [4,10,13]. This section analyzes the effects of R s variations on the WPT performance with series and parallel connections of load (Figure 4). Although the WPT with parallel connection of load provides a higher PTE than the WPT with series connection, however, the PDL of the WPT with parallel connection is lower than that of the series connection.

5.3. Effects on Reflected Impedance

The reflected impedance limits the available power from the source and drastically reduces the PDL. Figure 5 shows the effects of coils distance and load resistance on the reflected resistance. All inductive links were designed for a 100 Ω load resistance and 10 mm distance between the coils. The reflected resistances obtained at the operating values of the parameters are 5.5 Ω and 22.5 Ω for the inductive links with series and parallel connections of the load, respectively. Note that the reflected impedance only has real values at the resonant frequencies. It can be seen that the reflected resistance obtained for the inductive links with parallel connection of load is higher than that with a series connection for different coupling distances and load resistances. Interestingly, it is observed that the reflected impedance is not very sensitive to the load resistance variations in the inductive link with series connection of the load. It is worthy to note that only the reflected impedance for the series connection of load has real value. This indicates the resonance operation of the circuit even with variation of the load resistance.

5.4. Effects of Distance

Figure 6 illustrates the efficiency variations with respect to the coils relative distance. It is observed that the PTE is almost 92% for all WPT systems with 5 mm distances. The efficiency decreases with increasing the distance. However, the decreasing rate of efficiency for WPTs with series connection of load is greater than that with parallel connection of load. The PTE decreased from 92.2% to 40.9% for WPT1 (55.7% decrease), from 92.4% to 43.8% for WPT2 (52.6% decrease) and from 92.9% to 70.7% for WPT5 (23.9% decrease) when the coils distance increased from 5 mm to 20 mm.

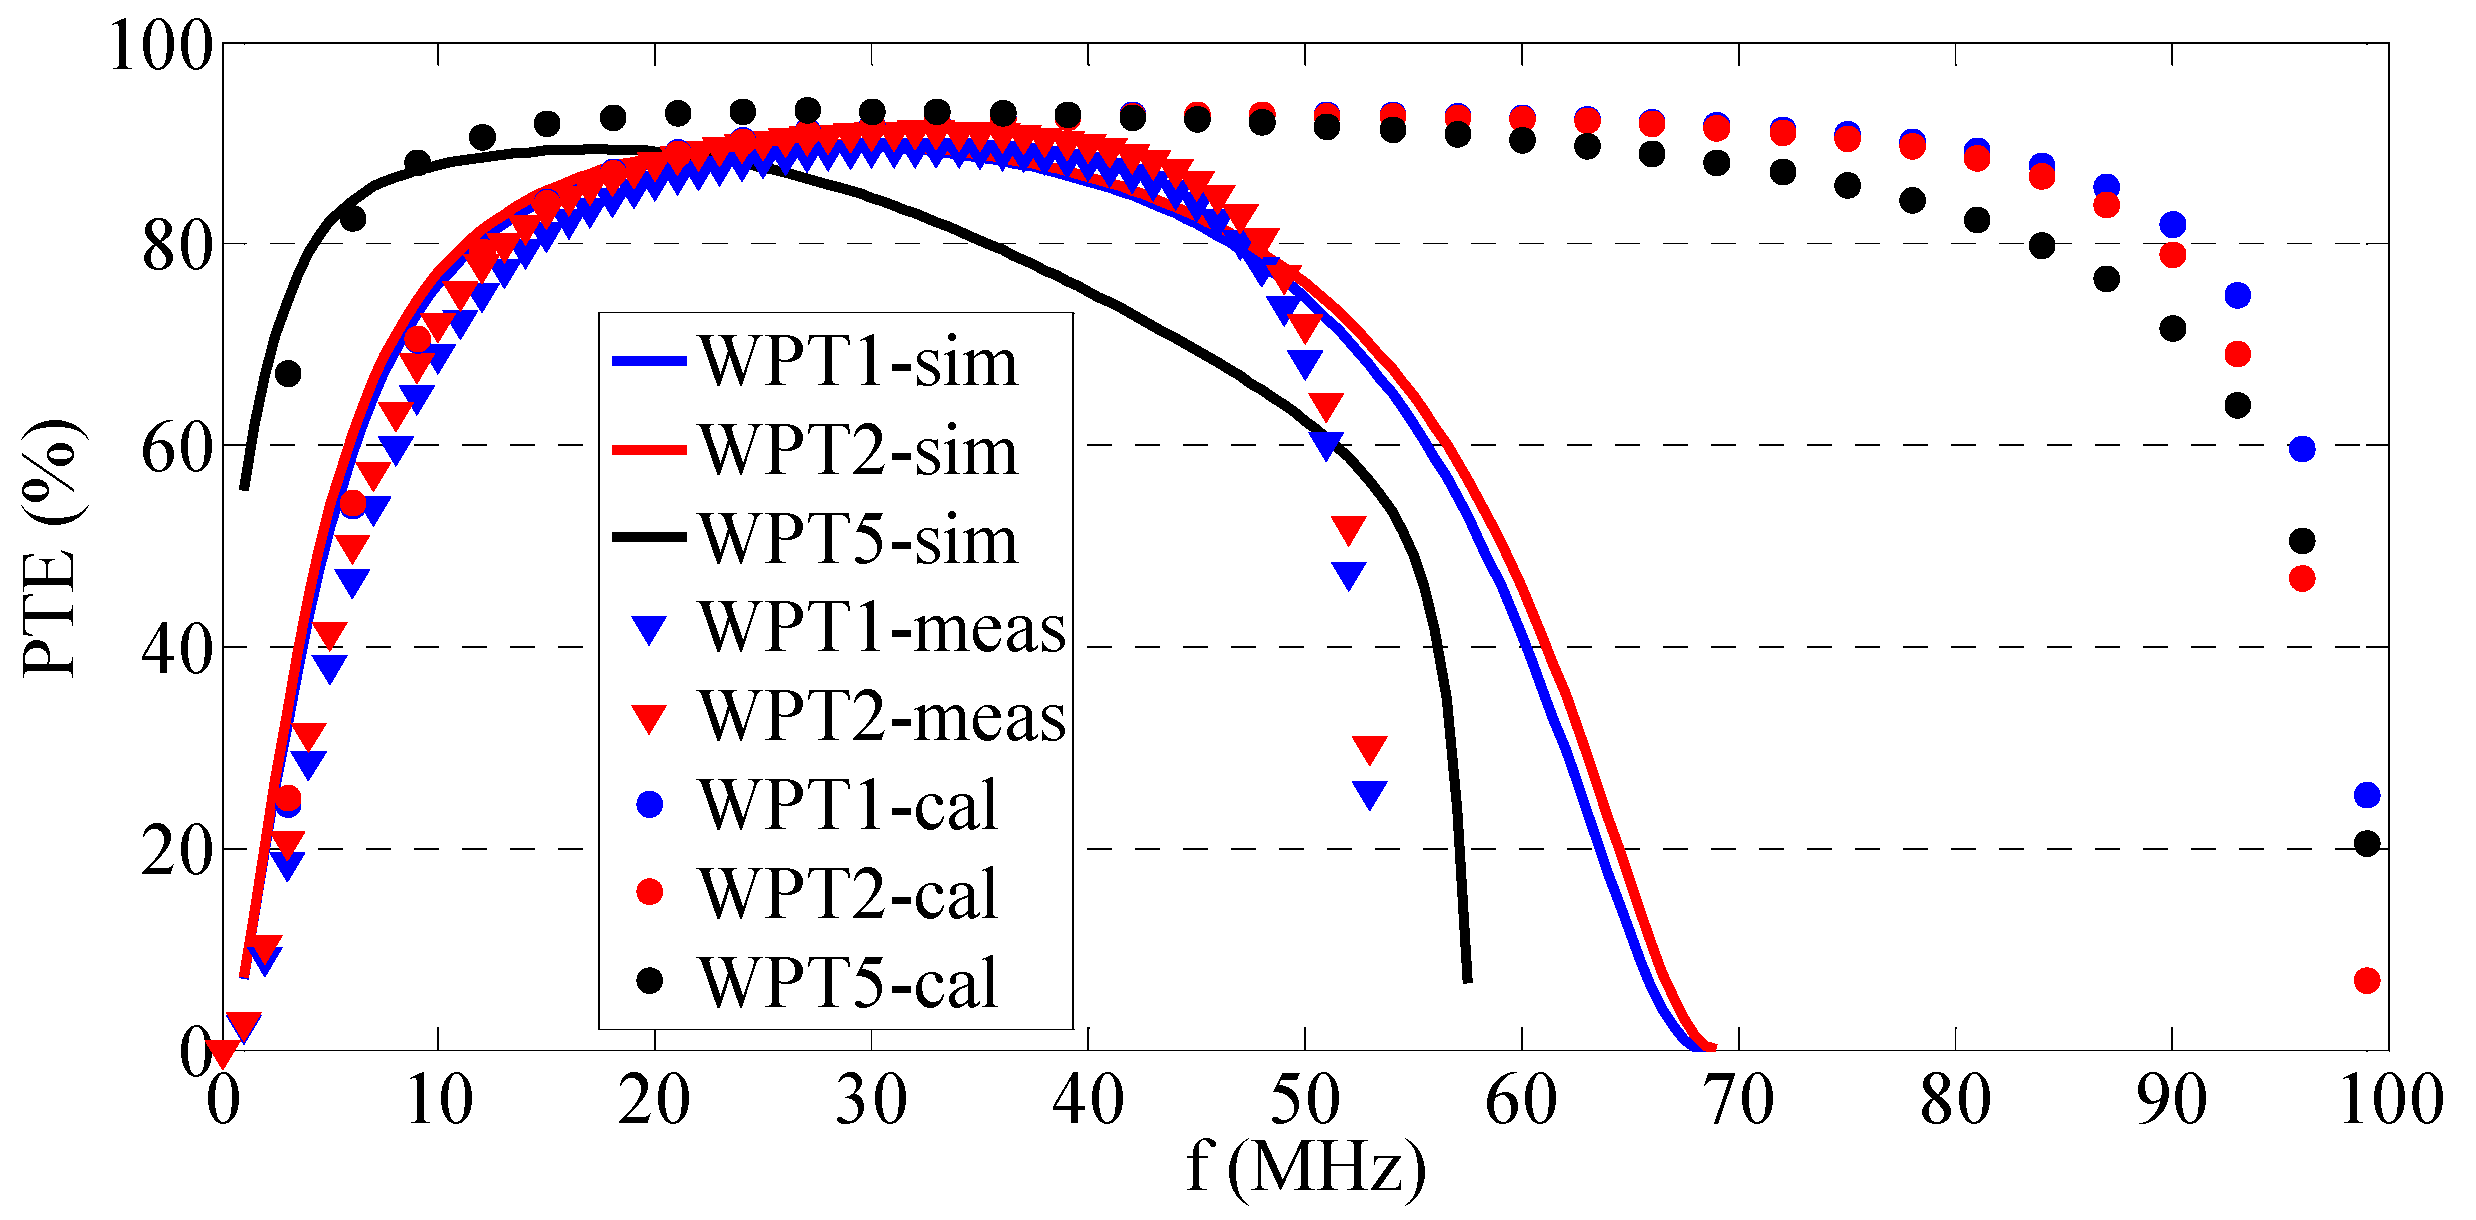
6. Measurement Results

This section presents the experimental results of the WPT1 and WPT2 designed inductive links. Although the obtained PTE of WPT7 was higher than that of WPT1 and WPT2, we chose to fabricate a 2-coil link, as the 4-coil link imposes more complexity, cost and size. The selected inductive links were exactly fabricated based on the values listed in Table 2. The Tx and Rx coils were fabricated on FR4 and were mechanically supported by a non-conducting Plexiglas frame. The S-parameters of each coupled PSC pair were measured using a network analyzer (Agilent E5071C) (Figure 7). The PTE was measured using the conventional method proposed in Reference [10]. In this method, the S-parameters are measured using a network analyzer connected directly to the Tx and Rx coils. The S-parameters were converted to Z-parameters to calculate the self-inductance, parasitic resistance and the coupling coefficient of the inductive link as follows:
L 1 = I m ( Z 11 ) ω ,   L 2 = I m ( Z 22 ) ω
R 1 = R e ( Z 11 ) ,   R 2 = R e ( Z 22 )
k = I m ( Z 21 ) I m ( Z 12 ) I m ( Z 11 ) I m ( Z 22 ) .
The quality factors were then calculated from (6) and the PTE from (7). To calculate the parasitic capacitance, the inductance-frequency response was extracted using the network analyzer for each coil. Due to the parasitic capacitance ( C p ) , the inductor has a maximum impedance point at the SRF. The reactance in the low frequency region below the SRF is inductive. After the resonant frequency, the capacitive reactance is dominant because of the parasitic capacitance.
The measurements, summarized in Table 4, show a good agreement between the calculation (Table 2), simulation (Table 3) and measurement results. The measured values of the parasitic resistance and capacitance are a little more than HFSS results but it has no considerable effect on the calculated PTE. The PTE values of 80.32% and 82.72% were achieved for the WPT1 and WPT2, respectively. To measure the PDL, the Keysight 33522B waveform generator (Keysight Technologies, Santa Rosa, CA, USA) was connected to the Tx coil via 0.5 Ω resistance as R s , while Rx was connected to 100 Ω resistance as the load (see Figure 1). The Keysight MSOX3054 oscilloscope (Keysight Technologies, Santa Rosa, CA, USA) was used to measure the load voltage. The former has a PDL of 155.24 mW for V s = 11.8   V and the latter can deliver 173.89 mW to the load.
Figure 6 and Figure 8 show the calculated, simulated and measured PTEs versus the distance and frequency, respectively. The results show a close agreement between the simulated and measured PTEs. The results of simulation and calculation show that inductive links with parallel connection of load achieve better efficiency than that with series connection during changing the coils distance. However, the performances of both series and parallel connection comparable with respect to the frequency changes. Note that in Figure 8, the capacitors of LC tanks (i.e., C1 and C2) were tuned for each frequency to operate in the resonance mode.

7. Comparison

Different inductive links with different types of coil arrangements (i.e., multicoil structure), different types of coil (i.e., wire-wound coil, printed spiral coil) and with different operating frequency, relative coils distance, coil diameter, R s and R L were designed and implemented. Table 5 summarizes the results of the comparison between the WPT designed by the proposed optimization method and previously published inductive links. All the inductive links mentioned in Table 5 were designed for biomedical applications except for [4,18]. The WPT in Reference [4] was designed for industrial applications such as wireless charging. 3-coil array configuration designed for animal research and charging systems. It can be seen that the best result reported in the previously published works for biomedical application is 82% in a 4-coil configuration, with external and implanted coils that have outer diameters of 64 mm and 22 mm and a separation distance of 2 cm at a carrier frequency of 700 kHz [14]. However, the system is based on a multilayer helical coil that uses the Litz wire with a 2.5 mm implanted coil thickness and 5.5 mm transmitter thickness. In a 2-printed spiral coil configuration, a PTE of 78% and 72% for a separation distance of 1 cm was reported in References [11,12], respectively. However, the source resistance had not been taken into account in the design equations. It should be noted that the source resistance has a significant effect on the link performance. The best result reported in a previously published system is 83%, which belongs to a 3-coil array configuration with a Tx coil of 300 × 300 mm array size and Rx coil of 54 mm outer diameter for the separation distance below 1 cm at a carrier frequency of 200 kHz [18]. The 2-coil configuration design proposed in this paper presents a PTE of 83% for separation distance of 1 cm with outer diameters of 40 mm and 20 mm for the transmitter and implanted coils, respectively. The measurement results of the current study show that a maximum PDL of 173.89 mW with V s = 11.8   V and R s = 0.5 Ω was obtained. For a 2-printed spiral coil configuration, a maximum PTE of 15% and PDL of 170 mW with V s = 1   V and R s = 0.1 Ω has been already reported [12], however, an input power of 1133 mW is required to deliver 170 mW to the load. The results of the previous works (Table 5) show that the power carrier frequency, diameter of coils, coils distance and coil type have significant effect on the efficiency of WPT. Increasing the power carrier frequency and the diameter of coils can increase the efficiency but increasing the distance between coils reduce the efficiency. Moreover, increasing the number of coils can improve the efficiency.

8. Conclusions

A systematic optimization approach based on the genetic algorithm was proposed for designing inductive links. The method was applied to optimize PSC geometries in order to achieve the highest PTE in a 2-coil configuration with series and parallel connections of load for biomedical applications. However, other figure of merits (e.g., PDL, voltage gain and bandwidth) can be considered and included in the design of an efficient WPT system. The results show that compared with the traditional inductively coupled 2-coil systems or even 3- or 4-coil inductive links, the proposed approach significantly improves the power transfer efficiency. The experimental results were in good agreement with the theoretical and simulation results. The results demonstrated that the WPT with parallel connection of load could achieve a higher PTE than that with series connection. In contrast, the PDL of series connection was higher than that of parallel connection. Moreover, the reflected impedance of the inductive link with parallel connection of load is very sensitive to the load and distance variations (Figure 5). The results of this work show that the 4-coil WPT can be optimized to achieve higher power transfer efficiency than the 2-coil configurations. However, such performance comes at the cost of additional inductors and capacitors in the system, which is not suitable for implantable applications. In general, the 2-coil systems are suitable for short-range applications and their energy efficiencies drop rapidly with mid-range transmission distances [12]. Moreover, the WPT with 2-coil configuration provides a lower reflected resistance than the 3- or 4-coil configurations [12]. The proposed prototype provides a larger bandwidth of operation compared with the results reported in References [10,12]. Furthermore, the efficiency of the prototypes is robust with respect to the variations in R s and R L . Another positive point of the proposed design is the stability of PTE against shifting in the resonant frequency (Figure 8). The results show that the robustness of the WPT with parallel connection of load is higher than that with series connection. Interestingly, it is observed that the load resistance variations have more effect on the reflected resistance in the inductive link with parallel connection of load than that with series connection. An important challenge in the design of an inductive link for the implantable device is the load variations, which prevent the inductive link with parallel connection of load from operating at resonance and cause the PA to operate under non-optimal conditions. Nevertheless, it should be noted that in inductive links with series connection, the resonant frequency does not depend on the load and the reflected impedance only has real value during load variations.

Author Contributions

Conceptualization and methodology, A.B. and A.E.; implementation of the work, A.B.; Supervision and administration of the project, A.E.; writing—original draft preparation, A.B.; review and editing, A.E.; review and editing, A.A.; funding acquisition, A.E. All authors have read and agreed to the published version of the manuscript.

Funding

This work was supported by the Iran Neural Technology Research Centre, Tehran, Iran under Grant 48.M.111194.

Conflicts of Interest

The authors declare no conflict of interest.

Appendix A

The self-inductance of PSC can be found from [12]:
L = 1.27 μ 0 μ r n 2 d a v g 2 [ l n ( 2.07 φ ) + 0.18 φ + 0.13 φ 2 ] ,
where μ 0 and μ r are the permeability of space and conductor, respectively, d a v g = ( d o + d i ) / 2 , φ is known as the fill factor and is given by φ = ( d o d i ) / ( d o + d i ) . It is notable that the accuracy of (14) degrades by choosing s / w 3 , φ 0.1 and n 2 .
The parasitic resistance of PSC can be found from [11]
R = R d c t C δ ( 1 e t C δ )
R d c = ρ C l c w t C ,   δ = ρ C π μ f
l c = 4 n d o 4 n w ( 2 n + 1 ) 2 ( s + w ) ,
where R d c is the parasite DC resistance, δ is the skin depth, l c is the length of the conductive trace and ρ C   is resistivity of the conductive material.
The parasitic capacitance of a PSC can be found from [11]:
C P = C p c + C p s = ( α ε r c + β ε r s ) ε 0 t C s l g
l g = 4 ( d o w n ) ( n 1 ) 4 s n ( n + 1 ) ,
where ε r c and ε r s are the relative dielectric constants of the coating and substrate materials, respectively. We chose ( α , β ) = (0.9, 0.1) as in Reference [11]. From insulator characteristic tables, ( ε r c , ε r s ) = (1, 4.4). l g shows the length of the gap.
The mutual inductance, M can be found from [11]:
M = 2 μ α r t r r [ ( 1 α 2 2 ) K ( α ) E ( α ) ]
α = 2 r t r r ( r t + r r ) 2 + d 2 ,
where d is the distance between the Tx and Rx coils, K ( α ) and E ( α ) are the complete elliptic integrals of the first and second kind, respectively and r t and r r are the radius of the Tx and Rx coils, respectively.

References

  1. Bashirullah, R. Wireless implants. IEEE Microw. Mag. 2010, 11, S14–S23. [Google Scholar] [CrossRef]
  2. Fitzpatrick, D. Implantable Electronic Medical Devices, 1st ed.; Elsevier: Amsterdam, The Netherlands, 2014. [Google Scholar]
  3. Hui, S.Y.; Zhong, W.; Lee, C.K. A critical review of recent progress in mid-range wireless power transfer. IEEE Trans. Power Electron. 2014, 29, 4500–4511. [Google Scholar] [CrossRef] [Green Version]
  4. Kiani, M.; Ghovanloo, M. A figure-of-merit for designing high-performance inductive power transmission links. IEEE Trans. Ind. Electron. 2013, 60, 5292–5305. [Google Scholar] [CrossRef] [PubMed]
  5. Moon, S.C.; Moon, G.W. Wireless power transfer system with an asymmetric four-coil resonator for electric vehicle battery chargers. IEEE Trans. Power Electron. 2016, 31, 6844–6854. [Google Scholar] [CrossRef]
  6. Yin, J.; Lin, D.; Parisini, T.; Hui, S.Y. Front-end monitoring of the mutual inductance and load resistance in a series–series compensated wireless power transfer system. IEEE Trans. Power Electron. 2016, 31, 7339–7352. [Google Scholar] [CrossRef]
  7. Iguchi, S.; Yeon, P.; Fuketa, H.; Ishida, K.; Sakurai, T.; Takamiya, M. Wireless power transfer with zero-phase-difference capacitance control. IEEE Trans. Circuits Syst. I Reg. Pap. 2015, 62, 938–947. [Google Scholar] [CrossRef]
  8. Li, Y.; Hu, J.; Chen, F.; Li, Z.; He, Z.; Mai, R. Dual-phase-shift control scheme with current-stress and efficiency optimization for wireless power transfer systems. IEEE Trans. Circuits Syst. I Reg. Pap. 2018, 65, 3110–3121. [Google Scholar] [CrossRef]
  9. IEEE Standard for the Safety Levels with Respect to Human Exposure to Radiofrequency Electromagnetic Fields, 3 KHz–300 GHz; IEEE Std. C95.1-2005 (Revision of IEEE Std. C95.1-1991); IEEE: New York, NY, USA, 2006; pp. 1–238. [CrossRef]
  10. Kiani, M.; Jow, U.; Ghovanloo, M. Design and optimization of a 3-coil inductive link for efficient wireless power transmission. IEEE Trans. Biomed. Circuits Syst. 2011, 5, 579–591. [Google Scholar] [CrossRef] [PubMed] [Green Version]
  11. Jow, U.; Ghovanloo, M. Design and optimization of printed spiral coils for efficient transcutaneous inductive power transmission. IEEE Trans. Biomed. Circuits Syst. 2007, 1, 193–202. [Google Scholar] [CrossRef] [PubMed]
  12. Jow, U.; Ghovanloo, M. Modeling and optimization of printed spiral coils in air, saline, and muscle tissue environments. IEEE Trans. Biomed. Circuits Syst. 2009, 3, 339–347. [Google Scholar] [CrossRef] [Green Version]
  13. RamRakhyani, A.K.; Mirabbasi, S.; Chiao, M. Design and optimization of resonance-based efficient wireless power delivery systems for biomedical implants. IEEE Trans. Biomed. Circuits Syst. 2011, 5, 48–63. [Google Scholar] [CrossRef] [PubMed]
  14. Floudas, C.A.; Pardalos, P.M. Encyclopedia of Optimization, 2nd ed.; Springer: New York, NY, USA, 2001. [Google Scholar]
  15. Han, J.; Kim, Y.D.; Myung, N.H. Efficient performance optimisation of wireless power transmission using genetic algorithm. Electron. Lett. 2014, 50, 462–464. [Google Scholar] [CrossRef]
  16. Wang, G.; Li, X.; Wang, M.; Yuan, H.; Xu, W. Optimization of a dual band wireless power and data telemetry system using genetic algorithm. IEEE Des. Test. 2016, 35, 54–65. [Google Scholar] [CrossRef]
  17. Mc Call, J. Genetic algorithms for modelling and optimization. Comput. Appl. Math. 2005, 184, 205–222. [Google Scholar] [CrossRef]
  18. Mirbozorgi, S.A.; Bahrami, H.R.; Sawan, M.; Gosselin, B. A smart multicoil inductively-coupled array for wireless power transmission. IEEE Trans. Ind. Electron. 2014, 61, 6061–6070. [Google Scholar] [CrossRef]
  19. RamRakhyani, A.K.; Lazzi, G. On the design of efficient multi-coil telemetry system for biomedical implants. IEEE Trans. Biomed. Circuits Syst. 2013, 7, 11–23. [Google Scholar] [CrossRef] [PubMed]
Figure 1. Equivalent circuit of an inductive link with two kinds of load connection: (a) 2-coil link with series connection; (b) 2-coil with parallel connection; (c) 4-coil with series connection.
Energies 13 00383 g001
Figure 2. Physical parameters of a square-shaped printed spiral coil.
Energies 13 00383 g002
Figure 3. Effect of load resistance variations on the power transfer efficiency (a); on the power delivered to the load (b); and on the input power (c). The terms “-cal” and “-sim” refer to the calculation and simulation results, respectively.
Energies 13 00383 g003
Figure 4. Effect of source resistance on the power transfer efficiency (a) and power delivered to the load (b). The terms “-cal” and “-sim” refer to the calculation and simulation results, respectively.
Energies 13 00383 g004
Figure 5. Effect of load resistance (a), (b) and coils relative distance (c) on the reflected impedance. The term “-cal” refers to the calculation results.
Energies 13 00383 g005
Figure 6. Effect of coils relative distance on the power transfer efficiency. The terms “-cal”, “-sim” and “-meas” refer to the calculation, simulation and measurement results.
Energies 13 00383 g006
Figure 7. Experimental setup for measuring the S-parameters between a pair of printed spiral coils using a network analyzer.
Energies 13 00383 g007
Figure 8. Effect of operating frequency on the power transfer efficiency. The terms “-cal”, “-sim”, and “-meas” in the figure refer to the calculation, simulation and measurement results.
Energies 13 00383 g008
Table 1. Design parameters and defined constraints.
Problem SetupParameterSeries Connection LoadParallel Connection Load
WPT1WPT2WPT3WPT4WPT5
Design parametersTx coil inner diameter (mm) 1 d i 1 40 1 d i 1 40 1 d i 1 40 1 d i 1 60 1 d i 1 60
Rx coil inner diameter (mm) 1 d i 2 20 1 d i 2 20 1 d i 2 20 1 d i 2 20 1 d i 2 20
Width of tracks (µm) 150 w 3500 200 w 3500 200 w 3500 200 w 4000 200 w 4000
Space between tracks (µm) 150 s 500 200 s 500 200 s 500 200 s 1000 200 s 1000
Number of turns 2 n 11 2 n 20 2 n 20 2 n 40 2 n 40
Metal thickness (µm) t c = 35 35 t C 100 1 t C 50 t C = 35 t C = 35
ConstraintsRx coil parasitic resistance (Ω)---- R 2 0.2
Tx coil outer diameter (mm) d O 1 40 d O 1 40 d O 1 40 d O 1 60 d O 1 60
Rx coil outer diameter (mm) d 02 20 d 02 20 d 02 20 d 02 20 d 02 20
Self-Resonance-Frequency (MHz) S R F 100 S R F 100 S R F 100 S R F 100 S R F 100
Distance between coils (mm) 10 10 10 10 10
Power Carrier Frequency (MHz) 13.56 13.56 13.56 13.56 13.56
Source resistance (Ω) R S = 0.5 R S = 0.5 R S = 0.5 R S = 0.5 R S = 0.5
Load resistance (Ω) R L = 100 R L = 100 R L = 100 R L = 100 R L = 100
Table 2. Results of optimizing the geometries of the printed spiral coils using the proposed optimization algorithm.
CoilParameterWPT1WPT2WPT3WPT4WPT5WPT6WPT7
Driver Coiln0------14
w0 (µm)------439
s0 (µm)------427
di0 (mm)------4
tc0 (μm)------35
L0 (μH)------3.08
R0 (Ω)------2.08
Cp0 (pF)------0.77
do0 (mm)------28.25
SRF0 (MHz)------103.41
Q1------100.01
Tx Coiln11111881186
w1 (µm)1490139816132561197912802123
s1 (µm)282374262349603282357
di1 (mm)11101121530
tc1 (μm)35484635353535
L1 (μH)2.112.111.782.273.162.282.46
R1 (Ω)0.560.550.440.590.630.680.5
Cp1 (pF)1.171.21.421.110.81.121.02
do1 (mm)39.9839.984057.5658.84059.76
SRF1 (MHz)101.27100.10100.02100100.01100.14100.34
Q1169.77170.79161.89212.11233.8162.09410.95
Rx Coiln21113202344
w2 (µm)2642832394000901546550
s2 (µm)236255236200432150186
di2 (mm)9611121414
tc2 (μm)35351835353535
L2 (μH)2.52.63.680.030.250.550.54
R2 (Ω)2.522.464.870.0020.20.50.5
Cp2 (pF)0.980.970.690.0790.110.540.44
do2 (mm)2019.992017.82019.5719.89
SRF2 (MHz)101.52100.16100.083271.1948.53291.4325.18
Q284.4989.8964.361899.9105.9493.1892.46
Load Coiln3-----914
w3 (µm)-----200198
s3 (µm)-----150168
di3 (mm)-----73
tc3 (μm)-----3535
L3 (μH)-----1.291.72
R3 (Ω)-----1.92.35
Cp3 (pF)-----0.871
do3 (mm)-----13.313.25
SRF3 (MHz)-----150.31121.49
Q3L-----1.081.43
Resultsk01------0.26
k120.120.120.120.150.140.130.11
k23-----0.370.33
PTE (%)82.6582.5883.397.6491.4586.3287.46
Table 3. Results of high-frequency structure simulator (HFSS) simulation.
CoilParameterWPT1WPT2WPT3WPT4WPT5WPT6WPT7
Driver CoilL0 (μH)------3.1
R0 (Ω)------2.05
Cp0 (pF)------1.07
SRF0 (MHz)------87.3
Q0------103.28
Tx CoilL1 (μH)2.072.111.752.193.252.262.51
R1 (Ω)1.671.431.131.251.561.441.13
Cp1 (pF)2.492.42.582.812.292.033.06
SRF1 (MHz)70.0670.6574.8664.258.3674.357.4
Q181.5292.9491.68106.94134.1398.94188.65
Rx CoilL2 (μH)2.592.691 -0.040.270.330.56
R2 (Ω)2.082.14106.870.050.210.440.56
Cp2 (pF)1.71.57-0.141.961.972.11
SRF2 (MHz)75.8277.43-2142219198.7146
Q2106.02107.28-59.7411063.1385.24
Load CoilL3 (μH)-----1.281.73
R3 (Ω)-----1.581.79
Cp3 (pF)-----0.860.7
SRF3 (MHz)-----151.3144.9
Q3L-----1.071.45
ResultsPTE (%)82.2683.42-69.0589.2283.2285.99
1 HFSS simulation shows that the imaginary part of the coil impedance is negative.
Table 4. Measured coils’ electrical specification.
CoilSymbolWPT1WPT2
Tx CoilL1 (μH)2.292.37
R1 (Ω)2.782.89
Cp1 (pF)3.833.69
SRF1 (MHz)53.7453.74
Rx CoilL2 (μH)2.832.96
R2 (Ω)3.292.31
Cp2 (pF)2.612.48
SRF2 (MHz)58.6158.71
ResultsPTE (%)80.3282.72
PDL (mW)155.24173.89
Table 5. Comparison with previously published works.
Ref.Type of Links/CoilsFrequency (MHz)Diameter of Tx Coil (mm)Diameter of Rx Coil (mm)Distance between to Coils (mm)Source Resistance (Ω)Load Resistance (Ω)Power Transfer Efficiency (%) Power Delivered to the Load (mW)
[4]2-coil/Wire wound13.56125401000.5528.479
3-coil/Wire wound11736.192
4-coil/Wire wound15042.8114.4
2-coil/Wire wound0.1457505002000.52060.8176.4
3-coil/Wire wound62069.3169.3
4-coil/Wire wound34366.7163
[11]2-coil/Printed spiral5402010Not considered50078Not reported
[12]2-coil/Printed spiral13.56381010Not considered50072.22Not reported
[10]2-coil/Printed spiral and wire wound13.56168401200.110015170
3-coil/Printed spiral and wire wound37260
4-coil/Printed spiral and wire wound354.4
[13]4-coil/Multi strands Litz wire0.76422205.610082Not reported
[16]4-coil/Printed spiral
(2 coils for power transfer)
136.413.6710Not mentionedNot mentioned69.8Not reported
[18]3-coil/Printed array0.2300 × 30054<1011083.33870
[19]2-coil/Multi strands Litz wire34015125.110035Not reported
3-coil/Multi strands Litz wire36125.110065Not reported
This work2-coil/Printed spiral13.564020100.510082.72173.89

