Effect of Spark Ignition Timing and Water Injection Temperature on the Knock Combustion of a GDI Engine


Key Laboratory of Low-grade Energy Utilization Technologies and System, Ministry of Education, Chongqing University, Chongqing 400044, China
*
Author to whom correspondence should be addressed.
Energies 2020, 13(18), 4931; https://doi.org/10.3390/en13184931
Submission received: 14 August 2020
/
Revised: 14 September 2020
/
Accepted: 16 September 2020
/
Published: 20 September 2020
(This article belongs to the Special Issue Advanced Modeling and Experimental Methods for Engine Combustion Analysis)
Abstract
:A turbocharged downsizing spark ignition (SI) engine cooperating with an in-cylinder direct injection technology is one of the most effective ways to improve the power and economy of gasoline engines. However, engine knock has limited the application and development of the downsizing of gasoline engines. Water injection technology can effectively suppress the knock. In this study, a method of numerical simulation was used to explore the effect of the water injection temperature on the combustion and suppression of the knock. First of all, the knock of the gasoline engine was induced by advancing the spark timing. Then, when the other conditions were the same, different water injection temperatures were set. The results show that lowering the water injection temperature reduced the knock intensity in the cylinder, but increasing the water injection temperature made the water distribution more uniform, and the peak values of each monitoring point were more consistent. The circulating work power increased with the increase of the water injection temperature. For emissions, as the temperature of the water injection increased, the emissions of soot and unburned hydrocarbons (UHCs) decreased, and NOx slightly increased.

1. Introduction
At present, improving engine performance and reducing emissions are the main directions of internal combustion engine research [1,2]. A turbocharged downsizing spark ignition (SI) engine cooperating with direct injection technology in the cylinder can effectively improve the performance of a gasoline engine. However, the downsizing technology will increase the maximum temperature and pressure in the cylinder, which easily causes engine knock. The spontaneous combustion of the terminal mixture will cause a violent chemical reaction, and the large amount of heat emitted will rapidly raise the temperature of the mixture in the surrounding area and form a pressure shockwave. The shockwave is continuously reflected and superimposed in the cylinder and is finally transmitted to the piston, connecting rod, cylinder wall, and other components, which ultimately leads to damage to the engine’s mechanical components [3,4,5]. Therefore, knock has become the main limiting factor for the development of downsizing technology [6,7,8].
Water injection technology is a direct and simple method to suppress knock and reduce emissions [9,10,11]. The specific heat capacity of water is large. Liquid water absorbs the heat in the cylinder at a high temperature and then evaporates into water vapor, which can effectively reduce the temperature and pressure. This can effectively reduce the tendency to produce knock [12,13,14]. In addition, water injection can significantly reduce the temperature and pressure in the cylinder, where water vapor fills the combustion chamber and dilutes the air in the cylinder, and water injection can increase the disturbance in the cylinder such that the air and fuel mix more evenly, reducing the possibility of local oxygen enrichment. These are all conducive to reducing NOx emissions [15,16,17]. If water is injected into the cylinder during the compression stroke, the temperature and pressure can be reduced, thereby reducing the compression work. Water vapor can be used as a working fluid in the expansion stroke to do work externally, thereby improving the thermal efficiency of the gasoline engine. The lower temperature in the cylinder can reduce the heat dissipated from the cylinder wall. The heat radiation ability of water is strong, which can increase the heat transfer rate in the cylinder, improve the energy utilization efficiency, and achieve the effect of energy saving [18,19,20]. The research on water injection for suppressing knock can be traced back to the research of Harry Ricardo in the early 1930s. Water injection technology has also been applied to some racing cars. Later, the emergence of intercoolers gradually reduced people’s attention to water injection technology. However, the cooling effect of the intercooler cannot meet the needs of the development of downsizing technology. Water injection technology has regained the attention of researchers. With the development of computational combustion dynamics and chemical dynamics, the applied research of water injection technology in internal combustion engines has also gradually deepened [21,22,23,24].
There are three main types of water injection technology: fuel–water emulsion, water injection in the intake port, and direct water injection in the cylinder. The fuel–water emulsification method first prepares a stable suspension of gasoline, emulsion, and water, and then the injection system injects the emulsion into the cylinder. However, the emulsification method has the following disadvantages: the emulsification process is very complicated, the stability of the emulsified fuel also requires a lot of work, the price of the emulsifier is expensive, the ratio of water to fuel is fixed, and the quantity of water cannot be adjusted according to the working conditions of the gasoline engine [25,26,27]. The advantage of water injection in the intake port is that there is basically no need to change the structure of the gasoline engine, and the water quantity can be adjusted. However, liquid water absorbs heat in the intake duct and evaporates into water vapor, which will take up a part of the volume and affect the volumetric efficiency of the gasoline engine. Therefore, water injection in the intake port is limited by the maximum water injection quantity, that is, the water injection volume cannot be too large [19,28,29]. Direct water injection into the cylinder is based on the original injection system but need to add a set of water injection equipment. The water is injected directly into the cylinder and the cooling effect is better than that of water injection in the intake port. In addition, the direct water injection in the cylinder is not limited by the maximum water injection quantity, and the water–fuel ratio can be changed with the change of working conditions.
The application of water injection to diesel engines was earlier than that of gasoline engines. The compression ratio and heat load of diesel engines are much larger than those of gasoline engines. Increasing the compression ratio can improve the power performance and fuel economy of diesel engines. However, this also led to a sharp increase in the temperature and pressure in the cylinder, and the trend of knock became more and more obvious. Water injection is a simple and effective method that is used to suppress knock, which has attracted the attention of many scholars. Water injection mainly uses water to absorb the heat in the cylinder and reduce the temperature and pressure in the cylinder, thereby reducing the tendency toward producing knock. Due to the continuous development of the downsizing technology of gasoline engines, the research on the suppression of knock using water injection in gasoline engines has also continued to deepen. The study of water injection into diesel engines also gives many references for the research of water injection into gasoline engines. The characteristics of various water injection methods can be further understood from the research on diesel engine water injection. Abu-Zaid [27] explored the effects of different forms of water–fuel emulsions on the performance of direct-injection diesel engines through experiments. The results show that adding water in the form of an emulsion can improve combustion efficiency. As the quantity of the water in the emulsion increases, the engine torque, power, and brake thermal efficiency also increase. In the range of speeds studied, the efficiency of the brakes using a 20% water emulsion was 3.5% higher than that of diesel without water. Niko et al. [30] conducted experimental and numerical studies on some chemical and physical properties of the combustion characteristics of water/oil emulsified fuel (W/OEF). It was found that in diesel engines at several speeds and loads, when using 10% and 15% W/OEF, NOx can be reduced by up to 20%, the concentration of soot is reduced by about 50%, and the specific fuel consumption is hardly increased.
Chen et al. [31] studied the influence of inlet water injection on gasoline engine operations through experiments and simulations, where the results showed that as the proportion of water injection increases, the increase in thermal efficiency also increases. Miganakallu et al. [32] used experiments to establish whether a water–methanol mixture was better than pure water or pure methanol in terms of engine performance and found that the water–methanol blend did not show a better performance than pure water or pure methanol. In terms of the combustion time, combustion stability, specific fuel consumption, and exhaust gas temperature, the characteristics of a water–methanol mixture are between pure water and pure methanol. Pure water injection enables an engine to achieve the lowest specific fuel consumption when operating within the controlled knock limit. Chen et al. [33] experimentally explored the effect of spark timing and inlet water injection on natural gas combustion and emissions and found that water injection reduces the combustion speed, resulting in a decrease in the pressure peak, heat release rate, and combustion temperature in the cylinder. As the combustion temperature decreases, the thermal load of the engine decreases. The emission of BSNOx (brake specific nitrogen oxide) decreases with an increase in the quantity of the injected water, while the mass of BSTHC (brake specific total hydrocarbon) and BSCO (brake specific carbon monoxide) increases slightly. Brusca et al. [15] explored the effect of water injection in the inlet on suppressing knock and reducing emissions through experiments. The results show that water injection can effectively improve the anti-knock resistance of fuel, and water injection can reduce the temperature in the cylinder and thus reduce NOx emissions. A gasoline engine can adopt a higher compression ratio after water injection. Valero-Marco et al. [34] studied the potential of direct water injection into a cylinder to expand the operating range toward higher loads via experiments. It was found that water injected into a cylinder can absorb the heat released by the combustion in the cylinder, which can effectively reduce the maximum temperature and pressure, and can also reduce the pressure gradient and the knock tendency of the combustion process. Water injection is an effective strategy for increasing the maximum load. However, this may result in a loss of combustion stability. Zhao et al. [35] used simulation techniques to study the fuel-saving potentials of different water/steam injection layouts. Steam injection into a cylinder can produce up to 10% fuel reduction and steam injection at a turbocharger turbine inlet can reduce the brake specific fuel consumption (BSFC) by 2.3–4.7%. Due to the higher enthalpy introduced in the cylinder, as the steam mass ratio increases, the fuel consumption of the engine is significantly reduced. However, the maximum steam mass ratio is limited by the maximum permitted in-cylinder pressure. Arabaci et al. [36] used experimental methods to explore the effect of direct water injection in the cylinder on the engine performance of a six-stroke engine. The results show that after direct water injection into the cylinder, the specific fuel and exhaust temperatures were reduced by 9% and 7%, respectively. The thermal efficiency increased by about 8.72%. NOx and other emissions were also significantly reduced. However, the power output and fuel consumption increased by 10% and 2% after water injection, respectively.
From the studies above, it can be concluded that direct water injection in the cylinder has great potential for suppressing knock trends, improving engine performance and thermal efficiency, and reducing the emission of NOx and other pollutants. Not only can it improve the power and economy of the engine but it can also promote energy saving and emissions reductions. However, there are few studies on the effect of water injection on the knock of gasoline engines under high-speed and high-load conditions. The injection water temperature not only affects the heat absorbed by the water but may also affect the distribution of the water, which in turn affects the combustion and emissions. The physical and chemical effects of water injection on combustion have not yet been unified. This study used a simulation method to explore the influence of advancing the spark timing on knock and the influence of water injection temperature on knock suppression, gasoline engine power performance, and emissions under high-speed and high-load gasoline engine conditions.
2. Materials and Methods
2.1. Basic Parameters and Working Conditions
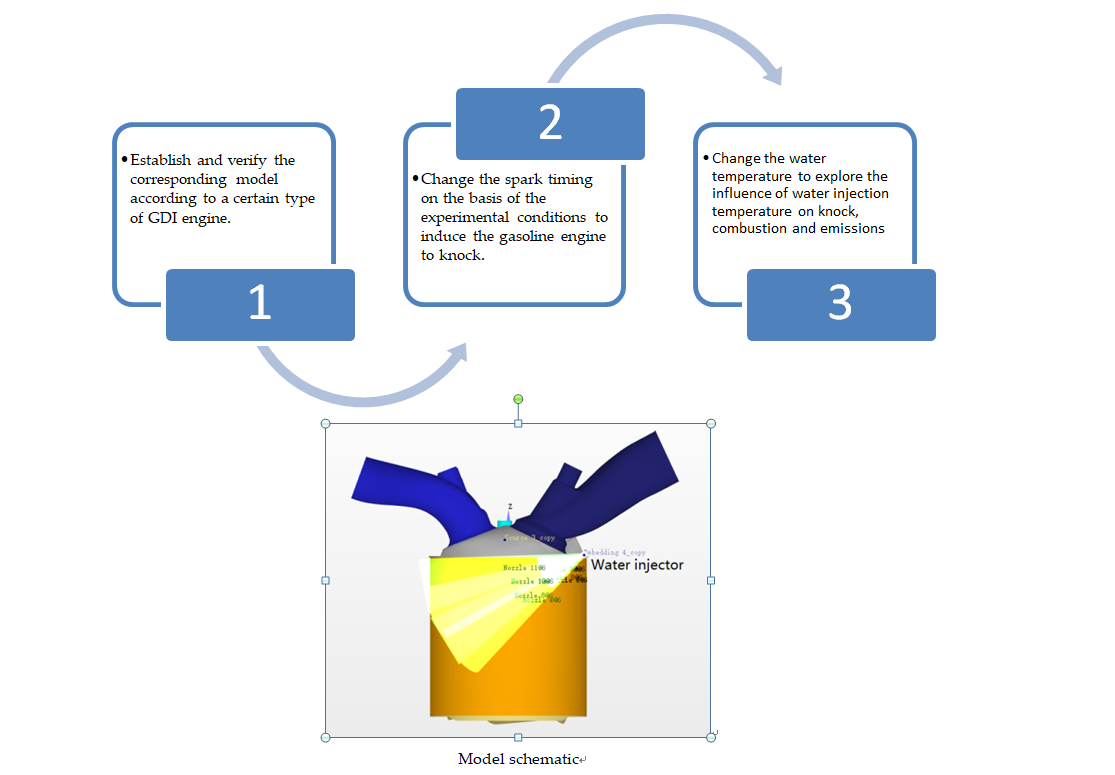
In order to investigate the effect of temperature on knock under high-speed and high-load conditions, the speed of the gasoline engine was selected to be 5500 rpm, and the throttle valve was fully opened. The basic parameters and operating conditions of the gasoline direct injection (GDI) engine are shown in Table 1 and Table 2, respectively. The parameters and experimental conditions of this GDI engine and its model are the same as those in a previously published paper exploring the effect of water injection quantity on knock [37].
2.2. Submodels of the Numerical Simulation
In the numerical simulation of the engine, each submodel needed to be determined, such as the turbulence model, spray model, and combustion model. The flow situation in the cylinder was very complicated and included complex phenomena, such as fluid flow, chemical reactions, and heat and mass transfer. For the specific introduction of some submodels, please refer to the previous paper [37]. The models of the two papers are the same. The submodels in this paper are shown in Table 3.
The combustion model in this study was the sagemodel, which is unique to the software (Converge, v2.3, Convergent Science, Madison City, WI, USA). The SAGE model can adapt well to various chemical reaction mechanisms, and the calculation is relatively accurate. The chemical reaction mechanism is Jia Ming’s one-component mechanism, which includes 41 components and 124 reactions [38]. The mechanism was verified against various experimental data, including shock tube, flow reactor, premixed laminar flame speed, and internal combustion engines over a wide range of temperatures, pressures, and equivalence ratios. The results show that the mechanism was in good agreement with the experimental data. The SAGE model coupled with the single-component mechanism proposed by Jia Ming et al. can reflect the combustion process well. The submodels used in this study are shown in Table 3.
2.3. Initial and Boundary Conditions
The initial conditions were defined in terms of the temperature, pressure, composition of each substance, etc. For example, at the beginning of the calculation, the temperature, pressure, and turbulent kinetic energy in the cylinder were 1099 K, 2.769 bar, and 1.0 m2/s2, respectively. The boundary conditions required in this paper included the various boundaries of the engine (fixed wall, intake, exhaust), temperature, and pressure. Table 4 shows the specific boundary conditions. The starting time of the numerical simulation calculation was −366 °CA. At this time, the exhaust valve was about to close and the intake valve is about to open.
2.4. Model Verification
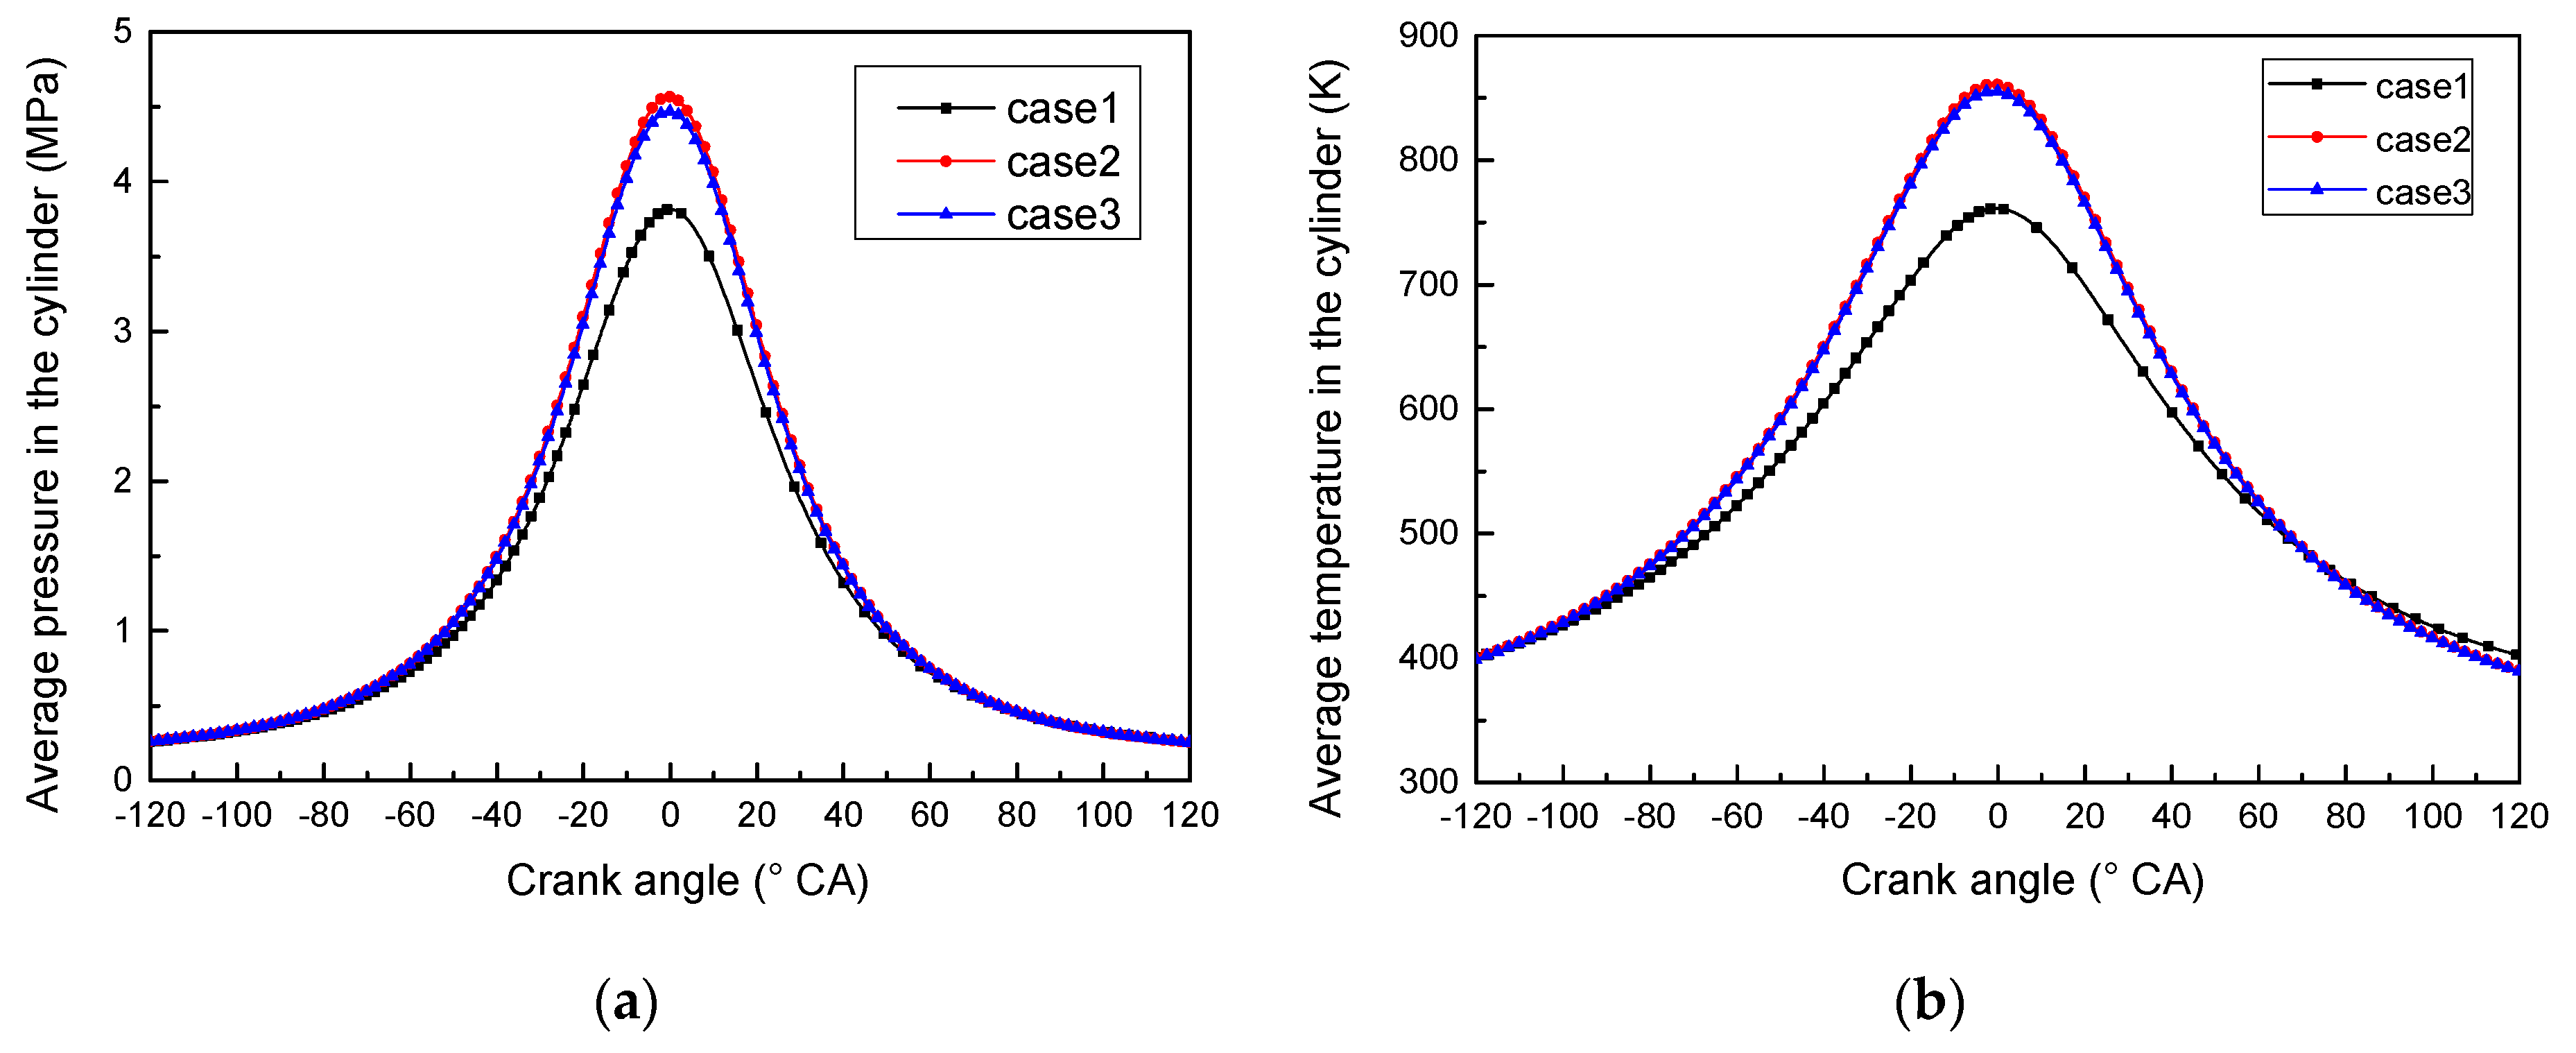
It was necessary to verify the reliability of the model, including the irrelevance of the model and the consistency of the simulation results and experimental results. Encrypting or coarsening the grid to a specified time and space can save calculation time while ensuring accurate calculations. Therefore, the intake and exhaust passages used a thick grid; the cylinder head, intake valve, spark plug, and other parts adopted a fine mesh. Then, adaptive encryption was used for the pressure and temperature of the flow field in the entire cylinder. When the pressure or temperature gradient in the cylinder area exceeded the limit value, the area automatically encrypted the grid. According to the geometric model of the gasoline engine, the basic dimensions of the selected grid were 0.25–8 mm, 0.185–4 mm, and 0.125–2 mm, which were respectively named case1, case2, and case3. The three cases were calculated according to the geometric model and calculation model of the engine. Figure 1 shows the average pressure and temperature in the cylinder that was calculated using grids of different sizes. As can be seen from Figure 1, case1 was significantly different from the other two cases, while case2 and case3 were not significantly different. Therefore, it can be said that when the basic grid size was 0.185–4 mm, the calculation result was independent of the size of the grid. Considering the calculation accuracy and calculation time, the model used in this study adopts a grid size of 0.185–4 mm as the basic grid size.
In order to verify the accuracy of the model, the numerical simulation results were compared with the experimental results. Figure 2a shows the comparison between the experimental and simulated average pressure in the cylinder. It can be seen from the figure that the simulation results were basically consistent with the experimental results. The difference in the peak value of the pressure between the simulation result and the experimental result did not exceed 5%. The ignition delay time is defined as the time from the moment of spark timing to the moment when the pressure in the cylinder begins to deviate from the pure compression line. Figure 2b shows that the ignition delay time under the experimental conditions was 14.1 °CA; the ignition delay time found using the numerical simulation was 14.0 °CA. Therefore, the ignition delay time between the experimental results and the simulation results was only 0.1 °CA. It can be said that the simulation model could effectively simulate the actual operating conditions of the direct injection gasoline engine.
3. Results
It can be seen from the relevant literature [4,21,22] that when the equivalence ratio is from 0.9 to 1.1, the knock trend is more obvious. The equivalent ratio of the experimental working condition was 1.1; therefore, the equivalent ratio was selected to be 1.1. The spark timing under the experimental conditions was −11 °CA. The gasoline engine did not knock and its power performance was relatively good. Advancing the spark timing can improve the power and economy of a gasoline engine but will increase the knock tendency. In this study, by initiating the spark timing, the gasoline engine was induced to knock to better explore the influence of the water injection temperature on the knock. Therefore, other conditions, such as the initial and boundary conditions and the fuel injection quantity, were the same as the experimental conditions above, but the spark timing was advanced from −11 °CA to −21 °CA. Three working conditions with spark timings of −11 °CA, −16 °CA, and −21 °CA were selected.
Figure 3a shows the average in-cylinder pressure profiles for different spark timings. It can be seen that as the spark timing advanced, the time for the pressure to reach the peak value decreased and the peak value increased. This meant that as the spark timing advanced, the rate of the pressure rise also increased. If the rate of the pressure rise was too large, it was easy to form high-pressure shockwaves in the cylinder. The high-pressure shock waves propagated in the cylinder and were repeatedly reflected, which easily induced knock. Conversely, when the spark timing was delayed, the peak pressure moved away from the top dead center (TDC), where the possibility of afterburning increased, causing the exhaust temperature to increase and the effective power of the gasoline engine to decrease.
Figure 3b shows the average in-cylinder temperature profiles for different spark timings. The changing trend of the temperature at different spark timings was basically the same. However, as the spark timing advanced, the peak value of the temperature increased and the time to reach the peak value decreased. In the process of flame propagation, the temperature and pressure in the cylinder increased such that the terminal mixture was subjected to greater heat radiation and greater
Figure 4a shows the instantaneous heat release rate profiles for different spark timings. The time corresponding to the peak of the instantaneous heat release rate and the time corresponding to the peak of the pressure were relatively consistent. The peak value of the instantaneous heat release rate also increased with the advancement of the spark timing; therefore, it can be said that the increase in the instantaneous heat release rate caused an increase in the rate of the pressure rise. The increase in the heat release rate, especially the increase in the peak value of the instantaneous heat release rate, was due to the rapid heat release of the fuel over a short time, which resulted in an increased tendency to produce knock in the cylinder.
Figure 4b shows the cumulative heat release profiles for different spark timings. The combustion duration can be defined as follows: the starting time of the combustion is the crank angle corresponding to 10% of the cumulative heat release, and the ending time of combustion is the crank angle corresponding to 90% of the cumulative heat release. The time interval between these two crank angles is defined as the combustion duration. When the spark timings were −21 °CA, −16 °CA, and −11 °CA, the combustion durations were 17.7 °CA, 20.2 °CA, and 23.4 °CA, respectively. The cumulative heat released for different spark timings was almost the same, but as the spark timing advanced, the combustion time was closer to the TDC and the combustion duration was shorter. Therefore, properly increasing the spark timing can reduce the combustion duration and increase the heat release rate, which is conducive to improving the power and fuel economy of an engine. However, in the process of the flame propagating from the spark plug to the terminal mixture, the terminal mixture absorbed more heat and received a greater pressure shockwave, which increased the tendency of the terminal mixture to produce knock.
The degree of knock is characterized by the knock index (KI); the equation for KI is as follows [22]:
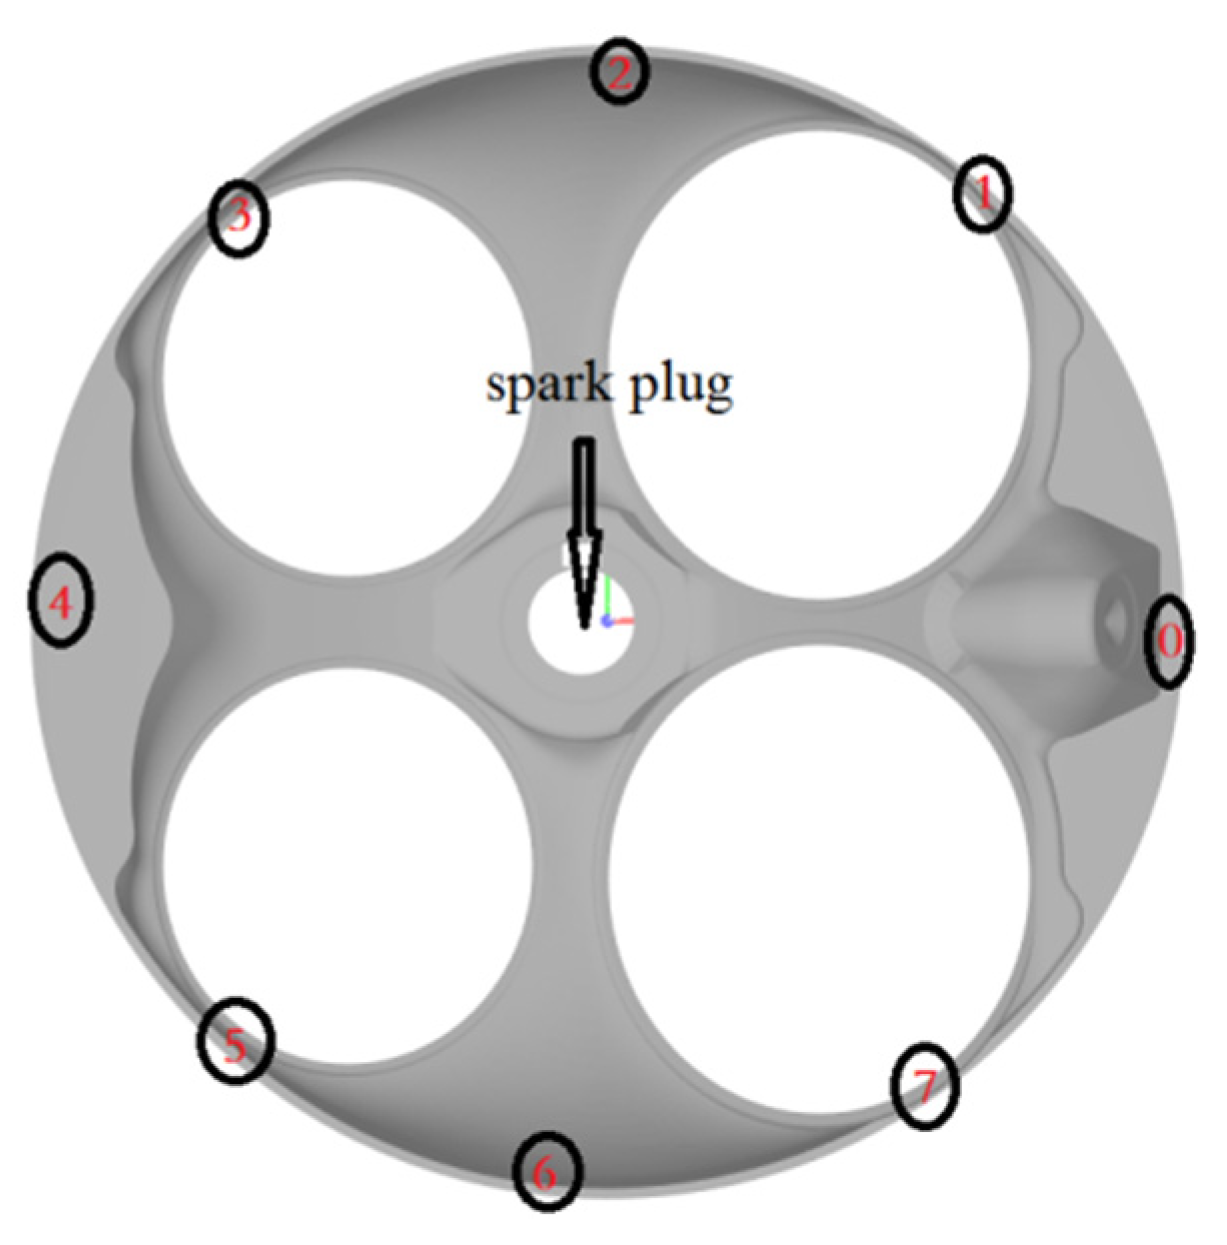
KI represents the strength of the knock, N represents the number of monitoring points, PPmax,n represents the difference between the peak pressure at the monitoring point and the peak average pressure in the cylinder. When KI is greater than 2, the engine knocks; when KI is less than or equal to 2, the engine does not knock. The knock occurs because the time it takes for the flame front to propagate to the terminal mixture is longer than the time of the terminal mixture self-ignition. The area near the wall of the combustion chamber is relatively far away from the spark plug; therefore, it is prone to knock [22]. To research knock, some monitoring points were set near the wall surface of the combustion chamber. The monitoring points 0–7 were arranged anticlockwise and were evenly distributed along the wall of the combustion chamber. Figure 5 specifically shows the distribution of the monitoring points.
Figure 6 shows the peak-to-peak pressures of different monitoring points for different spark timings. As the spark timing advanced, the peak-to-peak pressure value at each monitoring point became higher and higher. When the spark timing was −21 °CA, the peak-to-peak pressure difference between the monitoring points was also more obvious. In addition, when the spark timing was −21 °CA, the peak-to-peak pressure values of monitoring points 1 and 4 were the largest, especially point 4. Using the KI equation, the KI is shown in Figure 7. When the spark timing was −21 °CA, the KI of the gasoline engine was close to 4, which is much greater than 2. According to the equation, when KI is greater than 2, the gasoline engine knocks. In this study, in order to investigate the effect of the water injection temperature on knock, the spark timing was chosen to be −21 °CA.
In order to explore the reasons for the severe knock at monitoring point 4 when the spark timing was −21 °CA, the knock was analyzed in terms of the turbulent kinetic energy, temperature, pressure, and fuel/air equivalent ratio. Figure 8 shows the distribution of various fields before sparking when the spark timing was −21 °CA. Figure 8a,b shows that the overall distribution of the pressure and temperature was very uniform, and there was no obvious difference between the monitoring points at this timing. Compared with other areas, the temperature near the injector (slightly above monitoring point 0) was significantly lower than other areas. This was mainly because the equivalent ratio in the vicinity of the fuel injector was significantly higher than in other areas. The evaporation of the liquid fuel in the cylinder needed to absorb the heat; therefore, the temperature in the area near the injector was significantly lower than elsewhere. It can be seen from Figure 8c that when comparing all the monitoring points, the turbulent kinetic energy on the left and right sides of the combustion chamber wall was low, and the turbulent kinetic energy above and below the combustion chamber was high. The greater the turbulent kinetic energy, the higher the intensity of the turbulence, and the more uniform the mixing of the fuel and air, which was beneficial for the flame propagation, and was less likely to knock. This may have caused the flame to propagate at different speeds in different directions. The monitoring points 0 and 4 located at the far left and right of the combustion chamber had small turbulent kinetic energies. As a result, these monitoring points displayed severe knock. Monitoring point 2, located above the combustion chamber, was not prone to knock due to its large turbulent kinetic energy. Figure 8d is the distribution diagram of the equivalence ratio at the moment of sparking. It can be seen that the equivalent ratio in the vicinity of monitoring points 0, 1, and 4 was very large, even exceeding 1.3. When the equivalent ratio was small, the flame propagation speed increased with the increase in the equivalent ratio. When the equivalence ratio reached 1.1, the flame propagation speed was the largest, and then the flame combustion propagation speed decreased as the equivalence ratio increased. Both too rich and too lean mixtures were not conducive to flame propagation, which increased the reaction time of the terminal mixture and increased the tendency to produce knock. Therefore, monitoring points 0, 1, and 4 were more prone to knock than other monitoring points.
When the spark timing was −21 °CA, the flame propagation diagram for −12 °CA to 15.5 °CA during the combustion process is shown in Figure 9. The red area in the figure is the temperature iso-surface, which is expressed as the front surface during the flame propagation. As can be seen from Figure 9, at 13 °CA, the flame front was evenly distributed around the spark plug and close to the inner wall of the cylinder, indicating that the speed of the flame propagation from the position of the spark plug to each position in the cylinder was basically the same. Due to the special structure of the combustion chamber, when the piston was in the area near the TDC, the space in the leftmost area of the combustion chamber was relatively narrow, which was not conducive to flame propagation. The flame first reached the intake sidewall surface and then reached the exhaust sidewall surface. The flame spread continuously to the area of monitoring point 4 after 13 °CA. At 15 °CA, the flame basically disappeared in the area of point 4. Subsequently, at 15.5 °CA, the flames appeared at point 4, indicating that spontaneous ignition occurred at point 4, and then the pressure and temperature rose sharply. This also shows that monitoring point 4 was the most prone to knocking.
4. Discussion
4.1. Effect of the Water Injection Temperature on the Knock Trend
In order to investigate whether different water injection temperatures had an impact on knock and the engine performance, this study selected two operating conditions with water injection temperatures of 60 °C and 150 °C. Under the condition that the other operating parameters of the experimental conditions remained unchanged, only the spark timing of the gasoline engine was advanced from −11 °CA to −21 °CA to explore the effect of the water injection temperature on the knock combustion. The parameters of the water injection were as follows: water injection time was −80 °CA, the quantity of the water injection was 8.231 mg, the water injection pressure was consistent with the fuel injection pressure of 15 MPa, and the water injection temperature was 60 °C and 150 °C.
4.1.1. Influence of the Water Injection Temperature on the Initial Conditions
The distribution of the equivalence ratios at different water injection temperatures before the spark timing (−21 °CA) is shown in Figure 10a. The equivalence ratio of most areas in the cylinder was around 1.1. The equivalent ratio near the injector was about 1.5. The equivalence ratios for different water injection temperatures were almost the same. The distribution of the equivalence ratio before the spark timing was relatively uniform, except for in the vicinity of the fuel injection nozzle, indicating that the water injection temperature had little effect on the distribution of the equivalence ratio before the spark. Both too rich and too lean mixtures were not conducive to flame propagation, which increased the reaction time of the terminal mixture and increased the tendency to produce knock.
Figure 10b gives the temperature distribution before the spark timing for different water injection temperatures. The temperature distribution was basically the same. The temperature distribution was uniform and the temperature was mostly distributed between 625 K and 750 K. Comparing the temperature distribution at different water injection temperatures, the low-temperature area when the water injection temperature was 150 °C was greater than the low-temperature area when the water injection temperature was 60 °C, where the green area in the picture represents the low-temperature area
Figure 11 shows the distribution of water from −21 °CA to −10 °CA. The distribution area of water when the water injection temperature was 150 °C was wider than that when the water injection temperature was 60 °C. This was because the higher the temperature of the water injection, the greater the internal energy of the water. From a microscopic point of view, evaporation is a process in which liquid molecules escape from the liquid’s surface and enter the gas phase space. Liquid molecules need to overcome the attractive force of other molecules on the surface of the interface to do work, and at the same time, they must expand the volume to occupy the gas space. As the temperature of the water injection increases, the internal energy of the liquid molecules increases such that more water molecules have enough energy to overcome the attractive force of the liquid surface molecules and enter the gas phase space, resulting in a faster macroscopic evaporation rate. Therefore, when the water injection temperature was 150 °C, the low-temperature area was wider than that when the water injection temperature was 60 °C. Improving the water injection temperature can make the water more uniformly distributed in the cylinder. The more uniform the water distribution, the wider the low-temperature area in the cylinder. This helps to suppress knock.
4.1.2. Effect of the Water Injection Temperature on Knock
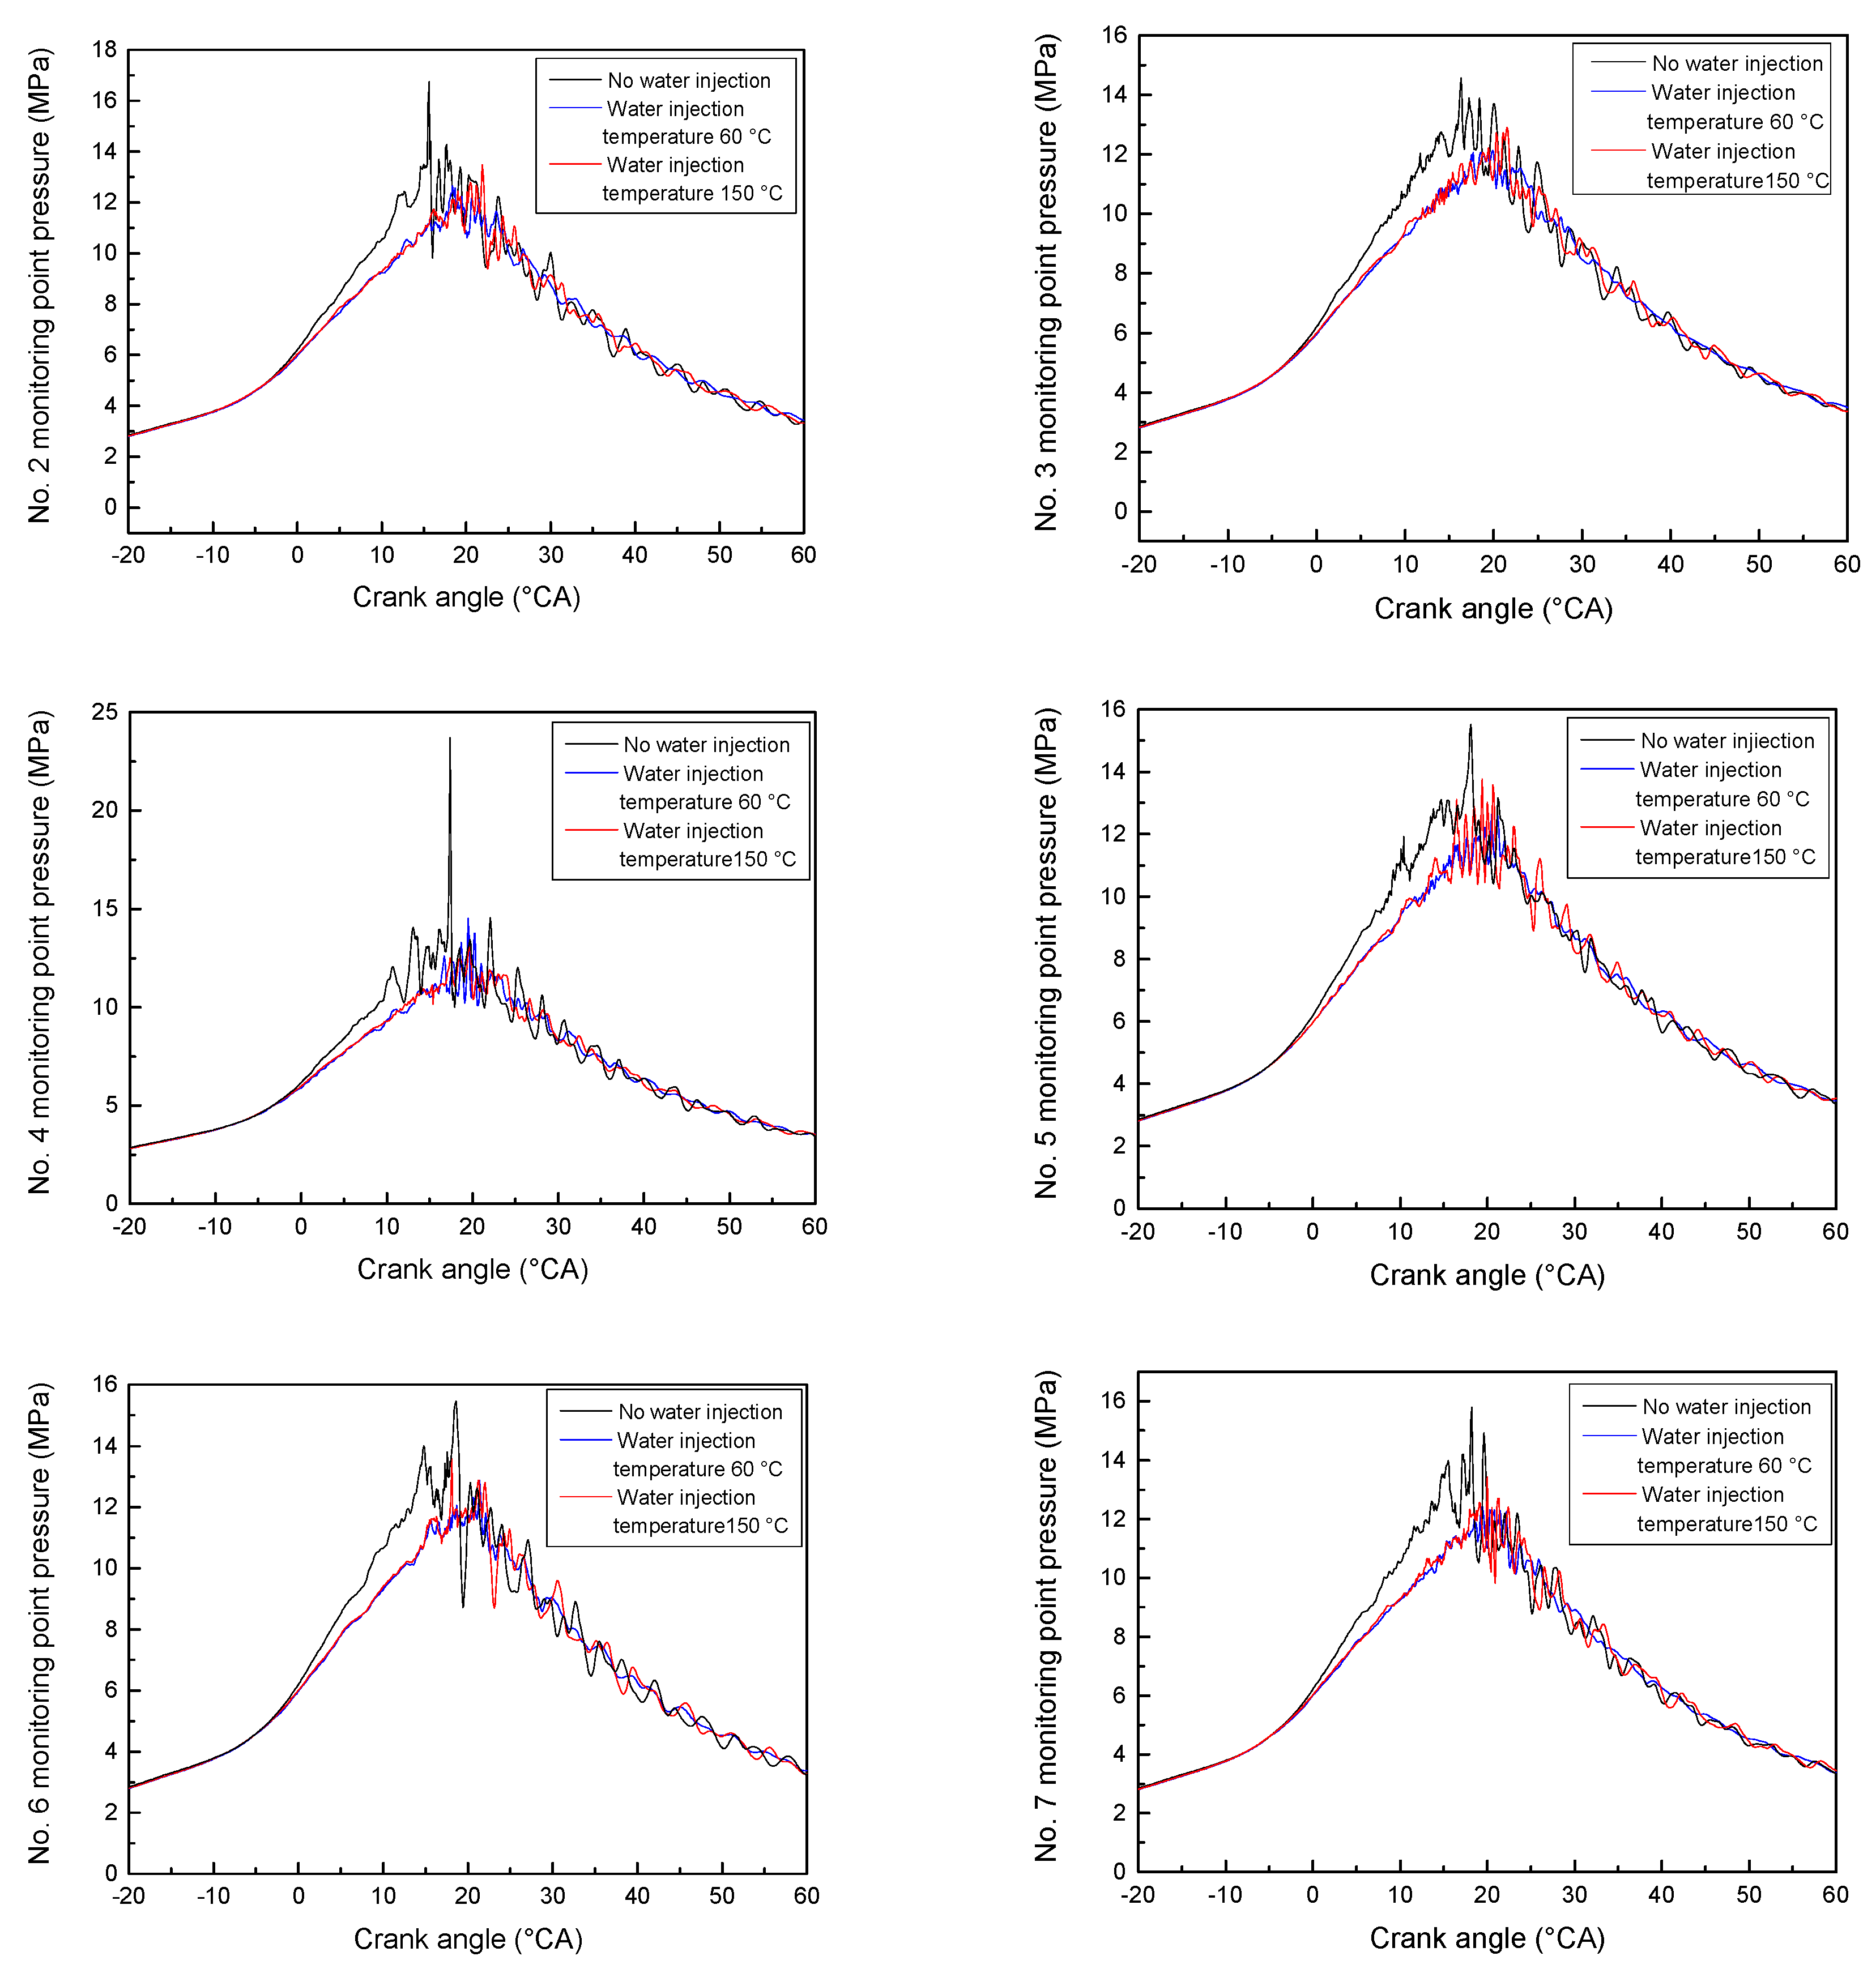
Figure 12 shows the pressure fluctuation graphs of the monitoring point under different water injection temperatures. Compared with the pressure of the monitoring point when there was no water injection, regardless of whether the temperature of the water injection was 150 °C or 60 °C, the direct water injection could effectively decrease the pressure and pressure increase rate of each monitoring point. The pressure fluctuation range of each monitoring point was also reduced, and the combustion was more stable. Liquid water was injected into the cylinder to absorb the heat released by the combustion to become water vapor. As an inert gas, water vapor dilutes the terminal mixture and prolongs the self-ignition time of the mixture, thereby decreasing the knock tendency of the gasoline engine. Compared with the water injection temperature of 60 °C, when the water injection temperature was 150 °C, the pressure at most monitoring points was higher, especially in the range of 18–22 °CA of the crank angle. This was because the temperature of the water injection was increased and the heat absorbed by the water cylinder was reduced; therefore, the pressure was increased a little. However, because the temperature of the injected water was high and the amount of heat absorbed by the water was small, the difference in the peak pressure at each monitoring point under different water injection temperatures was not obvious.
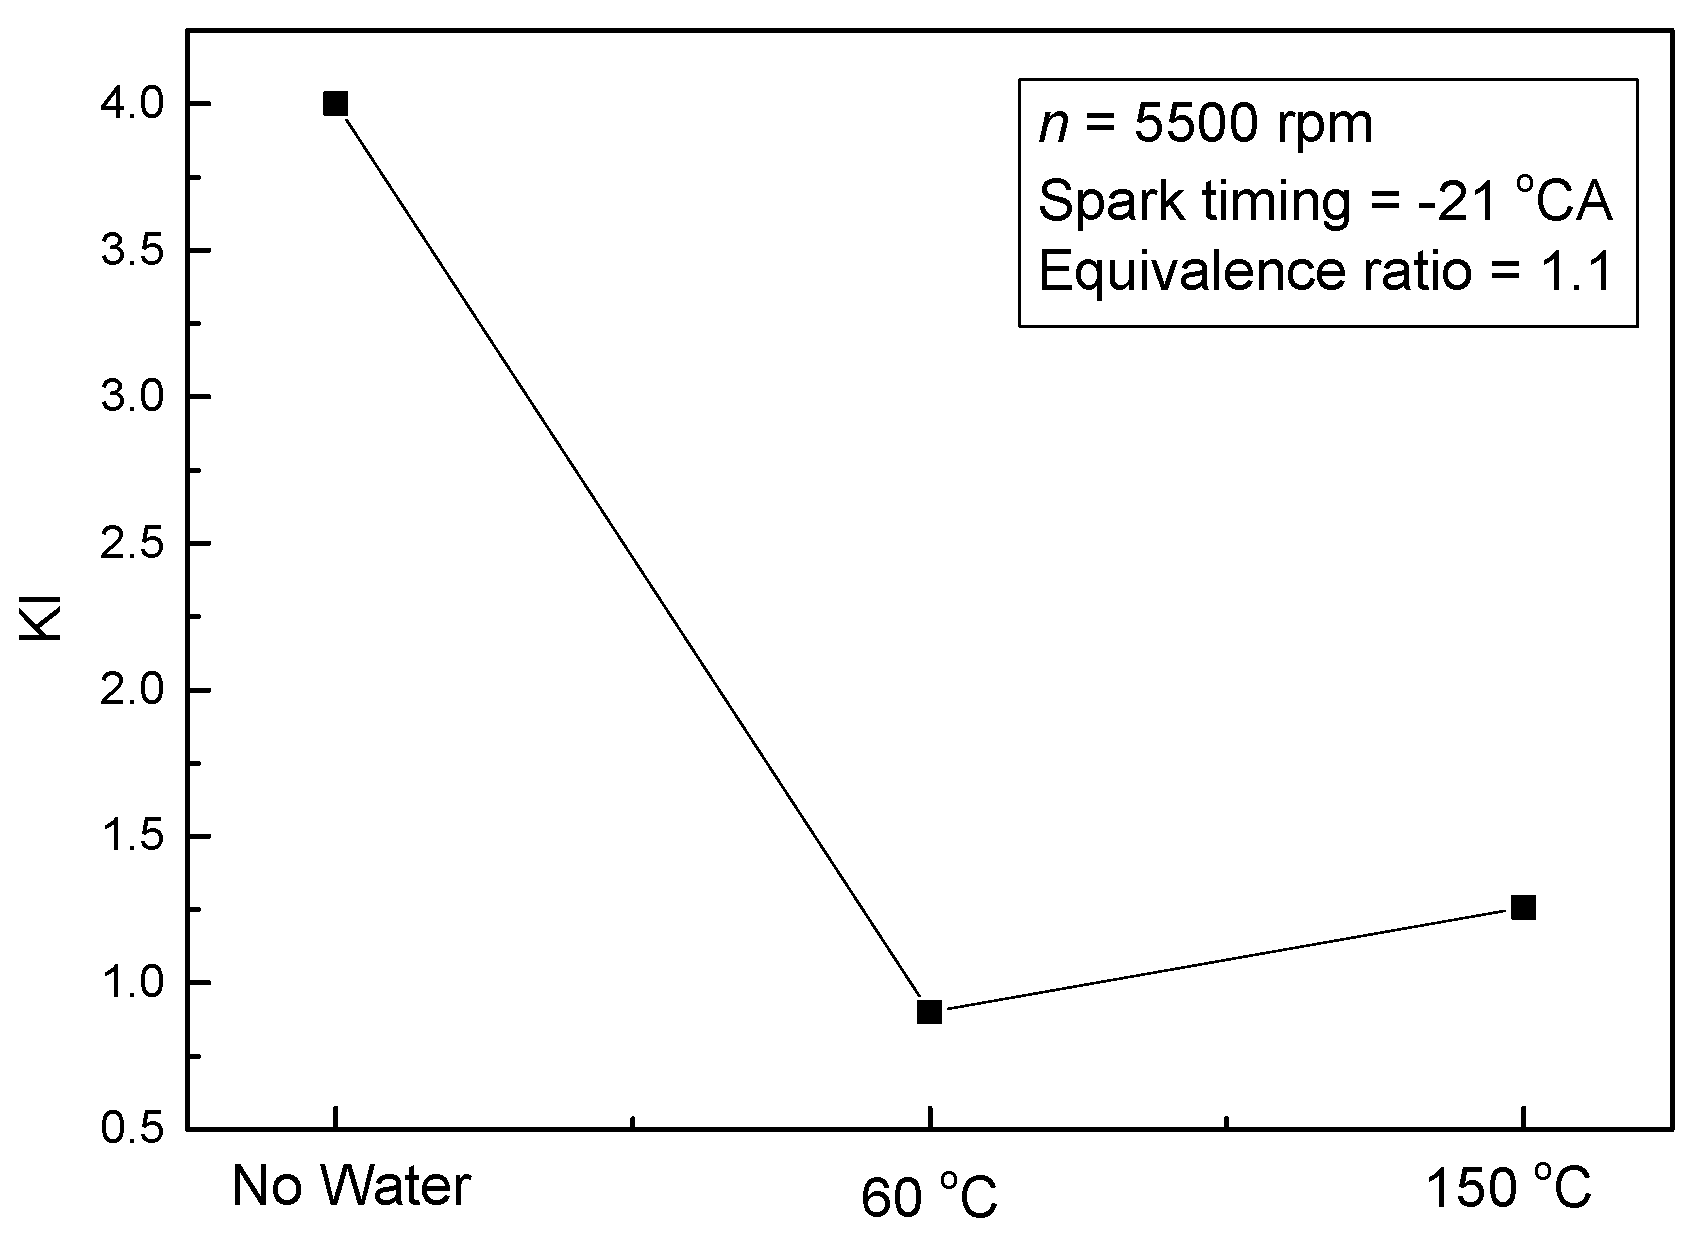
Figure 13 shows the PPmax at different monitoring points under different water injection temperatures. Compared with the no water working condition, regardless of whether the water injection temperature was 60 °C or 150 °C, the PPmax of each monitoring point dropped significantly, which shows that direct water injection in the cylinder could effectively suppress knock. Compared with the water injection temperature of 60 °C, the PPmax value of each monitoring point was closer when the water injection temperature was 150 °C. This can also be explained by noting that an improvement in the temperature of the water injection could make the water distribution more uniform. Figure 14 shows the KI values at different water injection temperatures. When the water injection temperature was 60 °C, the value of KI was 0.94; when the water injection temperature was 150 °C, the value of KI was 1.258. The KI values of the engine were much less than 2 at both water injection temperatures, which means that knock did not occur under these two conditions. When the injection temperature was 60 °C, the value of KI was less than when the injection temperature was 150 °C. This was because the lower the temperature of the water, the greater the amount of heat absorbed and the lower the temperature and pressure in the cylinder; therefore, the knock suppression effect was more obvious. Figure 12 shows that the peak pressure at most of the monitoring points when the water injection temperature was 60 °C was lower than when the water injection temperature was 150 °C. Therefore, lowering the water injection temperature can reduce the knock strength of the gasoline engine. However, improving the water injection temperature can make the water distribution in the cylinder more uniform, and the PPmax of each monitoring point tends to be more consistent. To suppress the knock, the water injection temperature can be appropriately increased.
4.2. Influence of the Water Injection Temperature on the Engine Performance
The average in-cylinder pressure profile for different water injection temperatures is shown in Figure 15. The water injection significantly reduced the pressure and pressure increase rate. Figure 12 shows that water injection could not only reduce the pressure but also reduced the degree of the pressure fluctuations, making the combustion process more stable. In addition, when the water injection temperature was 60 °C, the pressure was lower than when the water injection temperature was 150 °C. When the water injection temperature was 150 °C, the vaporization rate of the water mist was faster and the enthalpy value was higher; therefore, the pressure rise caused by the vaporization expansion was higher than in the case where the water injection temperature was 60 °C.
The P–V diagrams for different water injection temperatures are shown in Figure 16a. The closed curve in Figure 16a was evaluated in the form of an integral to obtain its area, and the work done at different temperatures was obtained. Figure 16b shows the amount of cyclic work done under different working conditions. The circulating work energy per cycle at a water injection temperature of 150 °C was 1238 J, and the work energy per cycle at a water injection temperature of 60 °C was 1230 J. When the water temperature was higher, the superheated water vaporized in a shorter time, pushing the piston to do work. This made up for the heat absorbed by the evaporation of some liquid water into water vapor. Therefore, increasing the water injection temperature improved the cycle work power of the gasoline engine, thereby improving the thermal efficiency of the gasoline engine. The experimental work energy per cycle was 1184 J. This shows that the combination of the advanced spark timing and water injection technology can improve the performance of gasoline engines.
The application of water injection into the gasoline engines also has some challenges. The quantity of the water injected into the cylinder needs to be strictly controlled because injecting too much water may dilute the lubricating oil, and the corrosion resistance of various parts of the gasoline engine needs to be strengthened. The water storage and recycling equipment also need further development, and the problem of water freezing should be avoided when the ambient temperature is too low. In the engine working process, the water circulation can be improved as much as possible to save a lot of the trouble of adding water. It is also necessary to develop an effective monitoring system to ensure that the appropriate amount of water enters the cylinder. If there is a problem with the water injection equipment, the engine can start the traditional knock mitigation strategies, such as delaying the spark timing and enriching the mixture. The water injection pressure, time, quantity, and other water injection parameters have a great influence on the performance of gasoline engines. For example, if the amount of water injected into the cylinder is too much, the temperature in the cylinder will be significantly reduced, which will reduce the engine’s power performance. Therefore, it is necessary to further explore the influence of various water injection parameters on the engine such that the various parameters can be coordinated to allow for to the greatest advantages of water injection technology [37].
4.3. Effect of the Water Injection Temperature on Emissions
4.3.1. The Influence of Water Injection Temperature on NOx and Unburned Hydrocarbon (UHC) Emissions
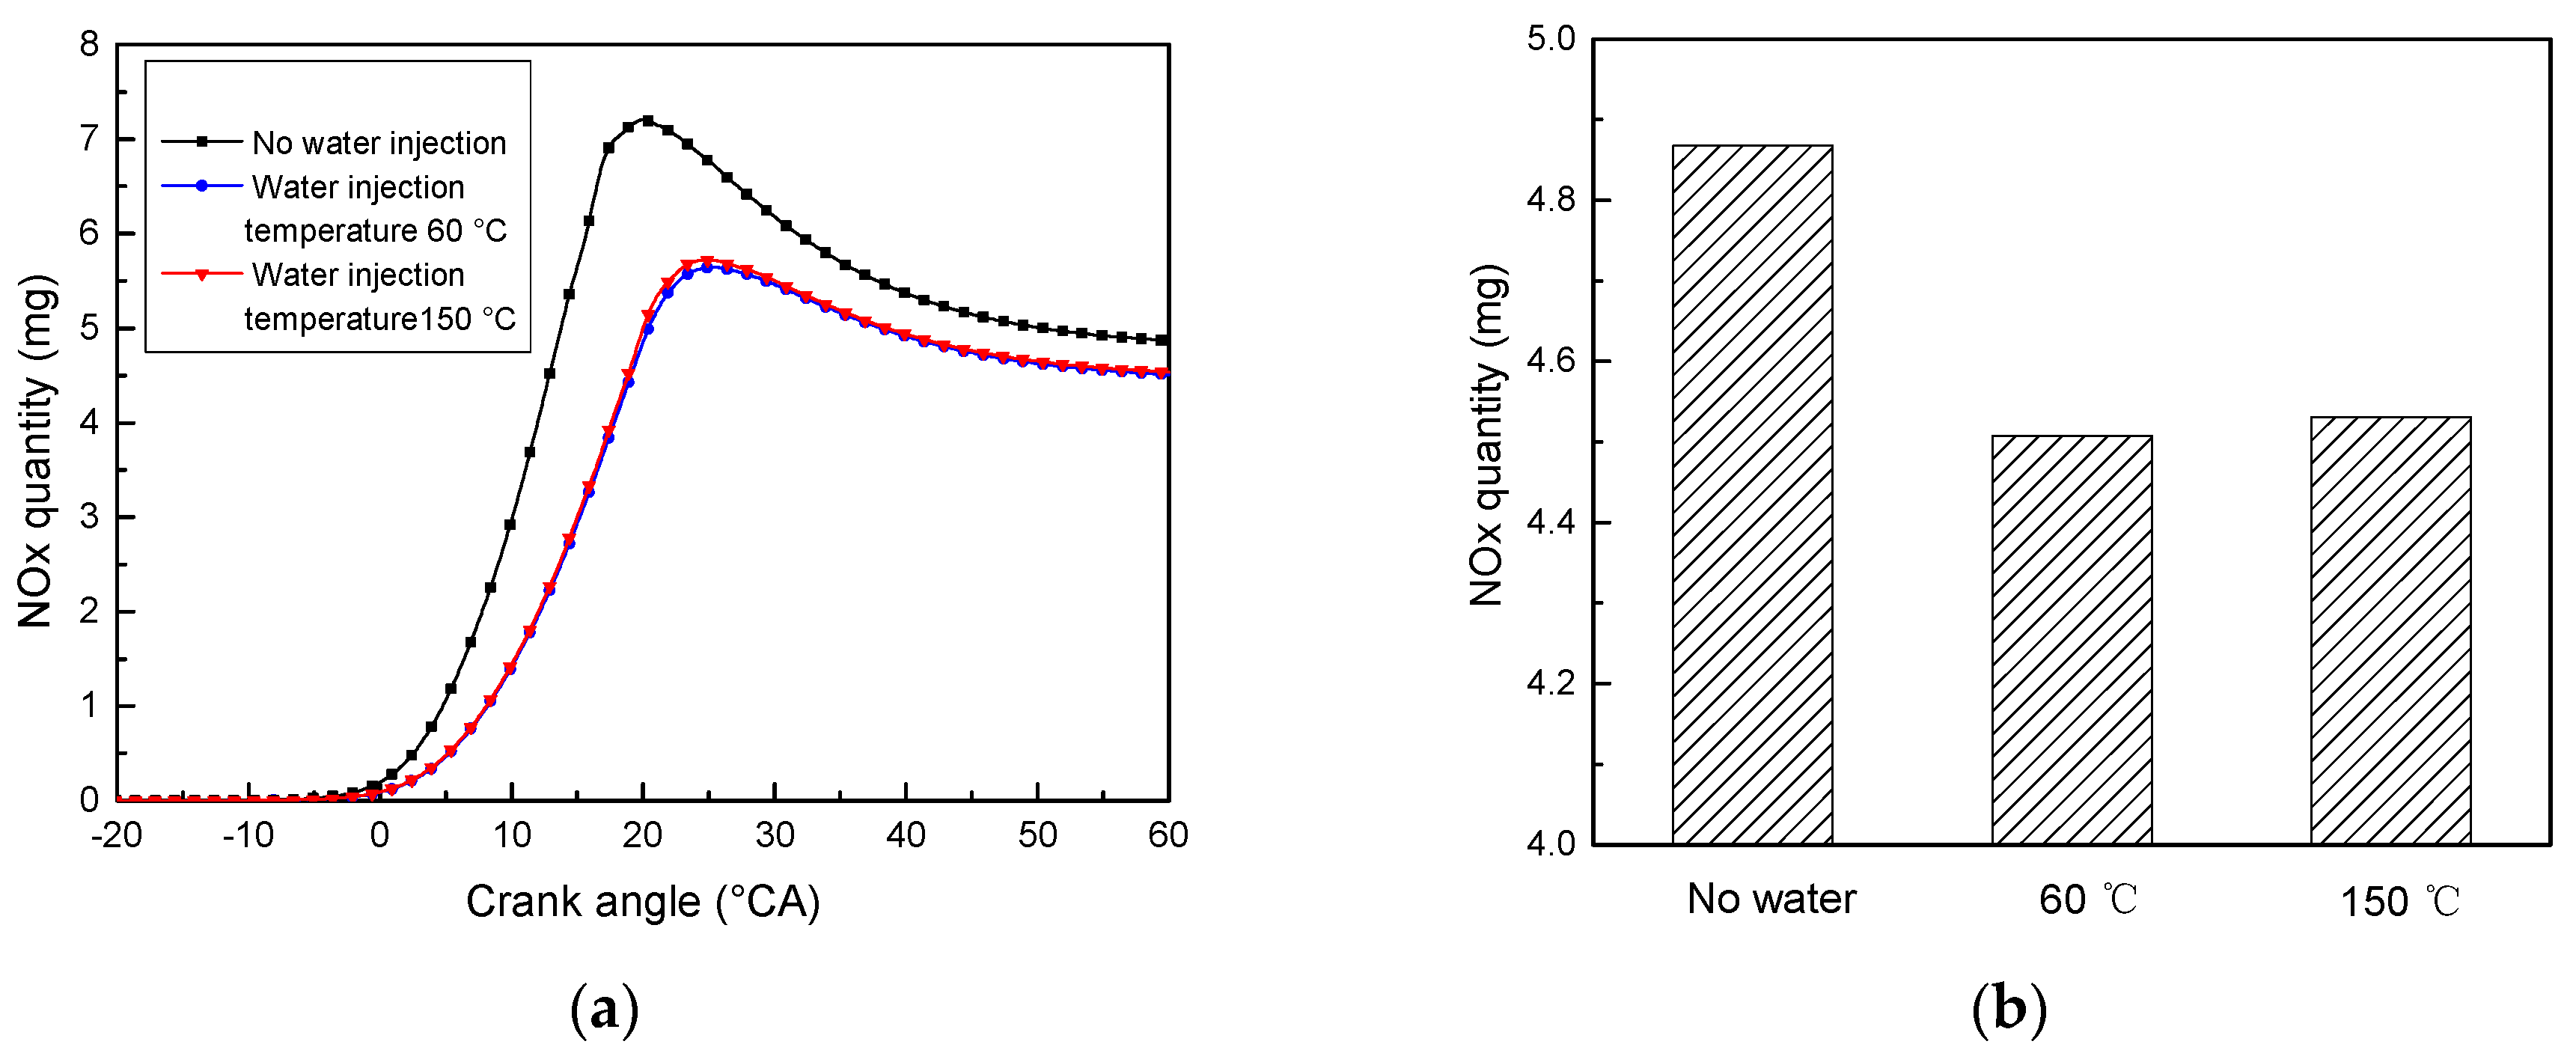
Figure 17a shows the generated quantity of NOx in the process of combustion. NOx emissions increased first and then decreased, and then tended to remain unchanged. The emission of nitrogen oxides in the cylinder was mainly in the form of NO. The formation mechanism of NO is described using the extended Zeldovich model, as shown in the following Equations (1)–(3):
O + N2 = NO + N
N + O2 = NO + O
N + OH = NO + H
The reason why NOx first increased to the maximum value and then decreased was that the generation of NOx is a reversible reaction. When the piston moved to the bottom dead center (BDC), the pressure decreased, which promoted the occurrence of a reverse reaction, thereby reducing the amount of NOx produced. Figure 17b shows the final NOx production quantity. Compared with the no water injection condition, water injection effectively reduced the quantity of NOx, but the temperature of the water injection has little effect on the NOx emissions. The main factors that affected the amount of NOx generated include the following three points: the high temperature included a local high temperature and oxygen concentration, and the duration of the high temperature. These three conditions are indispensable; therefore, reducing the amount of NOx produced can be achieved by controlling one of them. The temperature has a great influence on the amount of NOx produced. The combination of N and O is a product at high temperatures. When the temperature is higher than 1800 °C, this combination reaction becomes obvious. As the temperature rises, the reaction rate increases exponentially. At the same time, the amount of NOx generated also increases as the residence time of the combustion products in the high-temperature region increases. In addition, the higher the oxygen concentration, the greater the amount of NOx produced. Liquid water in the cylinder can absorb the heat to effectively reduce the temperature and pressure; therefore, the direct injection of water into the cylinder can effectively reduce the final production of NOx. When the water injection temperature was 150 °C, the NOx emission was slightly higher than when the water injection temperature was 60 °C. The equivalent ratios under different working conditions were all 1.1; therefore, the main influencing factor was temperature.
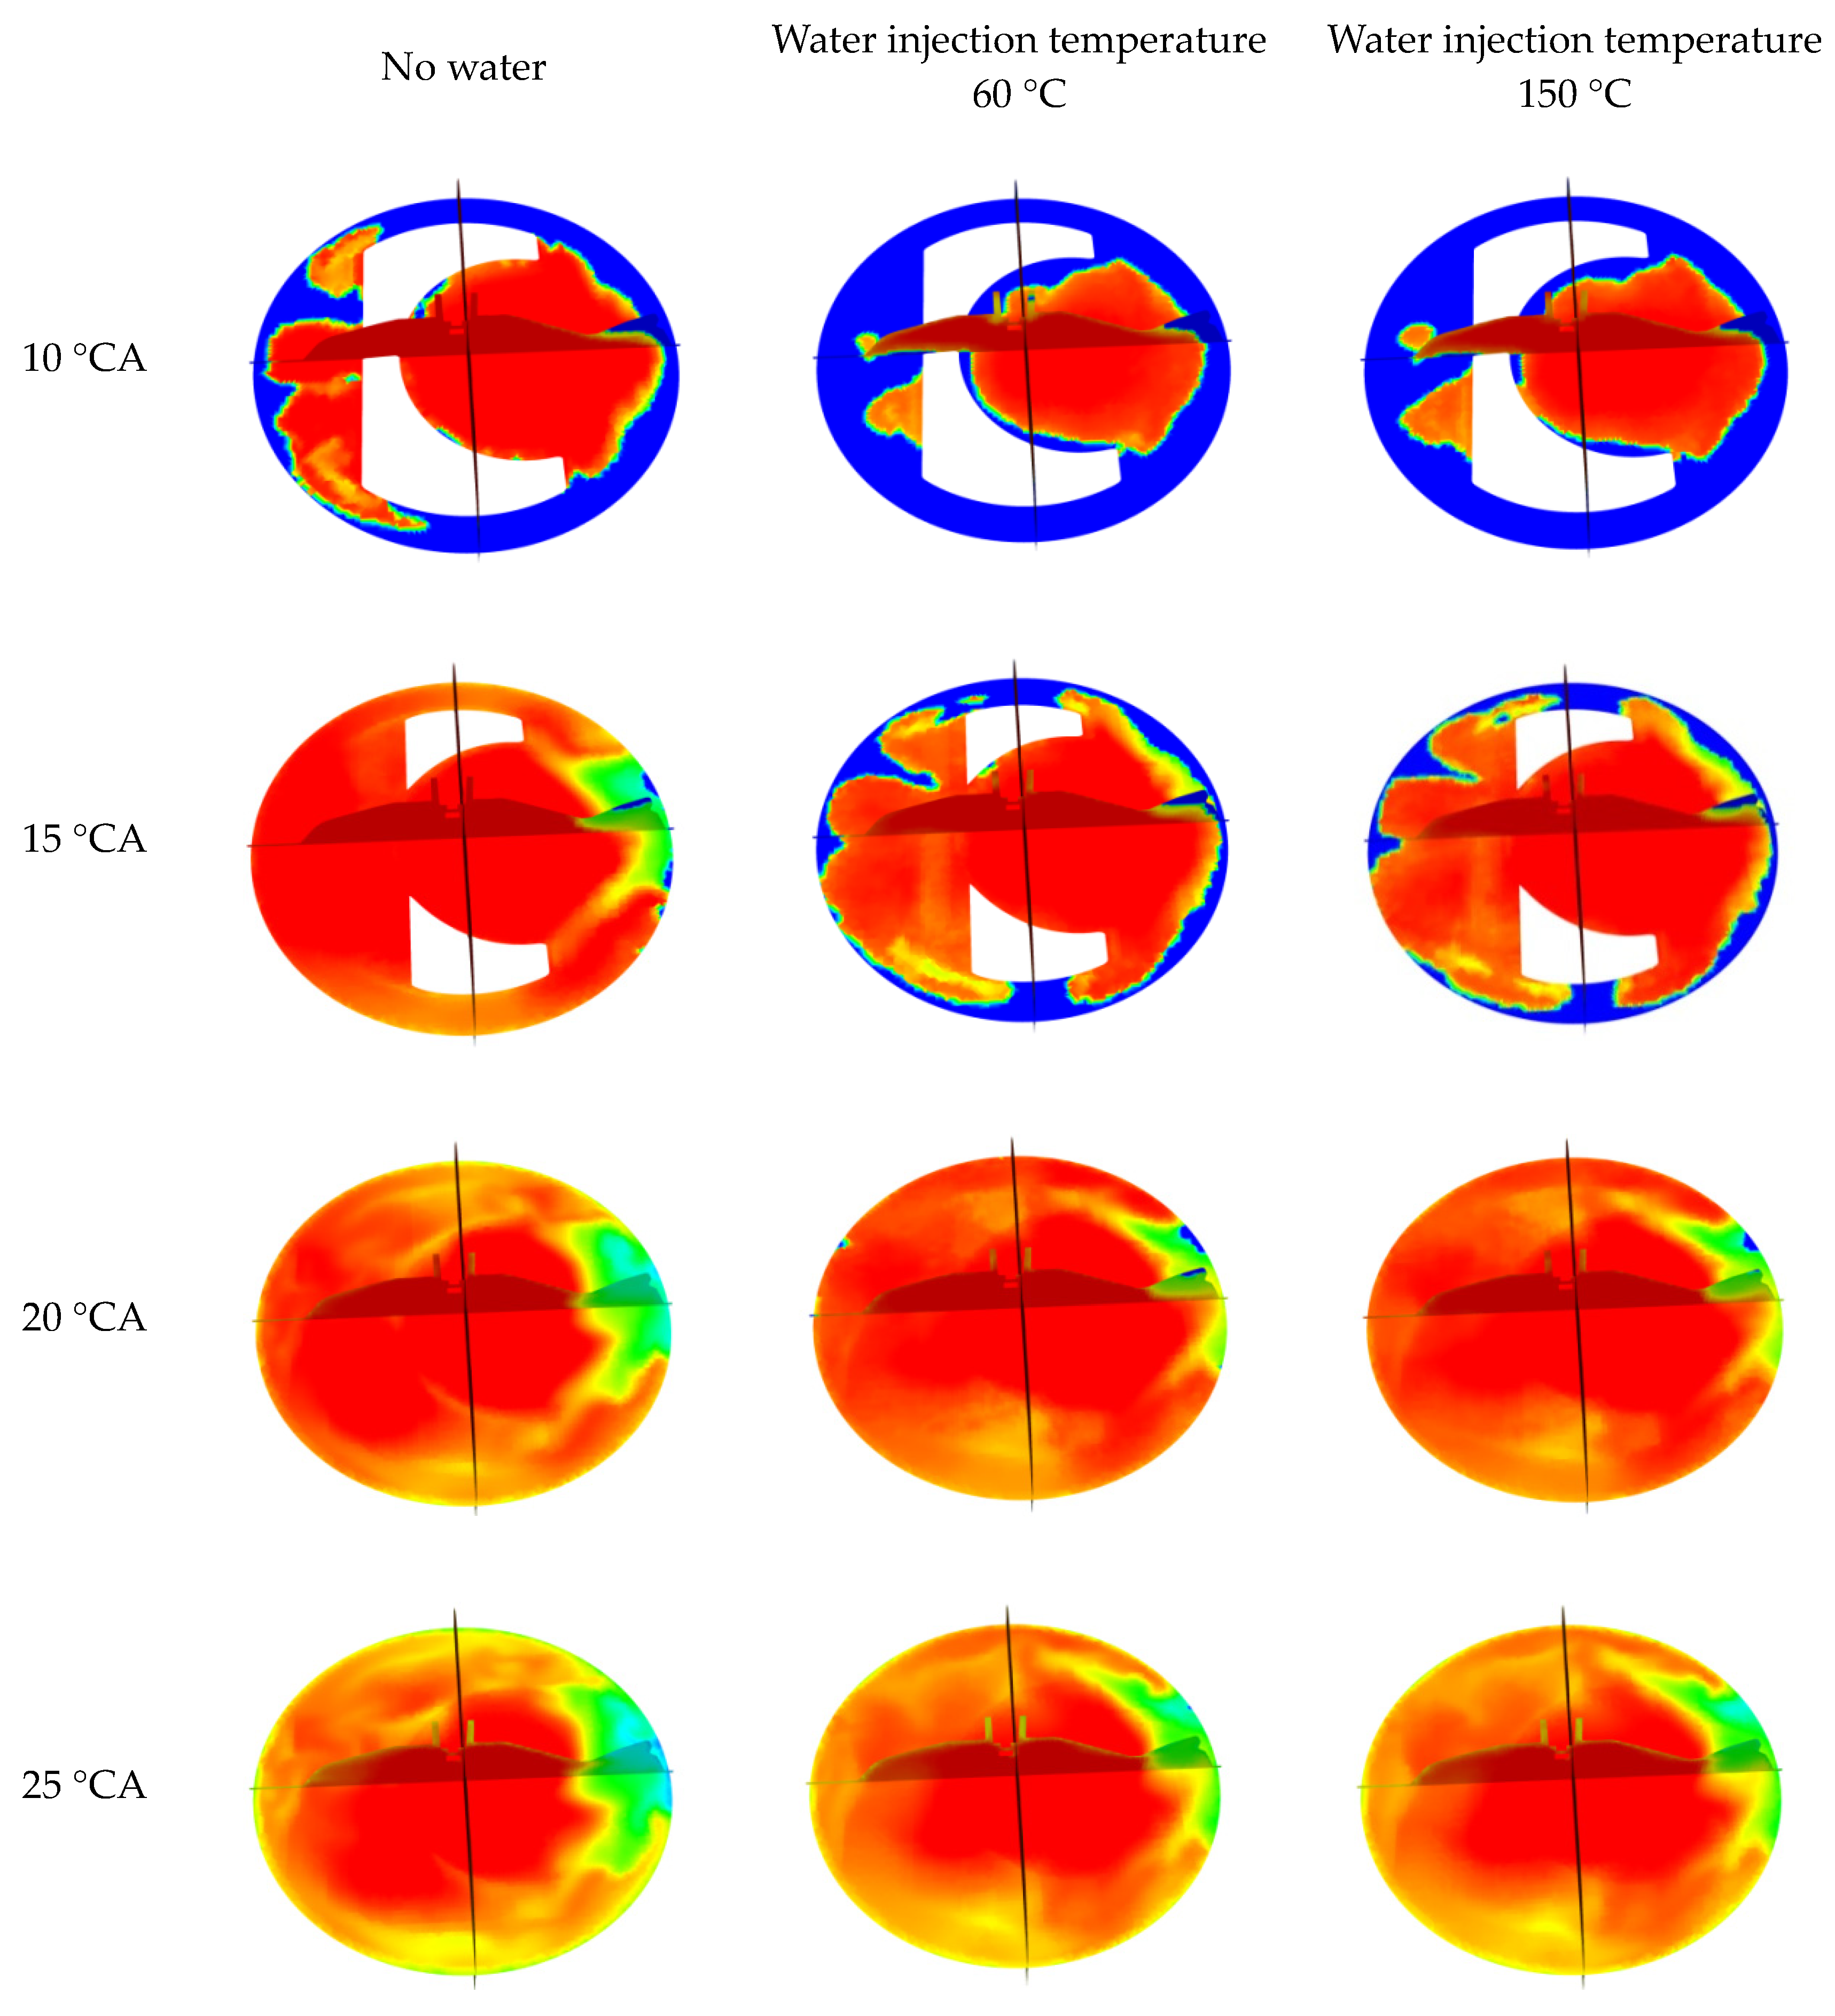
Figure 18 shows the temperature field at different water injection temperatures during the period of 10–40 °CA. Comparing the two operating conditions with different water injection temperatures, the temperature in the cylinder was higher and the duration of the high temperature was longer under the condition of no water injection. The direct injection of water into the cylinder could absorb the heat to effectively reduce the temperature and pressure. Therefore, direct water injection in the cylinder could effectively reduce NOx emissions. When the water injection temperature was 150 °C, the NOx emissions were a little higher than when the water injection temperature was 60 °C. This was because improving the water injection temperature slightly reduced the water’s ability to absorb heat, thereby slightly increasing the temperature in the cylinder. However, improving the water injection temperature made the water more evenly distributed, which helped to reduce the NOx emissions. It can also be seen from Figure 19 that there was little difference in the temperature in the cylinder at different water injection temperatures such that the influence of the water injection temperature on the NOx emissions was not obvious.
Figure 19a shows the generated quantity of UHCs in the process of combustion. The rapid decline of hydrocarbons meant that the fuel was constantly being consumed. The rate of decrease of hydrocarbons was relatively slow and then increased rapidly. This was because the flame center had just been formed near the spark plug during the ignition delay period, where the temperature in the cylinder is not very high, and the consumption of the hydrocarbon fuel was limited. During the acute burning period, the flame spread rapidly from near the spark plug. The contact area between the flame and the combustible gas mixture also increased rapidly, where the hydrocarbon fuel burned rapidly and the mass was greatly reduced. Figure 19b shows the UHC quantity for different water injection temperatures. Compared with no water injection conditions, direct water injection in the cylinder could reduce the quantity of UHCs. This was because water can be decomposed into H2 and O2 at high temperatures according to 2H2O + 2 × 242,000 kJ/kmol = 2H2 + O2. Although the quantity of H2 and O2 was small, it could promote the complete combustion of fuel and improve fuel utilization. Figure 20b shows that when the water injection temperature was 150 °C, the amount of UHCs was significantly lower than with the water injection temperature of 60 °C. The main reasons for the generation of UHCs were incomplete combustion, wall quenching, and oil film adsorption on the wall. Properly improving the temperature of the water injection can make the water more evenly distributed in the cylinder, and it will not be easy to produce flame quenching during the combustion process. This can reduce UHC emissions.
4.3.2. The Influence of the Water Injection Temperature on the Soot and CO Emissions
Figure 20a shows the generated quantity of soot in the process of combustion. The soot first increased continuously, then lowered and finally stabilized. Polycyclic aromatic hydrocarbons (PAHs) are the precursors for soot production and the quantity of soot produced is determined by the two processes of PAH formation and oxidation. The quantity of soot increased first and then decreased because before the spark timing, the temperature was relatively low, and almost no PAHs were generated. After the spark timing, the temperature rapidly increased to 1500–2000 K, the temperature was relatively high, the amount of PAHs generated increased rapidly, and the amount of soot also increased significantly. Finally, the temperature continued to increase, and some PAHs were oxidized; therefore, the quantity of soot generated decreased.
The quantity of soot produced is shown in Figure 20b. Compared with the no-water condition, water injection significantly reduced the quantity of soot. Under high-temperature and fuel-rich conditions, hydrocarbon fuels in gasoline engines can easily generate soot. Direct water injection in the cylinder can effectively reduce soot emissions, mainly due to the following two aspects. On the one hand, the specific heat capacity of water is large. Water can effectively reduce the temperature such that the combustion can be carried out at a low temperature. On the other hand, under the condition of high temperature and a lack of oxygen, the carbon particles produced by combustion can react with water vapor, as shown in Equations (4)–(7). This can effectively reduce soot emissions. Although the intermediate product H2 is of a low quantity, it can increase the combustion rate and improve the combustion status. Figure 20b shows that as the temperature of the water injection increased, the quantity of soot decreased. This is because when the water injection temperature was increased, the water was distributed more evenly in the cylinder. The uneven distribution of water may have caused incomplete combustion. Compared with the water injection temperature of 60 °C, when the water injection temperature was 150 °C, the water distribution in the cylinder was more uniform, flame quenching was less likely to occur, and the combustion was more stable. The temperature in the cylinder also increased a bit, which was more conducive to flame propagation. Therefore, properly increasing the temperature of the water injection can reduce soot emissions.
C + H2O → CO + H2
C + 2H2O → CO + 2H2
CO + H2O → CO2 + H2
2H2 + O2 → H2O
Figure 21 shows the generated quantity of CO in the process of combustion. The mass of CO was 36 mg when there was no water injection, and the final production of CO under different water injection temperatures did not change significantly, where both were close to 31 mg. Water injection could reduce the amount of CO produced but the temperature of the water injection had little effect on CO emissions. Figure 21a shows that the quantity of CO generated first increased to the maximum value and then decreased. The downward trend of CO was basically the same under different water injection temperatures. At this stage, CO was mainly oxidized to CO2. The effect of different water injection temperatures on the oxidation of CO was basically the same; therefore, the peak of the quantity of CO generation determined its final production. The generation of CO mainly includes the direct oxidation of hydrocarbon fuel to form CO and CO2 to produce CO through a reduction reaction. The decomposition reaction of formaldehyde (CH2O) at high temperature is the main source of CO. CH2O decomposes at high temperature, CH2O and OH interact to form HCO radicals, and HCO radicals further react to form CO. Water injection can reduce the amount of CO generated, mainly due to two aspects. First, direct water injection in the cylinder reduces the temperature and inhibits the conversion of CH2O to CO. The second is that water vapor dilutes the oxygen concentration, making the mixture evenly distributed, thereby reducing CO emissions.
5. Conclusions
In this study, the gasoline engine was induced to knock by advancing the spark timing, and then the influence of the water injection temperature on the knock and emissions was explored. The specific heat capacity of water is relatively large. Water entering the cylinder can absorb the heat released by combustion, reducing the temperature and pressure, thereby reducing the tendency to produce knock. In addition, water injection will also have an impact on emissions. Different water injection temperatures have different heat absorption capabilities and different distributions in the cylinder; therefore, different water injection temperatures have different effects on knock and emissions. The conclusions drawn from the analysis were as follows:
- When the spark timing was advanced, the maximum pressure and pressure increase rate in the cylinder increased and the position where the maximum combustion pressure appeared gradually approached the TDC, which was beneficial for improving the power and economy of the gasoline engine. However, the increase in the cylinder pressure and rate of pressure increase increased the tendency of the gasoline engine to knock.
- Compared with the temperature of 150 °C, when the water injection temperature was 60 °C, the effect of reducing the pressure in the cylinder was more obvious, and the knock intensity was lower. However, the two water injection temperatures suppressed the occurrence of knock. Increasing the water injection temperature made the water distribution in the cylinder more uniform, which helped to suppress knock. Under the condition of no knock, increasing the water injection temperature increased the amount of circulating work. The combination of direct water injection in the cylinder and advancing the spark timing improved the power of the gasoline engine.
- Compared with when water was not injected, the NOx, CO, soot, and UHC emissions after the water injection were reduced to varying degrees. Compared with the water injection temperature of 60 °C, when the water injection temperature was 150 °C, the soot emissions and UHCs were significantly reduced, and the NOx emissions were slightly increased. The effect of the water injection temperature on CO emissions was not obvious.
Author Contributions
Conceptualization, A.L. and Z.Z.; Methodology, A.L.; Software, A.L.; Validation, A.L. and Z.Z.; Data Curation, A.L.; Writing—original draft preparation, A.L.; writing—review and editing, Z.Z.; Visualization, Z.Z.; Supervision, Z.Z.; Project Administration, Z.Z. All authors have read and agreed to the published version of the manuscript.
Funding
This research was funded by the National Natural Science Foundation of China Program, grant number 51776024.
Conflicts of Interest
The authors declare no conflict of interest.
References
- Bozza, F.; De Bellis, V.; Teodosio, L. Potentials of cooled EGR and water injection for knock resistance and fuel consumption improvements of gasoline engines. Appl. Energy 2016, 169, 112–125. [Google Scholar] [CrossRef]
- Ye, Z.; Li, L. Control options for exhaust gas after treatment and fuel economy of GDI engine systems. In Proceedings of the 42nd IEEE International Conference on Decision and Control (IEEE Cat. No.03CH37475), Maui, HI, USA, 9–12 December 2003; pp. 1783–1788. [Google Scholar]
- Hill, M.G. Internal Combustion Engine Fundamentals; McGraw-Hill: New York, NY, USA, 1988. [Google Scholar]
- Wang, Z.; Liu, H.; Reitz, R.D. Knocking combustion in spark-ignition engines. Prog. Energy Combust. Sci. 2017, 61, 78–112. [Google Scholar] [CrossRef]
- Cho, S.; Song, C.; Kim, N.; Oh, S.; Han, D.; Min, K. Influence of the wall temperatures of the combustion chamber and intake ports on the charge temperature and knock characteristics in a spark-ignited engine. Appl. Therm. Eng. 2020, 116000. [Google Scholar] [CrossRef]
- Robert, A.; Richard, S.; Colin, O.; Martinez, L.; De Francqueville, L. LES prediction and analysis of knocking combustion in a spark ignition engine. Proc. Combust. Inst. 2015, 35, 2941–2948. [Google Scholar] [CrossRef]
- Kawahara, N.; Tomita, E.; Sakata, Y. Auto-ignited kernels during knocking combustion in a spark-ignition engine. In Proceedings of the Combustion Institute, Heidelberg, Germany, 5–11 August 2006; Volume 31, pp. 2999–3006. [Google Scholar]
- Linse, D.; Kleemann, A.; Hasse, C. Probability density function approach coupled with detailed chemical kinetics for the prediction of knock in turbocharged direct injection spark ignition engines. Combust. Flame 2014, 161, 997–1014. [Google Scholar] [CrossRef]
- Boretti, A. Water injection in directly injected turbocharged spark ignition engines. Appl. Therm. Eng. 2013, 52, 62–68. [Google Scholar] [CrossRef]
- D’Adamo, A.; Berni, F.; Breda, S.; Lugli, M.; Fontanesi, S.; Cantore, G. A Numerical investigation on the potentials of water injection as a fuel efficiency enhancer in highly downsized GDI engines. SAE Tech. Paper Ser. 2015, 1. [Google Scholar] [CrossRef]
- Worm, J.; Naber, J.; Duncan, J.; Barros, S.; Atkinson, W. Water injection as an enabler for increased efficiency at high-load in a direct injected, boosted, SI engine. SAE Int. J. Engines 2017, 10, 951–958. [Google Scholar] [CrossRef]
- De Bellis, V.; Bozza, F.; Teodosio, L.; Valentino, G. Experimental and numerical study of the water injection to improve the fuel economy of a small size turbocharged SI engine. SAE Int. J. Engines 2017, 10, 550–561. [Google Scholar] [CrossRef]
- Iacobacci, A.; Marchitto, L.; Valentino, G. Water injection to enhance performance and emissions of a turbocharged gasoline engine under high load condition. SAE Int. J. Engines 2017, 10, 928–937. [Google Scholar] [CrossRef]
- Hoppe, F.; Thewes, M.; Baumgarten, H.; Dohmen, J. Water injection for gasoline engines: Potentials, challenges, and solutions. Int. J. Engine Res. 2015, 17, 86–96. [Google Scholar] [CrossRef] [Green Version]
- Brusca, S.; Galvagno, A.; Lanzafame, R.; Mauro, S.; Messina, M. Fuels with low octane number: Water injection as knock control method. Heliyon 2019, 5, e01259. [Google Scholar] [CrossRef] [PubMed] [Green Version]
- Farokhipour, A.; Hamidpour, E.; Amani, E. A numerical study of NOx reduction by water spray injection in gas turbine combustion chambers. Fuel 2018, 212, 173–186. [Google Scholar] [CrossRef]
- Ariemma, G.; Sabia, P.; Sorrentino, G.; Bozza, P.; De Joannon, M.; Ragucci, R. Influence of Water Addition on MILD Ammonia Combustion Performances and Emissions; Elsevier: Amsterdam, The Netherlands, 2020. [Google Scholar]
- Wang, J.; Duan, X.; Liu, Y.; Wang, W.; Liu, J.; Lai, M.-C.; Li, Y.; Guo, G. Numerical investigation of water injection quantity and water injection timing on the thermodynamics, combustion and emissions in a hydrogen enriched lean-burn natural gas SI engine. Int. J. Hydrogen Energy 2020, 45, 17935–17952. [Google Scholar] [CrossRef]
- Merola, S.S.; Irimescu, A.; Vaglieco, B.M. Influence of water injection on combustion identified through spectroscopy in an optical direct injection spark ignition engine. Fuel 2020, 273, 117729. [Google Scholar] [CrossRef]
- Thewes, M.; Baumgarten, H.; Scharf, J.; Birmes, G.; Hoppe, F. Water injection—High power and high efficiency combined. In Proceedings of the 25th Aachen Colloquium Automobile and Engine Technology, Aachen, Germany, 10–12 October 2016. [Google Scholar]
- Zhuang, Y.; Sun, Y.; Teng, Q.; He, B.; Chen, W.; Qian, Y. Investigation of water injection benefits on downsized boosted direct injection spark ignition engine. Fuel 2020, 264, 116765. [Google Scholar] [CrossRef]
- Zhen, X.; Wang, Y.; Xu, S.; Zhu, Y. Study of knock in a high compression ratio spark-ignition methanol engine by multi-dimensional simulation. Energy 2013, 50, 150–159. [Google Scholar] [CrossRef]
- Ghazal, O.H. Combustion analysis of hydrogen-diesel dual fuel engine with water injection technique. Case Stud. Therm. Eng. 2019, 13, 100380. [Google Scholar] [CrossRef]
- Serrano, J.; Jiménez-Espadafor, F.; López, A. Analysis of the effect of the hydrogen as main fuel on the performance of a modified compression ignition engine with water injection. Energy 2019, 173, 911–925. [Google Scholar] [CrossRef]
- Bratkov, A.A.; Azev, V.S.; Radchenko, E.D.; Gladkikh, V.A.; Livshits, S.M. Addition of water to motor fuels? One of the means for conservation and expansion of fuel resources. Chem. Technol. Fuels Oils 1980, 16, 731–735. [Google Scholar] [CrossRef]
- Wu, Y.-Y.; Chen, B.-C.; Hwang, J.-J.; Chen, C.Y. Performance and emissions of motorcycle engines using water-fuel emulsions. Int. J. Veh. Des. 2009, 49, 91. [Google Scholar] [CrossRef]
- Abu-Zaid, M. Performance of single cylinder, direct injection diesel engine using water fuel emulsions. Energy Convers. Manag. 2004, 45, 697–705. [Google Scholar] [CrossRef]
- Serrano, J.; Jiménez-Espadafor, F.; López, A. Analysis of the effect of different hydrogen/diesel ratios on the performance and emissions of a modified compression ignition engine under dual-fuel mode with water injection. Hydrogen-diesel dual-fuel mode. Energy 2019, 172, 702–711. [Google Scholar] [CrossRef]
- Bernal, J.L.L.; Ferreira, J.V. Model of water injection process during closed phase of spark ignition engine. Energy 2019, 174, 1121–1132. [Google Scholar] [CrossRef]
- Samec, N. Numerical and experimental study of water/oil emulsified fuel combustion in a diesel engine. Fuel 2002, 81, 2035–2044. [Google Scholar] [CrossRef]
- Chen, B.; Zhang, L.; Han, J.; Chen, X. Investigating the effect of increasing specific heat and the influence of charge cooling of water injection in a TGDI engine. Appl. Therm. Eng. 2019, 149, 1105–1113. [Google Scholar] [CrossRef]
- Miganakallu, N.; Yang, Z.; Rogóż, R.; Yang, Z.; Kapusta, Ł.J.; Christensen, C.; Barros, S.; Naber, J. Effect of water–methanol blends on engine performance at borderline knock conditions in gasoline direct injection engines. Appl. Energy 2020, 264, 114750. [Google Scholar] [CrossRef]
- Chen, Z.; He, J.; Chen, H.; Wang, L.; Geng, L. Experimental study of the effects of spark timing and water injection on combustion and emissions of a heavy-duty natural gas engine. Fuel 2020, 276, 118025. [Google Scholar] [CrossRef]
- Valero-Marco, J.; Lehrheuer, B.; López, J.J.; Pischinger, S. Potential of water direct injection in a CAI/HCCI gasoline engine to extend the operating range towards higher loads. Fuel 2018, 231, 317–327. [Google Scholar] [CrossRef]
- Zhao, R.; Zhang, Z.; Zhuge, W.; Zhang, Y.; Yin, Y. Comparative study on different water/steam injection layouts for fuel reduction in a turbocompound diesel engine. Energy Convers. Manag. 2018, 171, 1487–1501. [Google Scholar] [CrossRef]
- Arabaci, E.; Içingür, Y.; Solmaz, H.; Uyumaz, A.; Yilmaz, E.; Içıngür, Y.; Yılmaz, E. Experimental investigation of the effects of direct water injection parameters on engine performance in a six-stroke engine. Energy Convers. Manag. 2015, 98, 89–97. [Google Scholar] [CrossRef]
- Li, A.; Zheng, Z.-L.; Peng, T. Effect of water injection on the knock, combustion, and emissions of a direct injection gasoline engine. Fuel 2020, 268, 117376. [Google Scholar] [CrossRef]
- Liu, Y.-D.; Jia, M.; Xie, M.-Z.; Pang, B. Enhancement on a skeletal kinetic model for primary reference fuel oxidation by using a semidecoupling methodology. Energy Fuels 2012, 26, 7069–7083. [Google Scholar] [CrossRef]
Figure 1.
Comparison of the average pressure and temperature in the cylinder (n = 5500 rpm, equivalence ratio = 1.1, spark timing = −11 °CA): (a) the average pressure in the cylinder and (b) the average temperature in the cylinder.
Figure 1.
Comparison of the average pressure and temperature in the cylinder (n = 5500 rpm, equivalence ratio = 1.1, spark timing = −11 °CA): (a) the average pressure in the cylinder and (b) the average temperature in the cylinder.

Figure 2.
Comparison of the experimental and simulated results: (a) the average pressure results and (b) the ignition delay time [37].
Figure 2.
Comparison of the experimental and simulated results: (a) the average pressure results and (b) the ignition delay time [37].

Figure 3.
Average pressure and temperature at different spark timings (n = 5500 rpm, equivalence ratio = 1.1): (a) the average pressure in the cylinder and (b) the average temperature in the cylinder [37].
Figure 3.
Average pressure and temperature at different spark timings (n = 5500 rpm, equivalence ratio = 1.1): (a) the average pressure in the cylinder and (b) the average temperature in the cylinder [37].

Figure 4.
Instantaneous heat release rate and cumulative heat release for different spark timings (n = 5500 rpm, equivalence ratio = 1.1): (a) instantaneous heat release rate and (b) cumulative heat release.
Figure 4.
Instantaneous heat release rate and cumulative heat release for different spark timings (n = 5500 rpm, equivalence ratio = 1.1): (a) instantaneous heat release rate and (b) cumulative heat release.

Figure 5.
Monitoring point settings [37].
Figure 5.
Monitoring point settings [37].

Figure 6.
Peak-to-peak pressure at different monitoring points.

Figure 7.
Knock intensity (KI) at different spark timings.

Figure 8.
Distribution of various fields before sparking (n = 5500 rpm, equivalence ratio = 1.1, spark timing = −21 °CA): (a) temperature field, (b) pressure field, (c) turbulent kinetic energy distribution, and (d) equivalence ratio distribution.
Figure 8.
Distribution of various fields before sparking (n = 5500 rpm, equivalence ratio = 1.1, spark timing = −21 °CA): (a) temperature field, (b) pressure field, (c) turbulent kinetic energy distribution, and (d) equivalence ratio distribution.

Figure 9.
Flame propagation diagram during knock (n = 5500 rpm, equivalence ratio = 1.1, spark timing = −21 °CA).
Figure 9.
Flame propagation diagram during knock (n = 5500 rpm, equivalence ratio = 1.1, spark timing = −21 °CA).

Figure 10.
Equivalent ratio and temperature distributions before the spark timing (n = 5500 rpm, equivalence ratio = 1.1, spark timing = −21 °CA): (a) equivalence ratio and (b) temperature.
Figure 10.
Equivalent ratio and temperature distributions before the spark timing (n = 5500 rpm, equivalence ratio = 1.1, spark timing = −21 °CA): (a) equivalence ratio and (b) temperature.

Figure 11.
Water distribution at different water injection temperatures (n = 5500 rpm, equivalence ratio = 1.1, spark timing = −21 °CA).
Figure 11.
Water distribution at different water injection temperatures (n = 5500 rpm, equivalence ratio = 1.1, spark timing = −21 °CA).


Figure 12.
Pressure at each monitoring point under different water injection temperatures (n = 5500 rpm, equivalence ratio = 1.1, spark timing = −21 °CA).
Figure 12.
Pressure at each monitoring point under different water injection temperatures (n = 5500 rpm, equivalence ratio = 1.1, spark timing = −21 °CA).


Figure 13.
PPmax of each monitoring point.

Figure 14.
KI values for different water injection temperatures.

Figure 15.
The average in-cylinder pressures for different water injection temperatures.

Figure 16.
P–V diagrams and cycle energyat different water injection temperatures: (a) the P–V diagram cycles and (b) the cycle energies.
Figure 16.
P–V diagrams and cycle energyat different water injection temperatures: (a) the P–V diagram cycles and (b) the cycle energies.

Figure 17.
The quantity of NOx under different working conditions (n = 5500 rpm, equivalence ratio = 1.1): (a) the quantity of NOx with different crank angles and (b) the NOx quantity.
Figure 17.
The quantity of NOx under different working conditions (n = 5500 rpm, equivalence ratio = 1.1): (a) the quantity of NOx with different crank angles and (b) the NOx quantity.

Figure 18.
The temperature field for different injection temperatures (n = 5500 rpm, equivalence ratio = 1.1).
Figure 18.
The temperature field for different injection temperatures (n = 5500 rpm, equivalence ratio = 1.1).


Figure 19.
The quality of unburned hydrocarbons (UHCs) under different working conditions (n = 5500 rpm, equivalence ratio = 1.1): (a) the quantity of HCs at different crank angles and (b) the quantity of UHCs produced with different water injection temperatures.
Figure 19.
The quality of unburned hydrocarbons (UHCs) under different working conditions (n = 5500 rpm, equivalence ratio = 1.1): (a) the quantity of HCs at different crank angles and (b) the quantity of UHCs produced with different water injection temperatures.

Figure 20.
The quantity of soot generated under different working conditions (n = 5500 rpm, equivalence ratio = 1.1): (a) the soot quantity at different crank angles and (b) the soot quantity produced with different water injection temperatures.
Figure 20.
The quantity of soot generated under different working conditions (n = 5500 rpm, equivalence ratio = 1.1): (a) the soot quantity at different crank angles and (b) the soot quantity produced with different water injection temperatures.

Figure 21.
The quantity of CO under different working conditions (n = 5500rpm, equivalence ratio = 1.1): (a) the CO quality at different crank angles and (b) the CO quantity produced with different water inlet temperatures.
Figure 21.
The quantity of CO under different working conditions (n = 5500rpm, equivalence ratio = 1.1): (a) the CO quality at different crank angles and (b) the CO quantity produced with different water inlet temperatures.


Table 1.
Basic parameters of the gasoline direct injection (GDI) engine [37].
Table 1.
Basic parameters of the gasoline direct injection (GDI) engine [37].
| Parameter | Numerical Value |
|---|---|
| Number of cylinders | 1 |
| Bore | 86 mm |
| Stroke | 86 mm |
| Compression ratio | 9.5 |
| Connecting rod length | 142.8 mm |
| Displacement | 0.5 L |
Table 2.
Operating conditions of the GDI engine [37].
Table 2.
Operating conditions of the GDI engine [37].
| Parameter | Numerical Value |
|---|---|
| Rotating speed | 5500 rev/min |
| Fuel injection time | −337.99 °CA |
| Fuel injection duration | 160.908 °CA |
| Injection quantity | 82.31 mg |
| Spark timing | −11 °CA |
Table 3.
Submodels of the numerical simulation [37].
Table 3.
Submodels of the numerical simulation [37].
| Model | Setup Used |
|---|---|
| Turbulence model | k-ε double equation model |
| Fuel broken model | RT–KH (Kehrin–Helmholz and Reyleigt–Taylor) broken model |
| Collision model | NTC (no time counter collision) model |
| Fuel wall model | Wall film model |
| Combustion model | Sagemodel |
| NOx model | Extended Zeldovich model |
| Soot model | Hiroyasu model |
Table 4.
Boundary conditions [37].
Table 4.
Boundary conditions [37].
| Parameter | Numerical Value |
|---|---|
| Temperature at the top of the piston | 585.0 K |
| Cylinder liner wall temperature | 485.0 K |
| Temperature of combustion chamber wall | 550.0 K |
| Temperature of exhaust wall | 1100.0 K |
| Exhaust valve wall temperature | 1100.0 K |
| Inlet wall temperature | 308.0 K |
| Temperature of intake valve wall | 800.0 K |
| Spark plug temperature | 1050.0 K |
| Static pressure of exhaust port | 101,325 Pa |
© 2020 by the authors. Licensee MDPI, Basel, Switzerland. This article is an open access article distributed under the terms and conditions of the Creative Commons Attribution (CC BY) license (http://creativecommons.org/licenses/by/4.0/).
Share and Cite
MDPI and ACS Style
Li, A.; Zheng, Z. Effect of Spark Ignition Timing and Water Injection Temperature on the Knock Combustion of a GDI Engine. Energies 2020, 13, 4931. https://doi.org/10.3390/en13184931
AMA Style
Li A, Zheng Z. Effect of Spark Ignition Timing and Water Injection Temperature on the Knock Combustion of a GDI Engine. Energies. 2020; 13(18):4931. https://doi.org/10.3390/en13184931
Chicago/Turabian StyleLi, Aqian, and Zhaolei Zheng. 2020. "Effect of Spark Ignition Timing and Water Injection Temperature on the Knock Combustion of a GDI Engine" Energies 13, no. 18: 4931. https://doi.org/10.3390/en13184931
Note that from the first issue of 2016, this journal uses article numbers instead of page numbers. See further details here.