Combustion Characteristics of Hydrochar and Pyrochar Derived from Digested Sewage Sludge
by
 , and
, and
Pablo J. Arauzo
1,*, 
María Atienza-Martínez
2,3,
Javier Ábrego
2,
Maciej P. Olszewski
1,
Zebin Cao
1 and
Andrea Kruse
1 1
Department of Conversion Technologies of Biobased Resources, Institute of Agricultural Engineering, University of Hohenheim, Garbenstrasse 9, 70599 Stuttgart, Germany
2
Thermochemical Processes Group (GPT), Aragón Institute for Engineering Research (I3A), Universidad de Zaragoza, Edificio I+D, C/Mariano Esquillor s/n, 50018 Zaragoza, Spain
3
Grupo de Reactores Químicos y Procesos para la Valorización de Recursos Renovables, Departamento de Ciencias, Edificio de los Acebos, Universidad Pública de Navarra, Campus de Arrosadía, E-31006 Pamplona, Spain
*
Author to whom correspondence should be addressed.
Energies 2020, 13(16), 4164; https://doi.org/10.3390/en13164164
Submission received: 3 July 2020
/
Revised: 6 August 2020
/
Accepted: 8 August 2020
/
Published: 12 August 2020
(This article belongs to the Special Issue Hydrothermal Technology in Biomass, Utilization & Conversion II)
Abstract
:In this paper, hydrochars and pyrochars were produced at 260 °C under different residence times (2 and 4 h) using anaerobic digested sewage sludge (SSL) as initial feedstock. The effect of reaction time on the fuel properties of hydrochars and pyrochars was evaluated. Moreover, the combustion kinetics of raw SSL and the derived pyrochars and hydrochars without coal blending were determined at two different air flows (20 and 90 mL/min) and compared. In the same conditions, the yield of hydrochar was significantly lower than that of pyrochar, confirming the different reaction pathways followed in each process. The results showed hydrochars have lower carbon recovery and energy yield than pyrochars, making the latter more suitable for energy purposes. The thermogravimetric combustion study showed that both thermochemical treatments increased the ignition temperature but decreased the burnout temperature, which results in higher stability during handling and storage. However, raw SSL is better for combustion than hydrochar according to the combustibility index. In addition, the kinetic study showed that the activation energy of the combustion of biochars, especially pyrochar, is lower than that of raw SSL, which is advantageous for their combustion.
1. Introduction
The production of sewage sludge (SSL) as a by-product in wastewater treatment plants is still increasing due to human and industrial activity. More than 8 million tons (dry basis) of sewage sludge from urban wastewater are generated annually in the 27 European Union (EU) countries, of which approximately 20% corresponds to Germany [1]. Moreover, the huge volume of SSL might contain high levels of pollutants (i.e., heavy metals, hormones) [2,3], so it is necessary to find an environmentally sustainable solution to this increasing social problem. Furthermore, the current environmental legislation in the EU applicable to SSL is becoming increasingly strict regarding its land application, which has so far been the most common disposal method for this residue. The organic matter present in SSL makes it suitable as an energy resource [4]. One of the technologies for the treatment of SSL is anaerobic digestion (AD), which is considered as a biological treatment. In recent years (2011 to 2018), Germany has promoted the construction of biogas plants for AD treatment with the construction of 3212 plants bearing an electric capacity of 2937 MW [5]. During AD, parts of the organic matter present in SSL are degraded by microorganisms in the absence of oxygen. However, the residue after AD, usually referred to as digestate, presents similar problems to SSL itself for its proper management.
Therefore, the treatment of digested SSL by thermochemical treatment, such as mono-incineration at high temperatures, has been considered suitable due to the short treatment times and the small volume of the final product. However, the low caloric value of SSL and its high water and ash content entail difficulties, such as low temperature and flame stability, sintering, agglomeration or slugging, amongst others. In order to overcome these issues, co-combustion with higher heating value fuels, such as coal, has been proposed at an industrial scale [6]. On the other hand, renewable thermochemical treatments (hydrothermal carbonization and pyrolysis) are presented as a pretreatment before the mono-incineration [7,8]. Moreover, it has been reported that the thermochemical pretreatment of SSL leads to a more stable co-combustion behavior [9]. Pyrolysis involves heating organic materials under a non-oxidizing atmosphere at moderate temperatures [10]. When performed at temperatures below 300 °C, it is also usually referred to as torrefaction and yields a carbonaceous solid with improved fuel properties as the main product, called pyrochar. The initial high moisture content in digested SSL entails an unavoidable drying step prior to pyrolysis which, in turn, results in high energy consumption with the associated substantial economic costs. However, this high moisture content can be harnessed for emerging technologies, such as hydrothermal carbonization (HTC) [11]. HTC is a wet thermochemical process carried out at temperatures from 180 °C to 260 °C and at autogenous pressure. Water, under subcritical conditions, promotes certain chemical reactions, such as ionic reactions [12,13]. The main product of HTC is a lignite-like carbonaceous solid, referred to as hydrochar. After both treatments (pyrolysis and HTC), the final product is biologically sterilized due to the temperatures applied and it shows a hydrophobic character. Regarding the operating temperature, a compromise between the yield of biochar and its fuel properties must be reached.
Several studies reported the co-combustion of SSL with coal or other fuels, focusing on different aspects, since it constitutes a promising management method for wastes such as SSL. Fu et al. [14] studied the termochemical, kinetic and heavy metals emission behavior during the co-combustion of different blends of SSL with coal slurry. These authors observed synergetic effects during the co-combustion at a low temperature, which improved the ignition performance and lowered the activation energy for the combustion of coal slurry. The presence of SSL increased the volatilization ratios of heavy metals. Kumar et al. [15] reported the effect of burning municipal SSL with different crop residues in a combustor under air-fired and oxygen-enriched conditions. This study concluded that using 25% SSL as a co-fuel leads to controlled combustion, while using 50% SSL is still challenging due to the formation of agglomerates. Gao et al. [16] studied the co-firing of different blends of SSL and hydrochar with coal. Hydrothermal carbonization was carried out for converting wet SSL into a carbon-like material. The formation of two different chars was observed, and it was necessary to remove the secondary char (higher oxidative reactivity) to reduce the segregation of the fuel blends. Thus, the present study addresses the determination and comparison of the fuel properties and combustion kinetics of pyrochar and hydrochar without coal blending produced from digested SSL in comparable conditions (260 °C) and under different residence times. The results are also compared to those obtained directly for the combustion characteristics of raw SSL.
2. Materials and Methods
2.1. Raw Material
Sewage sludge (SSL) was collected from a municipal wastewater treatment plant located in Stuttgart, Germany. SSL was generated from the treatment of household wastewater followed by an anaerobic digestion and dewatering process to ~80 wt.% moisture content. The SSL was stored at −24 °C.
2.2. Hydrochar and Pyrochar Production
Hydrochars were produced in an experimental setup previously described by Arauzo et al. [17]. The batch reactor (250 mL volume) was fed with 140 g of raw SSL with ~80 wt.% water content. HTC was performed at 260 °C with two different residence times (2 and 4 h). The selection of only 260 °C was due to the facts that 260 °C is the limit between HTC and hydrothermal liquefaction and the produced hydrochar has higher hydrophobicity than that produced at lower temperatures [13]. The experiments were terminated by quenching the reactor in a bucket with cold water for 30 min and the obtained slurry was filtered at room temperature. Hydrochars were dried at 105 °C and the process waters were frozen at −24 °C. The produced dry hydrochars were ground and sieved to particle sizes ranging between 150 µm and 250 μm. All sieved samples were labeled with the abbreviation Hc, followed by the residence time (e.g., Hc-2).
Pyrochars were produced in a previously described muffle furnace [18]. The crucible was filled with 100 g of raw SSL with ~80 wt.% water content. Pyrolysis was performed at 260 °C with two different residence times (2 and 4 h). Once the reaction time was accomplished, the samples were cooled down under a nitrogen flow of 20 mL/min. The produced pyrochar was then treated according to the procedure for the hydrochars. Pyrochar samples were labeled by the abbreviation Pc followed by the residence time (e.g., Pc-2). All experiments of hydrothermal carbonization and pyrolysis were performed in triplicate.
2.3. Physical and Chemical Characterization of Raw SSL, Hydrochar and Pyrochar
The characterization of SSL, hydrochars and pyrochars are shown in Table 1 and Table 2. The moisture (M) and volatile matter (VM) contents of raw SSL, hydrochars and pyrochars were determined following the standards DIN EN 14774-3 and DIN EN 51720:1978-06. The ash content of raw SSL was determined according to DIN EN 14775:2010-04, while the ash contents of the hydrochar and pyrochar were determined according to DIN 51719. Fixed carbon (FC) content was calculated according to Equation (1). Elemental analysis (C, H, N, S) was conducted by an elemental analyzer (Eurovector S.P.A, Milano, Italy), while the determination of O (wt.%) content was calculated by difference using Equation (2). The yield of hydrochar/pyrochar, fuel ratio (FR), and higher heating value (HHV, MJ/kg) [19] were calculated by Equations (3)–(5), respectively.
where C, H, N, O and S are the dry basis weight percentages of carbon, hydrogen, nitrogen, oxygen and sulfur in the solid samples, respectively.
The energy densification (Ed), energy yield (Ey), C recovery (dried ash free) and ash recovery of the biochars were calculated according to Equations (6)–(9):
Solid and liquid products of the obtained suspensions were separated by decantation prior to the measurements. The pH of the solids was measured in mixtures of each solid with deionized water in a ratio of 1 g: 20 mL that were agitated for 2 h. Measurements were executed by an HACH HQ40d multi-parameter pH-meter equipped with an Intellical™ PHC101 pH probe.
Fourier transform infrared spectroscopy (FTIR) was used to characterize the functional groups on the surface of the raw SSL, hydrochars and pyrochars. The spectra were recorded in the range of 4000 to 400 cm−1 by averaging 24 scans. All IR data were acquired using a Bruker ALPHA II PLATINUM-ATR.
2.4. Thermogravimetric Analysis
The combustion behavior of raw SSL, hydrochar and pyrochar was studied in a Netzsch STA 449 Jupiter® F5 thermogravimetric analyzer (TGA). Around 9 mg of each sample were placed into an Al2O3 crucible. Then, it was heated up from 105 °C to 950 °C, at four different heating rates (β = dT/dt = 10, 20, 30 and 40 °C/min) in synthetic air (flow rate of 20 and 90 mL (STP)/min). The TGA experiments were done in duplicate for each solid to ensure the reliability of the measurement.
2.4.1. Calculation of Combustion Parameters
Three combustion temperatures of raw SSL, pyrochar and hydrochar were determined by thermogravimetry (TG) and derivative thermogravimetry (DTG): ignition temperature (Ti), maximum temperature (Tm) and burnout temperature (Tb). Ti is the temperature at which fuels start to burn and is defined as the temperature at which DTG rises by 1 wt.%/min. Tm is the temperature at which the maximum weight loss rate due to volatilization is observed. Tb is the temperature associated with a complete oxidation reaction corresponding to a DTG decrease of 1 wt.%/min at the end of the combustion profile [9,20].
2.4.2. Calculation of Comprehensive Combustibility Index (S)
The comprehensive combustibility index (S), related to ignition and burn-out, was determined according to Equation (10) to evaluate the combustion reactivity of the samples [21].
where
- (dw/dt) max = maximum rate of weight loss (wt.%/min)
- (dw/dt) mean = mean rate of weight loss (wt.%/min)
2.4.3. Calculation of Kinetic Parameters
TGA studies can be conducted in order to determine the combustion kinetics of raw SSL, hydrochar and pyrochar. The reaction kinetics of heterogeneous solid-state reactions may be described by expressions Equations (11) and (12):
where
- f (α) = general expression of the reaction mechanism
- n = order of reaction
- α = thermal conversion fraction (Equation (13))
The rate constant k follows the Arrhenius equation (Equation (13)):
where
- A = pre-exponential factor (min−1)
- EA = activation energy of the reaction (kJ/mol)
- R = gas constant (8.314 J/(mol K))
- T = temperature (K)
The combination and rearrangement of Equations (11)–(14) can be expressed in an integral form as Equation (15):
where g (α) is the integral function of conversion and β is the heating rate expressed as .
The Kissenger–Akahira–Sunose method (KAS) is an isoconversional method based on the following equation (Equation (15)):
The activation temperature (TA, K) was calculated according to the equation used previously by Olszewski et al. [22] (Equation (17)).
3. Results and Discussion
3.1. Yield of Biochar and Higher Heating Value
The yields of biochar are shown in Table 1. In both thermochemical processes (HTC and pyrolysis), the degradation of the main components of the biomass (hemicellulose, cellulose and lignin) takes place. However, at the same temperature, the yield of hydrochar (c.a. 71 wt.%) is lower than that of pyrochar (c.a. 88 wt.%). While in HTC the conversion of the raw SSL into hydrochar is caused by complex reaction mechanisms (hydrolysis, dehydration, decarboxylation, polymerization) [13,23,24], the conversion of SSL to pyrochar in a fixed bed reactor is limited by the particle size and consequently by the diffusion mechanism [25]. Table 1 shows that the residence time has no effect on the solid yield, regardless of the thermochemical process applied.
The HHV (MJ/kg) is one of the most characteristic parameters to evaluate the solid fuel properties. As mentioned before, the HHV was calculated according to Equation (5), considering the ultimate analysis in Table 2. The HHV of chars is slightly lower than that of raw SSL. This trend is similar to the HHV typically found after carbonization processes using different types of biomass [11,26,27]. A possible explanation might be that the ash content in carbonized materials is substantially higher than in the raw materials (Table 2). The HHV calculations on a dry and ash free basis (daf) are also shown in Table 1 and support this hypothesis. The HHV values of pyrochar are in the same range as those reported by a previous study of Atienza et al. [28]. In their study, they torrefied anaerobically digested and thermally dried SSL at temperatures between 250 °C and 300 °C and obtained char with an HHV between 19.5 and 32.8 MJ/kg, while the HHV of the raw SSL was 23.5 MJ/kg.
Table 1 also shows that the HHV (daf) of hydrochar is around 22% higher than that of the raw SSL. However, pyrochar shows a slightly lower HHV (daf) (c.a. 1%) than the raw SSL. One of the possibilities that explains this higher HHV (daf) of hydrochar is that, during HTC, one of the main organic compounds formed in the liquid phase, as a consequence of the degradation of cellulose and hemicellulose, is 5-Hydroxymethylfurfural (22.06 MJ/kg). Hydrochar is formed by a core with similar properties to pyrochar but the outer layer has a (pseudo-) aromatic structure [22] which might explain the difference in the HHV. On the other hand, the higher amount of ash in the hydrochar compared to the pyrochar (Table 2) forces this increment in the HHV (daf). Furthermore, the lower HHV per volume of chars compared to the raw SSL is also reflected in the Ed (Table 1), which, for both, is lower than 1.
3.2. Carbon (daf) and Ash Recovery, Energy Yield
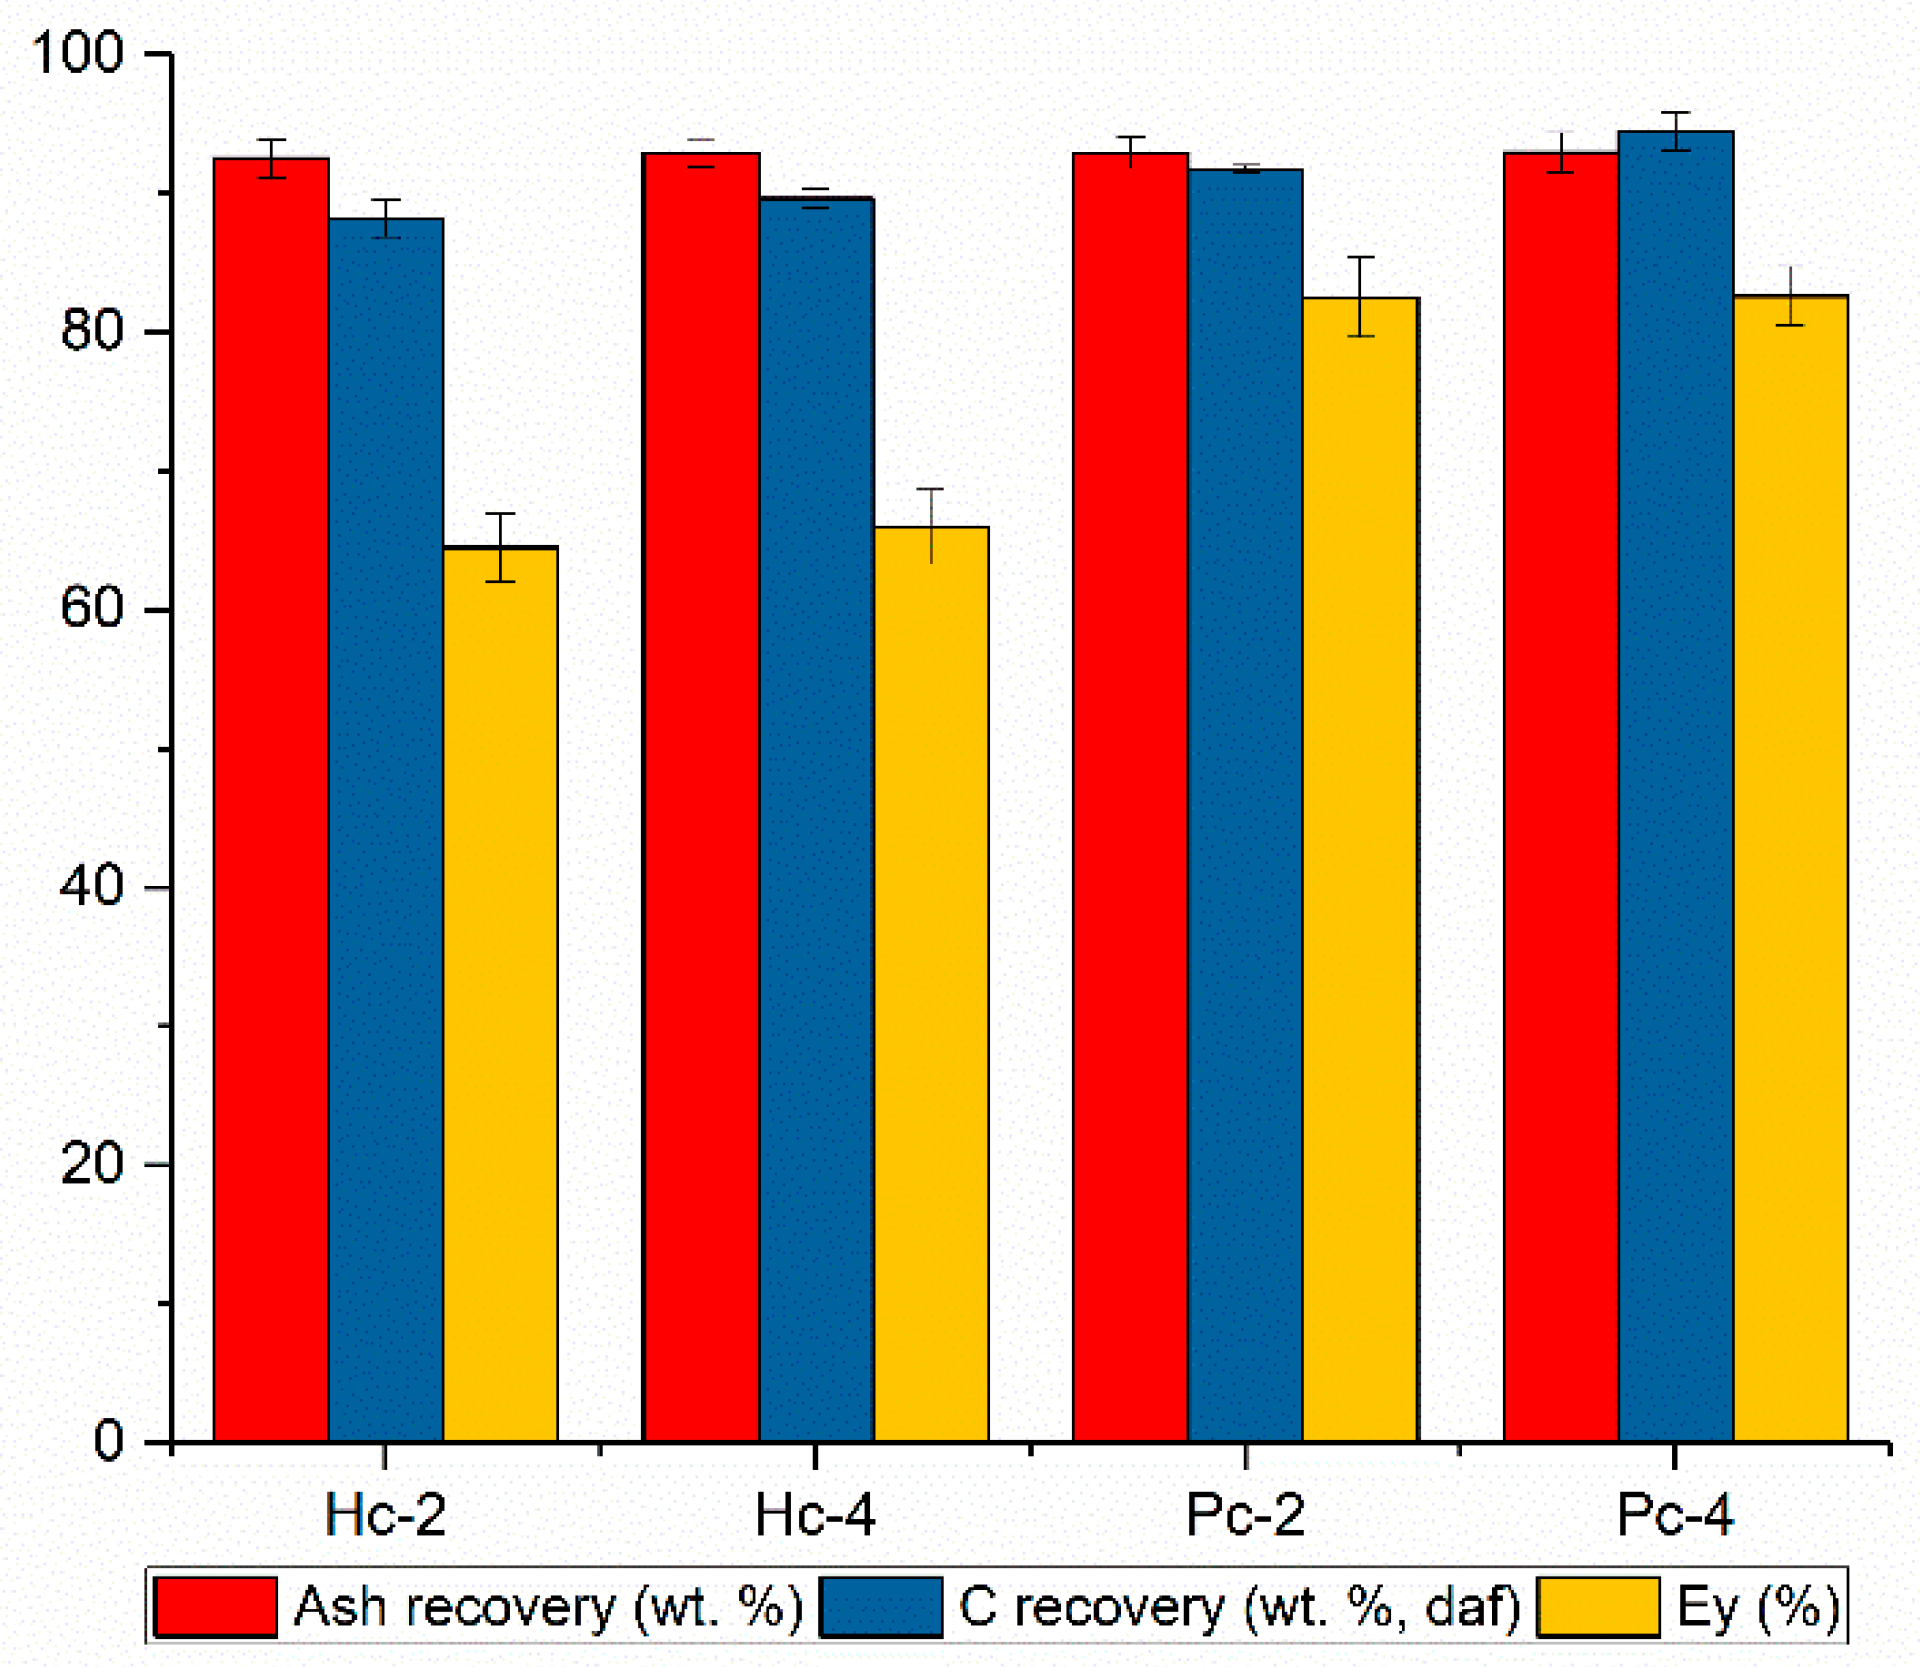
The carbon recovery (daf) in the produced chars is shown in Figure 1. As displayed, pyrochars have a higher carbon recovery (91.7% and 94.5%) than hydrochars (88.2% and 89.6%) because more aromatic structures are formed during pyrolysis [29]. This agrees with the values of Table 2, which shows that the C content in pyrochars is higher than in hydrochars. In any case, a great amount of carbon is retained in the solid after both thermochemical treatments. Similar carbon recovery yields were obtained in a previous study carried out by Lin et al. [30].
The ash recovery from both processes keeps constant for the produced biochars. It is proved that even though the yield of pyrochar is higher than that of hydrochar, a lower ash content is found in the final carbonaceous material. In addition, the Ey (%), which evaluates the HHV of biochar and the HHV of raw SSL with the yield of biochar (Equation (7)), is higher for pyrochar compared to hydrochar. Consequently, the higher Ey (%) of pyrochar implies that it is more suitable for energy purposes than hydrochar.
3.3. Proximate and Ultimate Analyses
The reduction of the solid mass is mainly a consequence of the reduction of the VM content of the produced hydrochar and pyrochar (Table 2) compared to the raw SSL. Comparing both chars, the reduction in the VM is higher in the produced hydrochar (ca. 40.7%) than in pyrochar (ca. 18.4%). An explanation for the low VM content in hydrochar is that VM, which consists of aliphatic hydrocarbons, carboxylic groups and carbohydrates [31], migrates to the liquid and gas phases (mainly as CO2) because of the aforementioned reaction mechanism, whereas, in the pyrolysis, the diffusion of the VM is limited by operating in a fixed bed (batch) reactor. Another possibility for the lower VM content of hydrochar is, that, during the HTC, the degradation of hemicellulose and cellulose occurs at lower temperatures (160–180 °C) than during the pyrolysis because of the presence of subcritical water [32,33]. Such a reduction in the VM content increases the FC associated to the carbonization process [16,34,35]. The FC found in the produced chars is similar due to being three times bigger than in raw SSL (Table 2). Residence time does not show any effect on the ultimate and proximate analyses of hydrochar. However, a longer residence time is associated with a slight increase in the FC of pyrochar (Table 2), which was also found in previous studies [11]. This reduction of the VM content and increase in the FC content implies the improvement of the FR for energy purposes (Table 1).
Table 2 shows the high ash content in the raw SSL (46.7 wt.%). The ash content increases after both thermochemical processes due to no degradation of the mineral matter at these conditions [4]. In the case of hydrochar, the mentioned increase in ash content is associated with the destruction of the VM and migration to the liquid phase (e.g., organic acids, furans) [36]. Additionally, the changes in pH during the HTC lead to the precipitation of inorganic compounds as salts on the surface of the hydrochar [27,37]. This is also in agreement with a previous study from Ovsyannikova et al. [38] that shows that digested SSL contains many different salts, which usually precipitate in HTC conditions. The C content does not change significantly, despite the increment of the FC of the produced chars (Table 2). It is observed that the C content in the produced hydrochar is lower than in the initial SSL (Table 2). The high operating temperature of the HTC leads to the migration of the initial C to the liquid and/or gas phase as hydrocarbons [39].
Table 2 shows that the only effect of increasing the residence time is observed for pyrochars, with the decrement of the VM and the increase in the FC. The hydrochar contains 55.3% less oxygen than the initial SSL (Table 2). This reduction of the oxygen content and, to a lesser extent, of the hydrogen content is related to the degradation of the VM. The higher reduction of the oxygen content of hydrochar in comparison to pyrochar is also due to the fact that, during HTC, oxygen and hydrogen are removed by dehydration and decarboxylation reactions [13]. By the decomposition and cracking of raw SSL, the oxygen and hydrogen compounds are removed during pyrolysis [40]. It can be seen in Table 2 that the initial nitrogen content (N wt.%) is reduced by 32% after HTC, but the N content in the produced pyrochar is similar to that in the raw SSL. This is in contrast to a previous study [41], which states that raw SSL usually contains high organic N amounts in the form of proteins, which start to decompose at 160 °C. During HTC, proteins are hydrolyzed and dissolved in the liquid (NO2−, NO3−) and gas phase (NH3). The sulfur (S) content also decreases after both thermochemical treatments, but in two different pathways. In the case of HTC, the S content decreases because of the leaching effect of the subcritical conditions to the water phase. On the other hand, S migrates to the gas phase as H2S during pyrolysis [28,42]. The reduction of the N content, especially after HTC, and the S content, especially after pyrolysis, implies the reduction of the formation of NOx and SOx during the further combustion of the produced chars.
The evolution of the degree of coalification is represented in the van Krevelen diagram (Figure 2), where the O/C and H/C atomic ratios of raw SSL, the produced hydrochar and pyrochar are compared with those of typical coals (i.e., anthracite, bituminous, lignite and peat). As expected [35], the highest O/C and H/C atomic ratios are found for raw SSL. During the HTC and pyrolysis processes, the initial carbohydrates are converted into carbon-rich material via dehydration and decarboxylation pathways. The H/C atomic ratio of produced hydrochar and pyrochar at 260 °C for 2 and 4 h are in a range of values similar to those reported in previous studies [43]. On the other hand, there is a notable difference between the O/C atomic ratios of produced hydrochar and pyrochar. This implies that pyrochar formation is mainly influenced by dehydration reactions, while hydrochar formation proceeds by both dehydration and decarboxylation [44]. Consequently, the atomic ratios of hydrochars are close to those of lignite, while those of pyrochar are within the peat region. According to Hammes et al. [45], char with dominant aromatic carbon has low H/C and O/C atomic ratios, 0.7 and 0.3, respectively. Then, as expected, hydrochar is not within this range of values because during HTC hydrochar tends to form mainly aliphatic compounds [46]. Additionally, the low temperatures applied for pyrolysis in this study are not high enough to increase the aromatic structure of the pyrochars [47].
3.4. The pH of Biochars
The pH of the aqueous solution of the different solid materials indicates that the effect of each thermochemical treatment on the pH was found to be similar (Table 2). All solids showed a pH close to 7. While the pH of produced biochars is slightly acidic, the initial SSL exhibits a slightly basic pH. This decrement of the pH can be associated with the formation of organic acids during the hydrolysis of the biomass. In particular, the increment of the reaction time produced a decrement of pH since hydrolysis is the first reaction mechanism [48].
3.5. FTIR Analysis
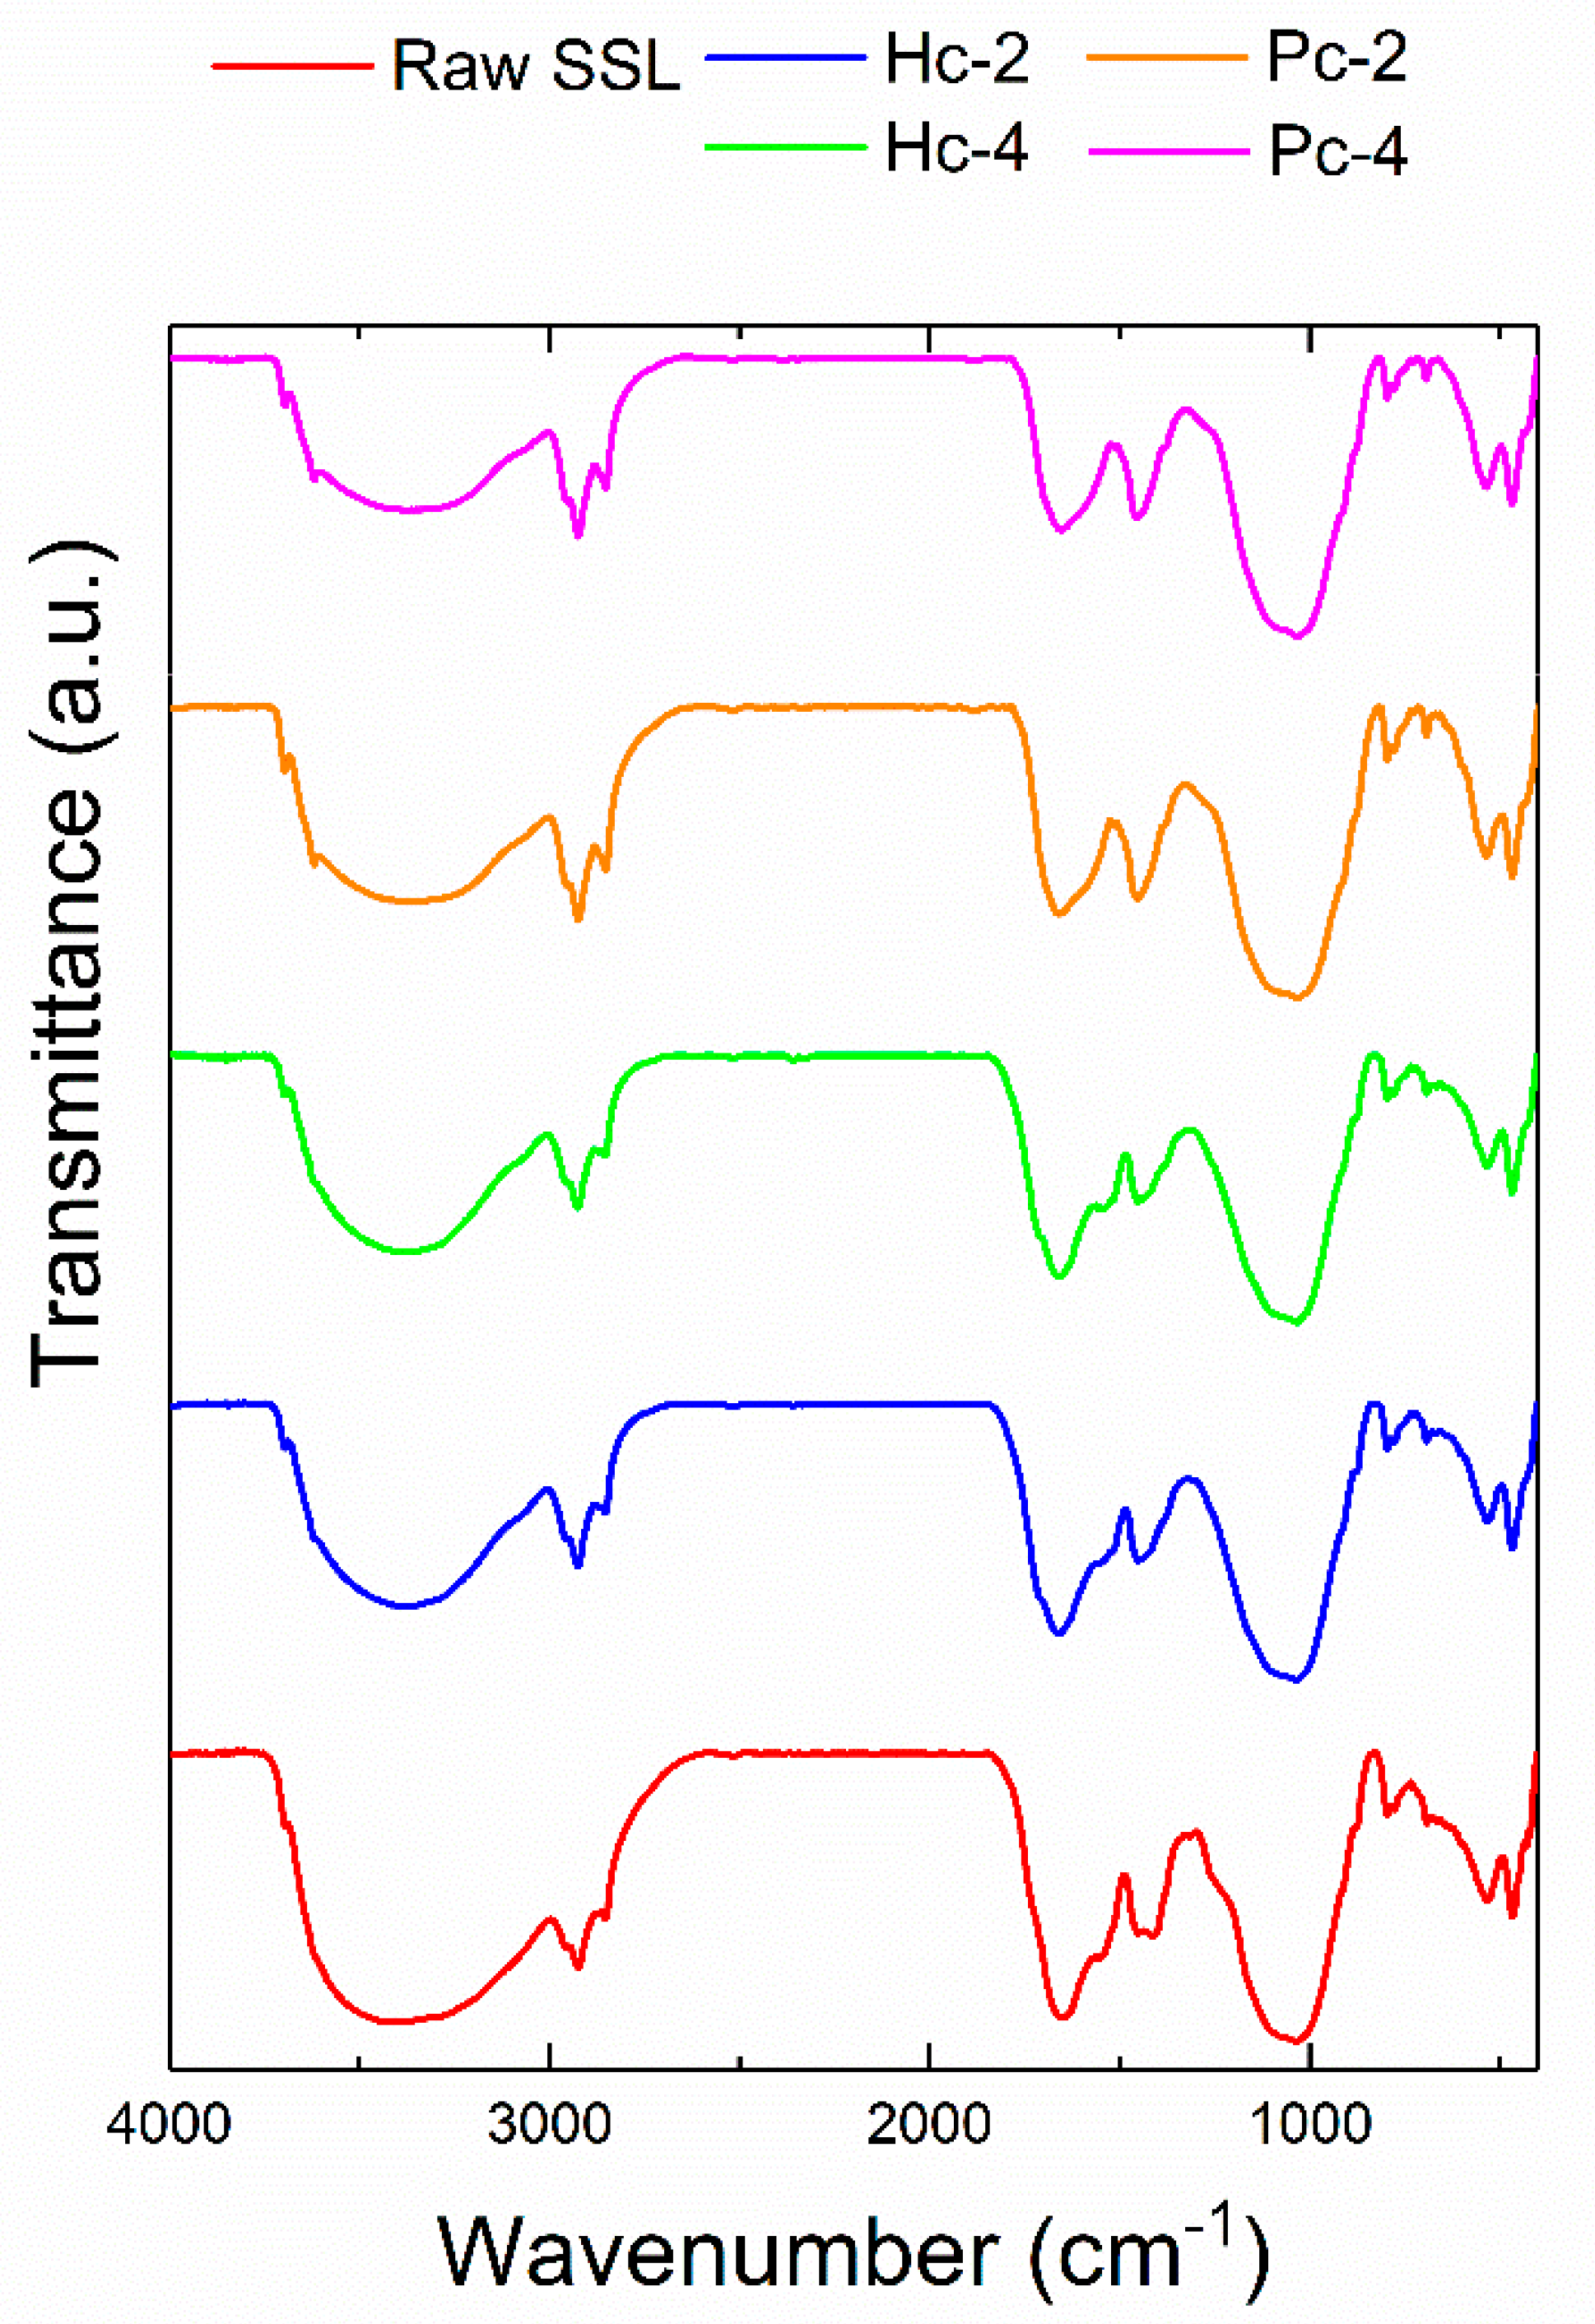
Figure 3 shows the FTIR spectra for raw SSL, hydrochar and pyrochar obtained at the same temperature but different residence times. The transmittance peak at wavenumber 3420 cm−1 is usually associated with the O-H stretching vibration in the hydroxyl and carboxyl groups [49] of cellulose present in the raw SSL. As shown in Figure 3, for Hc-4, this peak has a lower intensity than that in the raw SSL and the other produced chars, which could be due to the dehydration mechanism reaction that takes place mainly in these operating treatment conditions. Moreover, this low peak intensity implies that hydrochar produced in the longest residence time has hydrophobic properties due to the loss of –OH functional groups. On the other hand, the hydrolysis of proteins in the raw SSL and the consequent formation of amides during pyrolysis and HTC are the reasons that this peak is also associated with the N-H stretching vibrations [50]. The band between 3000 cm−1 and 2800 cm−1 is ascribed to asymmetric –CHx (2925 cm−1) and symmetric –C-H (2850 cm−1) aliphatic carbons in methylene groups [51]. There are no obvious differences between the aliphatic groups present after both thermochemical processes and the originals found in the raw SSL. This is corroborated by the peak at a wavelength of 1432 cm−1 associated with the scissoring vibrations of CH2 [52]. The intensity of the band between 1645 cm−1 and 1120 cm−1 is reduced in the biochars. The peak observed at 1645 cm−1 was ascribed to the stretching vibration of the carbonyl group in ketones and amides, whereas the peak at 1514 cm−1 describes the asymmetric stretching mode. Here, the asymmetric stretching mode for carbonyls decreases, especially for hydrochars, because of the decarboxylation reactions and the production of CO2. The transformation of some nitrogen-containing functional groups from the raw SSL to the final biochars is shown in the region between 1575 cm−1 and 1525 cm−1. Those peaks are reduced in the produced hydrochar and pyrochar because of the deamination of proteins [53] and the release of inorganic-N from the raw SSL to the process water [54]. The high initial ash content and the even higher ash content in the biochars (Table 2) are reflected in the FTIR peak at around 1000 cm−1. This peak may be attributed to the Si-O vibration, which reveals the presence of SiO2, usually found in the ash [55].
3.6. Combustion Behavior of Raw SSL and Produced Biochars
3.6.1. Thermogravimetric Analysis
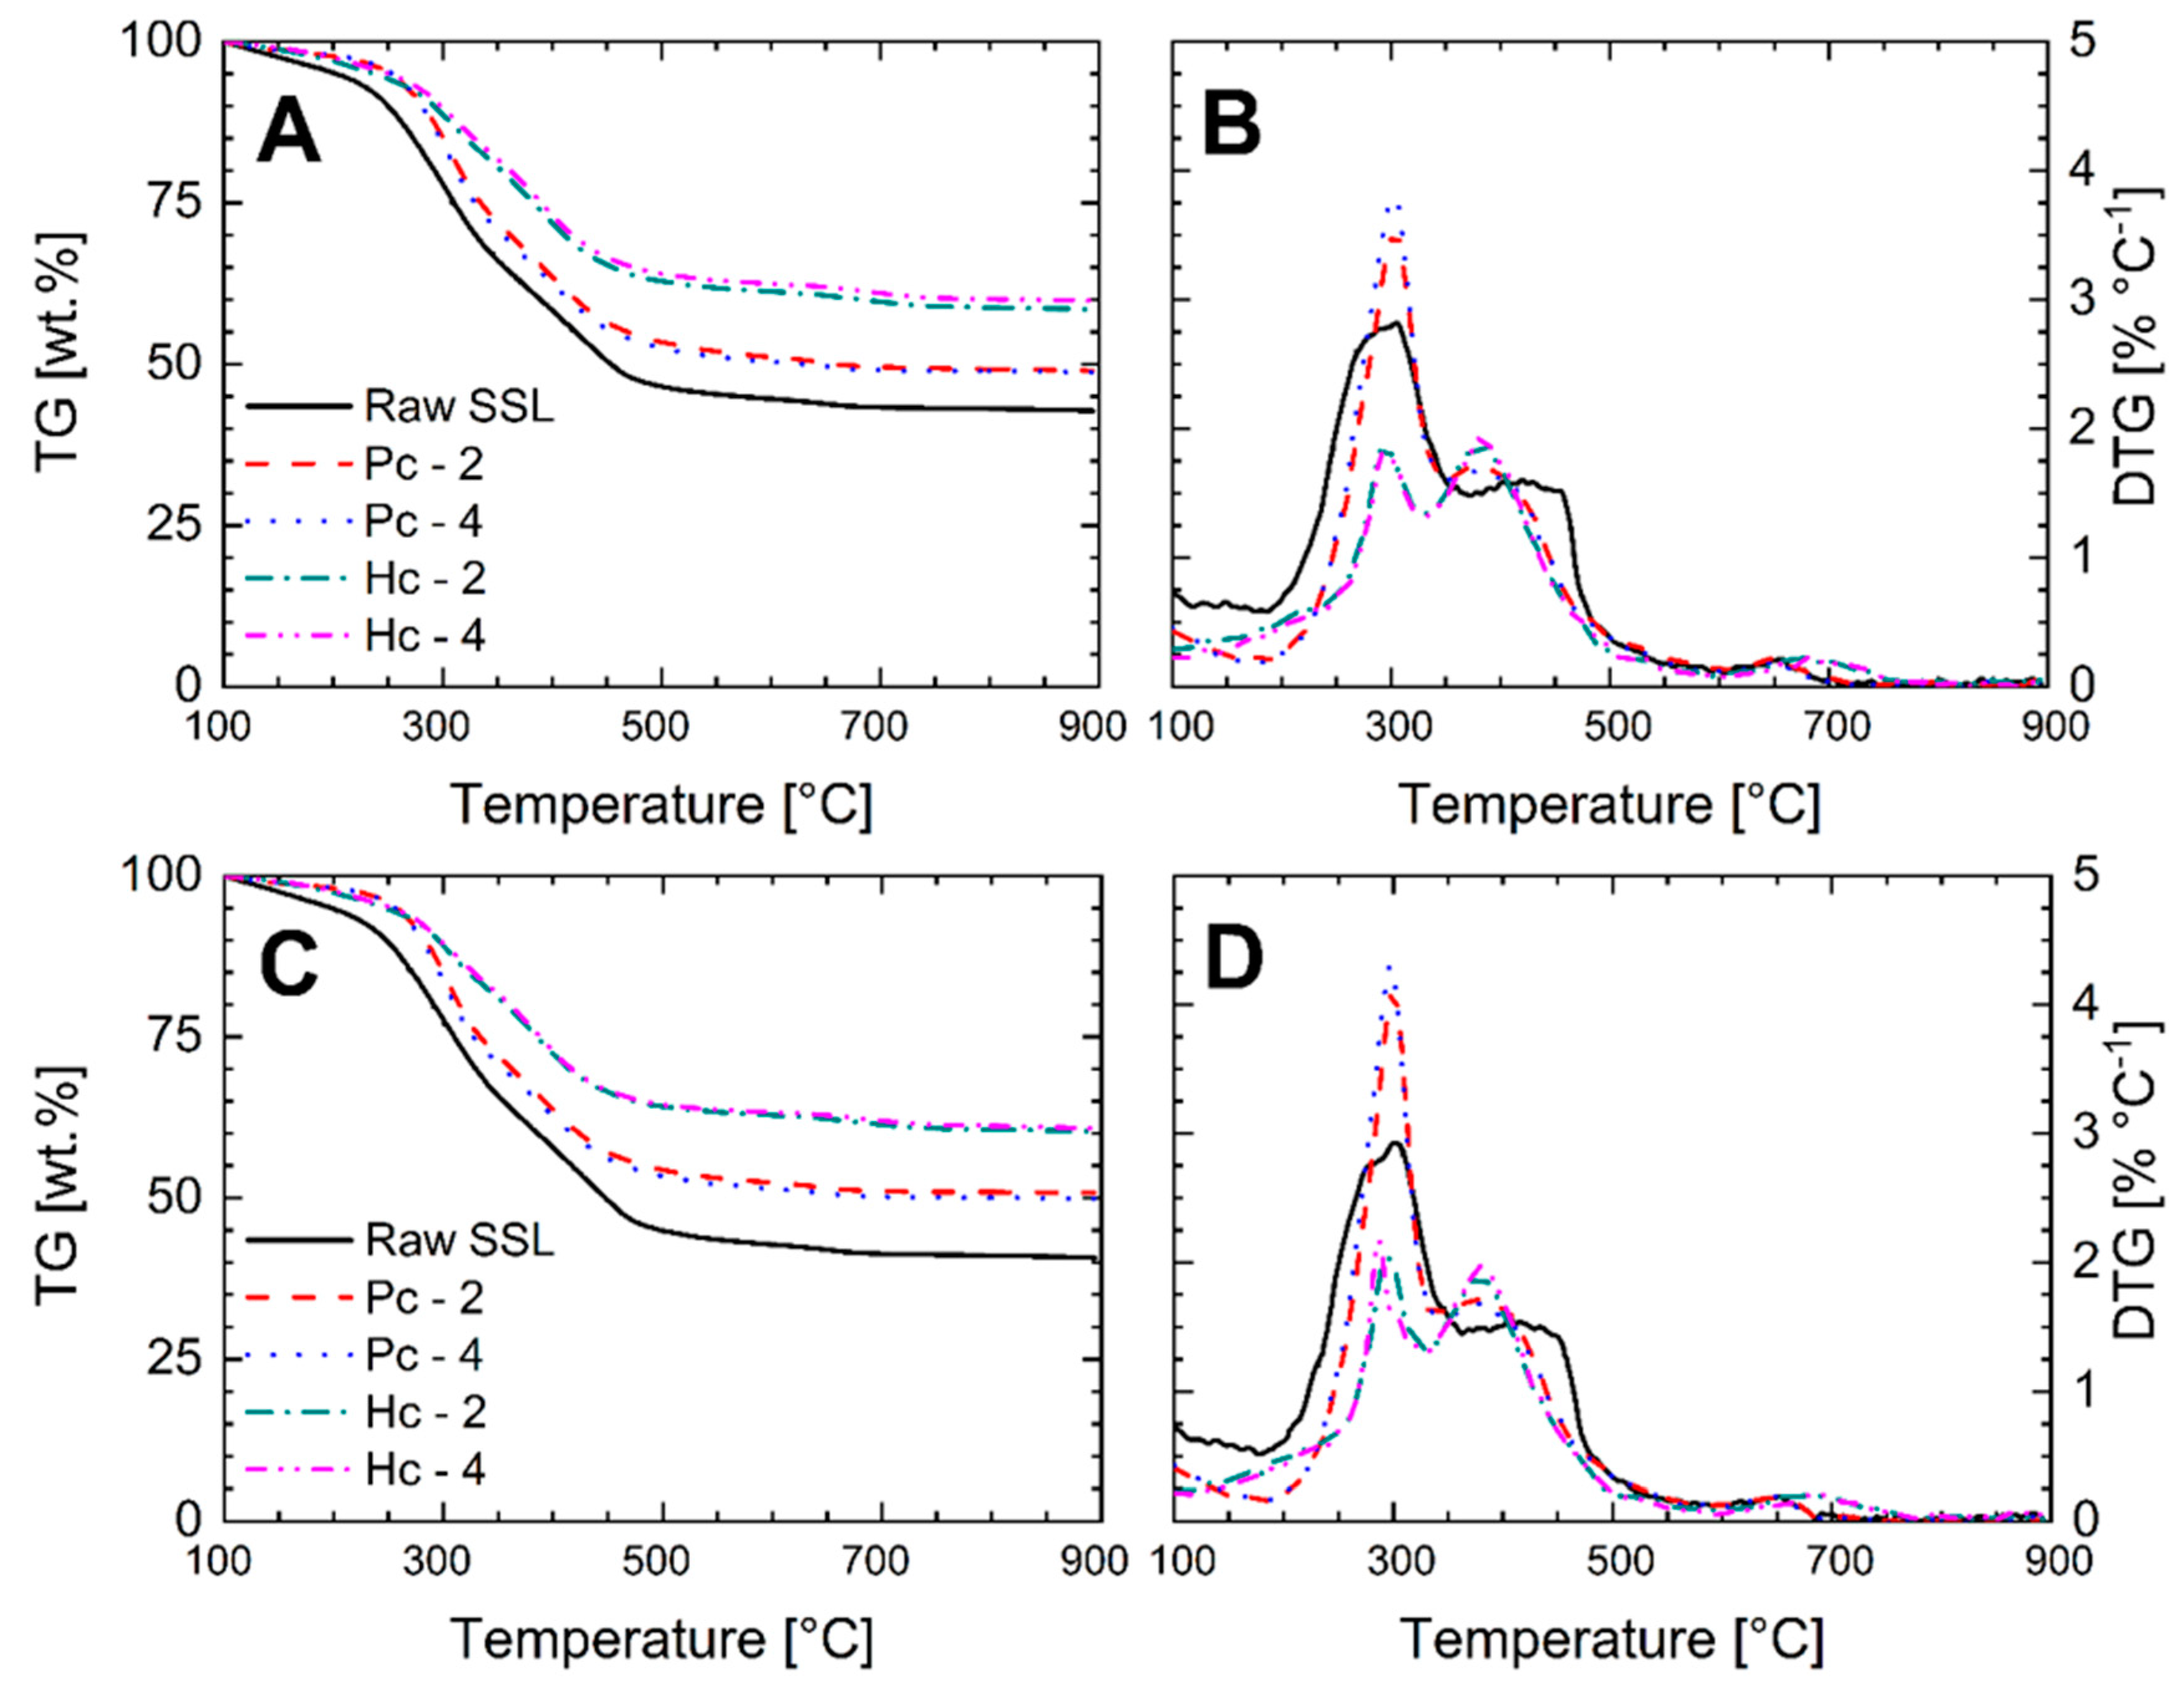
Figure 4 shows the thermogravimetric (TG) and derivative thermogravimetric (DTG) curves of raw SSL and the produced hydrochar and pyrochar for different air flows (20 and 90 mL/min). Each solid shows different mass loss profiles because of their different reactivity and composition. The increment of the air flow is negligible for hydrochars, however, leading to a bigger mass loss of the pyrochars (Figure 4). In general, combustion is divided into three different stages associated with the different mass loss peaks, which take place within different ranges of temperature. The first stage occurs at temperatures lower than 160 °C and is associated with the dehydration reaction. Next, the second stage comprises two sub-stages, of which the first occurs between 150 °C and 320 °C. This sub-stage is associated with the devolatilization of the material, leading to the polymerization of the carbonaceous material and the greatest weight loss in the case of the raw SSL and pyrochar (Figure 4). For both materials, this mass loss peak is associated with the combustion of cellulose and hemicellulose [56]. The second sub-stage, occurring between 320 °C and 470 °C, is associated with the oxidation of the carbonaceous material. In the case of hydrochar, it associated with some residual VM that gets oxidized together with the carbonaceous material during the combustion step (Figure 4). The hypothesis that the “residual/complex” VM is degraded at a high temperature was also suggested by Folgueras et al. [57]. These authors mentioned that the VM, composed of polyaromatic structures, is decomposed at temperatures around 462 °C. In the case of pyrochar, this mass loss is associated with the complete combustion of the initial lignin, which is not transformed/degraded during the pyrolysis treatment [20]. The third stage starts at a temperature of 470 °C and leads to the complete burnout of the solid.
3.6.2. Combustion Behavior and Thermal Characteristics
Table 3 shows a comparison of Ti, Tm and Tb, as well as combustibility index (S) values for the raw SSL and the chars obtained for two different air flows (20 and 90 mL/min) and at a heating rate of 10 °C/min. In both cases, the Ti of the raw SSL is lower than that of char. This means that the raw SSL is easier to ignite than the produced chars, which is due to the fact that SSL usually contains between 33.4 wt.% and 69.9 wt.% of organic matter [30,41,58]. Furthermore, the increment of the Ti in the chars can be explained as being due to the reduction of VM and the subsequent increment of FC (Table 2). This results in the increment of the energy required for the starting of the combustion of the chars. A similar effect was observed by Biagini and Tognotti. [59] with coal and biomass. The lower Tb found for chars compared to the raw SSL means that the complete conversion of biochar inside the furnace requires shorter reaction times than the raw SSL. Despite of the variation of Ti and Tb in the raw SSL and produced biochars, Tm keeps constant at around 300 °C.
The S values of raw SSL and biochars are shown in Table 3, while high values of S are considered better for combustion [60]. Furthermore, a study carried by Ma et al. [61] considered S to be appropriate for combustion when it is over 2 × 10⁻⁷. In this study, only pyrolysis with a flow of 90 mL /min leads to a slight increase in this parameter compared to raw SSL. However, the produced hydrochar shows S values three times lower than those of the raw SSL and pyrochar. Consequently, the raw SSL and pyrochar can be considered more suitable materials for combustion. In this study (Table 3), the S index of hydrochar was lower than that of the raw SSL because of the reduction of VM by carbonization processes (Table 2). This is in good accordance with previous studies [30,41]. A similar amount of VM and ash in raw SSL and pyrochars might be the reason for this effect. The increment of the residence time during the HTC and pyrolysis does not have a significant effect on the S index (Table 4).
3.6.3. Combustion Kinetics
The combustion kinetic parameters of the raw SSL and the biochars were calculated according to Equations (16) and (17) in the temperature range of 105 °C to 900 °C for four heating rates (10, 20, 30 and 40 °C/min). Their calculation was considered important as they give an approximate value of the energy necessary to start the combustion reaction [54]. Table 4 shows the EA, A and TA. As explained in the methodology section, the EA was calculated by plotting ln (β/T2) versus 1/T. Considering that, during the combustion of the material, the main sections are devolatilization and carbonization, every studied material was divided in two combustion stages. An increase in the air flow rate from 20 to 90 mL/min implies an increase in the EA for the biochars (e.g., from 69.78 kJ/mol to 112.31 kJ/mol in the case of Hc-6), however, raw SSL shows the opposite trend (Table 4). In the case of raw SSL and hydrochar, the values of EA obtained are similar to those reported in previous studies [21,41,54]. The EA for the raw SSL for both air flow rates is higher in the first stage than in the second stage, which could be related to the high VM and low FC contents (Table 2). A similar effect was observed for the produced pyrochars, of which the initial VM content is around 40 wt. %. This implies that the devolatilization stage is the one which requires more energy to get started. The EA of the second stage is lower for biochars than for the raw SSL. Generally, the pyrochars require a lower EA than hydrochars, possibly due to the higher carbon recovery (daf) (Figure 1) and the higher amount of ash found in the hydrochar (Table 2).
4. Conclusions
This study shows the conversion of digested SSL into biochar by two different thermochemical treatments: HTC and pyrolysis. The produced hydrochar and pyrochar contain lower VM (29.31–29.31 wt.% and 40.81–42.29 wt.%, respectively) and higher FC (9.98–10.57 wt.% and 8.72–10.13 wt.%, respectively) contents than the initial SSL (50.01 wt.% (VM) and 3.52 wt.% (FC)). Hence, the fuel ratio of the hydrochar is five times and that of the pyrochar three times greater than that found in the initial SSL. Moreover, the van Krevelen diagram and the study of the functional groups on the surface by FTIR reveals that the production of biochars was influenced by dehydration and decarboxylation reaction mechanisms. Furthermore, the FTIR also shows a higher intensity of the transmittance peaks associated with the aromatic functional groups of the biochars. The combustion behavior shows that the lower VM and the higher FC contents in biochar than in raw SSL result in a higher ignition temperature and lower burn-out temperature than for raw SSL. Thus, the biochars have a higher stability during handling and storage compared to raw SSL. In addition, the comparison of the combustion for two different air flows (20 and 90 mL/min) mostly results in lower EA (kJ/mol) for hydrochar (61.99–148.64 kJ/mol) and pyrochar (49.52–117.31 kJ/mol) than for raw SSL (82.17–266.82 kJ/mol). Thus, the production of hydrochars and pyrochars with a higher fuel ratio and lower activation energy than raw SSL might require less energy consumption during their combustion treatment.
Author Contributions
Conceptualization, P.J.A., Z.C. and M.P.O.; methodology, P.J.A., Z.C. and M.P.O.; investigation, P.J.A., M.A.-M. and J.Á.; resources, M.A.-M. and J.Á.; writing—original draft preparation, P.J.A., and M.P.O.; writing—review and editing, M.A., J.Á. and A.K.; funding acquisition, A.K. All authors have read and agreed to the published version of the manuscript.
Funding
This research was funded by the European Union’s Horizon 2020 research and innovation program under the Marie Skłodowska-Curie grant agreement No 721991 and China Scholarship Council (CSC) under the grant agreement No.201508080044, the Bioeconomy Graduate Program of the State of Baden-Württemberg, Germany, BBW ForWerts (200045, Baden-Württemberg, Germany).
Conflicts of Interest
The authors declare no conflict of interest.
References
- Statistics|Eurostat. Available online: https://ec.europa.eu/eurostat/databrowser/view/ten00030/default/table?lang=en (accessed on 30 March 2020).
- Siebielska, I. Comparison of changes in selected polycyclic aromatic hydrocarbons concentrations during the composting and anaerobic digestion processes of municipal waste and sewage sludge mixtures. Water Sci. Technol. J. Int. Assoc. Water Pollut. Res. 2014, 70, 1617–1624. [Google Scholar] [CrossRef] [PubMed]
- Ignatowicz, K. The impact of sewage sludge treatment on the content of selected heavy metals and their fractions. Environ. Res. 2017, 156, 19–22. [Google Scholar] [CrossRef]
- Syed-Hassan, S.S.A.; Wang, Y.; Hu, S.; Su, S.; Xiang, J. Thermochemical processing of sewage sludge to energy and fuel: Fundamentals, challenges and considerations. Renew. Sustain. Energy Rev. 2017, 80, 888–913. [Google Scholar] [CrossRef]
- German Biogas Market Data. Available online: https://www.biogas.org/edcom/webfvb.nsf/id/EN-German-biogas-market-data (accessed on 30 March 2020).
- Parshetti, G.K.; Liu, Z.; Jain, A.; Srinivasan, M.P.; Balasubramanian, R. Hydrothermal carbonization of sewage sludge for energy production with coal. Fuel 2013, 111, 201–210. [Google Scholar] [CrossRef]
- Kim, D.; Lee, K.; Park, K.Y. Hydrothermal carbonization of anaerobically digested sludge for solid fuel production and energy recovery. Fuel 2014, 130, 120–125. [Google Scholar] [CrossRef]
- Mock, C.; Lee, H.; Choi, S.; Manovic, V. Flame structures and ignition characteristics of torrefied and raw sewage sludge particles at rapid heating rates. Fuel 2017, 200, 467–480. [Google Scholar] [CrossRef]
- Ma, P.; Yang, J.; Xing, X.; Weihrich, S.; Fan, F.; Zhang, X. Isoconversional kinetics and characteristics of combustion on hydrothermally treated biomass. Renew. Energy 2017, 114, 1069–1076. [Google Scholar] [CrossRef]
- Basu, P. Biomass Gasification, Pyrolysis, and Torrefaction. In Practical Design and Theory; Academic Press: Cambridge, MA, USA, 2013. [Google Scholar]
- Cao, Z.; Jung, D.; Olszewski, M.P.; Arauzo, P.J.; Kruse, A. Hydrothermal carbonization of biogas digestate: Effect of digestate origin and process conditions. Waste Manag. 2019, 100, 138–150. [Google Scholar] [CrossRef]
- Wang, L.; Chang, Y.; Li, A. Hydrothermal carbonization for energy-efficient processing of sewage sludge: A review. Renew. Sustain. Energy Rev. 2019, 108, 423–440. [Google Scholar] [CrossRef]
- Kruse, A.; Funke, A.; Titirici, M.-M. Hydrothermal conversion of biomass to fuels and energetic materials. Curr. Opin. Chem. Biol. 2013, 17, 515–521. [Google Scholar] [CrossRef] [PubMed]
- Fu, B.; Liu, G.; Mian, M.M.; Zhou, C.; Sun, M.; Wu, D.; Liu, Y. Co-combustion of industrial coal slurry and sewage sludge: Thermochemical and emission behavior of heavy metals. Chemosphere 2019, 233, 440–451. [Google Scholar] [CrossRef] [PubMed]
- Kumar, R.; Singh, R.I. An investigation of co-combustion municipal sewage sludge with biomass in a 20kW BFB combustor under air-fired and oxygen-enriched condition. Waste Manag. 2017, 70, 114–126. [Google Scholar] [CrossRef] [PubMed]
- Gao, L.; Volpe, M.; Lucian, M.; Fiori, L.; Goldfarb, J.L. Does hydrothermal carbonization as a biomass pretreatment reduce fuel segregation of coal-biomass blends during oxidation? Energy Convers. Manag. 2019, 181, 93–104. [Google Scholar] [CrossRef]
- Arauzo, P.; Olszewski, M.; Kruse, A. Hydrothermal Carbonization Brewer’s Spent Grains with the Focus on Improving the Degradation of the Feedstock. Energies 2018, 11, 3226. [Google Scholar] [CrossRef] [Green Version]
- Rodriguez Correa, C.; Hehr, T.; Voglhuber-Slavinsky, A.; Rauscher, Y.; Kruse, A. Pyrolysis vs. hydrothermal carbonization: Understanding the effect of biomass structural components and inorganic compounds on the char properties. J. Anal. Appl. Pyrolysis 2019, 140, 137–147. [Google Scholar] [CrossRef]
- Mott, R.A.; Spooner, C.E. The calorific value of carbon in coal: The Dulong relationship. Fuel 1940, 19, 242. [Google Scholar]
- Yang, W.; Wang, H.; Zhang, M.; Zhu, J.; Zhou, J.; Wu, S. Fuel properties and combustion kinetics of hydrochar prepared by hydrothermal carbonization of bamboo. Bioresour. Technol. 2016, 205, 199–204. [Google Scholar] [CrossRef]
- Wang, C.A.; Zhang, X.; Liu, Y.; Che, D. Pyrolysis and combustion characteristics of coals in oxyfuel combustion. Appl. Energy 2012, 97, 264–273. [Google Scholar] [CrossRef]
- Olszewski, M.P.; Arauzo, P.J.; Maziarka, P.A.; Ronsse, F.; Kruse, A. Pyrolysis Kinetics of Hydrochars Produced from Brewer’s Spent Grains. Catalysts 2019, 9, 625. [Google Scholar] [CrossRef] [Green Version]
- Funke, A.; Ziegler, F. Hydrothermal carbonization of biomass: A summary and discussion of chemical mechanisms for process engineering. Biofuels Bioprod. Biorefin. 2010, 4, 160–177. [Google Scholar] [CrossRef]
- Libra, J.A.; Ro, K.S.; Kammann, C.; Funke, A.; Berge, N.D.; Neubauer, Y.; Titirici, M.-M.; Fühner, C.; Bens, O.; Kern, J.; et al. Hydrothermal carbonization of biomass residuals: A comparative review of the chemistry, processes and applications of wet and dry pyrolysis. Biofuels 2014, 2, 71–106. [Google Scholar] [CrossRef] [Green Version]
- Luo, S.; Xiao, B.; Hu, Z.; Liu, S.; Guan, Y.; Cai, L. Influence of particle size on pyrolysis and gasification performance of municipal solid waste in a fixed bed reactor. Bioresour. Technol. 2010, 101, 6517–6520. [Google Scholar] [CrossRef] [PubMed]
- Rodriguez Correa, C.; Bernardo, M.; Ribeiro, R.P.P.L.; Esteves, I.A.A.C.; Kruse, A. Evaluation of hydrothermal carbonization as a preliminary step for the production of functional materials from biogas digestate. J. Anal. Appl. Pyrolysis 2017, 124, 461–474. [Google Scholar] [CrossRef]
- Reza, M.T.; Rottler, E.; Herklotz, L.; Wirth, B. Hydrothermal carbonization (HTC) of wheat straw: Influence of feedwater pH prepared by acetic acid and potassium hydroxide. Bioresour. Technol. 2015, 182, 336–344. [Google Scholar] [CrossRef] [PubMed]
- Atienza-Martínez, M.; Mastral, J.F.; Ábrego, J.; Ceamanos, J.; Gea, G. Sewage Sludge Torrefaction in an Auger Reactor. Energy Fuels 2015, 29, 160–170. [Google Scholar] [CrossRef]
- Yuan, H.; Lu, T.; Huang, H.; Zhao, D.; Kobayashi, N.; Chen, Y. Influence of pyrolysis temperature on physical and chemical properties of biochar made from sewage sludge. J. Anal. Appl. Pyrolysis 2015, 112, 284–289. [Google Scholar] [CrossRef]
- Lin, Y.; Ma, X.; Peng, X.; Hu, S.; Yu, Z.; Fang, S. Effect of hydrothermal carbonization temperature on combustion behavior of hydrochar fuel from paper sludge. Appl. Therm. Eng. 2015, 91, 574–582. [Google Scholar] [CrossRef]
- Peng, X.; Ye, L.L.; Wang, C.H.; Zhou, H.; Sun, B. Temperature- and duration-dependent rice straw-derived biochar: Characteristics and its effects on soil properties of an Ultisol in southern China. Soil Tillage Res. 2011, 112, 159–166. [Google Scholar] [CrossRef]
- Yan, W.; Acharjee, T.C.; Coronella, C.J.; Vásquez, V.R. Thermal pretreatment of lignocellulosic biomass. Environ. Prog. Sustain. Energy 2009, 28, 435–440. [Google Scholar] [CrossRef]
- Volpe, R.; Volpe, M.; Fiori, L.; Messineo, A. Upgrading of Olive Tree Trimmings Residue as Biofuel by Hydrothermal Carbonization and Torrefaction: A Comparative Study. Chem. Eng. Trans. 2016, 50, 13–18. [Google Scholar] [CrossRef]
- Wüst, D.; Rodriguez Correa, C.; Suwelack, K.U.; Köhler, H.; Kruse, A. Hydrothermal carbonization of dry toilet residues as an added-value strategy – Investigation of process parameters. J. Environ. Manag. 2019, 234, 537–545. [Google Scholar] [CrossRef] [PubMed]
- Volpe, M.; Wüst, D.; Merzari, F.; Lucian, M.; Andreottola, G.; Kruse, A.; Fiori, L. One stage olive mill waste streams valorisation via hydrothermal carbonisation. Waste Manag. 2018, 80, 224–234. [Google Scholar] [CrossRef] [PubMed]
- Chen, X.; Lin, Q.; He, R.; Zhao, X.; Li, G. Hydrochar production from watermelon peel by hydrothermal carbonization. Bioresour. Technol. 2017, 241, 236–243. [Google Scholar] [CrossRef] [PubMed]
- Bach, Q.-V.; Tran, K.-Q.; Skreiberg, Ø. Accelerating wet torrefaction rate and ash removal by carbon dioxide addition. Fuel Proc. Technol. 2015, 140, 297–303. [Google Scholar] [CrossRef]
- Ovsyannikova, E.; Arauzo, P.J.; Becker, G.C.; Kruse, A. Experimental and thermodynamic studies of phosphate behavior during the hydrothermal carbonization of sewage sludge. Sci. Total Environ. 2019, 692, 147–156. [Google Scholar] [CrossRef]
- Lang, Q.; Zhang, B.; Li, Y.; Liu, Z.; Jiao, W. Formation and toxicity of polycyclic aromatic hydrocarbons during CaO assisted hydrothermal carbonization of swine manure. Waste Manag. 2019, 100, 84–90. [Google Scholar] [CrossRef]
- Hu, Q.; Yang, H.; Yao, D.; Zhu, D.; Wang, X.; Shao, J.; Chen, H. The densification of bio-char: Effect of pyrolysis temperature on the qualities of pellets. Bioresour. Technol. 2016, 200, 521–527. [Google Scholar] [CrossRef]
- He, C.; Giannis, A.; Wang, J.-Y. Conversion of sewage sludge to clean solid fuel using hydrothermal carbonization: Hydrochar fuel characteristics and combustion behavior. Appl. Energy 2013, 111, 257–266. [Google Scholar] [CrossRef]
- Atienza-Martínez, M.; Fonts, I.; Ábrego, J.; Ceamanos, J.; Gea, G. Sewage sludge torrefaction in a fluidized bed reactor. Chem. Eng. J. 2013, 222, 534–545. [Google Scholar] [CrossRef]
- Sharma, H.B.; Panigrahi, S.; Dubey, B.K. Hydrothermal carbonization of yard waste for solid bio-fuel production: Study on combustion kinetic, energy properties, grindability and flowability of hydrochar. Waste Manag. 2019, 91, 108–119. [Google Scholar] [CrossRef]
- Atienza-Martínez, M.; Ábrego, J.; Gea, G.; Marías, F. Pyrolysis of dairy cattle manure: Evolution of char characteristics. J. Anal. Appl. Pyrolysis 2020, 145, 104724. [Google Scholar] [CrossRef]
- Hammes, K.; Smernik, R.J.; Skjemstad, J.O.; Herzog, A.; Vogt, U.F.; Schmidt, M.W.I. Synthesis and characterisation of laboratory-charred grass straw (Oryza sativa) and chestnut wood (Castanea sativa) as reference materials for black carbon quantification. Org. Geochem. 2006, 37, 1629–1633. [Google Scholar] [CrossRef]
- Méndez, A.; Gascó, G.; Ruiz, B.; Fuente, E. Hydrochars from industrial macroalgae “Gelidium Sesquipedale” biomass wastes. Bioresour. Technol. 2019, 275, 386–393. [Google Scholar] [CrossRef] [PubMed]
- Dieguez-Alonso, A.; Funke, A.; Anca-Couce, A.; Rombolà, A.; Ojeda, G.; Bachmann, J.; Behrendt, F. Towards Biochar and Hydrochar Engineering—Influence of Process Conditions on Surface Physical and Chemical Properties, Thermal Stability, Nutrient Availability, Toxicity and Wettability. Energies 2018, 11, 496. [Google Scholar] [CrossRef] [Green Version]
- Gao, P.; Zhou, Y.; Meng, F.; Zhang, Y.; Liu, Z.; Zhang, W.; Xue, G. Preparation and characterization of hydrochar from waste eucalyptus bark by hydrothermal carbonization. Energy 2016, 97, 238–245. [Google Scholar] [CrossRef]
- Román, S.; Nabais, J.M.V.; Laginhas, C.; Ledesma, B.; González, J.F. Hydrothermal carbonization as an effective way of densifying the energy content of biomass. Fuel Proc. Technol. 2012, 103, 78–83. [Google Scholar] [CrossRef]
- Olszewski, M.P.; Nicolae, S.A.; Arauzo, P.J.; Titirici, M.-M.; Kruse, A. Wet and dry? Influence of hydrothermal carbonization on the pyrolysis of spent grains. J. Clean. Prod. 2020, 121101. [Google Scholar] [CrossRef]
- Reza, M.T.; Coronella, C.; Holtman, K.M.; Franqui-Villanueva, D.; Poulson, S.R. Hydrothermal Carbonization of Autoclaved Municipal Solid Waste Pulp and Anaerobically Treated Pulp Digestate. ACS Sustain. Chem. Eng. 2016, 4, 3649–3658. [Google Scholar] [CrossRef]
- Gai, C.; Chen, M.; Liu, T.; Peng, N.; Liu, Z. Gasification characteristics of hydrochar and pyrochar derived from sewage sludge. Energy 2016, 113, 957–965. [Google Scholar] [CrossRef]
- He, C.; Wang, K.; Yang, Y.; Amaniampong, P.N.; Wang, J.-Y. Effective nitrogen removal and recovery from dewatered sewage sludge using a novel integrated system of accelerated hydrothermal deamination and air stripping. Environ. Sci. Technol. 2015, 49, 6872–6880. [Google Scholar] [CrossRef]
- Peng, C.; Zhai, Y.; Zhu, Y.; Xu, B.; Wang, T.; Li, C.; Zeng, G. Production of char from sewage sludge employing hydrothermal carbonization: Char properties, combustion behavior and thermal characteristics. Fuel 2016, 176, 110–118. [Google Scholar] [CrossRef]
- Yuan, J.-H.; Xu, R.-K.; Zhang, H. The forms of alkalis in the biochar produced from crop residues at different temperatures. Bioresour. Technol. 2011, 102, 3488–3497. [Google Scholar] [CrossRef] [PubMed]
- Boussarsar, H.; Rogé, B.; Mathlouthi, M. Optimization of sugarcane bagasse conversion by hydrothermal treatment for the recovery of xylose. Bioresour. Technol. 2009, 100, 6537–6542. [Google Scholar] [CrossRef]
- Folgueras, M.B.; Díaz, R.M.; Xiberta, J. Pyrolysis of blends of different types of sewage sludge with one bituminous coal. Energy 2005, 30, 1079–1091. [Google Scholar] [CrossRef]
- Inoue, S.; Sawayama, S.; Ogi, T.; Yokoyama, S.-Y. Organic composition of liquidized sewage sludge. Biomass Bioenerg. 1996, 10, 37–40. [Google Scholar] [CrossRef]
- Biagini, E.; Tognotti, L. Comparison of Devolatilization/Char Oxidation and Direct Oxidation of Solid Fuels at Low Heating Rate. Energy Fuels 2006, 20, 986–992. [Google Scholar] [CrossRef]
- Liu, Z.; Quek, A.; Kent Hoekman, S.; Balasubramanian, R. Production of solid biochar fuel from waste biomass by hydrothermal carbonization. Fuel 2013, 103, 943–949. [Google Scholar] [CrossRef]
- Ma, Q.; Han, L.; Huang, G. Evaluation of different water-washing treatments effects on wheat straw combustion properties. Bioresour. Technol. 2017, 245, 1075–1083. [Google Scholar] [CrossRef]
Figure 1.
Ash recovery, C recovery (daf) and Ey of produced hydrochar and pyrochar. Values are expressed as mean (n = 3), with the standard deviation.
Figure 1.
Ash recovery, C recovery (daf) and Ey of produced hydrochar and pyrochar. Values are expressed as mean (n = 3), with the standard deviation.

Figure 2.
Van Krevelen diagram for raw SSL, hydrochar and pyrochar.
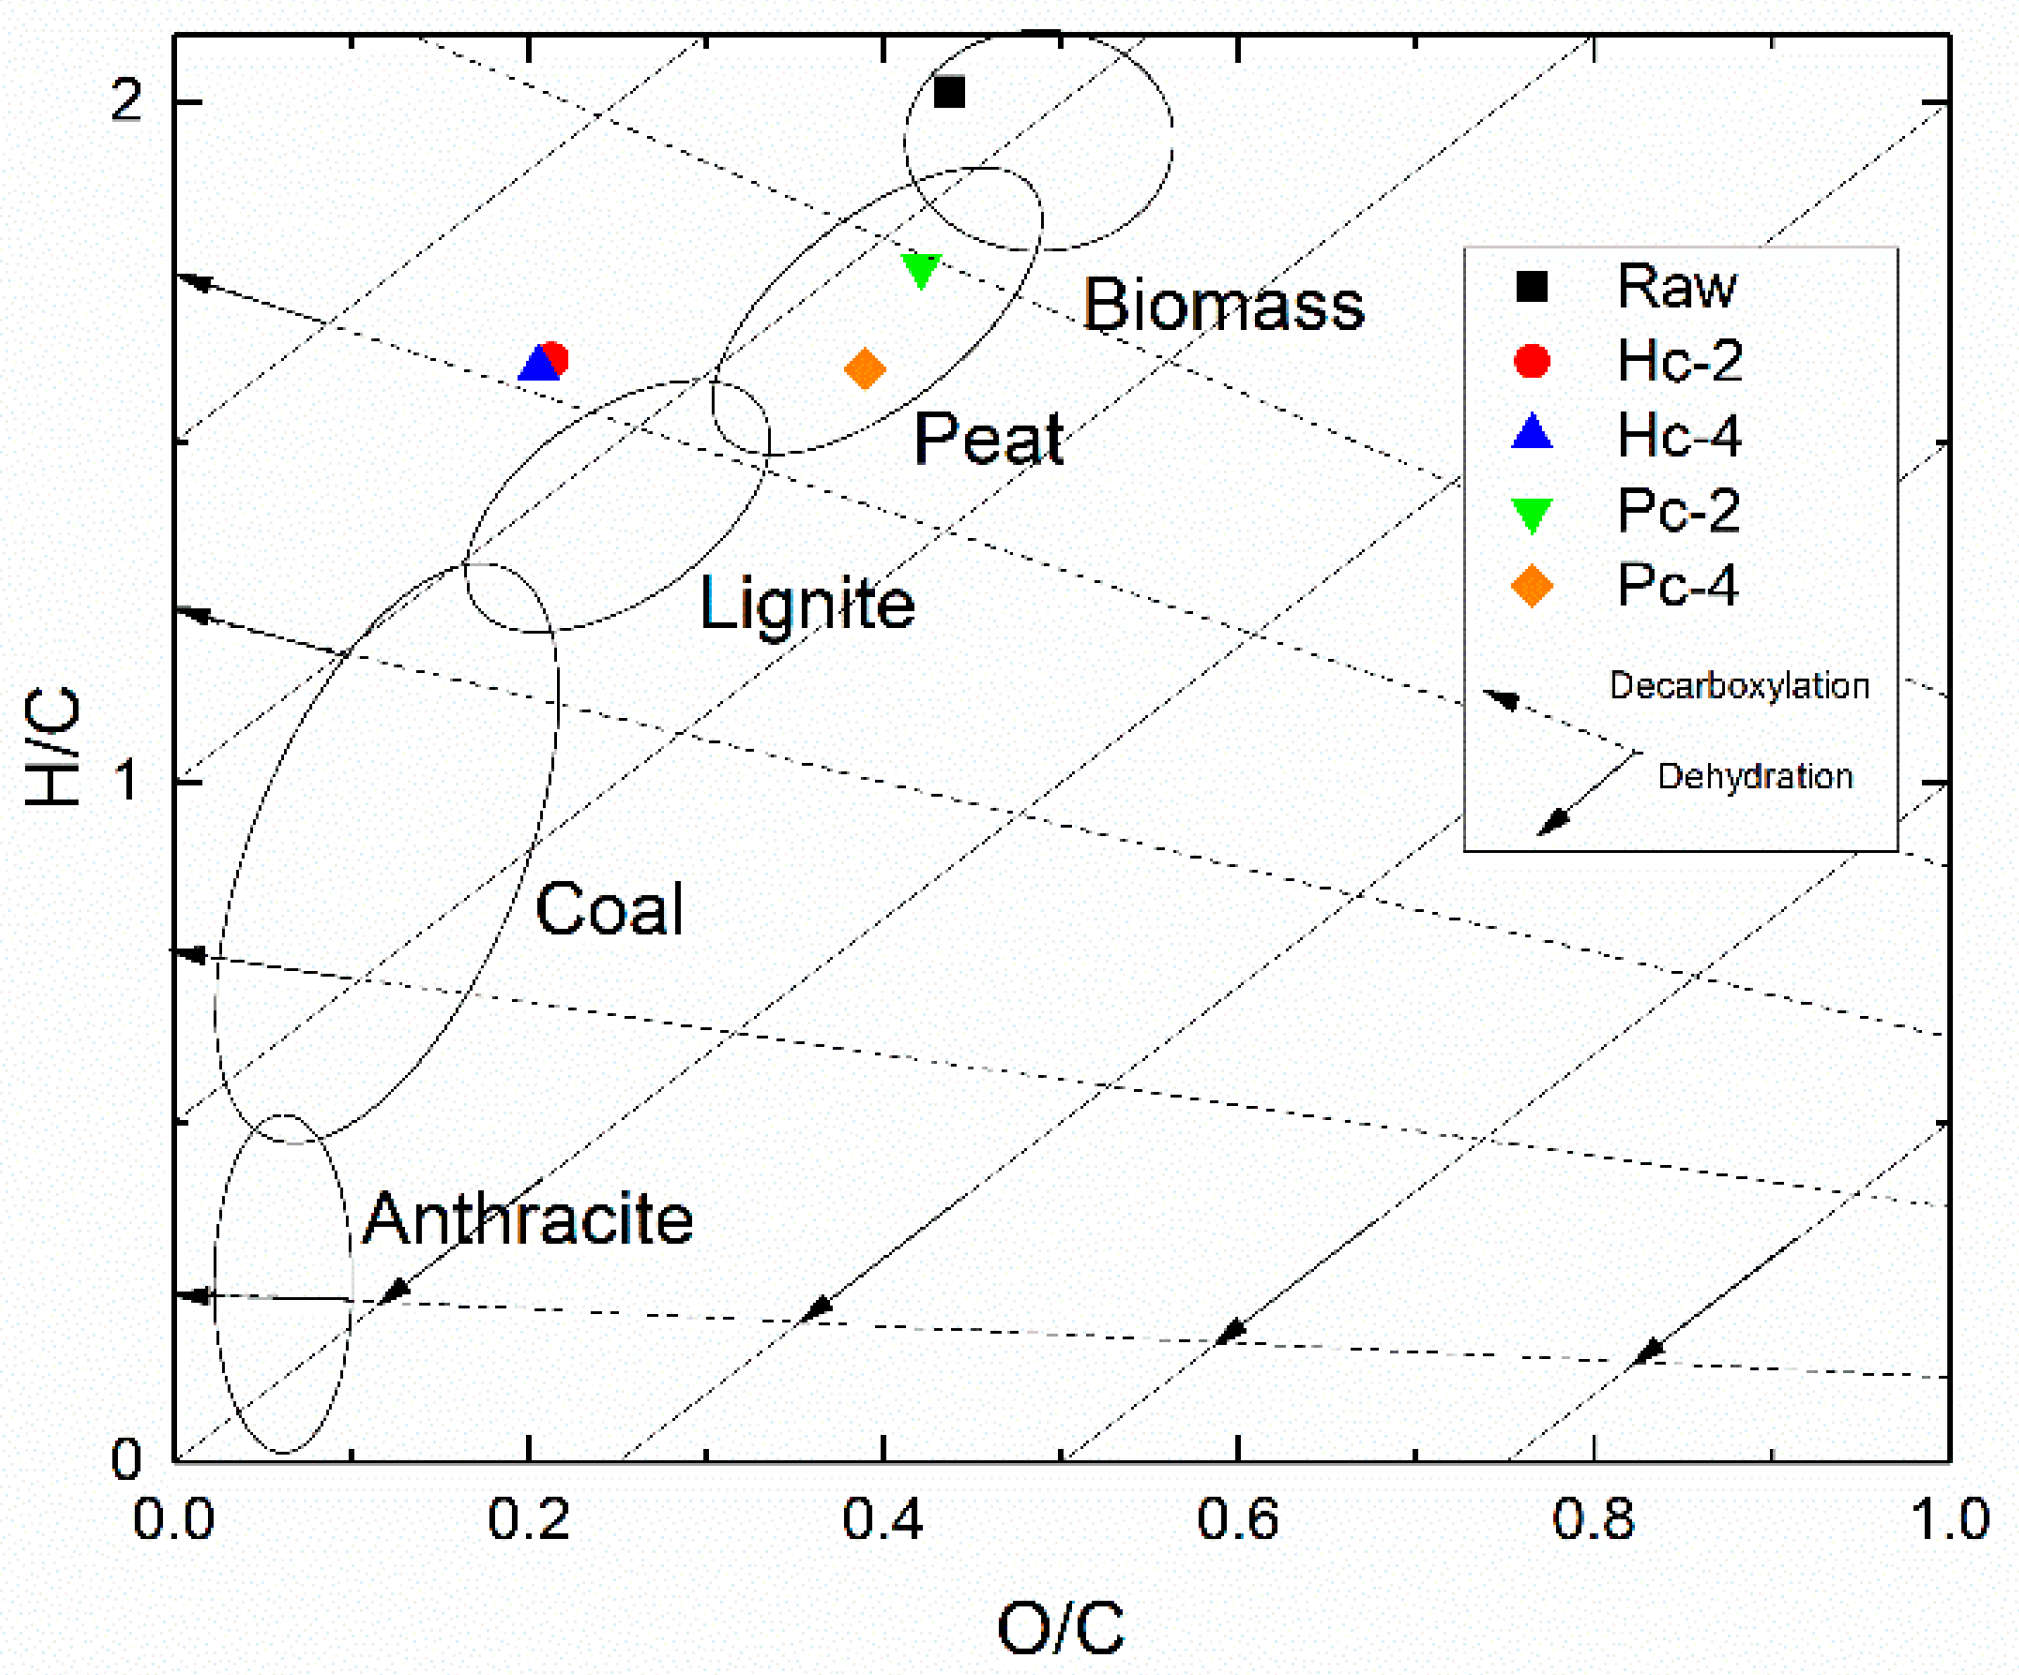
Figure 3.
FTIR spectra of raw SSL, hydrochar and pyrochar produced at different residence times.

Figure 4.
The thermogravimetric (TG) and derivative thermogravimetric (DTG) curves for combustion profiles of raw SSL and biochars with a heating rate of 10 °C/min, 20 mL/min air flow (A,B) and 90 mL/min air flow (C,D).
Figure 4.
The thermogravimetric (TG) and derivative thermogravimetric (DTG) curves for combustion profiles of raw SSL and biochars with a heating rate of 10 °C/min, 20 mL/min air flow (A,B) and 90 mL/min air flow (C,D).


Table 1.
Yield of biochar and fuel characteristics. Values are expressed as mean (n = 3), with the standard deviation in brackets.
Table 1.
Yield of biochar and fuel characteristics. Values are expressed as mean (n = 3), with the standard deviation in brackets.
| Material | η Biochar (wt.%) | Ed | FR | HHV (MJ/kg) | HHV (MJ/kg, daf 1) |
|---|---|---|---|---|---|
| Raw SSL | - | - | 0.07 (0.01) | 13.7 (0.2) | 25.9 (0.2) |
| Hc-2 | 71.2 (0.5) | 0.9 (0.1) | 0.34 (0.02) | 12.4 (0.2) | 30.8 (0.2) |
| Hc-4 | 71.8 (0.3) | 0.9 (0.1) | 0.36 (0.03) | 12.6 (0.3) | 31.1 (0.3) |
| Pc-2 | 88.1 (0.3) | 0.9 (0.1) | 0.21 (0.02) | 12.9 (0.2) | 24.1 (0.2) |
| Pc-4 | 88.0 (0.7) | 0.9 (0.1) | 0.25 (0.03) | 12.9 (0.2) | 25.0 (0.24) |
1 daf = dry ash free basis.
Table 2.
Proximate and ultimate analyses and pH of solid raw sewage sludge (SSL) and biochar. Values are expressed as mean (n = 3), with the standard deviation in brackets.
Table 2.
Proximate and ultimate analyses and pH of solid raw sewage sludge (SSL) and biochar. Values are expressed as mean (n = 3), with the standard deviation in brackets.
| Material | Proximate Analysis (wt.% db) | Ultimate Analysis (wt.% db) | pH | ||||||
|---|---|---|---|---|---|---|---|---|---|
| VM | Ash | FC | N% | C% | H % | S% | O% | ||
| Raw SSL | 50.0 (2.1) | 46.5 (2.0) | 3.5 (1.9) | 3.9 (0.1) | 27.9 (0.1) | 4.7 (0.1) | 0.8 (0.1) | 16.3 (0.1) | 7.5 (0.1) |
| Hc-2 | 29.7 (1.3) | 60.4 (1.4) | 10.0 (1.7) | 2.6 (0.2) | 25.6 (0.4) | 3.5 (0.3) | 0.7 (0.1) | 7.27 (0.1) | 6.7 (0.1) |
| Hc-4 | 29.3 (0.6) | 60.1 (0.8) | 10.6 (0.9) | 2.6 (0.1) | 25.6 (0.2) | 3.5 (0.2) | 0.7 (0.1) | 7.1 (0.1) | 6.5 (0.1) |
| Pc-2 | 42.3 (0.1) | 49.0 (0.1) | 8.7 (0.1) | 3.7 (0.1) | 27.7 (0.2) | 4.1 (0.1) | 0.7 (0.1) | 15.5 (0.1) | 6.9 (0.1) |
| Pc-4 | 40.8 (1.7) | 49.1 (1.4) | 10.1 (1.4) | 3.8 (0.2) | 28.5 (0.1) | 3.8 (0.1) | 0.7 (0.2) | 14.8 (0.1) | 6.8 (0.1) |
VM: volatile matter; FC: fixed carbon; db: dry basis.
Table 3.
Combustion parameters and comprehensive combustibility index for raw SSL and biochars.
| Air Flow Rate | 20 mL/min | 90 mL/min | ||||||
|---|---|---|---|---|---|---|---|---|
| Material | Ti (°C) | Tm (°C) | Tb (°C) | S (wt. %2/(min2 × °C3)) | Ti (°C) | Tm (°C) | Tb (°C) | S (wt. %2/(min2 × °C3)) |
| Raw SSL | 222.3 | 305.3 | 467.3 | 9.22 × 10⁻⁸ | 223.3 | 301.3 | 465.3 | 9.24 × 10⁻⁸ |
| Hc-2 | 268.0 | 294.0 | 437.0 | 3.21 × 10⁻⁸ | 268.0 | 295.0 | 430.0 | 3.38 × 10⁻⁸ |
| Hc-4 | 269.5 | 293.5 | 435.5 | 3.14 × 10⁻⁸ | 267.5 | 286.5 | 430.5 | 3.53 × 10⁻⁸ |
| Pc-2 | 254.1 | 304.1 | 445.1 | 8.41 × 10⁻⁸ | 246.1 | 300.1 | 440.1 | 9.77 × 10⁻⁸ |
| Pc-4 | 246.6 | 303.6 | 445.6 | 9.12 × 10⁻⁸ | 244.6 | 297.6 | 437.6 | 1.06 × 10⁻⁷ |
Table 4.
Combustion kinetic parameters of initial SSL and produced biochars.
| Sample | Air Flow Rate (mL/min) | Temperature Range (K) | EA (kJ/mol) | R2 | A (s−1) | TA (K·10−3) |
|---|---|---|---|---|---|---|
| Raw SSL | 20 | 581–624 | 266.28 | 0.96 | 8.37 × 1047 | 32.03 |
| 624–731 | 82.15 | 0.84 | 2.92 × 10¹⁴ | 9.88 | ||
| Raw SSL | 90 | 581–622 | 167.92 | 0.85 | 1.84 × 1034 | 20.20 |
| 622–727 | 114.02 | 0.99 | 9.99 × 1024 | 13.71 | ||
| Hc-2 | 20 | 617–660 | 69.78 | 0.97 | 9.68 × 10¹² | 8.39 |
| 660–733 | 73.87 | 0.99 | 1.61 × 10¹⁵ | 8.89 | ||
| Hc-2 | 90 | 600–643 | 112.31 | 0.95 | 1.27 × 1025 | 13.51 |
| 643–718 | 130.65 | 0.89 | 1.24 × 1032 | 15.71 | ||
| Hc-4 | 20 | 619–661 | 61.99 | 0.93 | 1.27 × 10¹¹ | 7.46 |
| 661–733 | 65.07 | 0.88 | 2.95 × 10¹² | 7.83 | ||
| Hc-4 | 90 | 611–651 | 129.68 | 0.89 | 4.42 × 1028 | 15.60 |
| 651–722 | 148.64 | 0.85 | 1.7 × 1037 | 17.88 | ||
| Pc-2 | 20 | 600–638 | 67.89 | 0.95 | 4.48 × 10¹⁴ | 8.17 |
| 638–722 | 49.52 | 0.88 | 5.37 × 10⁷ | 5.96 | ||
| Pc-2 | 90 | 593–628 | 83.18 | 0.91 | 1.23 × 10¹⁷ | 9.98 |
| 628–709 | 94.17 | 0.96 | 6.66 × 10²² | 11.30 | ||
| Pc-4 | 20 | 597–635 | 83.22 | 0.90 | 1.14 × 10¹⁸ | 10.01 |
| 635–720 | 61.05 | 0.96 | 6.17 × 10¹⁰ | 7.34 | ||
| Pc-4 | 90 | 589–623 | 117.31 | 0.86 | 8.76 × 1026 | 14.11 |
| 632–707 | 99.96 | 0.86 | 1.32 × 1024 | 12.02 |
© 2020 by the authors. Licensee MDPI, Basel, Switzerland. This article is an open access article distributed under the terms and conditions of the Creative Commons Attribution (CC BY) license (http://creativecommons.org/licenses/by/4.0/).
Share and Cite
MDPI and ACS Style
Arauzo, P.J.; Atienza-Martínez, M.; Ábrego, J.; Olszewski, M.P.; Cao, Z.; Kruse, A. Combustion Characteristics of Hydrochar and Pyrochar Derived from Digested Sewage Sludge. Energies 2020, 13, 4164. https://doi.org/10.3390/en13164164
AMA Style
Arauzo PJ, Atienza-Martínez M, Ábrego J, Olszewski MP, Cao Z, Kruse A. Combustion Characteristics of Hydrochar and Pyrochar Derived from Digested Sewage Sludge. Energies. 2020; 13(16):4164. https://doi.org/10.3390/en13164164
Chicago/Turabian StyleArauzo, Pablo J., María Atienza-Martínez, Javier Ábrego, Maciej P. Olszewski, Zebin Cao, and Andrea Kruse. 2020. "Combustion Characteristics of Hydrochar and Pyrochar Derived from Digested Sewage Sludge" Energies 13, no. 16: 4164. https://doi.org/10.3390/en13164164
Note that from the first issue of 2016, this journal uses article numbers instead of page numbers. See further details here.