A Modular Simulation Testbed for Energy Management in AC/DC Microgrids


1
Escuela de Ingenierías Eléctrica, Electrónica y de Telecomunicaciones, Universidad Industrial de Santander, Bucaramanga 680002, Colombia
2
Département de Mathématiques, Université du Québec à Rimouski, Rimouski, QC G5L 3A1, Canada
*
Author to whom correspondence should be addressed.
Energies 2020, 13(16), 4049; https://doi.org/10.3390/en13164049
Submission received: 14 July 2020
/
Revised: 23 July 2020
/
Accepted: 28 July 2020
/
Published: 5 August 2020
(This article belongs to the Special Issue Energy Management in the Multi-Source Systems)
Abstract
:This paper introduces a modular testbed to simulate AC/DC microgrids. The testbed is implemented in Matlab Simulink and is based on the energetic macroscopic representation (EMR) formalism. It is designed to be a tool to evaluate energy management strategies in AC/DC microgrids. The microgrid simulation model includes a photovoltaic generator, a fuel cell system, ultracapacitors, and batteries on the DC side. It includes voltage source converters (VSC) to couple the DC side with the AC side of the microgrid, which includes a variable AC load and a synchronous generator. Two case studies illustrate the use of the testbed. The model is implemented in Matlab Simulink and made openly available for the scientific community. Using this model, researchers can develop and evaluate energy management strategies in AC/DC microgrids.

1. Introduction
Electric power systems are progressively evolving from a generation, transmission, and distribution system almost exclusively based on AC, to hybrid configurations, where DC is gaining importance. In a few decades, DC systems could even dominate AC, and many reasons indicate that such a power system can become a reality. The fast development of voltage source converters (VSC) facilitates the interconnection of DC sources, transmission lines, and loads in AC systems. DC power systems are, in theory at least, more straightforward to operate than AC systems, because the synchronization, the phase angles, and the reactive power are not a challenge anymore.
Most electric drives operate in AC because of its simplicity and reduced cost compared with DC. Vast amounts of energy are generated in large power plants using combustion, steam, or hydraulic turbines coupled to synchronous generators. On the other hand, large quantities of renewable energy are generated in small power plants connected all to the network using distributed and intermittent DC generators located near the consumers [1,2]. Storage in batteries or hydrogen-based (electrolyzers and fuel cells) systems is performed in DC. Many recent projects use high voltage direct current (HVDC) to transport energy through very long distances or to connect offshore wind farms [3,4,5]. Most of the residential loads, such as lighting or appliances, operate in DC because of its increased efficiency compared with AC. New isolated power systems could privilege the use of DC over AC, but for now, the electric power system evolves toward a hybrid AC/DC power system with high penetration of renewable energy [6,7].
The design and operation of microgrids require flexible simulation models. These models should allow the consideration of AC/DC generation and consumption simultaneously. They also should allow the user to design and evaluate the effect of the energy management and control algorithms.
One of the main challenges to operate hybrid power systems is the definition of power references for each of the sources, respecting restrictions, and minimizing at the same time multi-objective functions such as energy consumption or degradation of the sources. Matlab Simulink is one of the most used software to study the energy management in hybrid systems. Some recent developments using this software in DC microgrids are presented in the following references.
An optimal energy management strategy of an islanded DC microgrid that includes photovoltaic generation, batteries, and electrolyzers is addressed in [8]. Modeling and control strategies for distributed converters in a DC microgrid that integrates photovoltaic panels and batteries are presented in [9]. A distributed system to produce hydrogen with multi-stack polymer electrolyte membrane (PEM) electrolyzers (EL) coupled with a wind turbine generator is presented in [10]. The impact of battery energy storage systems (BESS) on the stability of photovoltaic-BESS in DC microgrids is considered in [11]. The energy management in an AC-isolated microgrid composed of a diesel generator, a wind turbine, and a flywheel system is studied in [12].
Matlab Simulink is used in [13] to simulate a HVDC-connected offshore wind power plant with the onshore grid. Reactive power-sharing with distributed generators in an AC microgrid is treated in [14]. An active and reactive power distribution strategy to suppress the voltage fluctuation when adding a renewable energy source is presented in [15]. The design of the controller for AC/DC converters to reject disturbances using sliding control is introduced in [16].
This work focuses on the development of a simulation test bench openly available to download and distribute. We also identified some open access, ready-to-use, complete simulation testbeds for microgrids [17,18,19] and hybrid electric vehicles [20,21,22]. The research presented in [17] proposes a simulation model of a microgrid, focused on the study of the power converters. It is an excellent tool to analyze the microgrid’s small-signal stability based on the Matlab LAT toolbox. References [18,19] introduce simulation models to study the power market in complex power networks.
Some references provide complete simulation models for hybrid electric vehicles (HEV). A complete model of a fuel cell with batteries applied to an HEV is presented in [22]. Simulation testbeds of a fuel cell ultracapacitor-battery (FC-UC-battery) hybrid locomotive and HEV are presented in references [21,20]. These models are developed in Matlab Simulink and are openly available to download. They allow researchers to evaluate and compare different energy management strategies.
Numerous papers have published results obtained using such open-access software. The work presented in [23] introduces a fuzzy logic controller to perform the energy management in a fuel cell-battery HEV. A rule-based strategy to define control references in a hybrid locomotive is presented in [24]. A particle swarm optimization algorithm to solve multi-objective stochastic control models for microgrids operation is presented in [25]. Reference [26] proposes the optimization of smart grids considering market requirements. These recent research activities demonstrate the interest of developing and making openly available simulation testbeds, allowing the scientific community to evaluate and compare results under the same conditions.
The present paper introduces the energetic macroscopic representation (EMR) as a powerful formalism to organize models, identify control loops, and evaluate control and energy management strategies in AC/DC microgrids. The EMR formalism is a useful tool to organize and simulate multi-physics/multi-source energy systems [27]. EMR allows systematic integration of subsystems based on the principle of the integral causality and has been widely used in areas such as hybrid electric vehicles [28,29,30,31], hybrid locomotives [21], fuel cell systems [32], photovoltaic generators [33], marine turbines [34], and electric vehicles charge stations [35].
This paper uses the EMR formalism to construct a modular testbed of an AC/DC microgrid that includes a photovoltaic generator, FC, UC, and batteries at the DC side. The model includes a synchronous generator with its automatic voltage regulator and the load at the AC side. The architecture of the microgrid whose testbed is provided with this paper is illustrated in Figure 1.
The present paper does not have the objective of proposing new models for the energy sources. For this reason, we have referenced all the models adopted and adapted from the literature. Nevertheless, the main contribution of this work is to propose a simulation testbed that permits the integration of energy sources, power converters, controllers, and energy management strategies (control references).
Regarding the components of the microgrid, the FC is modeled using polarization curves, as proposed in [22]. The UC model is proposed by Zubieta [36] and the battery model, the one presented by Ceraolo [37]. The droop control architecture is presented in [38]. The synchronous generator and its automatic voltage regulator (AVR) models are adopted from [38,39]. A complete simulation testbed, implemented in Matlab Simulink, is provided with this paper and made available to download and distribute from the MDPI repository. With this model, researchers can develop and evaluate control and energy management strategies in AC/DC microgrids.
Very few papers share complete simulation models allowing traceability of the claimed results. To our best knowledge, this is the first ready-to-use energy management-oriented simulation model of an AC/DC microgrid.
Compared with other testbeds and research in the literature, the one introduced in this paper:
- Allows the performing of a systematic study of the energy flows in an AC/DC microgrid using the energetic macroscopic representation (EMR) formalism.
- Provides simulation models, adopted and adapted from literature, for DC and AC sources, power converters, power controllers, and AC loads.
- Provides two ready-to-simulate Matlab Simulink AC/DC microgrid models. All the results presented in this paper can be fully replicated using the files provided in the MDPI repository.
The paper is organized as follows. Section 2 introduces the models of the power sources, the power converters, and control systems. Section 3 introduces the AC/DC testbed microgrid EMR. Section 4 presents two case studies to illustrate the use of the testbed. Section 5 and Section 6 present a discussion on the testbed and the conclusions.
2. Modeling of the Microgrid
This section introduces the sources’ models and control strategy provided with the microgrid testbed. Section 2.1, Section 2.2, Section 2.3 and Section 2.4 present the PVP, FC, batteries and UC models. Section 2.5 introduces the synchronous generator’s model. Section 2.6 presents the topology and model of the power converters.
2.1. Photovoltaic Generator
Electrical energy generation using photovoltaic panels (PVP) has increased significantly during the last few years. PVP are one of the most used energy sources for isolated microgrids. Most of the PVP models are based on equivalent electrical circuits, composed of a controlled current source, a set of diodes, and a set of series and shunt resistance. Some PVP models based on Matlab Simulink are presented in [40,41,42,43,44].
The model implemented in the testbed is the model presented in [45]. It is composed of one diode and one series resistance, as illustrated in Figure 2. Equation (1) presents the relations between the current , the voltage , the temperature , and the irradiance .
where is the photon current, the diode saturation current, the diode ideality factor, and the series resistance. Figure 3, generated with this simulation model, presents the I–V curves of an available commercial Shell SM55 photovoltaic panel for a standard 25 °C temperature and different irradiance levels [46].
2.2. Fuel Cells
Hydrogen is a promising energy vector with great potential for energy storage on bigger scales than in batteries. It is characterized by a high energy density, compared to classical energy storage devices such as batteries. Hydrogen can supply fuel cells (FCs) for generating electricity, and in the energy storage process, hydrogen can be generated using electrolyzers (ELs).
FC and EL models are more complex than other DC sources because of the multi-physics system. A complete FC dynamic model will consider electrochemical, fluid, thermal, and electrical models [47,48]. However, for energy management purposes, a static model can be adopted.
The FC provided in this testbed is modeled as a current-controlled voltage source. A polarization curve is considered as in previous works on FC energy management strategy (EMS) [20,21,22,49]. Figure 4a illustrates a third-order model polarization curve and its corresponding power curve for a typical 5 kW FC. Figure 4b illustrates the efficiency and hydrogen flow of the same FC.
2.3. Batteries
Electric batteries are certainly the most used energy storage source in power systems. They have a good compromise between energy and power density. Many models adapted for static or dynamic studies of the multiple available technologies are found in the literature. In this testbed, the dynamic model proposed by Ceraolo is implemented [37]. This model is adapted for lead-acid batteries, which is still the most used technology in isolated microgrids. The equivalent circuit is illustrated in Figure 5. The parameters of the batteries used in the provided files are adapted from [50].
2.4. Ultracapacitors
Ultracapacitors (UC) are characterized by high efficiency and offer a high speed of access to electrical energy. They are an excellent complement to hybridize with FC, given their high-power density and efficiency. UC are used in applications as diverse as the integration of renewable energy in electricity networks [51,52,53], regenerative braking in hybrid vehicles [54], and uninterrupted power supply sources [55]. Several models have been proposed for studying UC. In this testbed, the model proposed by Zubieta is implemented [36]. The parameters of the UC implemented in the provided files are adapted from [56]. The equivalent circuit is illustrated in Figure 6.
2.5. Synchronous Generator
Synchronous generators (SG) have been for a long time the base of electric power systems. They are coupled to steam or combustion turbines in big power plants and coupled to diesel generators in isolated microgrids. They can be coupled to wind turbines, but most of the new wind plants are coupled to doubly-fed induction generators (DFIG), of which the operating principle is similar to SG. The SG implemented in the testbed is based on the classic SG equivalent circuit presented in Figure 7.
The SG is coupled to an ideal mechanical source. For this reason, the frequency does not depend on the power provided to the AC bus. The terminal voltage is controlled by an automatic voltage regulator (AVR). In a real generator, the AVR will control the field current, but the AVR implemented in the testbed acts directly on the electromotive force . Figure 8 illustrates the operation of the SG when a sudden change of load is applied. It can be observed that the AVR will maintain the reference voltage even after a change of the load connected to its terminals.
2.6. Power Converters and Control Strategies
The power converters are at the heart of the microgrids. They allow interconnecting sources with different characteristics while controlling the energy flow in the power network. There are multiple topologies and model techniques for power converters. However, as the main interest of this work is the energy management strategy (EMS) study, simple models are convenient. All the converters are modeled as an ideal power converter connected in cascade with L or LC filters. The circuit dynamics are modeled in the abc frame, but the control of the power converters is performed in the dq frame. For this reason, the Park and inverse Park transformation are performed in the VSC controllers. A phase-locked loop (PLL) is used to estimate the point of common coupling (PCC) voltage and frequency used to generate the control references of the power converters.
2.6.1. Power Converters
The first DC/DC ideal converter supplies energy from the PVP to the first DC bus using an LC filter. The batteries impose the DC bus voltage. The connection of the PVP to the DC bus 1 is illustrated in Figure 9. The first VSC allows the coupling of the first DC bus to the point of common coupling (PCC) at the microgrid’s AC side. The connection of the PVP battery DC source to the AC bus is illustrated in Figure 10.
2.6.2. Maximum Power Point Tracker
A PVP generation system is an intermittent energy source. The power provided by a PVP mainly depends on the solar irradiance and the temperature. The EMS intends to maximize the energy supplied by this source. This task is frequently executed using a maximum power point tracker (MPPT) algorithm, which operates the PVP close to its maximal power operation point. Many MPPT algorithms have been proposed in the literature, using techniques such as incremental conductance (IC), fuzzy logic, and perturb and observe (P&O). For the proposed testbed, the variable perturbation size of P&O MPPT presented in [57] is implemented.
2.6.3. Phase-Locked Loop
A phase-locked loop (PLL) is used to estimate the phase angle and frequency of the AC bus voltage. The PLL implemented in this paper is the one presented in [38]. The input to the PLL is the bus voltage in the abc frame. This voltage is transformed to the dq frame using the Park transformation and an estimated phase angle. A feedback PI controller is used to force the q-axis voltage zero. The abc voltage is then aligned to the d-axis of the reference frame based on the estimated angle. Figure 15 illustrates the structure of the PLL.
2.6.4. Droop Control
Droop control is widely employed for active and reactive power sharing in inverters connected in parallel [38,58,59]. The distribution of the active and reactive power among the inverters depend on the two coefficients of the droop controller (m for P- and n for Q-E) as illustrated in Figure 16. The droop control equations are presented below:
where and are the angular frequency and the magnitude references for the grid voltage, and P and Q are the active and reactive powers, respectively. is the set-point of real power in P- droop control, and is the set-point of reactive power in Q-E droop control.
3. Energetic Macroscopic Representation (EMR) of the Microgrid
The study of the energy management in multi-source/multi-physics complex systems such as microgrids requires defining an adapted tool. This section introduces the EMR as a powerful formalism to perform this task, introduces the EMR methodology, and presents the EMR and control structure of the considered AC/DC microgrid.
Section 3.1 introduces the advantages of the EMR formalism to study the power flows in a multi-source/multi-physics system. Section 3.2 presents the EMR of a generic power converter, Section 3.3 and Section 3.4, respectively, introduce the EMR of the DC source 1 and the DC source 2. Section 3.5 presents the EMR of two VSC supplying a load, and Section 3.6 presents the EMR of the microgrid.
3.1. Energetic Macroscopic Representation (EMR)
Different approaches have been proposed to study energy management in multi-source systems: bond graphs [60], power flow diagrams [61] or energetic macroscopic representation (EMR) [62] among others. The EMR is a graphical tool, oriented to the analysis of the interactions between subsystems in a multi-physics system. This formalism was originally proposed to study electromechanical systems such as electrical machines and hybrid electric vehicles [62]. Since then, this formalism has been actualized to enable an extension to other physical fields.
The EMR formalism is characterized by offering various benefits that make it an excellent tool to study the energy flows in multi-source and multi-physics systems such as AC/DC microgrids. It allows a systematic deduction of control structures, and its implementation can be achieved using software environments such as Matlab Simulink or 20-sim. Identifying control loops using the EMR formalism is done straightforwardly following four steps, as illustrated in Figure 17:
- Organization of the system model in subsystems.
- Inversion of the model using EMR rules.
- Simplifications and estimations.
- Design of energy management strategies.
In the EMR formalism, each element or subsystem has a graphic representation according to its function on the system: energy conversion, energy storage, or energy generation and consumption.
These pictograms are interconnected following the action-reaction principle and the integral causality. The arrows that interconnect the pictograms represent the instantaneous power exchange between subsystems. The EMR pictograms are presented in Figure 18.
In order to identify the control structure, the maximal control structure methodology is performed. This methodology is based on classic model-inversion control. The EMR blocks are inverted following the EMR formalism rules. The conversion blocks are directly inverted, and the accumulation blocks are inverted using controllers to respect physical causality. The last step is to define the control strategy.
A complete guide to understanding the EMR rules, a Matlab Simulink EMR Simulink library, and an actualized list of references on the EMR can be downloaded from the EMR website developed and maintained by the L2EP laboratory Lille, France [64].
3.2. EMR of a Power Converter
3.3. EMR of the DC Source 1
This DC bus includes a PVP and a battery, as illustrated in Figure 10. A source pictogram represents the PVP. It is connected to the DC bus via a power converter, composed of an LC filter (two accumulation elements) and an ideal DC/DC converter (conversion element). The battery is represented by a source element, is directly connected to the DC bus, and imposes the bus voltage. The DC bus is connected to the AC bus using an L filter (accumulation element) and an ideal DC/AC converter (conversion element). The EMR of the DC source 1 is presented in Figure 20.
3.4. EMR of the Voltage Source Converter (VSC)2
The VSC2 allows the coupling of the second DC bus to the PCC. This DC bus gets its energy from the fuel cell and the ultracapacitors (UCs), as illustrated in Figure 12. The FC is represented using a source pictogram. It is connected to the DC bus via a power converter, composed of an L filter (accumulation element) and an ideal DC/DC converter (conversion element).
The UCs, represented by a source pictogram, are directly connected to the DC bus and imposes the bus voltage. The DC bus is connected to the AC bus using an L filter (accumulation element) and an ideal DC/AC converter (conversion element). The EMR of the DC source 2 is presented in Figure 21.
3.5. EMR of Two VSC Supplying a Load
The first microgrid includes two VSC supplying energy from two ideal DC sources to a resistive load, as illustrated in Figure 22a. The EMR is constructed from the DC bus (coupling element). The sources and the loads are represented by source elements, the power converters as conversion pictograms, and the L filters by accumulation elements. The EMR is presented in Figure 22b.
3.6. EMR of the AC/DC Microgrid
Figure 23 presents the circuit representation of the microgrid introduced in Figure 1. The microgrid’s EMR is constructed from its point of common coupling (PCC), which distributes energy from all the sources to the variable load at the AC side of the converters.
The two DC sources are connected to the PCC through their VSC. The SG is directly connected to the PCC, as well as the AC load. Here, the synchronous generator imposes the PCC voltage, and the two VSC act as current sources.
Figure 24 presents the EMR of the AC/DC microgrid, and Figure 25, its implementation in Matlab Simulink R2019b (Update 2). Matlab Simulink does not allow yet the creation of subsystems with inputs and outputs on the same side of the block as required by the EMR formalism. For this reason, the model in Simulink illustrated in Figure 25 does not seem exactly the same as in the EMR formalism.
4. Case Studies
This section presents simulation results for two case studies that illustrate some of the capabilities of the testbed. Section 4.1 presents the simulation results for the power distribution with two VSC supplying a resistive load. Section 4.2 presents the second case study with the power distribution in the microgrid illustrated in Figure 23. An extensive list of sources’ and control algorithms’ parameters is provided with the supplementary material.
4.1. Power Distribution between Two VSC in Droop-PQ Control Mode
This section presents simulation results for a microgrid where two ideal DC sources supply energy to a charge through VSC. The active and reactive references are defined using P- and Q-E droops, as shown in Figure 16. A phase-locked loop (PLL) is used to estimate the PCC voltage and frequency used in the Q-E and the P-f droop. As a verification of the control structure’s operation, the results provided in Chapter 6 of [38] are replicated. The simulation illustrates the connection of a resistive load 1 p.u. at t = 0. For this condition, each VSC provides 50% of the load. After 1 second, the load changes to 1.2 p.u. Figure 26a,b, respectively, show the active and reactive power distribution among the two VSC. Figure 26c illustrates the frequency, and Figure 26d, the amplitude of the PCC voltage.
4.2. Power Distribution among a Synchronous Generator and Two VSC
From the PCC point of view, the microgrid is composed of four components: two DC hybrid sources connected through voltage source converters, the synchronous generator, and the load.
4.2.1. DC Source 1
The first DC source is composed of a PVP generator, a DC/DC uni-directional power converter, and a battery. The PVP is composed of 100 Shell SM 55 panels connected in parallel [46]. In standard test conditions, each panel has a nominal power of 55 W. A peak power around 5 kWp is expected from this source. The PVP is connected to the batteries through a DC/DC converter. The batteries impose the DC voltage to this bus. The batteries are composed of 192 lead-acid cells connected in series. The nominal voltage of the battery is 440 V and its capacity 8640 Ah.
4.2.2. DC Source 2
The second DC hybrid source is composed of a fuel cell, a DC/DC uni-directional power converter, and a UC. The 5 kW FC is connected to the UC through a DC/DC converter. The polarization curve of this source is presented in Figure 4. The FC is connected to the DC bus using a DC/DC converter. The 270 V 16 F ultracapacitors impose the DC bus voltage.
4.2.3. Synchronous Generator
A 240 V-60 Hz synchronous generator (SG) imposes the AC bus voltage. The SG is coupled to an ideal mechanical source, and the generator provides a constant nominal frequency independent of the power provided to the AC bus. The terminal’s voltage is controlled using a PI controller, acting as an automatic voltage regulator (AVR).
4.2.4. Load and Solar Profiles
The inputs are the profiles of load consumption and solar irradiance. The solar profiles are obtained from real conditions in Bucaramanga, Colombia, and are illustrated in Figure 27a. The load profiles are typical Colombian rural profiles [65] and illustrated in Figure 27a,b. The second profile is not real but allows the observing of the role of the UC in the power distribution. The reactive power is assumed to be 10% of the active power consumed by the load.
4.3. Energy Management
The active and reactive references for each source are defined using simple rules defined below. It is important to highlight that this is not an optimal or performant energy management strategy. It is only an example of the microgrid operation.
The VSC1 active power reference is the power generated by the PVP. The VSC1 supplies a percentage of the reactive power consumed by the load. The VSC2 provides percentages of the active and reactive power consumed by the charge. The power supplied by the FC has an upper bound and a limited increase and decrease rate in the power rates. The SG supplies the active and reactive power that the VSC do not supply. If the battery or UC are close to overcharge/discharge, (state-of-charge (SOC) above/below a reference value), the respective VSC reference is adjusted to permit a constant discharge/charge of these sources.
Figure 28 and Figure 29 present simulation results for one day of operation of the microgrid. Here, the main interest is the active and reactive power distribution between the sources. The results illustrate the operation as defined with the rule-based approach. The voltage and SOC remain between the predetermined bounds. The results presented in Figure 28 are obtained using the profile in Figure 27b with a maximal load power of 10 kW. The results presented in Figure 29 are obtained using the profile in Figure 27c with a maximal load power of 15 kW.
5. Discussion
This paper introduces a modular testbed to study the energy management in AC/DC microgrids. Two case studies illustrate some of the results that can be obtained using this testbed. The Simulink model has been created in Matlab R2019b and does not require additional toolboxes. A variable-step solver is selected to perform the simulation. The two provided simulations models are ready to run and configurated to build the figures presented in the paper.
The Simulink accelerator mode is recommended to perform the simulations. It does require installing a MinGW-w64 compiler. This mode is useful in simulations of long timespans. Another fact to speed up the total required simulation is to reduce the data acquisition period. Additionally, to avoid memory problems, the simulation can be divided into several simulations.
6. Conclusions
This paper introduces a new testbed for the simulation of AC/DC microgrids. It is based on the energetic macroscopic representation formalism. It allows the users to design and evaluate energy management strategies for power distribution in hybrid power sources. It provides simulation models adopted and adapted from the literature for the following sources: photovoltaic panels, ultracapacitors, batteries, fuel cells, and synchronous generators.
It also provides simplified models for the power converters and different controllers: maximum power point tracker for the photovoltaic generator, droop controllers for the voltage source converters, and an automatic voltage regulator for the synchronous generator. Two case studies illustrate how the testbed can be used to evaluate a specific energy management strategy. The simulation files provided with the supplementary materials allow the obtaining of the results presented in this paper.
The model only requires Simulink and no other toolboxes. One of the main interests of using the EMR is the modularity, so different models can be implemented for the microgrid components without modifying the microgrid’s EMR.
Supplementary Materials
The following are available online at https://www.mdpi.com/1996-1073/13/16/4049/s1, microgrid testbed implemented in Matlab Simulink.
Author Contributions
Conceptualization and writing—J.S., D.J.; methodology, J.S. and D.J.; review and editing, A.I. All authors have read and agreed to the published version of the manuscript.
Funding
This research received no external funding.
Acknowledgments
This research was performed in the framework of a project supported by the Emerging Leaders in the Americas Program (ELAP) from the Government of Canada.
Conflicts of Interest
The authors declare no conflict of interest.
References
- Sperstad, I.B.; Korpås, M. Energy Storage Scheduling in Distribution Systems Considering Wind and Photovoltaic Generation Uncertainties. Energies 2019, 12, 1231. [Google Scholar] [CrossRef] [Green Version]
- Saad, S.N.M.; van der Weijde, A.H. Evaluating the Potential of Hosting Capacity Enhancement Using Integrated Grid Planning Modeling Methods. Energies 2019, 12, 3610. [Google Scholar] [CrossRef] [Green Version]
- Kalair, A.; Abas, N.; Khan, N. Comparative Study of HVAC and HVDC Transmission Systems. Renew. Sustain. Energy Rev. 2016, 59, 1653–1675. [Google Scholar]
- Sun, J.; Li, M.; Zhang, Z.; Xu, T.; He, J.; Wang, H.; Li, G. Renewable Energy Transmission by HVDC across the Continent: System Challenges and Opportunities. CSEE J. Power Energy Syst. 2017, 3, 353–364. [Google Scholar] [CrossRef]
- Ludois, D.; Venkataramanan, G. An Examination of AC/HVDC Power Circuits for Interconnecting Bulk Wind Generation with the Electric Grid. Energies 2010, 3, 1263–1289. [Google Scholar] [CrossRef] [Green Version]
- Benchaabane, Y.; Silva, R.E.; Ibrahim, H.; Ilinca, A.; Chandra, A.; Rousse, D.R. Computer Model for Financial, Environmental and Risk Analysis of a Wind–Diesel Hybrid System with Compressed Air Energy Storage. Energies 2019, 12, 4054. [Google Scholar] [CrossRef] [Green Version]
- Cepeda, J.C.O.; Gualdron, C.A.D.; Martinez, J.E.S. Design of an Incentive-based Demand Side Management Strategy using ILP for Stand-Alone Microgrids Planning. Int. J. Renew. Energy Res. 2020, 10, 378–387. [Google Scholar]
- Cecilia, A.; Carroquino, J.; Roda, V.; Costa-Castelló, R.; Barreras, F. Optimal Energy Management in a Standalone Microgrid, with Photovoltaic Generation, Short-Term Storage, and Hydrogen Production. Energies 2020, 13, 1454. [Google Scholar] [CrossRef] [Green Version]
- Lu, X.; Wan, J. Modeling and Control of the Distributed Power Converters in a Standalone DC Microgrid. Energies 2016, 9, 217. [Google Scholar] [CrossRef] [Green Version]
- Guilbert, D.; Vitale, G. Improved Hydrogen-Production-Based Power Management Control of a Wind Turbine Conversion System Coupled with Multistack Proton Exchange Membrane Electrolyzers. Energies 2020, 13, 1239. [Google Scholar] [CrossRef] [Green Version]
- Moncecchi, M.; Brivio, C.; Mandelli, S.; Merlo, M. Battery Energy Storage Systems in Microgrids: Modeling and Design Criteria. Energies 2020, 13, 2006. [Google Scholar] [CrossRef] [Green Version]
- Sebastián, R.; Peña-Alzola, R. Flywheel Energy Storage and Dump Load to Control the Active Power Excess in a Wind Diesel Power System. Energies 2020, 13, 2029. [Google Scholar] [CrossRef] [Green Version]
- Campos-Gaona, D.; Stock, A.; Anaya-Lara, O.; Leithead, W. Dynamic Wind Power Plant Control for System Integration Using the Generator Response Following Concept. Energies 2020, 13, 1804. [Google Scholar] [CrossRef] [Green Version]
- Alsafran, A.S.; Daniels, M.W. Consensus Control for Reactive Power Sharing Using an Adaptive Virtual Impedance Approach. Energies 2020, 13, 2026. [Google Scholar] [CrossRef]
- Xinming, G.; Qunhai, H.; Tongzhen, W.; Jingyuan, Y. A Local Control Strategy for Distributed Energy Fluctuation Suppression Based on Soft Open Point. Energies 2020, 13, 1520. [Google Scholar] [CrossRef] [Green Version]
- Wu, B.; Zhou, X.; Ma, Y. Bus Voltage Control of DC Distribution Network Based on Sliding Mode Active Disturbance Rejection Control Strategy. Energies 2020, 13, 1358. [Google Scholar] [CrossRef] [Green Version]
- Bankovic´, B.; Filipovic´, F.; Mitrovic´, N.; Petronijevic´, M.; Kostic´, V. A Building Block Method for Modeling and Small-Signal Stability Analysis of the Autonomous Microgrid Operation. Energies 2020, 13, 1492. [Google Scholar] [CrossRef] [Green Version]
- Soares, J.; Lezama, F.; Canizes, B.; Vale, Z. WCCI/GECCO 2020 Competition Evolutionary Computation in Uncertain Environments: A Smart Grid Application. Available online: http://www.gecad.isep.ipp.pt/ERM2019-Competition/ (accessed on 11 July 2020).
- Lezama, F.; Soares, J.; Vale, Z.; Rueda, J.; Wagner, M. CEC/GECCO 2019 Competition Evolutionary Computation in Uncertain Environments: A Smart Grid Application. Available online: http://www.gecad.isep.ipp.pt/WCCI2018-SG-COMPETITION/ (accessed on 11 July 2020).
- Solano, J.; Jemei, S.; Boulon, L.; Silva, L.; Hissel, D.; Pera, M.C. IEEE VTS Motor Vehicles Challenge 2020-Energy Management of a Fuel Cell/Ultracapacitor/Lead-Acid Battery Hybrid Electric Vehicle. In Proceedings of the 2019 IEEE Vehicle Power and Propulsion Conference (VPPC), Hanoi, Vietnam, 14–17 October 2019; pp. 1–6. [Google Scholar]
- Lhomme, W.; Letrouve, T.; Boulon, L.; Jemei, S.; Bouscayrol, A.; Chauvet, F.; Tournez, F. IEEE VTS Motor Vehicles Challenge 2019-Energy Management of a Dual-Mode Locomotive. In Proceedings of the 2018 IEEE Vehicle Power and Propulsion Conference (VPPC), Chicago, IL, USA, 27–30 August 2018; pp. 1–6. [Google Scholar]
- Depature, C.; Jemei, S.; Boulon, L.; Bouscayrol, A.; Marx, N.; Morando, S.; Castaings, A. IEEE VTS Motor Vehicles Challenge 2017 - Energy Management of a Fuel Cell/Battery Vehicle. In Proceedings of the 2016 IEEE Vehicle Power and Propulsion Conference (VPPC), Hangzhou, China, 17–20 October 2016; pp. 1–6. [Google Scholar]
- Amaya, E.G.; Chiacchiarini, H.; De Angelo, C.; Asensio, M. The Energy Management Strategy of FC/Battery Vehicles Winner of the 2017 IEEE VTS Motor Vehicles Challenge. In Proceedings of the 2017 IEEE Vehicle Power and Propulsion Conference (VPPC), Belfort, France, 1–14 December 2017; pp. 1–6. [Google Scholar]
- Mendoza, D.S.; Acevedo, P.; Jaimes, J.S.; Solano, J. Energy Management of a Dual-Mode Locomotive Based on the Energy Sources Characteristics. In Proceedings of the 2019 IEEE Vehicle Power and Propulsion Conference (VPPC), Hanoi, Vietnam, 14–17 October 2019; pp. 1–4. [Google Scholar]
- Garcia-Guarin, J.; Rodriguez, D.; Alvarez, D.; Rivera, S.; Cortes, C.; Guzman, A.; Bretas, A.; Aguero, J.R.; Bretas, N. Smart Microgrids Operation Considering a Variable Neighborhood Search: The Differential Evolutionary Particle Swarm Optimization Algorithm. Energies 2019, 12, 3149. [Google Scholar] [CrossRef] [Green Version]
- Garcia-Guarin, J.; Rivera, S.; Trigos, L. Multiobjective Optimization of Smart Grids Considering Market Power. J. Phys. 2019, 1409, 12006. [Google Scholar] [CrossRef] [Green Version]
- Delarue, P.; Bouscayrol, A.; Tounzi, A.; Guillaud, X.; Lancigu, G. Modelling, Control and Simulation of an Overall Wind Energy Conversion System. Renew. Energy 2003, 28, 1169–1185. [Google Scholar] [CrossRef]
- Solano, J.; Hissel, D.; Pera, M. Fail-Safe Power for Hybrid Electric Vehicles: Implementing a Self-Sustained Global Energy Management System. IEEE Veh. Technol. Mag. 2018, 13, 34–39. [Google Scholar] [CrossRef]
- Abdelsalam, A.A.; Cui, S. A Fuzzy Logic Global Power Management Strategy for Hybrid Electric Vehicles Based on a Permanent Magnet Electric Variable Transmission. Energies 2012, 5, 1175–1198. [Google Scholar] [CrossRef] [Green Version]
- Xu, Q.; Cui, S.; Song, L.; Zhang, Q. Research on the Power Management Strategy of Hybrid Electric Vehicles Based on Electric Variable Transmissions. Energies 2014, 7, 934–960. [Google Scholar] [CrossRef] [Green Version]
- Gan, S.; Chrenko, D.; Kéromnès, A.; Le Moyne, L. Development of a Multi-Architecture and Multi-Application Hybrid Vehicle Design and Management Tool. Energies 2018, 11, 3185. [Google Scholar] [CrossRef] [Green Version]
- Lopez, G.L.; Rodriguez, R.S.; Alvarado, V.M.; Gomez-Aguilar, J.; Mota, J.E.; Sandoval, C. Hybrid PEMFC-Supercapacitor System: Modeling and Energy Management in Energetic Macroscopic Representation. Appl. Energy 2017, 205, 1478–1494. [Google Scholar] [CrossRef]
- Lhomme, W.; Delarue, P.; Giraud, F.; Lemaire-Semail, B.; Bouscayrol, A. Simulation of a Photovoltaic Conversion System Using Energetic Macroscopic Representation. In Proceedings of the 2012 15th International Power Electronics and Motion Control Conference (EPE/PEMC), Novi Sad, Serbia, 4–6 September 2012; pp. DS3e.7-1–DS3e.7-6. [Google Scholar]
- Barakat, M.R.; Tala-Ighil, B.; Chaoui, H.; Gualous, H.; Slamani, Y.; Hissel, D. Energetic Macroscopic Representation of a Marine Current Turbine System with Loss Minimization Control. IEEE Trans. Sustain. Energy 2017, 9, 106–117. [Google Scholar] [CrossRef]
- Locment, F.; Sechilariu, M. Modeling and Simulation of DC Microgrids for Electric Vehicle Charging Stations. Energies 2015, 8, 4335–4356. [Google Scholar] [CrossRef]
- Zubieta, L.; Bonert, R. Characterization of Double-Layer Capacitors for Power Electronics Applications. IEEE Trans. Ind. Appl. 2000, 36, 199–205. [Google Scholar] [CrossRef] [Green Version]
- Ceraolo, M. New Dynamical Models of Lead-Acid Batteries. IEEE Trans. Power Syst. 2000, 15, 1184–1190. [Google Scholar] [CrossRef] [Green Version]
- Fan, L. Control and Dynamics in Power Systems and Microgrids; CRC Press: Cleveland, OH, USA, 2017. [Google Scholar]
- Kundur, P.; Balu, N.J.; Lauby, M.G. Power System Stability and Control; McGraw-hill: New York, NY, USA, 1994; Volume 7. [Google Scholar]
- Li, X.; Pan, C.; Luo, D.; Sun, Y. Series DC Arc Simulation of Photovoltaic System Based on Habedank Model. Energies 2020, 13, 1416. [Google Scholar] [CrossRef] [Green Version]
- Kececioglu, O.F.; Gani, A.; Sekkeli, M. Design and Hardware Implementation Based on Hybrid Structure for MPPT of PV System Using an Interval Type-2 TSK Fuzzy Logic Controller. Energies 2020, 13, 1842. [Google Scholar] [CrossRef] [Green Version]
- Ma, M.; Liu, X.; Lee, K.Y. Maximum Power Point Tracking and Voltage Regulation of Two-Stage Grid-Tied PV System Based on Model Predictive Control. Energies 2020, 13, 1304. [Google Scholar] [CrossRef] [Green Version]
- Kebir, T.; Filiz, G.; Larbes, C.; Ilinca, A.; Obeidi, T.; Tchoketch Kebir, S. Study of the Intelligent Behavior of a Maximum Photovoltaic Energy Tracking Fuzzy Controller. Energies 2018, 11, 3263. [Google Scholar] [CrossRef] [Green Version]
- Osma-Pinto, G.; García-Rodríguez, M.; Moreno-Vargas, J.; Duarte-Gualdrón, C. Impact Evaluation of Grid-Connected PV Systems on PQ Parameters by Comparative Analysis based on Inferential Statistics. Energies 2020, 13, 1668. [Google Scholar] [CrossRef] [Green Version]
- Khezzar, R.; Zereg, M.; Khezzar, A. Modeling Improvement of the Four Parameter Model for Photovoltaic Modules. Sol. Energy 2014, 110, 452–462. [Google Scholar] [CrossRef]
- Shell Solar Product Information Sheet Shell SM55 Photovoltaic Solar Module. Available online: http://www.atlantasolar.com/pdf/Shell/ShellSM55_USv1.pdf (accessed on 7 July 2020).
- Kim, H.i.; Cho, C.Y.; Nam, J.H.; Shin, D.; Chung, T.Y. A Simple Dynamic Model for Polymer Electrolyte Membrane Fuel Cell (PEMFC) Power Modules: Parameter Estimation and Model Prediction. Int. J. Hydrog. Energy 2010, 35, 3656–3663. [Google Scholar] [CrossRef]
- Jia, J.; Li, Q.; Wang, Y.; Cham, Y.; Han, M. Modeling and Dynamic Characteristic Simulation of a Proton Exchange Membrane Fuel Cell. IEEE Trans. Energy Convers. 2009, 24, 283–291. [Google Scholar] [CrossRef]
- Feroldi, D.; Serra, M.; Riera, J. Energy Management Strategies Based on Efficiency Map for Fuel Cell Hybrid Vehicles. J. Power Sources 2009, 190, 387–401. [Google Scholar] [CrossRef] [Green Version]
- El Kadri, K.; Berthon, A. Energy Management Operating Modes Concerning a Hybrid Heavy Vehicle. In Proceedings of the EUROCON 2007—The International Conference on Computer as a Tool, Warsaw, Poland, 9–12 September 2007; pp. 1587–1593. [Google Scholar]
- Abbey, C.; Joos, G. Supercapacitor Energy Storage for Wind Energy Applications. IEEE Trans. Ind. Appl. 2007, 43, 769–776. [Google Scholar] [CrossRef]
- Pegueroles-Queralt, J.; Bianchi, F.D.; Gomis-Bellmunt, O. A Power Smoothing System Based on Supercapacitors for Renewable Distributed Generation. IEEE Trans. Ind. Electron. 2014, 62, 343–350. [Google Scholar] [CrossRef]
- Tummuru, N.R.; Mishra, M.K.; Srinivas, S. Dynamic Energy Management of Renewable Grid Integrated Hybrid Energy Storage System. IEEE Trans. Ind. Electron. 2015, 62, 7728–7737. [Google Scholar] [CrossRef]
- Solano Martinez, J.; Hissel, D.; Pera, M.; Amiet, M. Practical Control Structure and Energy Management of a Testbed Hybrid Electric Vehicle. IEEE Trans. Veh. Technol. 2011, 60, 4139–4152. [Google Scholar] [CrossRef]
- Lahyani, A.; Venet, P.; Guermazi, A.; Troudi, A. Battery/Supercapacitors Combination in Uninterruptible Power Supply (UPS). IEEE Trans. Power Electron. 2012, 28, 1509–1522. [Google Scholar] [CrossRef]
- Solano, J.; Hissel, D.; Pera, M.C. Modeling and Parameter Identification of Ultracapacitors for Hybrid Electrical Vehicles. In Proceedings of the IEEE Vehicle Power and Propulsion Conference, Beijing, China, 15–18 October 2013; pp. 214–217. [Google Scholar]
- Solano, J.; Duarte, J.; Vargas, E.; Cabrera, J.; Jácome, A.; Botero, M.; Rey, J. Dynamic Model and Control of a Photovoltaic Generation System Using Energetic Macroscopic Representation. Int. J. Emerg. Electr. Power Syst. 2016, 17, 575–582. [Google Scholar] [CrossRef]
- Pham, X.H.T. Power Sharing Strategy in Islanded Microgrids Using Improved Droop Control. Electr. Power Syst. Res. 2020, 180, 106164. [Google Scholar] [CrossRef]
- Dohler, J.S.; de Almeida, P.M.; de Oliveira, J.G. Droop Control for Power Sharing and Voltage and Frequency Regulation in Parallel Distributed Generations on AC Microgrid. In Proceedings of the 2018 13th IEEE International Conference on Industry Applications (INDUSCON), São Paulo, Brazil, 12–14 November 2018; pp. 1–6. [Google Scholar]
- Paynter, H. Analysis and Design of Engineering Systems; MIT Press: Cambridge, MA, USA, 1961. [Google Scholar]
- Geitner, G.; Hofmann, W. Teaching Power Flow Oriented Modelling of Dynamic Systems—Basics. In Proceedings of the 2009 13th European Conference on Power Electronics and Applications, Barcelona, Spain, 8–10 September 2009; pp. 1–10. [Google Scholar]
- Bouscayrol, A. Formalismes de Représentation et de Commande des Systèmes Electromécaniques Multimachines Multiconvertisseurs. Available online: http://l2ep.univ-lille1.fr/fileupload/file/theses/AlainBouscayrol.pdf (accessed on 11 July 2020).
- Chen, K. Common Energetic Macroscopic Representation and Unified Control Structure for Different Hybrid Electrical Vehicles. Ph.D. Thesis, Université de sciences et technologies de Lille, Université de Franche-Comté, Lille, France, 2010. [Google Scholar]
- EMRwebsite. Available online: http://www.emrwebsite.org/ (accessed on 7 July 2020).
- Comisión de Regulación de Energía y Gas CREG. Propuesta para Remunerar la Generación, Distribución y Comercialización de Energía Eléctrica en las ZNI. Available online: https://creg.gov.co/sites/default/files/propuesta_para_remunerar_la_generacion_distribucion_y_comercializacion_de_energia_electrica_en_las_zni.pdf (accessed on 11 July 2020).
Figure 1.
Microgrid scheme.

Figure 2.
Photovoltaic panel (PVP) equivalent circuit.

Figure 3.
The I–V curves of a commercial PVP.

Figure 4.
Fuel cell models.

Figure 5.
Battery equivalent circuit.

Figure 6.
Ultracapacitor equivalent circuit.

Figure 7.
Synchronous generator equivalent circuit.

Figure 8.
AVR simulation results—load change at 0.05 s.


Figure 9.
Connection of the PVP to the batteries at DC bus 1.

Figure 10.
Connection of the DC bus 1 to the point of common coupling (PCC) at the AC bus.

Figure 11.
Connection of the fuel cell to the ultracapacitors at DC bus 2.

Figure 12.
Connection of the DC bus 2 to the PCC at the AC bus.

Figure 13.
Perturb and observe (P&O) maximum power point tracker (MPPT) algorithm.
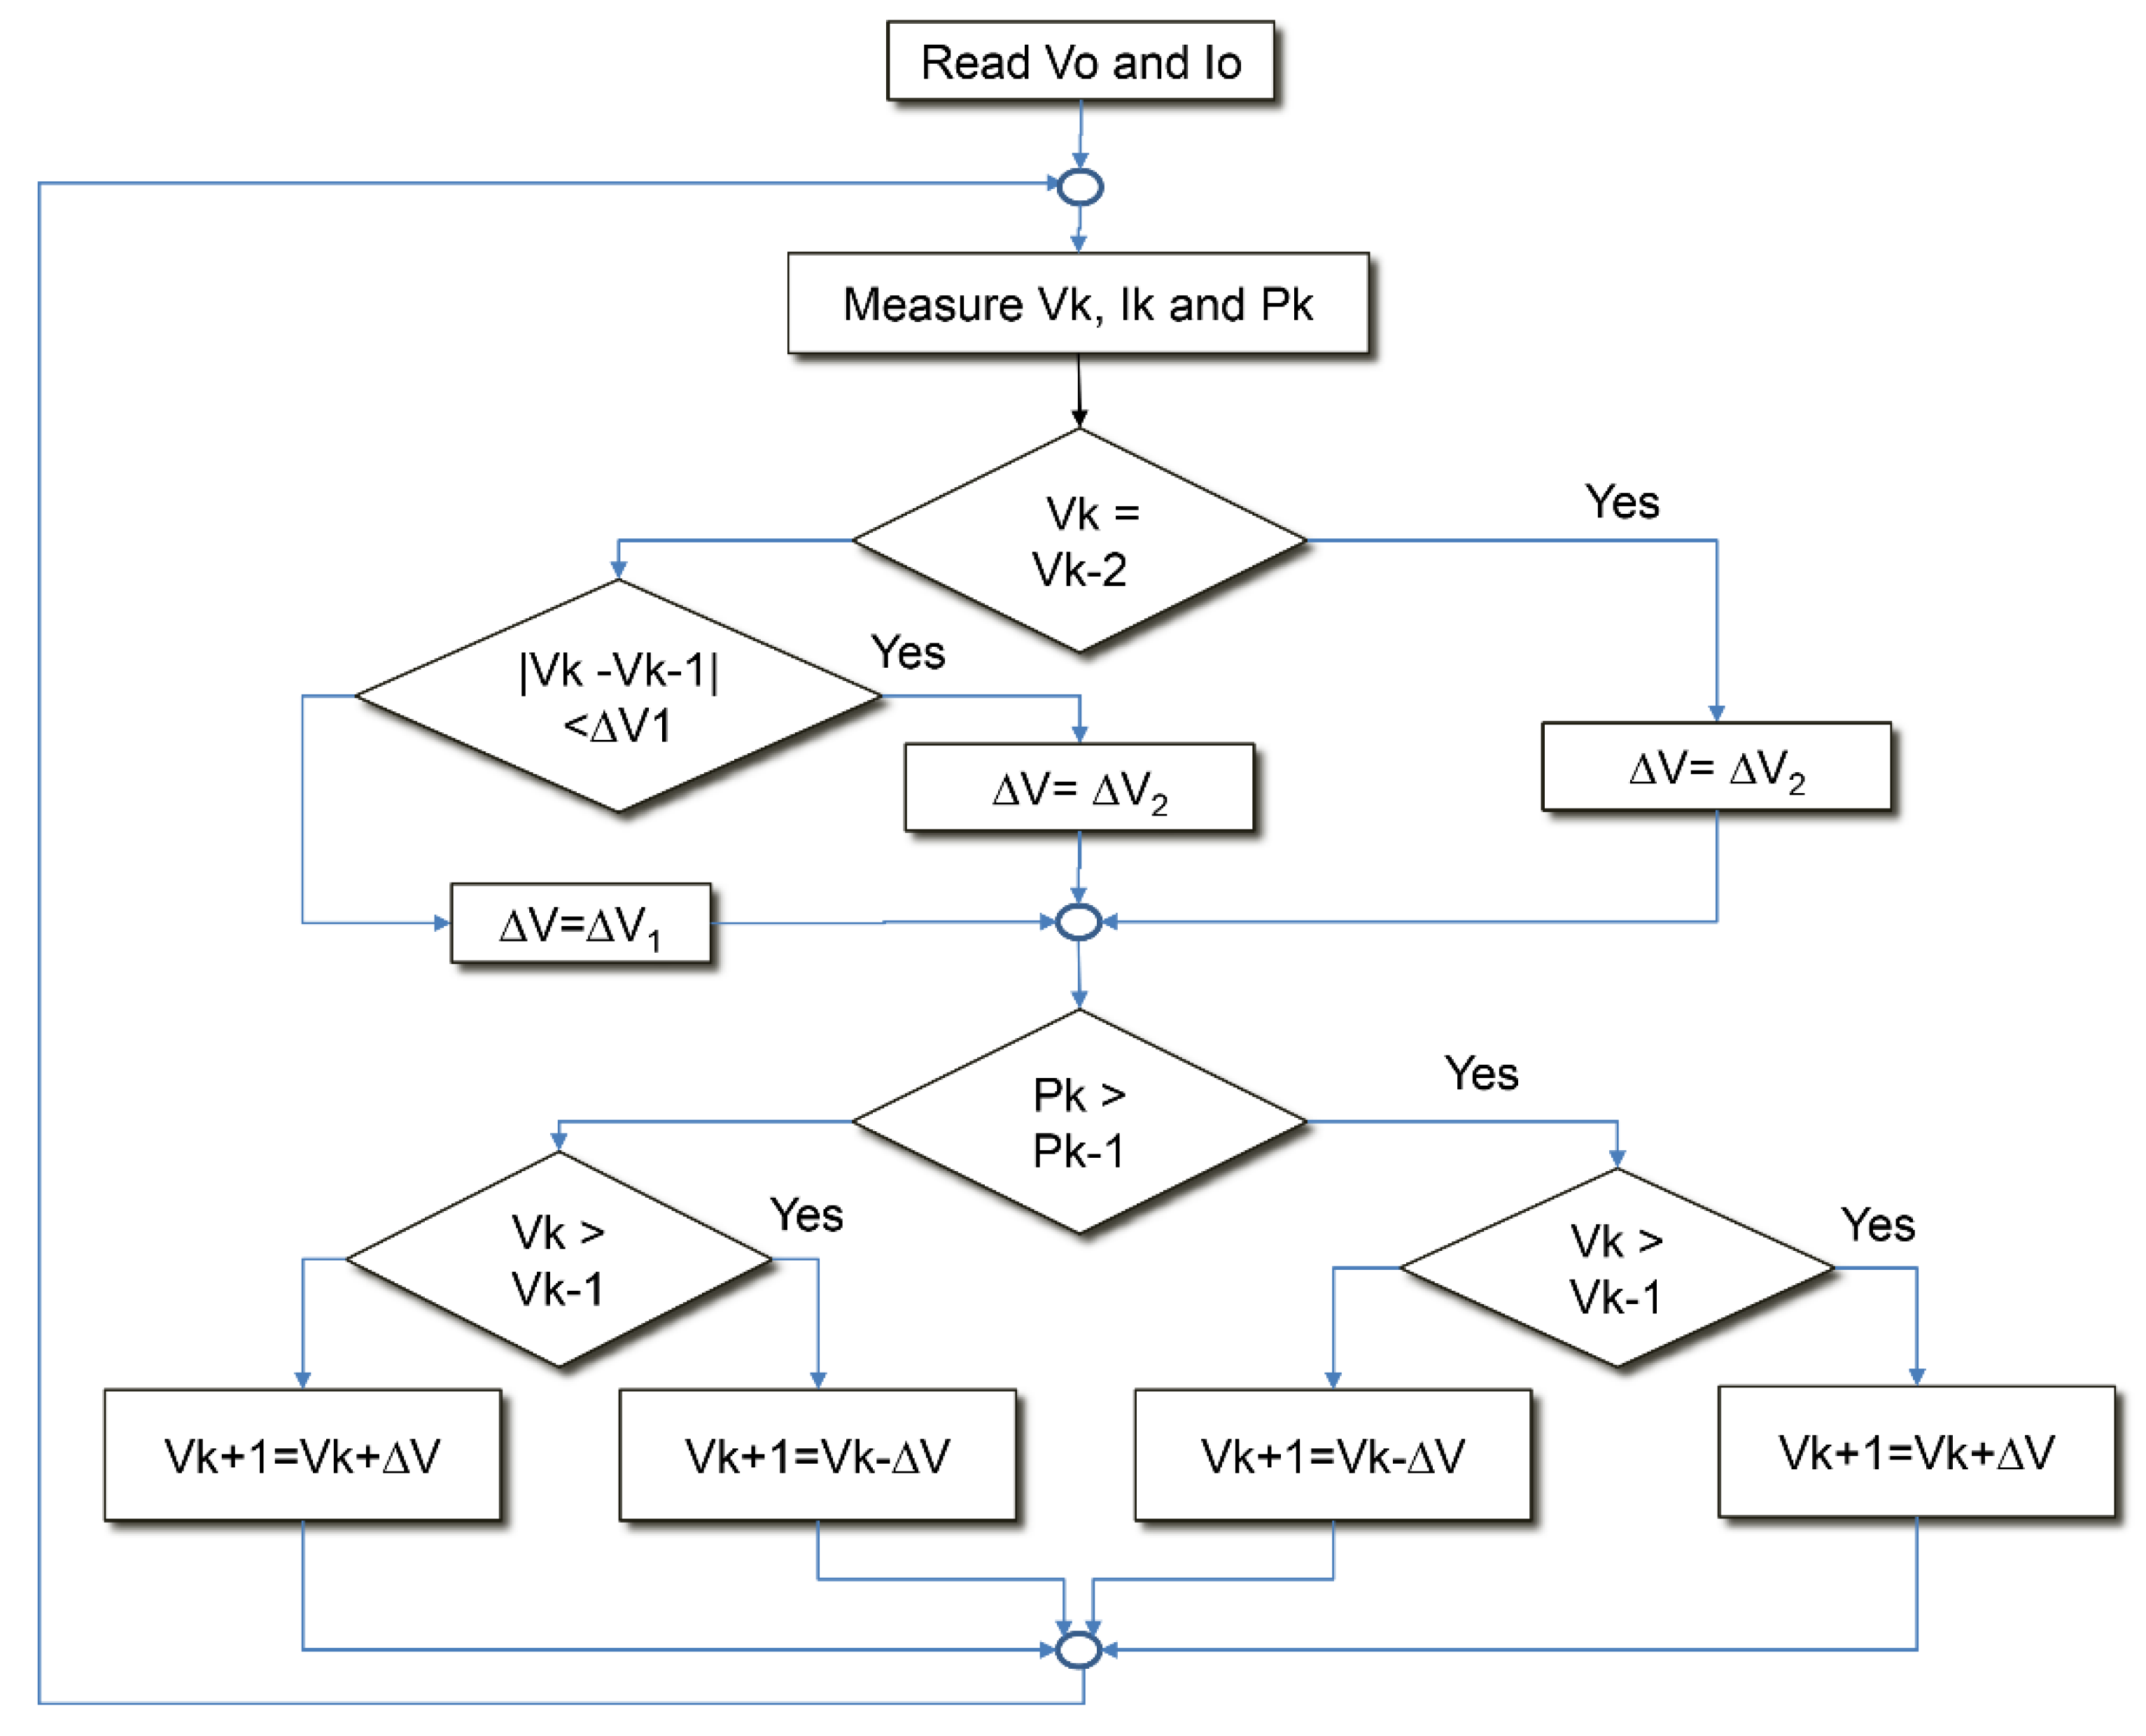
Figure 14.
MPPT simulation results—connection and irradiance step.

Figure 15.
Phase-locked loop block diagram.

Figure 16.
P and Q droop-control structure.

Figure 17.
Energetic macroscopic representation (EMR)-based control methodology. Adapted from [63].
Figure 17.
Energetic macroscopic representation (EMR)-based control methodology. Adapted from [63].

Figure 18.
EMR pictograms.

Figure 19.
Power converter EMR.

Figure 20.
Hybrid DC source and voltage source converter 1—EMR.

Figure 21.
Hybrid DC source and voltage source converter 2—EMR.

Figure 22.
Microgrid 1: two voltage source converters (VSC) serving a load.

Figure 23.
Electrical circuit representation of the microgrid.

Figure 24.
EMR microgrid.

Figure 25.
Testbed microgrid implemented in Simulink.

Figure 26.
Simulation results.


Figure 27.
Daily solar resource and load variation.

Figure 28.
Simulation results of AC/DC microgrid—power profile 1.

Figure 29.
Simulation results of AC/DC microgrid—power profile 2.

© 2020 by the authors. Licensee MDPI, Basel, Switzerland. This article is an open access article distributed under the terms and conditions of the Creative Commons Attribution (CC BY) license (http://creativecommons.org/licenses/by/4.0/).
Share and Cite
MDPI and ACS Style
Solano, J.; Jimenez, D.; Ilinca, A. A Modular Simulation Testbed for Energy Management in AC/DC Microgrids. Energies 2020, 13, 4049. https://doi.org/10.3390/en13164049
AMA Style
Solano J, Jimenez D, Ilinca A. A Modular Simulation Testbed for Energy Management in AC/DC Microgrids. Energies. 2020; 13(16):4049. https://doi.org/10.3390/en13164049
Chicago/Turabian StyleSolano, Javier, Diego Jimenez, and Adrian Ilinca. 2020. "A Modular Simulation Testbed for Energy Management in AC/DC Microgrids" Energies 13, no. 16: 4049. https://doi.org/10.3390/en13164049
Note that from the first issue of 2016, this journal uses article numbers instead of page numbers. See further details here.