Design of an Equivalent Consumption Minimization Strategy-Based Control in Relation to the Passenger Number for a Fuel Cell Tram Propulsion


Department of Mechanical, Energy and Management Engineering, University of Calabria, Arcavacata di Rende, 87036 Cosenza, Italy
*
Author to whom correspondence should be addressed.
Energies 2020, 13(15), 4010; https://doi.org/10.3390/en13154010
Submission received: 30 June 2020
/
Revised: 28 July 2020
/
Accepted: 30 July 2020
/
Published: 3 August 2020
(This article belongs to the Special Issue Observation and Control of a Fuel Cell System for Electric Vehicle Applications)
Abstract
:In this paper, a new control strategy for a fuel cell supercapacitor tramway is tested on a real drive cycle. The control algorithm is based on the equivalent consumption minimization strategy, weighted for the vehicle passenger number. Its implementation is presented by highlighting the customization for a specific drive cycle, located in Reggio Calabria, one of the main cities of southern Italy. The heart of the paper concerns the fuel cell hybrid powertrain, where energy source and DC/DC converter models are formalized and numerically designed; in addition, all the drivetrain components are taken into account through appropriate relations. By means of the drive cycle characteristics, in terms of morphology, vehicle features, and speed, the main components are properly selected, with the aim of avoiding under- and over-sizing issues. A specific case study is analyzed, considering the passenger variation at each tramway stop. Satisfying results are achieved in the simulation campaign: 2.9 kg of hydrogen is consumed for a round trip, with a quasi-constant fuel cell efficiency of more than 50%, while the supercapacitor SOC ranges in a wide interval, between 35% and 95%.
1. Introduction
Nowadays, humankind deals with a major energy crisis in history. The main issues are strictly related to fossil fuel use in low-efficient systems, with huge energy consumptions. Therefore, in order to mitigate the energy crisis and climate change, the effort of national and international governments is oriented towards different strategies for transport sector innovation. Among them, particular focus is on the use of innovative sources to overcome oil dependency, and energy management renovation, for improving the proper use of power sources [1].
In this line of thought, fuel cells and their management strategies could play a leading role in the next future both in stationary applications (mainly using high-temperature fuel cells) and in transport (by means of low-temperature fuel cells), particularly in public services, such as railways [2,3]. As a matter of fact, one of the transport applications that best fit the fuel cell (FC) introduction is railway, since a low number of fueling facilities are needed (only along the line) and a wide space for the hydrogen system location is available within vehicles, reducing safety risks. Numerous advantages can be achieved with an FC-based system as demonstrated in [4], where diesel-hybrid, hydrogen-powered, and hydrogen-hybrid propulsions are compared for a British regional train. Hydrogen-based rails obtain high efficiency compared to the diesel ones, with a significant reduction of the energy consumption: 34% for the hydrogen-only vehicle and 55% for the hybrid vehicle, given by a high efficiency and a regenerative braking strategy. Each rail typology can be powered by a fuel cell hybrid system, as shown in [5]; four drive cycles (urban, interregional passenger, touristic, and regional freight line) with four fuel cell-based rail vehicles (tram, passenger train, railcar, and freight locomotive) are numerically tested, achieving high fuel cell efficiencies, around 50%.
In addition, railway drive cycle characteristics are quite appropriate for fuel cell control strategies, allowing a deep customization and, hence, high performance.
Therefore, these topics are becoming increasingly widespread, and several research groups have built models and prototypes with the aim to investigate fuel cell-based railway performance, as reported in the review in [6].
Among them, in [7], Fragiacomo and Piraino investigated a hybrid control system for a fuel cell-based train, constituted of fuel cell (FC), battery (B) and supercapacitor (SC); high efficiency, approximately 50%, is achieved for a specific drive-cycle ad-hoc implemented. In [8], Mustafa et al. carried out a complete analysis to evaluate the use of FC trains for Dubai; a brief cost and lifetime analysis is performed, evaluating strengths, weaknesses, and opportunities and highlighting the positive results for a case study in Dubai. In [9], Hong et al. proposed an energy management strategy based on a dynamic following coefficient for an FC-B train; the control system can maintain the hybrid system efficiency above 44%, with a strong capacity to sustain the battery state of charge. In [10], Zhang et al. implemented a firefly algorithm to optimize the standard equivalent consumption minimization strategy (ECMS) for an FC-B-SC tram. An accurate analysis is conducted and the strategy designed is compared with other algorithms, based on operative mode control and ECMS, achieving operating cost and fuel consumption saving (more than 13.81% and 20.75%) and FC efficiency improvements (more than 0.5%). In [11], Liu et al. proposed an energy management strategy based on Pontriagin′s minimum principle to control an FC-SC rail powertrain; using this strategy, a 5% increment of energy conservation rate is achieved, with a consequent reduction of the hydrogen consumption. In [12], Garcìa et al. carried out a comparison analysis on five different control strategies useful for managing an FC-B-SC tramway. The simulation results show that the operation mode control obtains the highest hybrid vehicle efficiency (53.20%) compared to the other control system: predictive control (53.12%), fuzzy logic control (52.86%), equivalent consumption minimization strategy (52.64%) and cascade control (51.47%).
The control systems presented are advanced, high-performing, and innovative and they are implemented taking into consideration the powertrain parameter variation, such as efficiency, hydrogen consumption, and state of charge. Nevertheless, none of them consider the passenger number onboard the railway, the main parameter that causes power and energy demand changes in railways. Therefore, in this paper, a control system weighted for the passenger number is presented, based on the equivalent consumption minimization strategy. In addition, a proper sizing test is shown for a fuel cell-supercapacitor powertrain, according to the power and energy variation demand. In the end, a case study for a real drive-cycle, that links the Reggio Calabria Airport with the Mediterranea University, is investigated, considering a specific timetable and estimating the passenger number variation between the stops.
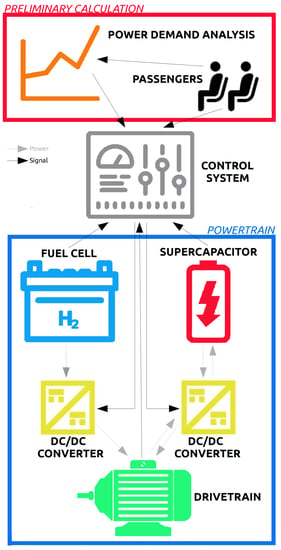
2. Powertrain Modeling
2.1. Preliminary Calculation
In this paper, a fuel cell hybrid tramway is tested on a real route. Typically, a tramway power demand is the most appropriate for the fuel cell use among rail applications, since its parameters assume moderate values. However, tramway rapid power variations do not recommend a powertrain constituted by a fuel cell stack only; the energy storage system use is mandatory, to avoid rapid fuel cell deterioration. Therefore, the fuel cell and energy storage characteristics and their sizing are strictly correlated with the vehicle demands and they can be very variable since there is not a canonical powertrain for every tramway [13]. The power demand prediction results crucial in a preliminary phase, in order to select a suitable configuration for the line tested. The input parameters are the track morphology, the vehicle drive-cycle, and the tramway physical characteristics. To calculate the power demand, Equation (1) is used, where the traction power depends on: the mass times acceleration term; the resistive power, that considers the vehicle frictions in relation to air and rail; the track slope, useful for ascent and descent phases. All the terms are explained in the Nomenclature. The resistive power can be evaluated by the Davis equation, where A, B, and C terms depend on vehicle characteristics. It should be underlined that each term used for the power demand is a function of the passenger number.
During the sizing test, all the losses caused by the powertrain components have to be considered; although they cannot be known a priori, an efficiency estimation for each component, is needed to select suitable energy source sizes.
2.2. Energy Management System
Fuel cell systems achieve good performance and long lifespan when they operate in quasi-steady-state conditions, without working as power variation providers, avoiding starvation issues; thusly, the proper fuel cell behavior is guaranteed, avoiding premature damages, e.g., starvation issues. For this reason, a vehicle powered only by fuel cells is often not recommended; on the contrary, fuel cell hybrid systems can be a high-performing solution for different applications in the transport field. However, the introduction of new degrees of freedom, namely the power-rate choice of different energy sources, inevitably leads to higher complex systems. The power-sharing of fuel cell hybrid vehicles constitutes a sensitive issue, that affects the system response, efficiency, and lifespan.
The control system implementation needs a deep knowledge of the vehicle components and transport application to be managed; better performance can be reached when the control system is implemented ad-hoc for specific uses, considering features and peculiarities of the energy sources and vehicle drive-cycle. Compared to other transportation uses, railways are designed for a specific travel route; therefore, the speed and track morphology are always the same and the power and energy demand mainly change according to the train weight, namely the number of passengers and/or goods transported.
For these reasons, an equivalent consumption minimization strategy (ECMS), weighted for rail passenger number, is considered for the case study analyzed. The ECMS, designed by Paganelli et al. [14], is a strategy based on optimization algorithms, operating in real-time, with a moderate computational burden. In the present case study, it is used to calculate the optimal power that the fuel cell system should supply, according to the fuel cell and energy storage system parameters.
The reference power output is achieved by solving the objective function minimization, reported in Equation (2), that represents the instantaneous hydrogen consumption of the vehicle.
The fuel cell consumption is indicated with cFC, achieved through a polynomial fit, that emulates the hydrogen consumption of the fuel cell model. The equivalent hydrogen consumption, owing to the supercapacitor, ceq,SC, is calculated considering the average fuel cell consumption, the fuel cell, and the supercapacitor powers, as reported in Equation (3).
A particular focus is on the equivalence factor (keq), shown in Equation (4), since the power calculation is very sensitive to this parameter that correlates fuel cell and supercapacitor outputs. In addition, the equivalence factor, conveniently calibrated, allows the correct role of the supercapacitor as a power variations provider, guaranteeing an energy consumption equal to 0 kWh at the end of the cycle.
As a matter of fact, the SC state of charge (SOC) is considered to avoid supercapacitor improper operations; the fuel cell power output is varied according to the ratio between initial and current SOC, using a proper supercapacitor comparative factor (kSC) that assumes different values for charging and discharging mode.
Another important parameter is k1, useful for taking into account the drive cycle characteristics; in equivalent consumption minimization strategies, better performance can be reached if some drive cycle features are implemented in the control system. For this reason, the k1 calculation is obtained by means of an iterative approach: during the first instants, k1 is varied in order to achieve the average drive cycle power as output of the control strategy; once the suitable value is reached, k1 is maintained constant for the whole drive cycle time.
The key factor of the innovative strategy presented is kpass, which depends on the passenger number and it is updated after every stop. Its characterization is achieved for a specific journey simulated and vehicle typology used; thusly, it is possible to predict the power variations due to the weight change with good accuracy.
After the fuel cell power calculation, the supercapacitor is managed using simple power equilibriums, considering the drive cycle, fuel cell, and regenerative braking power, as shown in Equations (5) and (6), for acceleration and deceleration modes, respectively. The fuel cell and supercapacitor powers, reported in Equations (2), (5), and (6), are elaborated and, by means of the ratio between reference powers and real-time device voltage, shown in Equations (7) and (8), the reference currents are calculated.
2.3. Energy Sources
The energy and power demands are provided by the energy sources. In detail, according to the control strategy implemented, the energy of the whole cycle is supplied by the fuel cell, by means of the electrochemical reaction that uses the chemical energy of hydrogen. Therefore, the amount of hydrogen stored in the onboard train tanks fulfills the vehicle demands and electric recharges are not needed. According to the drive-cycle characteristics, the supercapacitor results are suitable for tramway demands, achieving high performance. It is useful for providing power and energy variations, but its energy consumption at the end of the cycle is 0 kWh, thanks to the control system. In other words, the SC state of charge assumes the same value at the start and end of the drive-cycle.
2.3.1. Fuel Cell
The core of the whole powertrain is the fuel cell stack, capable of transforming the hydrogen chemical energy into an electrical one and having water and heat as byproducts. Among fuel cells, proton exchange membrane (PEM) fuel cells are the most used for transport applications and also for some other stationary uses; this is due to their low operating temperature, high power density, specific energy, and fast start-up time [15]. As a matter of fact, fuel cell operative temperatures are about 80–100 °C, given by the high electrolyte performance at low temperatures, that leads to fast start-up time. In addition, it can reach a high power level with compact dimensions; the high specific energy is an indirect feature, owing to the hydrogen storage type [16].
The fuel cell stack is numerically modeled in dynamic conditions through numerous relations linked to electrical, thermodynamic, and chemical processes. Its model has been formalized and later implemented ad hoc, in order to accurately study the PEM performance in the advanced application presented [7]. Nevertheless, several simplifications have been considered, such as the supply manifold neglecting and ideal humidifier behavior, thus achieving a satisfying accuracy for the case study analyzed. The PEM model is based on the equivalent circuit, where the electrochemical model plays a pivotal role. The Nernst voltage, namely the ideal voltage, is the first term of Equations (9)–(10) and is the input of the voltage source. A particular focus is on the partial pressures, obtained by the derivative of the gas law, solved through the Laplace transformation [7].
The PEM current is imposed by the DC/DC converter, according to the control strategy decisions, while the real voltage is achieved by the difference between the Nernst voltage and the activation (Vact), ohmic (Vohm), and concentration losses (Vconc), as shown in Equations (9)–(10). The former are due to the slow kinetics of the reactions and they are good represented by the Tafel equation, calculated as the logarithm of the ratio between fuel cell (IFC) and exchange current (I0). The ohmic losses are caused by the internal resistance of the system, achieved using Ohm’s law. The latter, namely the concentration losses, occur at high currents, for the gradient of the reactant concentration; this phenomenon is approximated by the last terms of Equations (9)–(10), function of the operative and maximum (Imax) fuel cell currents.
It should be underlined that, among the losses parameter calculations, the exchange current and charge transfer coefficient (αFC) are obtained by means of an iterative process. The electrochemical model allows for acquiring all the main PEM parameters, including efficiency and hydrogen mass flow rate.
The hydrogen mass flow rate is crucial for the control strategy used, and its calculation is shown in Equation (11), depending on the cell number (Nc), fuel cell current and utilization factor (Uf). Regarding the fuel cell efficiency, it is calculated in Equation (12) as the ratio between output and input powers, respectively the fuel cell output and the chemical power contained in the hydrogen mass flow rate consumed. The main constant used in the model is listed in Table 1.
2.3.2. Supercapacitor
Among the electrical energy sources, supercapacitors occupy an intermediate position between battery and capacitor, owing to their characteristics. They are suitable for responding to high-frequency power demands, both in charge and discharge operations. Compared to batteries with the same size, it could provide higher power amounts, up to a hundred times, with lower energy density, between 3 and 30 times. The vehicle and drive cycle features are fundamental to properly use the supercapacitor as an energy storage system, since the increase of vehicle weight and occupied space and the power and energy demand trends need to be considered. For these reasons, supercapacitors are not widely used in transports.
Usually, rail drive cycles have sudden power components, that can be well managed by supercapacitors. An electric double-layer capacitor (EDLC) supercapacitor is used for this transport application. Several assumptions are considered, such as neglecting the aging and temperature effect and, also, the cell balancing. As with the PEM fuel cell, an equivalent circuit is used, constituted of a voltage source and an equivalent resistance, that is considered constant for both charge and discharge phases. The value of the voltage source is achieved by means of the Stern equation, expressed in Equation (13) [17]. Among the main outputs, particular focus is oriented on the state of charge which is an important parameter in the control strategy; the SOC calculation is shown in Equation (14) [17].
2.4. DC/DC Converters
The energy sources are connected to the drivetrain subsystem by means of DC/DC converters, mainly to manage them, imposing the power rate by means of strategy decisions, and protect them from sudden voltage variations that can lead to premature damages [18].
A unidirectional boost converter, shown in Figure 1a, is selected to link the fuel cell and the drivetrain system; it is useful for increasing the PEM voltage to the 800 V DC bus one.
Regarding the supercapacitor, a bi-directional buck-boost converter is used, mainly to store the regenerative energy in the storage system, shown in Figure 1b.
These power electronics devices are modeled using all their electrical components, not by means of electrical correlations. They are satisfyingly controlled according to the fuel cell and supercapacitor current demands. In detail, the DC/DC converter duty cycle is managed by evaluating the current error, namely the difference between the reference current value, calculated by means of the control system (Equations (7) and (8)), and the real current value, the one measured at the DC/DC converter. Operating on the on-off periods of the DC/DC converter switches, the error achieved is changed with the aim of reducing the difference between the real and reference currents.
2.5. Drivetrain
The energy sources used are in parallel and are connected to an 800 V DC bus. Therefore, the voltage obtained is direct and single-phase. Since an AC motor is used, owing to its good performance, an inverter connects the DC bus to the motor. It can convert the single-phase and direct current in the sinusoidal and three-phase one, allowing the voltage control, in terms of amplitude and phase shift angle, managing the motor outputs.
The terminal part of the electric system is the motor and it converts the electric power into mechanical power. Nowadays, among the motor types, the permanent magnet synchronous motor (PMSM) is the most used in vehicle applications because of its characteristics, i.e., high specific power, torque, and higher efficiency compared to the other motor typologies [19].
The motor torque and speed are converted in those needed at the wheels by means of the gearbox, which is a mechanical component, useful for connecting driveshaft and motor. In electric railways, one gear ratio can be used, with higher efficiency compared to more complex systems.
Inverters, motors, and gearboxes are bidirectional devices because the power can flow in both directions and, consequently, the motor can work as a generator, during deceleration phases, and as a motor, during acceleration phases. Thusly, a regenerative braking strategy can be implemented in the control strategy, leading to an overall efficiency improvement. The detailed modeling of the drivetrain components is beyond the scope of the present paper, but they are taken into account considering energy losses and, hence, component efficiencies, which are listed in Table 2.
3. Simulations
In this paper, a fuel cell-based powertrain is tested for a specific case study in order to verify the features of the new control strategy implemented. First, to proceed with the result analysis, preliminary calculations are performed: the power demand analysis, the sizing testing, and the control system characterization.
3.1. Power Demand Analysis
Once the model is implemented, the tramway drive-cycle is studied, so as to customize different parameters of the powertrain energy sources and control system. This preliminary analysis is mainly related to the transport application tested; as a matter of fact, the railway drive cycle has a quasi-constant trend for a specific line, repeating itself many times in daily operation. For this reason, the powertrain characterization assumes a pivotal role for railways, in order to achieve high performance, low consumption, and good behavior for each vehicle component.
The case study analyzed concerns a fuel cell hybrid tramway, that travels on a new line, in the city of Reggio Calabria. The track tested is useful for connecting the Reggio Calabria Airport with the Mediterranea University, stopping in the central rail station. This line could be crucial for University students and workers who come from every part of the Calabria Region; in addition, it offers an important public service for inhabitants, guaranteeing a further transport mode for moving within the city in an efficient and fast way.
The input variables of the model are the track morphology, the vehicle features, and the drive cycle. The former can be easily achieved since the railway track is chosen and, in the same way, the vehicle is selected among the standard ones for tramways; on the contrary, specific information is unknown for the drive cycle and, therefore, a simplified speed trend is used.
In detail, regarding the track morphology of the Reggio Calabria line, as with standard urban lines, the altitude varies in a small interval, between 5 m a.s.l. and 30 m a.s.l., with slow altitude variations, which leads to low slope variations, with a maximum value of 10‰; in addition, the track length is approximately 17 km for a round trip. Concerning the vehicle, Table 3 summarizes the main rail parameters; a standard light-rail vehicle is used, weighing 35 t with 30 m length. In addition, the Davis coefficients are also reported, useful for taking into account the resistive forces during the power demand calculation. A 40 kW constant consumption is considered for auxiliary systems, such as door, light, and air-conditioning management.
The drive-cycle for the scenario studied is briefly summarized in Table 4. The drive cycle parameters are chosen in order to respect the journey time imposed and the standard speed and acceleration values for urban transports. The maximum values achieved are 50 km/h and 0.5 m/s2 for speed and acceleration respectively. In addition, 16 stops are planned, considering 30 s stop; only a 5 min stop is considered when the vehicle completes the one-way track and reaches the end of the line.
The input parameters discussed, namely track morphology, vehicle characteristics, and drive-cycle, are used to calculate the power and energy demand for a round trip, shown in Figure 2. Moderate power values and high-power variations, mainly owing to the frequent starts and stops, are achieved, in line with the standard tramway features. The maximum power is 350 kW in acceleration phases and −300 kW in deceleration ones. The energy consumption is 55 kWh, considering the energy rate needed for the traction mode and the one that occurs during the braking operations, which can be in part recovered by means of the braking recovering strategy implement.
3.2. Sizing Test
The power and energy demands are fundamental to perform a proper sizing test, in order to achieve good performance with a reduced powertrain weight. The drive cycle presented lends itself well for a hybrid system, constituted to fuel cell and supercapacitor systems, given by its energy parameters, shown in Figure 2. The power and energy trends are those needed for the appropriate motion of the vehicle; nevertheless, the energy sources provide higher output values, in order to contemplate the losses of each powertrain component. Therefore, in sizing tests, the average efficiencies of converters and drivetrain systems are used, with the aim to avoid the energy source under-sizing.
In addition, in hybrid vehicles, basic principles for the sizing problem concern the role of each energy source; in other words, each component should perform a specific task so as to obtain a long lifespan and not incur over-sizing and under-sizing issues.
The fuel cell is the prime mover, supplying all the energy amount, since external electric charge operations are not considered; therefore, the minimum size needed can be easily calculated by the drive cycle average power. A 90 kW Hydrogenics HyPM is chosen [20] and its main characteristics are listed in Table 5, such as operating current and voltage, respectively in ranges between 0–500 A and 180–360 V. The validation test is shown in Figure 3, comparing model and real data [20]; the error made is less than 1%.
A different approach is pursued for the energy storage system sizing. Since the fuel cell works in quasi steady state operations, the energy storage system is used for providing energy and power variations. According to the component used, different methodologies can be implemented to select the proper device size. Supercapacitors, as mentioned above, stand out among the other conventional energy sources used in transport, namely batteries, by the higher power density; however, the low energy density is a limiting factor for its use. For these reasons, only the drive-cycle energy variations can be investigated for the supercapacitor sizing, contrary to the battery one; as a matter of fact, power variations can be easily handled, thanks to the high supercapacitor power density.
Therefore, Figure 4 shows the drive-cycle energy variations for each instant of time, namely the difference between the average energy value and the real one up to time t. This graph indicates the energy amount that the supercapacitor has to supply, since the average energy value is provided by the PEM. The sizing test is related to the maximum energy variation, that is 3 kWh; for this reason, a 68 F Maxwell pack [21], composed of 5 series and 4 parallels components, is used. Unlike the fuel cell, the supercapacitor has been validated by the authors in [7].
3.3. Control System Characterization
Control systems are often customized according to the transport application, in order to allow a proper power sharing, managing appropriately each energy source. The equivalent consumption minimization strategy modeled in this paper is implemented ad hoc for this case study, taking into account two different aspects: the energy sources used and the drive-cycle.
The algorithm is based on the equivalent hydrogen consumption strategy and the main focus is on the fuel cell system, which is directly managed by the control system. Its consumption is achieved through a polynomial fit, which is compared with the PEM model; the hydrogen consumed, for different power rates, is used for the curve fitting. Figure 5 shows the satisfying results obtained with a 3-degrees curve, by means of the coefficient reported in Table 6, making an error less than 0.5%.
In addition, the supercapacitor characteristics are integrated into the ECMS; the equivalence factor is calibrated according to the state of charge variations. Since the supercapacitor is defined by sudden and deep SOC oscillations, linked to the high specific power and low specific energy, it is not suggested having a direct correlation between supercapacitor SOC and PEM power. For these reasons, the supercapacitor comparative factor (kSC) has a low value, both for charge and discharge periods.
The innovative peculiarity of the implemented control strategy is the relation between algorithm decision and drive-cycle variations. The passenger number is the most significant parameter that influences power demand changes; therefore, in this strategy, it is taken into account by means of kpass factor. A deep investigation of the power demand trend at different passenger numbers is required to accurately calibrate the kpass factor. The demand variation, according to the passenger number, results almost linear, mainly owing to the constant track morphology; therefore, a linear relation is used to calculate the weight factor, as shown in Equation (15).
4. Results
The case study under consideration consists of a performance analysis of the FC-based powertrain on a real drive cycle, that connects the Reggio Calabria Airport with the Mediterranea University. The drive cycle has 16 stops for a round trip and a passenger number variation is estimated for each stop during the public service operations, as shown in Table 7.
According to the passenger on board, the vehicle power and energy demands change; therefore, the control system dynamically adapts to the variations, by properly managing the fuel cell power.
Figure 6 shows the fuel cell power, efficiency, and hydrogen consumption. The control system maintains the fuel cell power in a narrow interval, with slow variations, between 30 kW and 75 kW; it changes the PEM power according to the SOC variations and the passengers on board. Consequently, high efficiency levels are reached, up to 51%, with an average value of 50.5%. Regarding the hydrogen consumption, it has a quasi linear trend, with a higher slope in the first phase (from airport to university) compared to the second one (university to airport); it is 2.9 kg/cycle, with almost 0.2 kgH2/km, mainly due to the moderate vehicle speed and track slope.
Figure 7 displays the supercapacitor outputs, namely power and state of charge. The supercapacitor works as the supplier of power and energy variations, therefore its power follows the power demand trend. Numerous power variations at high frequency are supplied, within a wide interval between −300 kW and 200 kW, fulfilling the main vehicle requests in acceleration and deceleration phases. The supercapacitor operates by exploiting its characteristics; as a matter of fact, its SOC varies in a wide interval, between 40% and 95%.
Therefore, the control strategy allows that each energy source, namely the fuel cell as the prime mover and the supercapacitor as the power and energy variation provider, work properly, obtaining high performance for the real drive cycle analyzed.
5. Conclusions
In this paper, a new control system is implemented ad-hoc and tested to manage a fuel cell hybrid system for a real tramway drive cycle. Energy sources, DC/DC converters, and the control system are numerically modeled, by means of formalization and implementation activities. The control strategy is designed to achieve high performance for each energy source, according to the component role, such as the prime mover (fuel cell) and the energy and power variation provider (supercapacitor). This is achieved using a control system based on an equivalent consumption minimization strategy, weighted for the passenger number on board the tramway. The control system characterization, as well as the component sizing, is performed by means of a detail investigation of the drive cycle track; an urban line, located in Reggio Calabria, is used to connect the Airport with the Mediterranea University. The simulation results demonstrate the satisfying behavior of the control system for the track used. High performance is achieved: the fuel cell system reaches high efficiency, with an average value of 50.5%, and moderate hydrogen consumption of approximately 0.2 kgH2/km, for a round-trip consumption of 2.9 kgH2/cycle; the supercapacitor operates in a wide SOC interval, between 40% and 95%.
The hybrid powertrain presented could constitute an innovative solution as an alternative propulsion for public transport services. The FC-based vehicle studied could be an efficient answer for reducing the environmental impact of the transport sector. In addition, the control system turns to be a valid tool to managing fuel cell hybrid trams, receiving data on the passenger number by means of real-time measurements or using statistical approaches, given by big data analysis.
Author Contributions
All the authors have contributed equally to the research activity, numerical simulations and manuscript preparation. All authors have read and agreed to the published version of the manuscript.
Funding
This research received no external funding.
Conflicts of Interest
The authors declare no conflict of interest.
Nomenclature
| Fuel cell system | ||
| αFC | Charge transfer coefficient | - |
| ΔG0 | Standard Gibbs energy | J mol−1 |
| E0 | No load voltage | V |
| EN | Nernst voltage | V |
| ηFC | Fuel cell efficiency | - |
| F | Faraday’s constant | C mol−1 |
| IFC | Fuel cell current | A |
| IFC,ref | Fuel cell reference current | A |
| I0 | Exchange current | A |
| Imax | Maximum FC current | A |
| LHV | Lower heating value | MJ kg−1 |
| ṁH2in | Hydrogen in input | kg s−1 |
| MWH2 | Hydrogen molecular weight | g mol−1 |
| Nc | Number of cell | - |
| pH2 | Hydrogen partial pressure | atm |
| pH2O | Water partial pressure | atm |
| pO2 | Oxygen partial pressure | atm |
| PAUX | Auxiliary power | kW |
| PFC | Fuel cell power | kW |
| PFC,ref | Fuel cell reference power | kW |
| PRB | Power recuperate by brake | kW |
| Pacc | Acceleration power | kW |
| R | Universal gas constant | J K−1 mol−1 |
| RFC | FC internal resistance | Ω |
| TFC | Absolute temperature of FC | K |
| T0 | Ambient temperature | K |
| Uf | Utilization factor | - |
| Vact | Activation over voltage | V |
| Vconc | Concentration over voltage | V |
| VFC | Fuel cell voltage | V |
| Vohm | Ohmic over voltage | V |
| z | Number of electrons transferred | - |
| Supercapacitor system | ||
| Ai | Interfacial area between electrodes and electrolyte | m2 |
| c | Molar concentration | mol m−3 |
| d | Molecular radius | m |
| ε | Permittivity of material | F m−1 |
| ε0 | Permittivity of free space | F m−1 |
| ISC | Supercapacitor current | A |
| ISC,ref | Supercapacitor reference current | A |
| Ne | Number of layers of electrodes | - |
| Np | Number of parallel supercapacitors | - |
| Ns | Number of series supercapacitors | - |
| PSC | Supercapacitor power | kW |
| PSC,ref | Supercapacitor reference power | kW |
| Qint | Initial electric charge | A h |
| QT | Electric charge | A h |
| RSC | Total resistance | Ω |
| SOCSC | State of charge of supercapacitor | - |
| SOCSC,in | State of charge of supercapacitor at initial time | - |
| TSC | Supercapacitor Operating temperature | K |
| VSC | Supercapacitor voltage | |
| Control system | ||
| ap | Coefficient a of the polynomial curve | g s−1 kW−3 |
| bp | Coefficient b of the polynomial curve | g s−1 kW−2 |
| cp | Coefficient c of the polynomial curve | g s−1 kW−1 |
| cFC | Hydrogen consumption | g s−1 |
| Average of Hydrogen consumption | g s−1 | |
| Ceq,SC | Hydrogen equivalent consumption of ESS | g s−1 |
| dp | Coefficient d of the polynomial curve fitting | g s−1 |
| k1 | Coefficient 1 | - |
| kpass | Passenger factor | - |
| kSC | Supercapacitor comparative factor | - |
| keq | Equivalence factor | - |
| npass | Passenger number | - |
| Pv | Power required by the vehicle | kW |
| Preliminary calculation | ||
| α | Track slope angle | grad |
| A | Davis Coefficient A | N |
| B | Davis Coefficient B | N s m−1 |
| C | Davis Coefficient C | N s2 m−2 |
| g | Gravitational acceleration | m s−2 |
| λ | Dynamic mass coefficient | - |
| M | Vehicle mass | kg |
| Ptr | Tractive power | kW |
| t | Time | s |
| v | Speed | m s−1 |
References
- Shtessel, Y.B.; Ghanes, M.; Ashok, R.S. Hydrogen Fuel Cell and Ultracapacitor Based Electric Power System Sliding Mode Control: Electric Vehicle Application. Energies 2020, 13, 2798. [Google Scholar] [CrossRef]
- De Lorenzo, G.; Fragiacomo, P. Technical analysis of an eco-friendly hybrid plant with a microgas turbine and an MCFC system. Fuel Cells 2010, 10, 194–208. [Google Scholar] [CrossRef]
- Rusu, F.A.; Baciu, A.G.; Livint, G. Applicability of Fuel Cell in Electric Vehicles. In Proceedings of the 2018 International Conference and Expositions on Electrical and Power Engineering (EPE), Iaşi, Romania, 18–19 October 2018. [Google Scholar]
- Hoffrichter, A.; Roberts, C.; Hillmansen, S. Conceptual propulsion system design for a hydrogen-powered regional train. IET Electr. Syst. Transp. 2016, 6, 56–66. [Google Scholar] [CrossRef] [Green Version]
- Fragiacomo, P.; Piraino, F. Fuel cell hybrid powertrains for use in Southern Italian railways. Int. J. Hydrogen Energy 2019, 44, 27930–27946. [Google Scholar] [CrossRef]
- Siddiqui, O.; Dincer, I. A Review on Fuel Cell-Based Locomotive Powering Options for Sustainable Transportation. Arab. J. Sci. Eng. 2018, 44, 677–693. [Google Scholar] [CrossRef]
- Fragiacomo, P.; Piraino, F. Numerical modelling of a PEFC powertrain system controlled by a hybrid strategy for rail urban transport. J. Energy Storage 2018, 17, 474–484. [Google Scholar] [CrossRef]
- Mustafa, M.Y.; Al-Mahadin, A.; Kanstad, B.E.; Calay, R.K. Fuel cell technology application for Dubai rail systems. In Proceedings of the 2018 Advances in Science and Engineering Technology International Conferences (ASET), Abu Dhabi, UAE, 6 February–5 April 2018. [Google Scholar]
- Hong, Z.; Zhu, Y.; Shang, W.; Li, Q.; Chen, W. Research of energy management strategy for fuel cell/battery hybrid locomotive. In Proceedings of the 2017 IEEE Transportation Electrification Conference and Expo, Asia-Pacific (ITEC), Chicago, IL, USA, 22–24 June 2017. [Google Scholar]
- Zhang, H.; Yang, J.; Zhang, J.; Song, P.; Xu, X. A Firefly Algorithm Optimization-Based Equivalent Consumption Minimization Strategy for Fuel Cell Hybrid Light Rail Vehicle. Energies 2019, 12, 2665. [Google Scholar] [CrossRef] [Green Version]
- Liu, J.; Wu, X.; Li, H.; Qi, L. An optimal method of the energy consumption for fuel cell hybrid tram. Int. J. Hydrogen Energy 2020, 45, 20304–20311. [Google Scholar] [CrossRef]
- García, P.; Torreglosa, J.P.; Fernández, L.M.; Jurado, F.; Fernández-Ramírez, L.M. Control strategies for high-power electric vehicles powered by hydrogen fuel cell, battery and supercapacitor. Expert Syst. Appl. 2013, 40, 4791–4804. [Google Scholar] [CrossRef]
- Fragiacomo, P.; Piraino, F. Fuel Cell-Based Powertrain Analysis for Tramway Systems; SAE: Warrendale, PA, USA, 2019. [Google Scholar]
- Paganelli, G.; Delprat, S.; Guerra, T.M.; Rimaux, J.; Santin, J. Equivalent consumption minimization strategy for parallel hybrid powertrains. IEEE Veh. Technol. Conf. 2002, 4, 2076–2081. [Google Scholar] [CrossRef]
- Araya, S.S.; Zhou, F.; Sahlin, S.L.; Thomas, S.; Jeppesen, C.; Kær, S.K. Fault Characterization of a Proton Exchange Membrane Fuel Cell Stack. Energies 2019, 12, 152. [Google Scholar] [CrossRef] [Green Version]
- Kadyk, T.; Winnefeld, C.; Hanke-Rauschenbach, R.; Krewer, U. Analysis and Design of Fuel Cell Systems for Aviation. Energies 2018, 11, 375. [Google Scholar] [CrossRef] [Green Version]
- Motapon, S.N.; Dessaint, L.-A.; Al-Haddad, K. A Comparative Study of Energy Management Schemes for a Fuel-Cell Hybrid Emergency Power System of More-Electric Aircraft. IEEE Trans. Ind. Electron. 2013, 61, 1320–1334. [Google Scholar] [CrossRef]
- Chakraborty, S.; Vu, H.-N.; Hasan, M.M.; Tran, D.; El Baghdadi, M.; Hegazy, O. DC-DC Converter Topologies for Electric Vehicles, Plug-in Hybrid Electric Vehicles and Fast Charging Stations: State of the Art and Future Trends. Energies 2019, 12, 1569. [Google Scholar] [CrossRef] [Green Version]
- Torrent, M.; Perat, J.I.; Jiménez, J.A. Permanent Magnet Synchronous Motor with Different Rotor Structures for Traction Motor in High Speed Trains. Energies 2018, 11, 1549. [Google Scholar] [CrossRef] [Green Version]
- Datasheet Hydrogenics HypM HD 90 Kw. 2020. Available online: https://pdf.directindustry.com/pdf/hydrogenics/hypm-hd-90/33492-420317.html (accessed on 20 June 2020).
- Datasheet Maxwell BMOD0063-P12 Module 125 V. 2020. Available online: http://www.maxwell.com/images/documents/125vmodule_ds_1014696-7.pdf (accessed on 20 June 2020).
Figure 1.
Converter simplified layout: (a) DC/DC boost converter; (b) DC/DC buck-boost converter.

Figure 2.
Power and energy demand.

Figure 3.
Fuel cell validation test.

Figure 4.
Energy variations.

Figure 5.
Polynomial curve fitting.

Figure 6.
Fuel cell outputs.

Figure 7.
Supercapacitor outputs.


Table 1.
Main fuel cell system constant.
| Parameter | Value |
|---|---|
| No load voltage (E0) | 0.8 (V) |
| Faraday’s constant (F) | 96484 (C mol−1) |
| Lower heating value (LHV) | 33.3 (kWh kg−1) |
| Hydrogen molecular weight (MWH2) | 1.00794 (g mol−1) |
| Universal gas constant (R) | 8314.47 (J K−1 mol−1) |
| Ambient temperature (T0) | 298.15 (K) |
| Number of electrons transferred (z) | 2 |
Table 2.
Drivetrain component efficiency.
| Component | Efficiency |
|---|---|
| Inverter | 0.94 |
| Electric motor | 0.93 |
| Gearbox | 0.94 |
Table 3.
Vehicle features.
| Parameter | Value |
|---|---|
| Weight | 35 (t) |
| Length | 30 (m) |
| Maximum passengers | 250 |
| A (Davis equation) | 1050 (N) |
| B (Davis equation) | 25 N (s m−1) |
| C (Davis equation) | 6.5 N (s2 m−2) |
| Auxiliary power | 40 (kW) |
Table 4.
Journey timetable.
| Stop | Departure Time (Min:s) | Arrival Time (Min:s) |
|---|---|---|
| 1 | 0:00 | - |
| 2 | 4:00 | 3:30 |
| 3 | 7:55 | 7:25 |
| 4 | 10:50 | 10:20 |
| 5 | 13:52 | 13:22 |
| 6 | 15:40 | 15:10 |
| 7 | 18:25 | 17:55 |
| 8 | 20:15 | 19:45 |
| 9 | 29:45 | 24:45 |
| 10 | 31:40 | 31:10 |
| 11 | 34:10 | 33:40 |
| 12 | 36:05 | 35:35 |
| 13 | 38:35 | 38:05 |
| 14 | 41.40 | 41:10 |
| 15 | 45:05 | 44:35 |
| 16 | 49:10 | 48:40 |
| 17 | - | 52:35 |
Table 5.
90 kW Hydrogenics HyPM specifications.
| Parameter | Value |
|---|---|
| Max power | 90 (kW) |
| Operating current | 0–500 (A) |
| Operating voltage | 180–360 (V) |
| Peak efficiency | 55% |
| Fuel | Hydrogen > 99.98% |
| Oxidant | Ambient air |
| Mass | 327 (kg) |
Table 6.
Control system characterization.
| Parameter | Value |
|---|---|
| ap | −1.265 × 10⁻⁶ (g s−1 kW−3) |
| bp | −9.229 × 10⁻⁵ (g s−1 kW−2) |
| cp | 0.01768 (g s−1 kW−1) |
| dp | 0.004596 (g s−1) |
| ksc (charge) | 0.08 |
| ksc (discharge) | 0.05 |
Table 7.
Passenger variation at each stop during tramway operations.
| Stop Number | Passenger on Board |
|---|---|
| 1 | 100 |
| 2 | 80 |
| 3 | 150 |
| 4 | 200 |
| 5 | 180 |
| 6 | 220 |
| 7 | 230 |
| 8 | 250 |
| 9 | 250 |
| 10 | 200 |
| 11 | 180 |
| 12 | 170 |
| 13 | 180 |
| 14 | 100 |
| 15 | 95 |
| 16 | 90 |
© 2020 by the authors. Licensee MDPI, Basel, Switzerland. This article is an open access article distributed under the terms and conditions of the Creative Commons Attribution (CC BY) license (http://creativecommons.org/licenses/by/4.0/).
Share and Cite
MDPI and ACS Style
Piraino, F.; Fragiacomo, P. Design of an Equivalent Consumption Minimization Strategy-Based Control in Relation to the Passenger Number for a Fuel Cell Tram Propulsion. Energies 2020, 13, 4010. https://doi.org/10.3390/en13154010
AMA Style
Piraino F, Fragiacomo P. Design of an Equivalent Consumption Minimization Strategy-Based Control in Relation to the Passenger Number for a Fuel Cell Tram Propulsion. Energies. 2020; 13(15):4010. https://doi.org/10.3390/en13154010
Chicago/Turabian StylePiraino, Francesco, and Petronilla Fragiacomo. 2020. "Design of an Equivalent Consumption Minimization Strategy-Based Control in Relation to the Passenger Number for a Fuel Cell Tram Propulsion" Energies 13, no. 15: 4010. https://doi.org/10.3390/en13154010
Note that from the first issue of 2016, this journal uses article numbers instead of page numbers. See further details here.