Fatty Acid Methyl Esters from the Herbal Industry Wastes as a Potential Feedstock for Biodiesel Production


1
Department of Agri-Food Engineering and Environmental Management, Bialystok University of Technology, Wiejska 45E Street, 15-351 Bialystok, Poland
2
Department of Plant Biology and Ecology, University of Bialystok, Ciolkowskiego 1J Street, 15-245 Bialystok, Poland
*
Author to whom correspondence should be addressed.
Energies 2020, 13(14), 3702; https://doi.org/10.3390/en13143702
Submission received: 25 June 2020
/
Revised: 14 July 2020
/
Accepted: 15 July 2020
/
Published: 18 July 2020
(This article belongs to the Special Issue Innovations-Sustainability-Modernity-Openness in Energy Research 2020)
Abstract
:Due to the growing awareness of fossil fuel depletion and environmental issues, biodiesel alternative fuel is currently of substantial interest. This research assessed herbal industry wastes as a potential resource for biodiesel production for the first time. Fatty acid methyl esters (FAMEs), obtained in the transesterification reaction, were extracted from the herbal samples by ultrasound-assisted extraction and identified with gas chromatography-mass spectrometry in the selected ion monitoring mode. The presence of at least 20 (e.g., in chamomile and chicory) FAMEs, up to 31 in nettle and senna, was reported. The unsaturated FAMEs were found in higher amounts than saturated. Linoleic acidwas the major polyunsaturated FAME in herbal wastes, while palmitic acid was the major saturated FAME. The highest content of FAMEs was identified in rye bran, Figure tea, and chicory. According to the cetane number prediction, BS EN 14214:2012+A2:2019, and hierarchical clustering on principal components (HCPC) wastes from, e.g., nettle, sage, and senna, are the most suitable in biodiesel production with fuel properties acceptable by the European Standards. Principal component analysis and HCPC allowed to classify and group similar plants according to their FAMEs content; however, additional studies of herbal biofuel properties are needed.
1. Introduction
Extensive use of fossil fuels causes environmental pollution, global warming, and depletion of non-renewable energy resources [1]. Thus, exploring alternative energy sources can help in the reduction of fossil fuel consumption. Worldwide production of biodiesel increased in the last twenty years; therefore, it is one of the significant bio-based fuels [2,3]. Biodiesel is a mixture of fatty acid methyl esters (FAMEs) obtained by the triglycerides transesterification. Its properties, e.g., cetane number, density, flash point, oxidative stability, and viscosity, depend on the structure of its components, especially FAMEs [4]. On the other hand, the properties of an individual fatty acid depend on the chain length, branched chains, and double bonds [5]. For instance, the low-temperature fluidity decreases with chain length increase, but the calorific value of biodiesel increases. Moreover, the longer the chain length, the higher the fuel viscosity, but cis double bonds lower the viscosity. All biodiesel samples contain saturated (SFAs), monounsaturated (MUFAs), and polyunsaturated (PUFAs) fatty acids. However, an ideal biodiesel composition should contain mainly MUFAs, and should have fewer PUFAs and SFAs [6,7].
The first-generation (conventional) biofuels mainly come from soybean, vegetable oils (e.g., palm [8], oil [9], and rapeseed oils [10]), and algae [11]. It has wildly reported that biodiesel is environmentally friendly and can help in the reduction of greenhouse gases [12]. At low blending ratios, biodiesel can be injected into diesel engines without any modification of the engine itself. Unfortunately, bio-based fuel also has some disadvantages [13]. It can cause corrosion of engine parts, carbon deposition, injector coking, and oxidation, due to the presence of higher unsaturated fatty acids (UNFAs). Research also indicated that some of the biodiesel types showed lower oxidative stability and therefore decreased storage period [14]. One of the ways is a production of liquid fuel from industrial wastes, including leather industry wastes [15], oil from fish canning industry wastes [16], agro-industrial wastes [17], and food processing wastes [18]. In this study, for the first time, the herbal industry wastes as a potential feedstock for bio-based fuel production were proposed.
In Poland, many specialized farms related to the cultivation of specific herb species on the acreage above 20 ha do exist. The total area of herb plantation in the country covers over 30,000 ha [19]. The herbal industries also produce wastes. They are generated in the herbal production process, mainly during packing. The amount of wastes is relatively large, but its utilization is problematic due to the tiny particle sizes of waste fractions [20]. For example, approximately 30 tons of fine wastes biomass are produced in “Herbapol-Lublin” S.A. (Branch in Bialystok, Poland) annually during this process [21]. These wastes are usually sold by the company for small sums or even given away for the price of transport [22]. This is important because the raw materials of biodiesel have a high manufacturing cost due to the complexity of the purification process. Generally, biodiesel production with edible oils is more expensive than using non-edible oils [23].
The postproduction herbal wastes are currently used in the biogas [24], pellets, and briquettes production [25], as well as bioconversion into vermicompost [26] and food wastes composting [27]. However, the most common method of herbal wastes utilization is using them as a fodder additive [28]. Therefore, the research aimed to:
- quantify the content of FAMEs from herbal industry wastes and determine dominative ones;
- compare different herbal waste to determine the most suitable for biofuel production;
- estimate cetane number (CN) for different herbal wastes based on FAMEs content;
- compare fatty acid composition in herbal wastes with previously published data from other plant materials.
2. Materials and Methods
2.1. Chemicals
All chemicals, used for transesterification reaction, were purchased from Avantor Performance Materials (Gliwice, Poland). The solvents used for gas chromatography-mass spectrometry (GC-MS) analyses were of high-performance liquid chromatography (HPLC) grade from Merck (Darmstadt, Germany). The FAME mixture (Supelco 37 Component FAME Mix) was purchased from Merck (Table 1). For the standards, a mixture of 100 mg of thirty-seven FAMEs, individually varied between 2–6 mg, were dissolved in hexane with nonadecanoic acid (C19:0) as an internal standard (IS).
2.2. Plant Materials
Samples of 16 species of herbs: chicory roots (Cichorium intybus L.), chamomile flowers (Matricaria chamomilla L.), nettle leaves (Urtica dioica L.), senna leaves (Senna alexandrina Mill.), buckthorn barks (Frangula alnus Mill.), Figure tea (Sennae folium L., Hibiscus sabdariffa L., Sambucus nigra L.), couch grass roots (Agropyron repens L.), rye brans (Secale cereale L.), peppermint leaves (Mentha piperita L.), lemon balm leaves (Melissa officinalis L.), St. John’s wort (Hypericum perforatum L.), sage leaves (Salvia officinalis L.), green tea leaves (Camellia sinensis (L.) Kuntze), tobacco stalks (Nicotiana tabacum L.), hemp stalks (Cannabis sativa L. var. indica), and black cumin stalks (Nigella sativa L.) were obtained as a powder from a herbal company – “Herbapol-Lublin” S.A. (Branch in Bialystok, Poland).
2.3. Transesterification Procedure
Plant material (0.5 g) was extracted with 0.5 mL of hexane (anhydrous, purity 99%) in the presence of a 1% methanol-potassium hydroxide (KOH) mixture (2 mL) as a catalyst. The extraction was assisted by an ultrasonic cleaning bath (Sonorex Digital 10P, Germany). The optimized extraction conditions were: temperature 80 °C, time 60 min, and power 10 × 10%. The synthesis was conducted by the addition of three portions of 1 mL of hexane (anhydrous, purity 99%), and the solvent was evaporated under a gentle stream of nitrogen. The residue was redissolved in 1 mL of hexane. This solution (1 μL) analyzed on GC-MS. The reaction condition, i.e., the catalytic low-temperature reaction using KOH as the catalyst, was set according to Van Gerpen and Knothe [29] procedure.
2.4. Analytical Methods
The FAMEs were identified and determined by a gas chromatograph (7890B GC System) with a mass selective detector MSD5977A (Agilent Technologies, Santa Clara, CA, USA). The samples (1 μL) were injected via Agilent 7683 Injector and Sample tray Series with a split ratio of 30:1. The injector and transfer line temperatures were set to 260 °C. A Select HP-88 capillary column (100 m × 0.25 mm, 0.20 µm, 5-inch cage) (Agilent Technologies, Santa Clara, CA, USA) designed for the separation of FAME was used. Helium (purity 5.0) was used as carrier gas with a constant pressure of 100 kPa. A constant flow of helium was maintained at a flow rate of 1.0 mL min−1. The GC temperature program started at 140 °C (hold time 5 min) and was increased to 240 °C (hold time 15 min) at a ramp rate of 4 °C min−1. A solvent delay of 8.5 min was applied. The electron energy was equal to 70 eV, and the temperature of the ion source was 250 °C. Retention times of the separated FAMEs, as well as the respective mass spectra, gained from full scan measurement (m/z 60–400), were used for qualitative analysis. Quantification of data obtained from single ion monitoring (SIM) mode measurement was performed using the peak area ratios relative to that of the IS [30,31]. For GC-MS in the SIM mode, fragment ions including m/z 55.1, 67.1, 79.1, 74.1, 81.1, 87.1, and 99.1 for FAMEs were recorded throughout the run. Three replicates were performed for each sample.
2.5. Statistical Analysis
The R programming language/statistical environment was used to perform all statistical computations and analyses, as well as to prepare graphics and transform data for tabular representation [32]. Percentage shares of fatty acids among various herbal wastes were calculated with the help of ‘tidyr’ and ‘dplyr’ packages [33], then visualized using the ‘corrplot’ [34] and ‘ggplot2’ [35] packages. The dataset with one grouping variable, i.e., the herbal waste type was used as an input for:
- the one-way analysis of variance (ANOVA) (‘stats’ package) followed by Tukey’s post-hoc test (‘laercio’ package [36]), which compared the mean values of fatty acids levels for different herbal wastes (n = 3, α = 0.05);
- principal component analysis (PCA) that transformed multivariate data into a reduced form and allowed simplified exploration of underlying relations in the original dataset.
ANOVA assumptions of normally distributed data and equal variances in each of the groups were checked with the Shapiro-Wilk test (‘stats’ package) and Levene’s test (‘car’ package [37]), respectively. Furthermore, to build the PCA model, the ‘FactoMineR’ package was used [38]. All herbal wastes’ values for each fatty acid type, except C8:0-single detection, were taken to the analysis. Two tests that indicate the suitability of the dataset for structure detection and reduction were performed: Barlett’s test of sphericity [39] and Kaiser-Mayer-Olkin test of factorial adequacy (KMO) (‘psych’ package [40]). The p-value from Barlett’s test of sphericity was approximately equal to 0, while the calculated overall measure of sampling adequacy (MSA) from the KMO test was equal to 0.56. Thus, according to Kaiser [41], the MSA value is high enough to perform PCA. Unit variance scaling of the data (scale.unit = TRUE) was applied, and the first ten factors were preserved in a model for further analysis. All biplots were created using the ‘factoextra’ package [42]. Since the first two factors were found to explain about 50.27% of the variance, additional plots presenting the third and fourth dimension were also prepared (Supplementary Materials Figures S1–S5).
The first ten principal components (reduction from 31 variables to 10) were used as an input for hierarchical clustering on principal components (HCPC), which was conducted using ‘FactoMineR’ package with ten dimensions passed to ‘HCPC’ function from the PCA model that together explain about 98.07% of the variance. The parameter ‘consol’ was set to FALSE—no additional k-means clustering was performed, the distance type was set to the Euclidean distance, while the agglomerative criterion was set to Ward’s method [38]. A dendrogram of obtained clusters was created with ‘fviz_dend’ function (‘factoextra’ package) [42].
2.6. Cetane Number Prediction
To calculate approximated CN of biodiesel from herbal wastes using their FAMEs compositions, a multiple linear regression model equation, proposed by Gopinath, et al. [43], was used:
where Pn is a weight percentage of FAME n. It should be noted that equation (1) can be applied to predict the CN of both pure FAMEs and biodiesel. Furthermore, the approximated error of CN was calculated using transformed relative error equation:
where ε is a value of assumed percentage error, e.g., 8%, which is the maximum relative estimation error of a model build by Gopinath, et al. [43].
3. Results and Discussion
Gas chromatography-mass spectrometry in the selected ion monitoring mode (GC-MS/SIM) of herbal industry wastes quantified the level of up to thirty-one FAMEs out of thirty-seven analyzed (Table 2, Table 3 and Table 4). As shown in Figure 1, the qualitative differentiation in fatty acids types in plant materials was found. The total amount of different fatty acids types ranged from 20 to 31 — nettle and senna had 31, while chamomile had 20. The composition of SFAs is varied the most in comparison to MUFAs and PUFAs. Among herbal wastes, tobacco had only four SFAs (C16:0, C17:0, C22:0, and C23:0), while chicory, nettle, and senna were the richest in SFAs, having all twelve (Table 4). Most of the herbal wastes had nine or ten PUFAs, which presence may suggest great oxidative stability of biodiesel like in algal oil biofuel [44]. The susceptibility to oxidation of the double bonds during storage reduces the acceptability of microalgal oil for production of biodiesel [45].
The analysis of the composition of biodiesel produced from these samples revealed that the USFA methyl esters amount (97.06% in rye bran) was higher than that of SFAs (Figure 2). The overall share of SFAs was the lowest among all herbal wastes except for buckthorn (51.36%). MUFAs and PUFAs were the dominant fatty acids types; however, various herbal wastes had different MUFAs to PUFAs ratio. The highest MUFAs share was in hemp (66.77%,) the lowest in chicory (5.14%); the highest PUFAs level was in chicory (90.33), the lowest in buckthorn (19.99%). The dominant FAMEs were C18 fatty acids, i.e., C18:3n6, C18:1n9t/c, and C18:2n6, as well as C16:0 (Figure 3), which are suitable for fuel production. The richest in C18:3n6 (> 50%) herbal wastes were couch grass, Figure tea, chicory, and rye bran. C15:1, C16:0, C20:1, C20:5n3, C22:2n6, C24:0 were also reported to occur in a significant amount, having the percentage share > 5% among many different herbal wastes. The only exception was the presence of C20:3n6, C22:1n9, and C20:4n6 in sage (13.84–35.88%). The other FAMEs, mostly SFA type, had the lowest impact on the composition of FAMEs, indicated by both the low percentage shares (Figure 4) (i.e., approximately less than 5%) and low content (Table 2, Table 3 and Table 4) (i.e., less than about 100 µg g−1dry weight, dw).
According to the literature data, among the vegetable oils and fats, the higher contents of SFAs were found in palm kernel oil (76.0%) and coconut oil (90.5%) with a dominant presence of C12:0 and C14:0 methyl esters, while lower in linseed oil (9.65%), sunflower oil (8.8%), and safflower oil (7.2%) [46]. The total content of C16:0 in analyzed herbal samples is higher than in castor [47], rapeseed, and sunflower oils [48]. Presented findings are coherent with previous research on other plant species, where MUFAs were also at higher levels than SFAs (Figure 2, Figure 3 and Figure 4). Interestingly, MUFA was the main part of FAME compositions in oils, such as sesame (42.0%), rice brain (44.0%), almond (67.9%), olive(68.2%), peanut (71.1%), and rapeseed (72.8%). C18:1 was found as the most abundant MUFA in oil samples, except for hemp oil, where C20:1 was predominant [49]. Among the vegetable oils and fats, the highest percentage of long-chain MUFA and PUFA, such as C18:1, C18:2n6c, and C18:3n6 methyl esters contain the sunflower oil, safflower oil, and linseed oil [46].
Some of the FAMEs, viz one MUFA (C22:1n9), one PUFA (C20:3n6), and five SFAs (C11:0, C12:0, C14:0, C15:0, and C24:0), were only present in about half of herbal wastes, e.g., lemon balm and tobacco. The highest concentration of total FAMEs was determined in rye bran (35.79 mg g−1dw), Figure tea (11.69 mg g−1dw), and chicory (8.78 mg g−1dw) (Table 2, Table 3 and Table 4). C18:3n3, C18:1n9t, and C22:1n9 were found in large amounts (> 1 mg g−1dw) in rye bran, St. John’s wort, and sage (Table 5). It is essential because, among all FAMEs, C16:0, and C18:1 are the ideal components of biodiesel [50,51]. Moreover, the highest content of C16:0 was found in senna (0.92 mg g−1dw), and also in rye bran and nettle the C16:0 content was high (0.79 and 0.57 mg g−1dw, respectively). The lowest content of total FAMEs was reported in tobacco (0.26 mg g−1dw), chamomile (0.27 mg g−1dw), and hemp (0.36 mg g−1dw). However, most herbal wastes (ten out of sixteen – 62.5%) had the total FAMEs content between 1.42 and 5.02 mg g−1dw (Table 5). In comparison, the total FAMEs amounts in some halophytic plants ranged from 1.00 to 7.27 mg g−1dw [52]. Also, the SFA and USFA methyl esters’ contents among Paeonia species varied from 10.8 to 29.8 mg g−1dw and from 98.6 to 210.8 mg g−1dw, respectively. Thus, the total content of FAMEs among Paeonia species varied from 109.4 to 240.6 mg g−1dw [50].
Comparison of the FAMEs percentage composition in studied herbal wastes to other plants, e.g., sunflower and rapeseed [49], revealed that some similarities in the distribution of FAMEs do exist; however, the overall profile is different (Figure 5), e.g., a similar share of C12:0, C14:0, C15:0, C16:0, C17:0, C18:0, C20:0, and C18:3n3, but different share of C16:1, C18:1n9c, and C18:2n6c. Interestingly, in herbal wastes, C18:3n6 is present having its share at the level of even 81.12%, while in other plants, like safflower or rapeseed, it is not present at all.
The United States Standard ASTM D975-20a [53] for conventional petro-diesel fuel requires a minimum CN of 40, while the standard for biodiesel ASTM D6751-20 [54] that relates to biodiesel specifies a minimum of 47. British and European Standard BS EN 590:2013+A1:2017 [55] and BS EN 14214:2012+A2:2019 [56] specifies a minimum CN to be greater than 51 for diesel and biodiesel fuels, which is necessary for optimum operation of engines (reduce emissions, smooth running, and better cold flow) [57]. The CN depends on the feedstock source. Biodiesel consists of FAMEs with each ester component contributing to fuel properties. Hence, those properties depend not only on the structure of the fatty acidsbut also on that of the ester moiety derived from the alcohol, e.g., methanol, propanol, and ethanol [4].
A high value of the CN can be observed in SFAs (e.g., C16:0 and C18:0), while in the medium range in MUFAs. The longer the chain of an individual FAME and the more saturated the molecules, the higher the CN. High CN shortens the ignition delay, while lower CN (consequently longer ignition delay) results in increased nitric oxide emission [5,58]. Biodiesel with high level of SFAs and a low level of PUFAs has a good oxidative stability. Large amounts of SFAs have a great influence on cetane number and oxidative stability but cause poor low-temperature properties. To achieve better low-temperature performance, biodiesel should have low amounts of long-chain SFAs. On the other hand, the biodiesel with a higher amount of UNFAs exhibits better cold-flow and viscosity with a penalty in both the ignition quality and oxidative stability. Summarizing, the highest possible percentage of MUFAs is desirable for biodiesel in combination with a low percentage of SFAs, PUFAs (especially with three C=C bonds), and very-long-chain FA (more then 20 carbon atoms) [4,57,59].
Prediction of CN allowed to classify potential herbal industry wastes for their future usage in the fuel industry. According to BS EN 14214:2012+A2:2019 [56] values presented in Figure 6 and Table S1 show that buckhorn, green tea, hemp, lemon balm, peppermint, sage, and senna are the most likely to be used in biofuel. However, further assessment of other properties of the fuel, e.g., viscosity, the heat of combustion, density, oxidative stability, low-temperature properties, and lubricity, either by estimations or measurement of the actual biofuel from herbal wastes is needed [58].
The first and second PCA components (Dim1 and Dim2, respectively) separated buckthorn, chicory, Figure tea, nettle, and St. John’s wort from other herbal wastes. Those five herbal wastes, depending on the position on the factor map, had significantly higher contents of FAMEs, e.g., C15:1, C14:1, C18:1n9t, C18:1n9c, C24:1n9, C18.2n6c, C18:216c, C18:3n6, C18:0, C20:0, and C23:0. Positive values of Dim2 are related mostly to MUFAs (e.g., C15:1) and SFAs, while negative to MUFAs (e.g., C18:1n9t) and PUFAs (Figure 7a).
In all possible combinations of the first four dimensions, the following herbal wastes: black cumin, chamomile, couch grass, green tea, hemp, peppermint, lemon balm, and tobacco were close together (Figure 7a, Figures S1–S5), suggesting similarities in their fatty acid profiles. It is also worth reporting that higher PCA dimensions separated the dataset based on other FAMEs levels. The model could have been further reduced to 7 or 8 dimensions that still explain about 90% of the variance, which further suggests that the raw dataset of 31 FAMEs [C8:0 was detected only in chicory, and thus it could disturb the model and was not taken to the analysis (Figure 4)] is highly correlated and reducible. This property might be useful for future studies involving other machine learning techniques build-up on top of PCA to classify biodiesel produced from specific plants (Figure 7b,c). Similar conclusions were also stated by Škrbić, et al. [51].
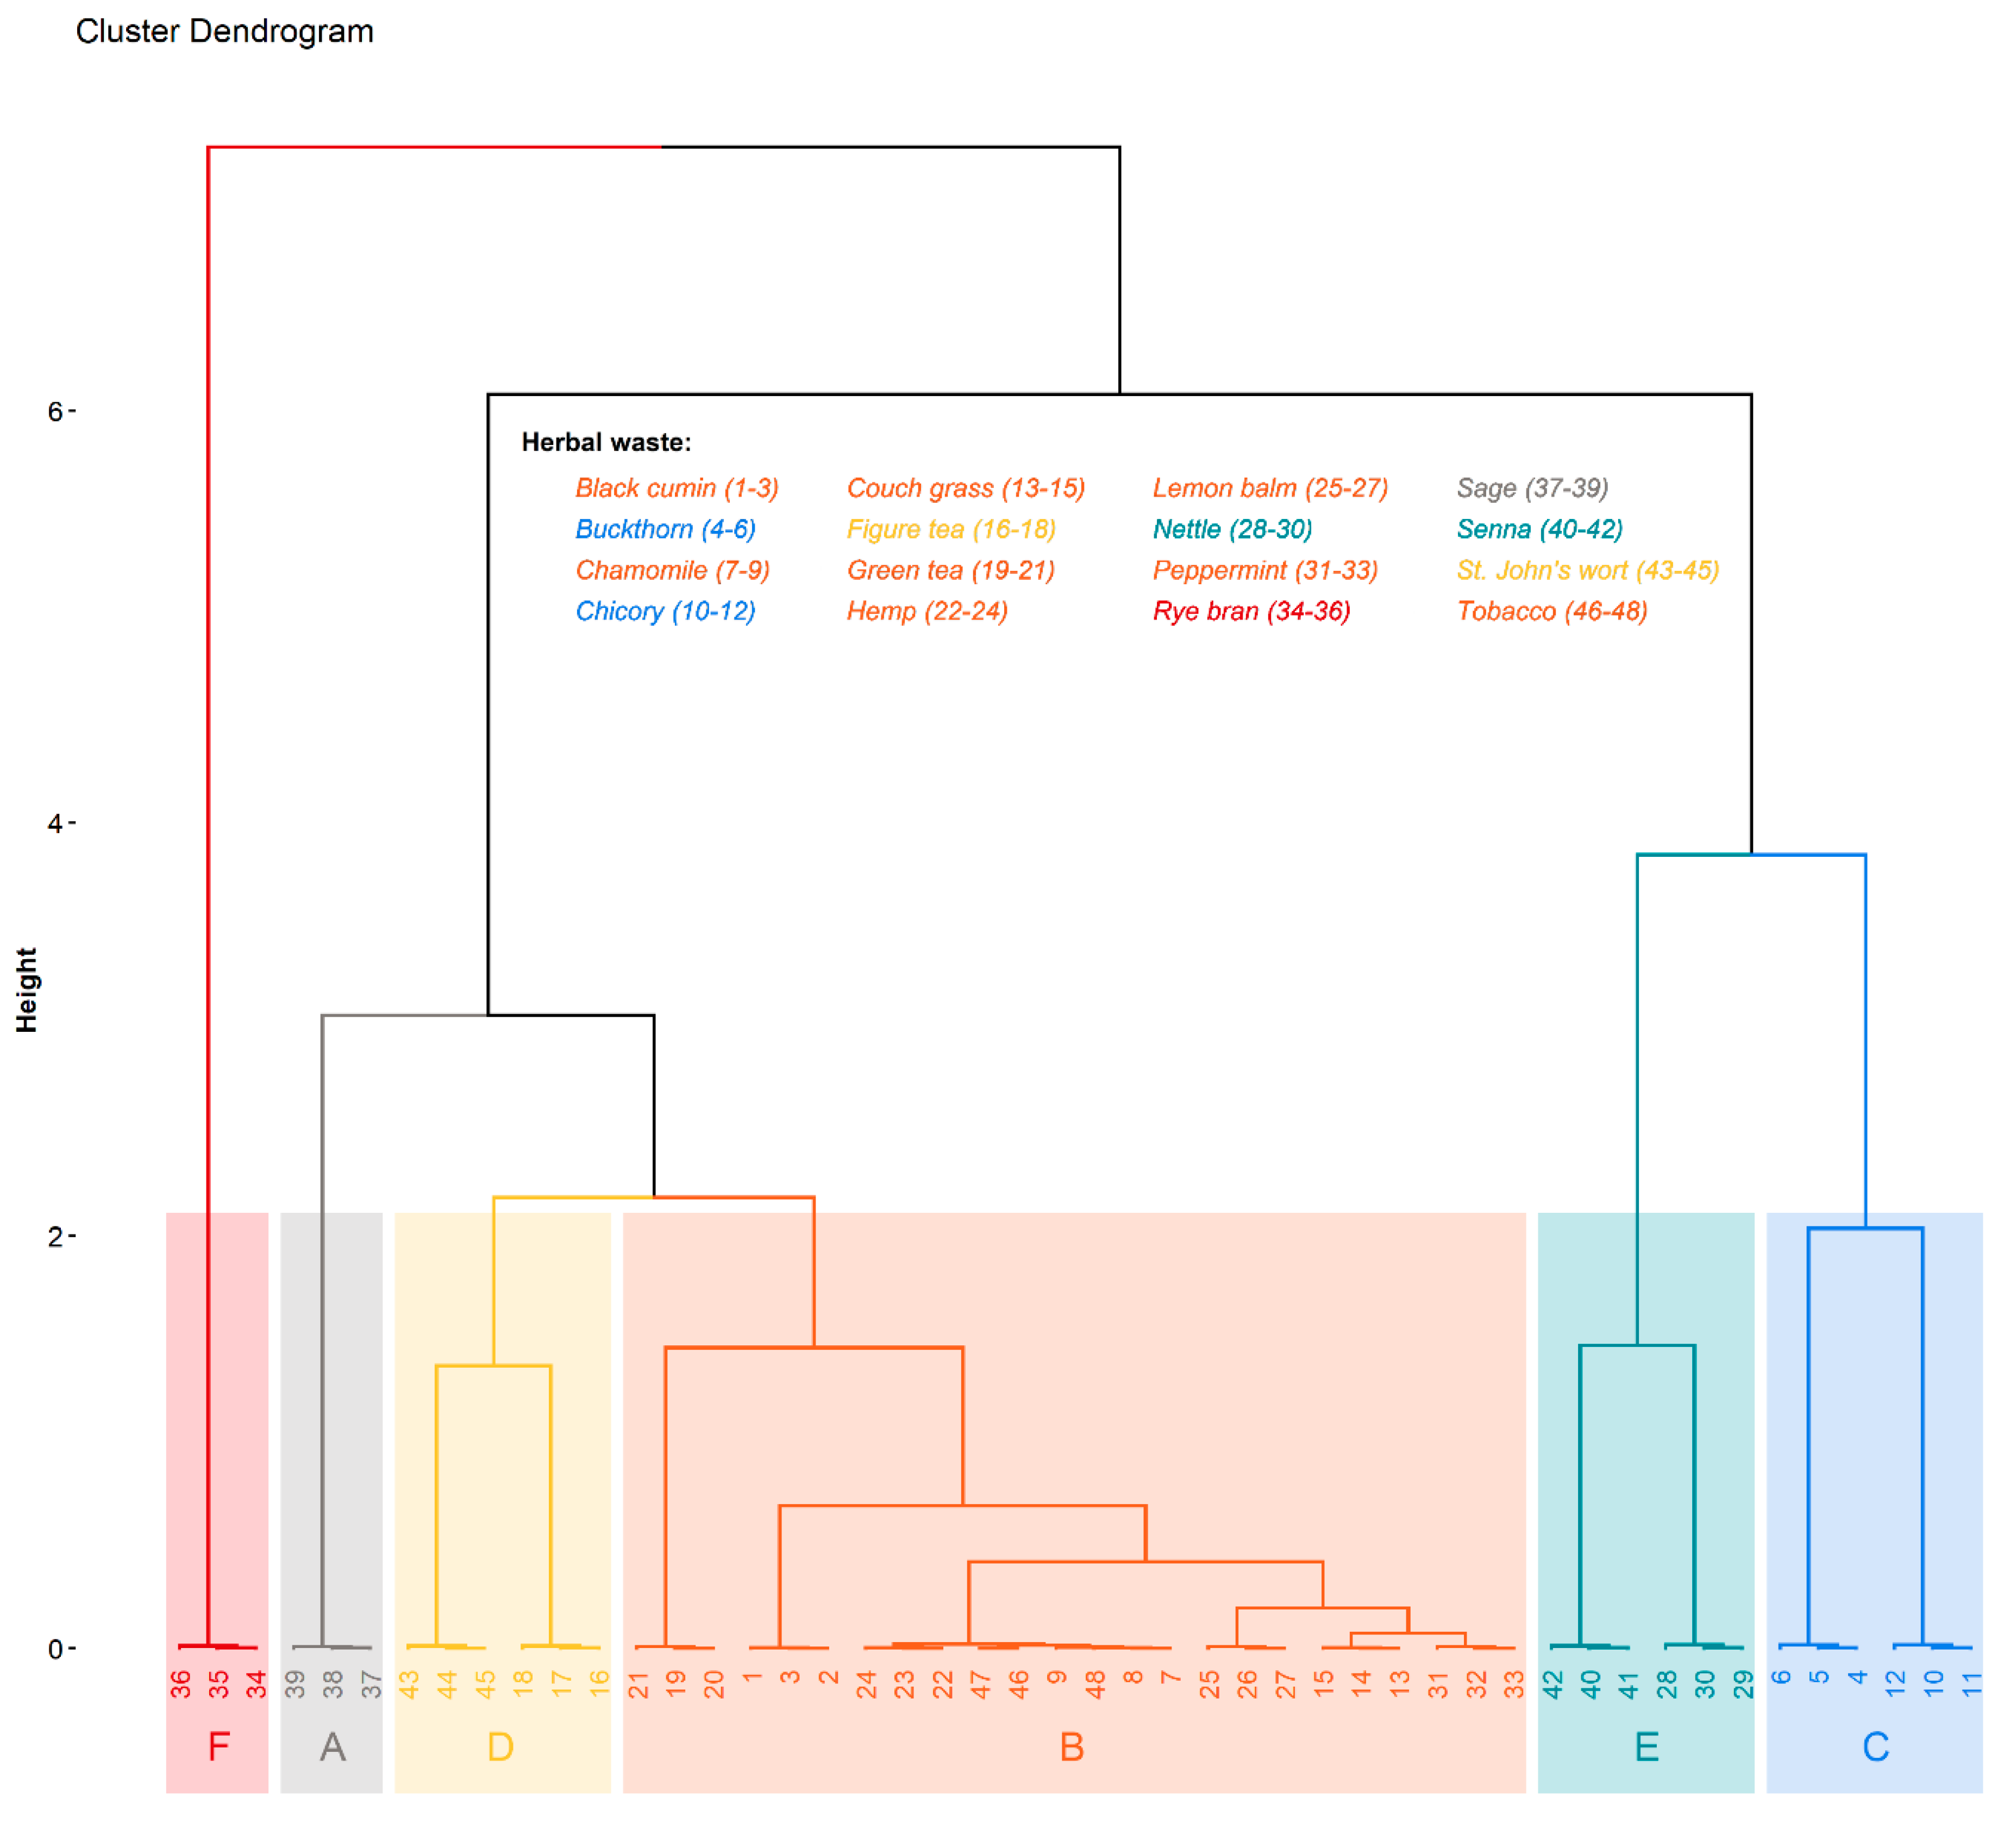
Nonetheless, HCPC analysis on the multidimensional PCA model allowed to cluster herbal wastes, preserving a high level of explained variance equal to approximately 98.07%. HCPC clustered herbal wastes based on FAMEs content into six clusters (A-F) (Table 6, Figure 8). The A-cluster is represented only by sage, which has the highest content of C20:3n6, C20:4n6, C22:1n9, and C21:0, making them a good biofuel candidate according to the EN standard [55]. The next and largest cluster contains herbal wastes with a lot of different FAMEs, which content is lower than average, suggesting that plants in this cluster (e.g., black cumin, chamomile, and peppermint) are not suitable for biofuel. Herbal wastes assigned to cluster C, i.e., buckthorn and chicory, show higher than average contents of MUFAs and SFAs; however, C18:2n6t (PUFA) is also very high in this cluster. Thus, these herbal wastes are also not good for biofuel. The D-cluster, where Figure tea and St. John’s wort were taken together, shows higher average content of C18:1n9c and C18:1n9t compared to other clusters; however, other FAMEs are not present in high amounts. The E-cluster, in which nettle and senna were grouped, has 13 FAMEs (three MUFAs, a PUFA, and nine SFAs). In this cluster, MUFAs and SFAs dominate, e.g., C15:1, C16:0, C18:0, C20:1, and C24:0 are higher than average. Taking together, the high CN that could reach its value above 51 (Table 6), these herbal wastes are promising for their usage in biodiesel. The last cluster contains rye bran, which has a lot of PUFAs, which explain the low estimated CN.
Literature data indicate that cluster and PCA applied to FAME profiles distinguished microalgae groups according to their potential for fuel production [60]. A similar approach to that used in this research was applied by Škrbić, et al. [51], where fatty acids profiles of 119 vegetable oils were analyzed and clustered using PCA and hierarchical clustering. They reported differences between clusters explained by the level of C16:0, C18:0, C18:2, and C18:3. According to Katre, et al. [61], the feedstock used for biodiesel fuel production should have a high MUFA to PUFA ratio. Biodiesel produced through the transesterification reaction of these types of fatty acids shows numerous advantages over petro-diesel, such as low emissions of CO, CO2, and hydrocarbons. However, such fuel also had several disadvantages, e.g., low CN, poor cold-flow, high viscosity, and low oxidative stability [5]. In contrast, biodiesel derived from material with a high amount of SFA demonstrates better cold-flow properties and reduced NOx emissions [62,63].
Fuel produced from fats has disadvantages, such as the higher cold filter plugging point. Biofuel from lard and tallow fat is less stable for oxidation than rapeseed and linseed oil [64,65,66,67]. On the other hand, blends of soybean and animal (e.g., beef and chicken) fat-based biodiesel presented higher oxidative stability than soybean-based fuel [68,69]. In the process of transesterification, glycerol (propane-1,2,3-triol) is generated as a by-product. Typically, the production of 100 kg of biodiesel yields approximately 10 kg of glycerol with low purity (50–55%). The amount of glycerol depends on methods of conversion, as well as used alcohol and catalyst [70,71]. In the biodiesel production process, nearly 70–95% of the total cost is caused by raw material [72]. This issue can be overcome by the use of wastes, which can effectively reduce the feedstock cost even to 60–70%. For that reason, the herbal industry wastes are useful materials for biofuel production.
4. Conclusions
The identification of the FAMEs was performed to characterize the herbal industry wastes as a potential feedstock for biodiesel production using a transesterification reaction. Depending on herbal waste type, the presence of 20-31 FAMEs (out of 37 quantified FAMEs) was reported. USFAs, e.g., C18:1n9t/c, C18:2n6c, and C18:3n6, were found to be dominative methyl esters. Higher concentrations of FAMEs were determined in rye bran, Figure tea, and chicory; however, these samples are not a promising feedstock for biodiesel production, as they contain mostly PUFAs. PCA and HCPC were performed to classify sixteen herbal wastes based on the content of FAMEs in each sample (n = 3), hence simplify data analyzed and determine their potential application as a source for biodiesel production. Therefore, HCPC and CN indicated herbal wastes, whose transesterification would not lead to the production of biodiesel according to standard limits of the fuel properties. Nettle, sage, and senna were found the most suitable for biofuel due to high levels of C16:0, C18:3n3, C18:1n9t, and C22:1n9. The future continuation of those studies should focus on the characterization of the physical and chemical properties, such as acid value, carbon residue, cloud point, density, flash point, viscosity, and methanol content of FAME mixtures obtained from these samples compared to the conventional petro-diesel fuel. Furthermore, the characterization of some properties of crude glycerol derived from biodiesel from herbal industry wastes should also be explored, since biodiesel production from herbal wastes has been proven to be an excellent replacement to petroleum-based fuel on an industrial scale.
Supplementary Materials
The following are available online at https://www.mdpi.com/1996-1073/13/14/3702/s1, Table S1: Predicted CN using Equation (1) with minimum and maximum error range, calculated using Equation (2), for assumed estimation error equal to 8%, Figure S1: Biplot of fatty acids profile for each repetition of herbal wastes (n = 3), showing the first two dimensions (Dim1 and Dim3) of the principal component analysis (PCA) model that together explain about 42.59% of the variance. Biplot vectors indicate the strength and direction of factor loading for the first two factors. Vectors are colored according to the type of fatty acid. Individuals are colored by the herbal wastes (n = 16), Figure S2: Biplot of fatty acids profile for each repetition of herbal wastes (n = 3), showing the first two dimensions (Dim1 and Dim4) of the principal component analysis (PCA) model that together explain about 38.97% of the variance. Biplot vectors indicate the strength and direction of factor loading for the first two factors. Vectors are colored according to the type of fatty acid. Individuals are colored by the herbal wastes (n = 16), Figure S3: Biplot of fatty acids profile for each repetition of herbal wastes (n = 3), showing the first two dimensions (Dim2 and Dim3) of the principal component analysis (PCA) model that together explain about 33.77% of the variance. Biplot vectors indicate the strength and direction of factor loading for the first two factors. Vectors are colored according to the type of fatty acid. Individuals are colored by the herbal wastes (n = 16), Figure S4: Biplot of fatty acids profile for each repetition of herbal wastes (n = 3), showing the first two dimensions (Dim2 and Dim4) of the principal component analysis (PCA) model that together explain about 30.16% of the variance. Biplot vectors indicate the strength and direction of factor loading for the first two factors. Vectors are colored according to the type of fatty acid. Individuals are colored by the herbal wastes (n = 16), Figure S5: Biplot of fatty acids profile for each repetition of herbal wastes (n = 3), showing the first two dimensions (Dim3 and Dim4) of the principal component analysis (PCA) model that together explain about 22.47% of the variance. Biplot vectors indicate the strength and direction of factor loading for the first two factors. Vectors are colored according to the type of fatty acid. Individuals are colored by the herbal wastes (n = 16).
Author Contributions
Conceptualization, A.S.; Methodology, A.S. and A.P.-N.; Software, A.B.; Validation, A.P.-N.; Formal Analysis, A.B.; Investigation, A.S. and A.P.-N.; Resources, A.S. and A.P.-N.; Data Curation, A.P.-N.; Writing—Original Draft Preparation, A.S. and A.P.-N.; Writing—Review & Editing, A.B.; Visualization, A.B.; Funding Acquisition, A.S. All authors have read and agreed to the published version of the manuscript.
Funding
A.S. is grateful for financial support from the National Science Centre of Poland (2019/03/X/ST8/00794). The project no. WZ/WB-IIS/2/2020 (A.S.) was also financed by the Ministry of Science and Higher Education of Poland.
Acknowledgments
The authors thank “Herbapol-Lublin” S.A. Branch in Bialystok, Poland for herbal samples.
Conflicts of Interest
The authors declare no conflicts of interest.
References
- Atadashi, I.M.; Aroua, M.K.; Aziz, A.R.A.; Sulaiman, N.M.N. Refining technologies for the purification of crude biodiesel. Appl. Energy 2011, 88, 4239–4251. [Google Scholar] [CrossRef]
- Abbaszaadeh, A.; Ghobadian, B.; Omidkhah, M.R.; Najafi, G. Current biodiesel production technologies: A comparative review. Energy Convers. Manag. 2012, 63, 138–148. [Google Scholar] [CrossRef]
- Atadashi, I.M.; Aroua, M.K.; Abdul Aziz, A.R.; Sulaiman, N.M.N. Production of biodiesel using high free fatty acid feedstocks. Renew. Sustain. Energy Rev. 2012, 16, 3275–3285. [Google Scholar] [CrossRef]
- Knothe, G. Dependence of biodiesel fuel properties on the structure of fatty acid alkyl esters. Fuel Process. Technol. 2005, 86, 1059–1070. [Google Scholar] [CrossRef]
- Knothe, G. “Designer” biodiesel: Optimizing fatty ester composition to improve fuel properties. Energy Fuels 2008, 22, 1358–1364. [Google Scholar] [CrossRef]
- Qu, J.; Mao, H.-Z.; Chen, W.; Gao, S.-Q.; Bai, Y.-N.; Sun, Y.-W.; Geng, Y.-F.; Ye, J. Development of marker-free transgenic Jatropha plants with increased levels of seed oleic acid. Biotechnol. Biofuels 2012, 5, 10. [Google Scholar] [CrossRef]
- Bunyakiat, K.; Makmee, S.; Sawangkeaw, R.; Ngamprasertsith, S. Continuous production of biodiesel via transesterification from vegetable oils in supercritical methanol. Energy Fuels 2006, 20, 812–817. [Google Scholar] [CrossRef]
- Nahian, M.R.; Islam, M.N.; Khan, S. Production of Biodiesel from Palm Oil and Performance Test with Diesel in CI Engine. In Proceedings of the International Conference on Mechanical, Industrial and Energy Engineering, Khulna, Bangladesh, 26–27 December 2016. [Google Scholar]
- Antolín, G.; Tinaut, F.V.; Briceño, Y.; Castaño, V.; Pérez, C.; Ramírez, A.I. Optimisation of biodiesel production by sunflower oil transesterification. Bioresour. Technol. 2002, 83, 111–114. [Google Scholar] [CrossRef]
- Dworakowska, S.; Bogdał, D.; Bednarz, S. Production of Biodiesel From Rapeseed Oil, Proceedings of the 1st World Sustainability Forum, Basel, Switzerland, 1–30 November 2011; Seijas, J.A., der Pilar, V., Tato, M., Eds.; MDPI: Basel, Switzerland, 2012. [Google Scholar] [CrossRef]
- Mallick, N.; Bagchi, S.K.; Koley, S.; Singh, A.K. Progress and challenges in microalgal biodiesel production. Front. Microbiol. 2016, 7. [Google Scholar] [CrossRef] [Green Version]
- Noor, M.M.; Wandel, A.P.; Yusaf, T. The simulation of biogas combustion in a mild burner. J. Mech. Eng. Sci. 2014, 6, 995–1013. [Google Scholar] [CrossRef]
- Bhuiya, M.M.K.; Rasul, M.G.; Khan, M.M.K.; Ashwath, N.; Azad, A.K.; Hazrat, M.A. Prospects of 2nd generation biodiesel as a sustainable fuel—Part 2: Properties, performance and emission characteristics. Renew. Sustain. Energy Rev. 2016, 55, 1129–1146. [Google Scholar] [CrossRef]
- Moon, G.; Lee, Y.; Choi, K.; Jeong, D. Emission characteristics of diesel, gas to liquid, and biodiesel-blended fuels in a diesel engine for passenger cars. Fuel 2010, 89, 3840–3846. [Google Scholar] [CrossRef]
- Ramos, L.; Fernandes, R.; Crispim, A.; Ramalho, E.; Caetano, N.; Silva, P. Biodiesel Production From Leather Industry Wastes. In Proceedings of the 10th International Chemical and Biological Engineering Conference, Braga, Portugal, 4–6 September 2008. [Google Scholar]
- Costa, J.F.; Almeida, M.F.; Alvim-Ferraz, M.C.M.; Dias, J.M. Biodiesel production using oil from fish canning industry wastes. Energy Convers. Manag. 2013, 74, 17–23. [Google Scholar] [CrossRef]
- Basso, D.; Patuzzi, F.; Castello, D.; Baratieri, M.; Rada, E.C.; Weiss-Hortala, E.; Fiori, L. Agro-industrial waste to solid biofuel through hydrothermal carbonization. Waste Manag. 2016, 47, 114–121. [Google Scholar] [CrossRef] [PubMed] [Green Version]
- Zhang, Z.; O’Hara, I.M.; Mundree, S.; Gao, B.; Ball, A.S.; Zhu, N.; Bai, Z.; Jin, B. Biofuels from food processing wastes. Curr. Opin. Biotech. 2016, 38, 97–105. [Google Scholar] [CrossRef] [PubMed]
- Żabiński, A.; Sadowska, U.; Wcisło, G. Options of use of waste biomass from herbal production for energy purposes. Agric. Eng. 2015, 4, 139–145. [Google Scholar] [CrossRef]
- Obidziński, S.; Joka, M.; Fijoł, O. Two-stage agglomeration of fine-grained herbal nettle waste. Int. Agrophys. 2017, 31, 515–523. [Google Scholar] [CrossRef]
- Obidziński, S. Charakterystyka aktywności wody i parametrów geometrycznych odpadów melisy w aspekcie ich wykorzystania jako dodatku do pasz. Acta Agrophys. 2013, 20, 113–124. [Google Scholar]
- Obidziński, S. Ocena właściwości energetycznych odpadów melisy. Zesz. Probl. Post. Nauk Roln. 2010, 546, 253–262. [Google Scholar]
- Kusmiyati, T.R.P.; Tri, W. Waste fish oil biodiesel production and its performace in diesel engine. ARPN J. Eng. Appl. Sci. 2016, 11, 1040–1044. [Google Scholar]
- Lewicki, A.; Pilarski, K.; Janczak, D.; Czekała, W.; Rodríguez Carmona, P.C.; Cieślik, M.; Witaszek, K.; Zbytek, Z. The biogas production from herbs and waste from herbal industry. J. Res. Appl. Agric. Eng. 2013, 58, 114–117. [Google Scholar]
- Obidziński, S. Pelletization process of postproduction plant waste. Int. Agrophys. 2012, 26, 279–284. [Google Scholar] [CrossRef]
- Kumari, M.; Kumar, S.; Chauhan, R.S.; Ravikanth, K. Bioconversion of herbal industry waste into vermicompost using an epigeic earthworm Eudrilus eugeniae. Waste Manag. Res. 2010, 29, 1205–1212. [Google Scholar] [CrossRef]
- Zhou, Y.; Selvam, A.; Wong, J.W.C. Chinese medicinal herbal residues as a bulking agent for food waste composting. Bioresour. Technol. 2018, 249, 182–188. [Google Scholar] [CrossRef] [PubMed]
- Hanczakowska, E. Wpływ naturalnych przeciwutleniaczy w dawkach pokarmowych na wyniki tuczu i jakość mięsa tuczników. Rocz. Nauk. Zoot., Rozpr. Hab. 2004, 17, 1–73. [Google Scholar]
- Van Gerpen, J.; Knothe, G. Basics of the transesterification reaction. In The Biodiesel Handbook, 2nd ed.; Knothe, G., Krahl, J., Van Gerpen, J., Eds.; AOCS Press: Urbana, IL, USA, 2010; pp. 31–46. [Google Scholar]
- Sun, H.; Zhao, S. Determination of Fatty Acid Methyl Esters (FAMEs) in Milk Matrix Using an Agilent 5977E GC/MS. Agilent Technologies Application Note, Publication Number 5991–4867EN. Available online: https://www.agilent.com/cs/library/applications/5991-4867EN-D2.pdf (accessed on 13 April 2019).
- Wase, N.; Tu, B.; Allen, J.W.; Black, P.N.; DiRusso, C.C. Identification and metabolite profiling of chemical activators of lipid accumulation in green algae. Plant Physiol. 2017, 174, 2146–2165. [Google Scholar] [CrossRef] [PubMed] [Green Version]
- R Core Team R: A Language and Environment for Statistical Computing (R version 4.0.0, Arbor Day). R Foundation for Statistical Computing. Available online: https://www.R-project.org/ (accessed on 24 April 2020).
- Wickham, H.; Averick, M.; Bryan, J.; Chang, W.; McGowan, L.; François, R.; Grolemund, G.; Hayes, A.; Henry, L.; Hester, J.; et al. Welcome to the Tidyverse. JOSS 2019, 4, 1686. [Google Scholar] [CrossRef]
- Wei, T.; Simko, V. R package “corrplot”: Visualization of a Correlation Matrix (version 0.84). Available online: https://cran.r-project.org/web/packages/corrplot/ (accessed on 15 March 2020).
- Wickham, H. ggplot2: Elegant Graphics for Data Analysis; Springer: New York, NY, USA, 2016. [Google Scholar]
- Da Silva, L.J. Laercio-Package: Duncan Test, Tukey Test and Scott-Knott Test. Available online: https://CRAN.R-project.org/package=laercio (accessed on 20 February 2015).
- Fox, J.; Weisberg, S. An R Companion to Applied Regression, 3rd ed.; SAGE Publications, Inc.: Thousand Oaks, CA, USA, 2019. [Google Scholar]
- Lê, S.; Josse, J.; Husson, F. FactoMineR: An R package for multivariate analysis. J. Stat. Softw. 2008, 25, 1–18. [Google Scholar] [CrossRef] [Green Version]
- Bartlett, M.S. Tests of significance in factor analysis. Br. J. Stat. Psychol. 1950, 3, 77–85. [Google Scholar] [CrossRef]
- Revelle, W. psych: Procedures for Personality and Psychological Research, Northwestern University, Evanston, Illinois, USA (R Package Version 1.8.10). Available online: https://CRAN.R-project.org/package=psych (accessed on 31 October 2018).
- Kaiser, H.F. An index of factorial simplicity. Psychometrika 1974, 39, 31–36. [Google Scholar] [CrossRef]
- Kassambara, A.; Mundt, F. Factoextra: Extract and Visualize the Results of Multivariate Data Analyses (R Package Version 1.0.6). Available online: https://CRAN.R-project.org/package=factoextra (accessed on 16 January 2020).
- Gopinath, A.; Puhan, S.; Nagarajan, G. Relating the cetane number of biodiesel fuels to their fatty acid composition: A critical study. Proc. Inst. Mech. Eng. D 2009, 223, 565–583. [Google Scholar] [CrossRef]
- Knothe, G. Analyzing biodiesel: Standards and other methods. J. Am. Oil Chem. Soc. 2006, 83, 823–833. [Google Scholar] [CrossRef]
- Chisti, Y. Biodiesel from Microalgae. Biotechnol. Adv. 2007, 25, 294–306. [Google Scholar] [CrossRef] [PubMed]
- Kostik, V.; Memeti, S.; Bauer, B. Fatty acid composition of edible oils and fats. J. Hyg. Eng. Des. 2013, 4, 112–116. [Google Scholar]
- Sánchez, N.; Encinar, J.M.; Nogales, S.; González, J.F. Biodiesel production from castor oil by two-step catalytic transesterification: Optimization of the process and economic assessment. Catalysts 2019, 9, 864. [Google Scholar] [CrossRef] [Green Version]
- Martínez, G.; Sánchez, N.; Encinar, J.M.; González, J.F. Fuel properties of biodiesel from vegetable oils and oil mixtures. Influence of methyl esters distribution. Biomass Bioenergy 2014, 63, 22–32. [Google Scholar] [CrossRef]
- Orsavova, J.; Misurcova, L.; Ambrozova, J.V.; Vicha, R.; Mlcek, J. Fatty acids composition of vegetable oils and its contribution to dietary energy intake and dependence of cardiovascular mortality on dietary intake of fatty acids. Int. J. Mol. Sci. 2015, 16, 12871–12890. [Google Scholar] [CrossRef]
- Yu, S.; Du, S.; Yuan, J.; Hu, Y. Fatty acid profile in the seeds and seed tissues of Paeonia L. species as new oil plant resources. Sci. Rep. 2016, 6, 26944. [Google Scholar] [CrossRef] [Green Version]
- Škrbić, B.; Cvejanov, J.; Ðurišić-Mladenović, N. Chemometric characterization of vegetable oils based on the fatty acid profiles for selection of potential feedstocks for biodiesel production. J. Biobased Mater. Bioenergy 2015, 9, 358–371. [Google Scholar] [CrossRef]
- Vizetto-Duarte, C.; Figueiredo, F.; Rodrigues, M.J.; Polo, C.; Rešek, E.; Custódio, L. Sustainable valorization of halophytes from the mediterranean area: A comprehensive evaluation of their fatty acid profile and implications for human and animal nutrition. Sustainability 2019, 11, 2197. [Google Scholar] [CrossRef] [Green Version]
- ASTM D975–20a. Standard Specification for Diesel Fuel; ASTM International: West Conshohocken, PA, USA, 2020. [Google Scholar] [CrossRef]
- ASTM D6751–20. Standard Specification for Biodiesel Fuel Blend Stock (B100) for Middle Distillate Fuels; ASTM International: West Conshohocken, PA, USA, 2020. [Google Scholar] [CrossRef]
- BS EN 590:2013+A1:2017. Automotive Fuels. Diesel. Requirements and Test Methods; BSI Group: London, UK, 2013. [Google Scholar]
- BS EN 14214:2012+A2:2019. Liquid Petroleum Products—Fatty Acid Methyl Esters (FAME) for Use in Diesel Engines and Heating Applications—Requirements and Test Methods; BSI Group: London, UK, 2019. [Google Scholar]
- Moser, B.R. Impact of fatty ester composition on low temperature properties of biodiesel-petroleum diesel blends. Fuel 2014, 115, 500–506. [Google Scholar] [CrossRef]
- Gopinath, A.; Sairam, K.; Velraj, R.; Kumaresan, G. Effects of the properties and the structural configurations of fatty acid methyl esters on the properties of biodiesel fuel: A review. Proc. Inst. Mech. Eng. D 2014, 229, 357–390. [Google Scholar] [CrossRef]
- Moser, B.R. Influence of blending canola, palm, soybean, and sunflower oil methyl esters on fuel properties of biodiesel. Energy Fuels 2008, 22, 4301–4306. [Google Scholar] [CrossRef]
- Nascimento, I.A.; Marques, S.S.I.; Cabanelas, I.T.D.; Pereira, S.A.; Druzian, J.I.; de Souza, C.O.; Vich, D.V.; de Carvalho, G.C.; Nascimento, M.A. Screening microalgae strains for biodiesel production: Lipid productivity and estimation of fuel quality based on fatty acids profiles as selective criteria. Bioenergy Res. 2012, 6, 1–13. [Google Scholar] [CrossRef]
- Katre, G.; Joshi, C.; Khot, M.; Zinjarde, S.; Ravikumar, A. Evaluation of single cell oil (SCO) from a tropical marine yeast Yarrowia lipolytica NCIM 3589 as a potential feedstock for biodiesel. AMB Express 2012, 2, 36. [Google Scholar] [CrossRef] [Green Version]
- Ashraful, A.M.; Masjuki, H.H.; Kalam, M.A.; Rizwanul Fattah, I.M.; Imtenan, S.; Shahir, S.A.; Mobarak, H.M. Production and comparison of fuel properties, engine performance, and emission characteristics of biodiesel from various non-edible vegetable oils: A review. Energy Convers. Manag. 2014, 80, 202–228. [Google Scholar] [CrossRef]
- Kaur, S.; Sarkar, M.; Srivastava, R.B.; Gogoi, H.K.; Kalita, M.C. Fatty acid profiling and molecular characterization of some freshwater microalgae from India with potential for biodiesel production. New Biotechnol. 2012, 29, 332–344. [Google Scholar] [CrossRef]
- Pereira, G.G.; Garcia, R.K.A.; Ferreira, L.L.; Barrera-Arellano, D. Soybean and soybean/beef-tallow biodiesel: A comparative study on oxidative degradation during long-term storage. J. Am. Oil Chem. Soc. 2017, 94, 587–593. [Google Scholar] [CrossRef]
- Wyatt, V.T.; Hess, M.A.; Dunn, R.O.; Foglia, T.A.; Haas, M.J.; Marmer, W.N. Fuel properties and nitrogen oxide emission levels of biodiesel produced from animal fats. J. Am. Oil Chem. Soc. 2005, 82, 585–591. [Google Scholar] [CrossRef]
- Sendzikiene, E.; Makareviciene, V.; Janulis, P. Oxidation stability of biodiesel fuel produced from fatty wastes. Pol. J. Environ. Stud. 2005, 14, 335–339. [Google Scholar]
- Avhad, M.R.; Marchetti, J.M. A review on recent advancement in catalytic materials for biodiesel production. Renew. Sustain. Energy Rev. 2015, 50, 696–718. [Google Scholar] [CrossRef]
- Dias, J.M.; Alvim-Ferraz, M.C.M.; Almeida, M.F.; Méndez Díaz, J.D.; Polo, M.S.; Utrilla, J.R. Selection of heterogeneous catalysts for biodiesel production from animal fat. Fuel 2012, 94, 418–425. [Google Scholar] [CrossRef]
- Encinar, J.M.; Sánchez, N.; Martínez, G.; García, L. Study of biodiesel production from animal fats with high free fatty acid content. Bioresour. Technol. 2011, 102, 10907–10914. [Google Scholar] [CrossRef] [PubMed]
- Bagnato, G.; Iulianelli, A.; Sanna, A.; Basile, A. Glycerol production and transformation: A critical review with particular emphasis on glycerol reforming reaction for producing hydrogen in conventional and membrane reactors. Membranes 2017, 7, 17. [Google Scholar] [CrossRef]
- Pitt, F.D.; Domingos, A.M.; Barros, A.A.C. Purification of residual glycerol recovered from biodiesel production. S. Afr. J. Chem. Eng. 2019, 29, 42–51. [Google Scholar] [CrossRef]
- Raqeeb, M.A.; Bhargavi, R. Biodiesel production from waste cooking oil. J. Chem. Pharm. Res. 2015, 7, 670–681. [Google Scholar]
Figure 1.
Balloon plot representing the quantities of different types of fatty acids in the herbal wastes.
Figure 1.
Balloon plot representing the quantities of different types of fatty acids in the herbal wastes.

Figure 2.
Fatty acid methyl esters composition of analyzed herbal industry wastes.

Figure 3.
The percentage share of fatty acids among different herbal wastes. “0” means not present in the fatty acid profile.
Figure 3.
The percentage share of fatty acids among different herbal wastes. “0” means not present in the fatty acid profile.

Figure 4.
The percentage share of (a) monounsaturated (MUFA), (b) polyunsaturated (PUFA), (c) and saturated (SFA) types of fatty acids among different herbal wastes. “0” means not present in the fatty acid profile.
Figure 4.
The percentage share of (a) monounsaturated (MUFA), (b) polyunsaturated (PUFA), (c) and saturated (SFA) types of fatty acids among different herbal wastes. “0” means not present in the fatty acid profile.

Figure 5.
Comparison of the selected FAMEs composition with previously published results (name colored in violet and with an asterisk) by Orsavova, et al. [49]. “0” means not present in the fatty acid profile.
Figure 5.
Comparison of the selected FAMEs composition with previously published results (name colored in violet and with an asterisk) by Orsavova, et al. [49]. “0” means not present in the fatty acid profile.
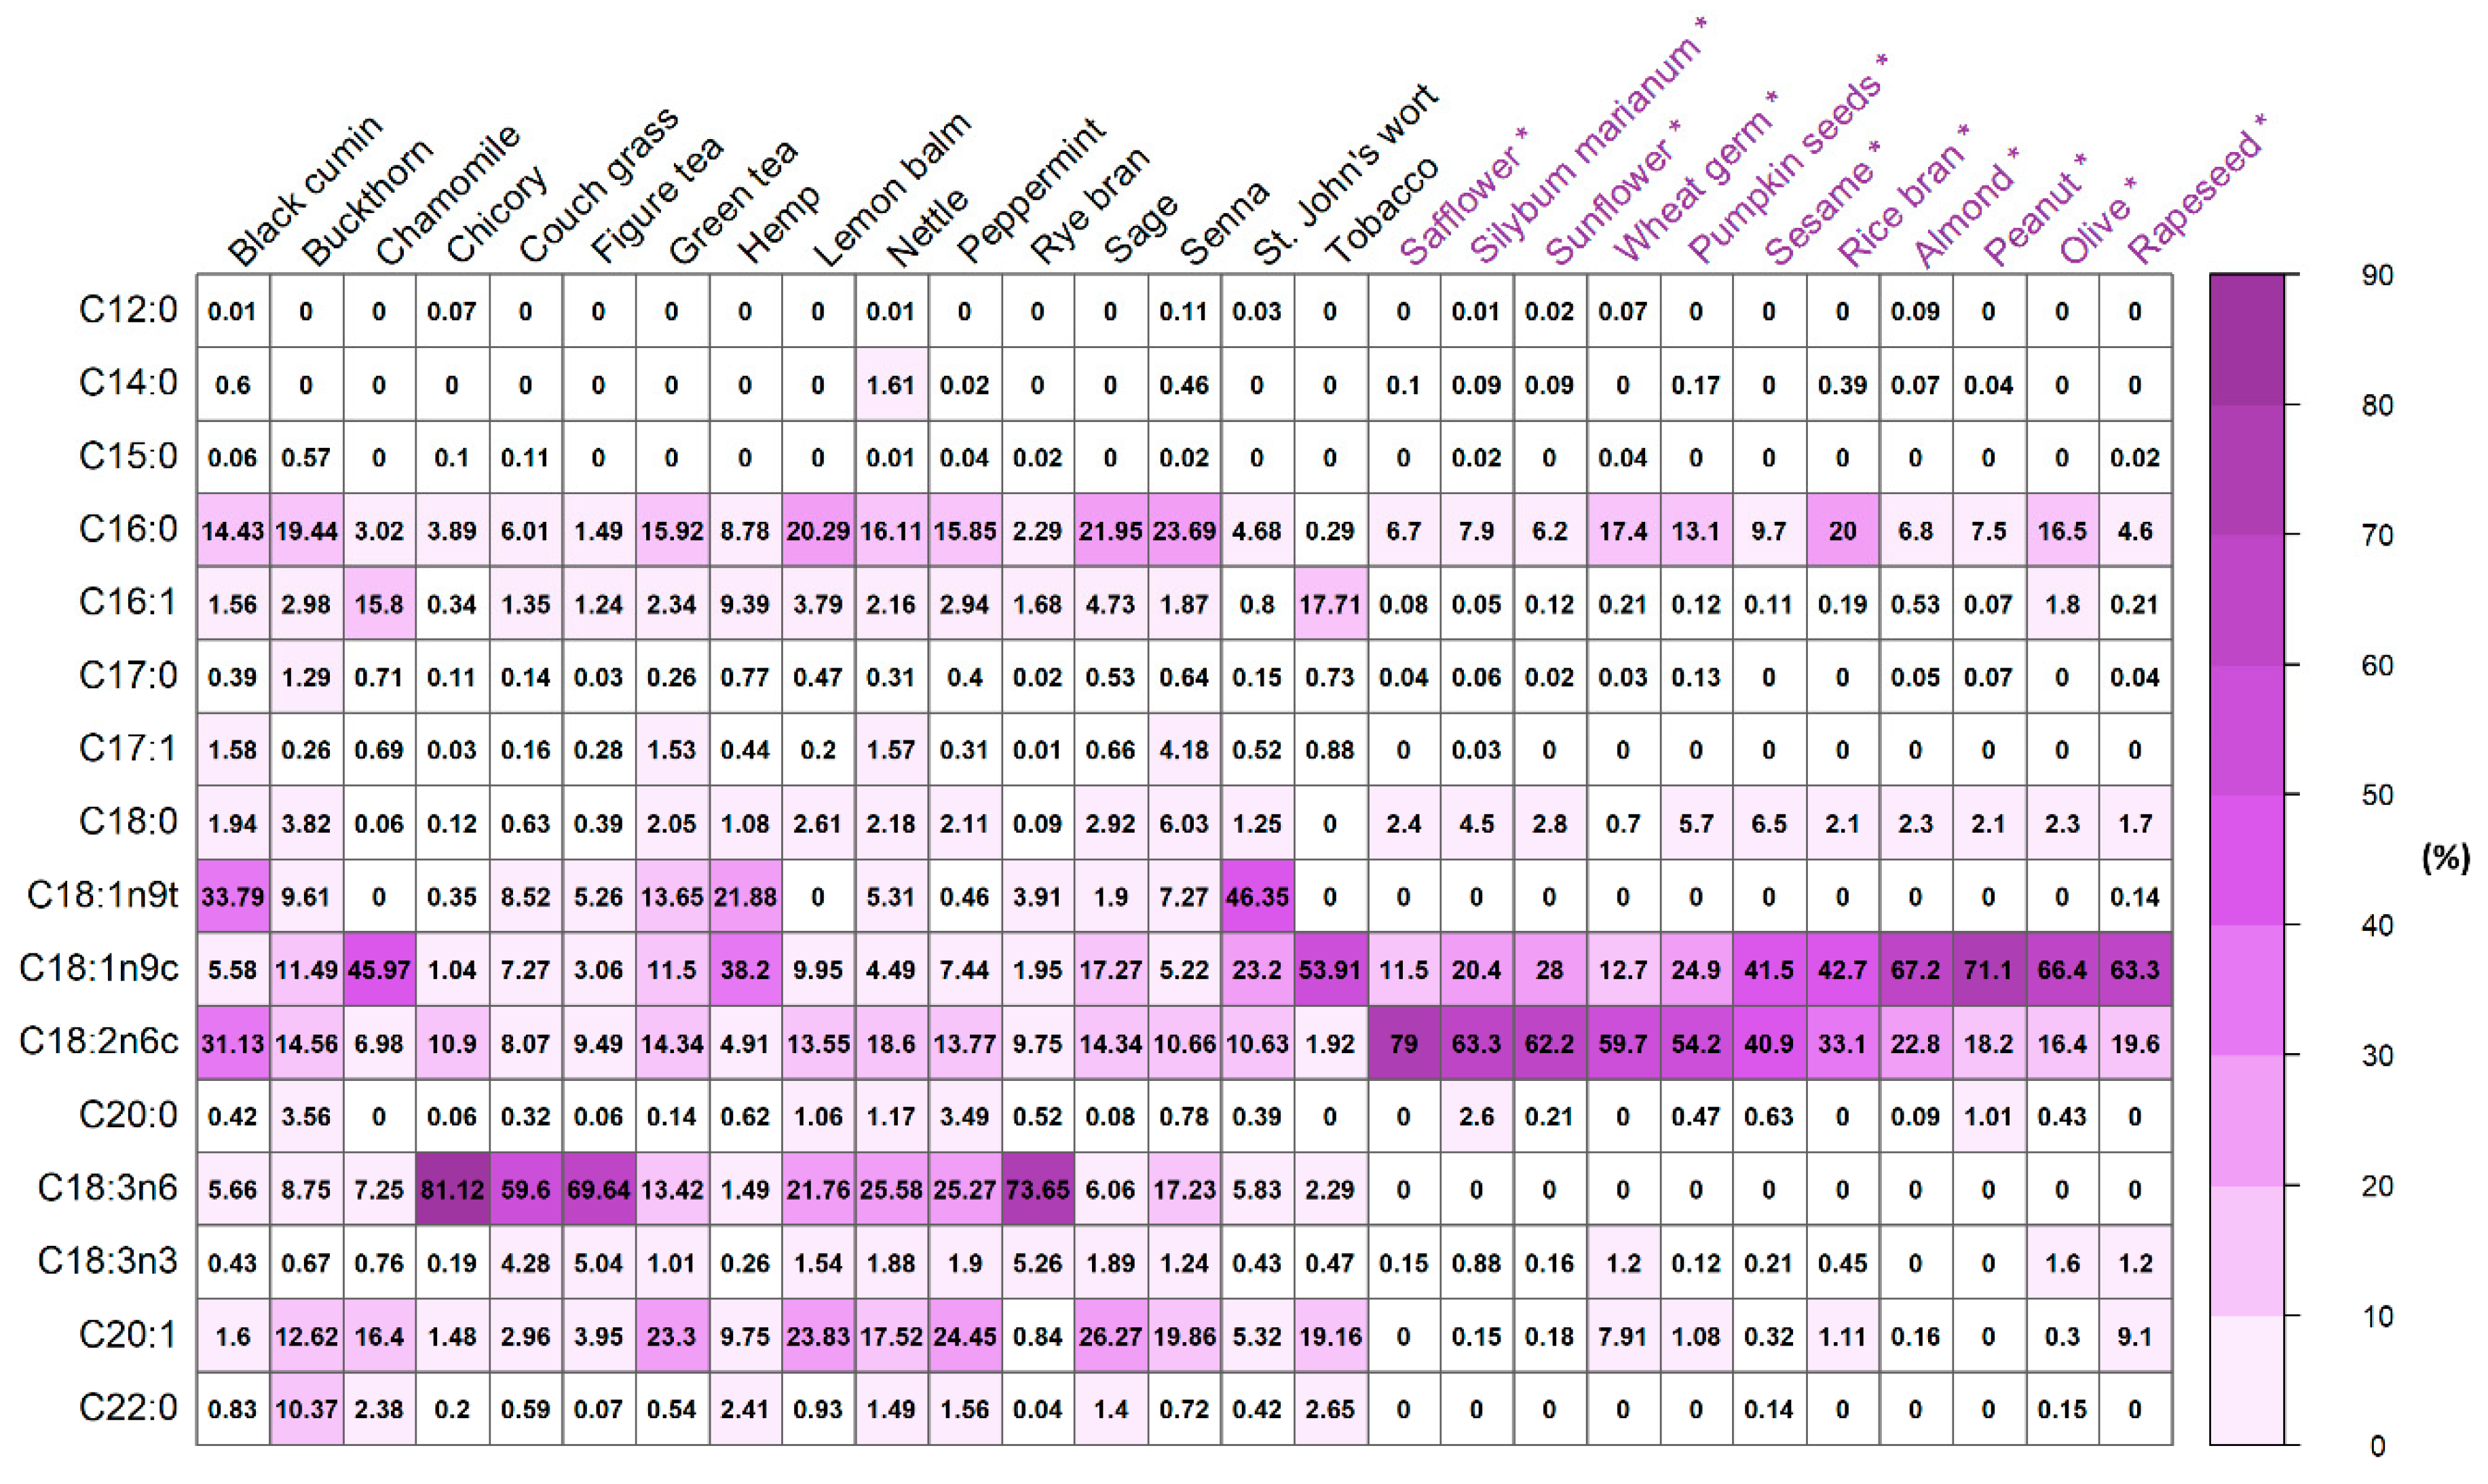
Figure 6.
Predicted cetane number (CN) using equation (1) with minimum and maximum error range, calculated using equation (2), for assumed estimation error equal to 8%. Solid vertical line indicates CN equal to 47 (ASTM D6751-20 [54]), while dashed line shows CN equal to 51 (BS EN 14214:2012+A2:2019 [56]).
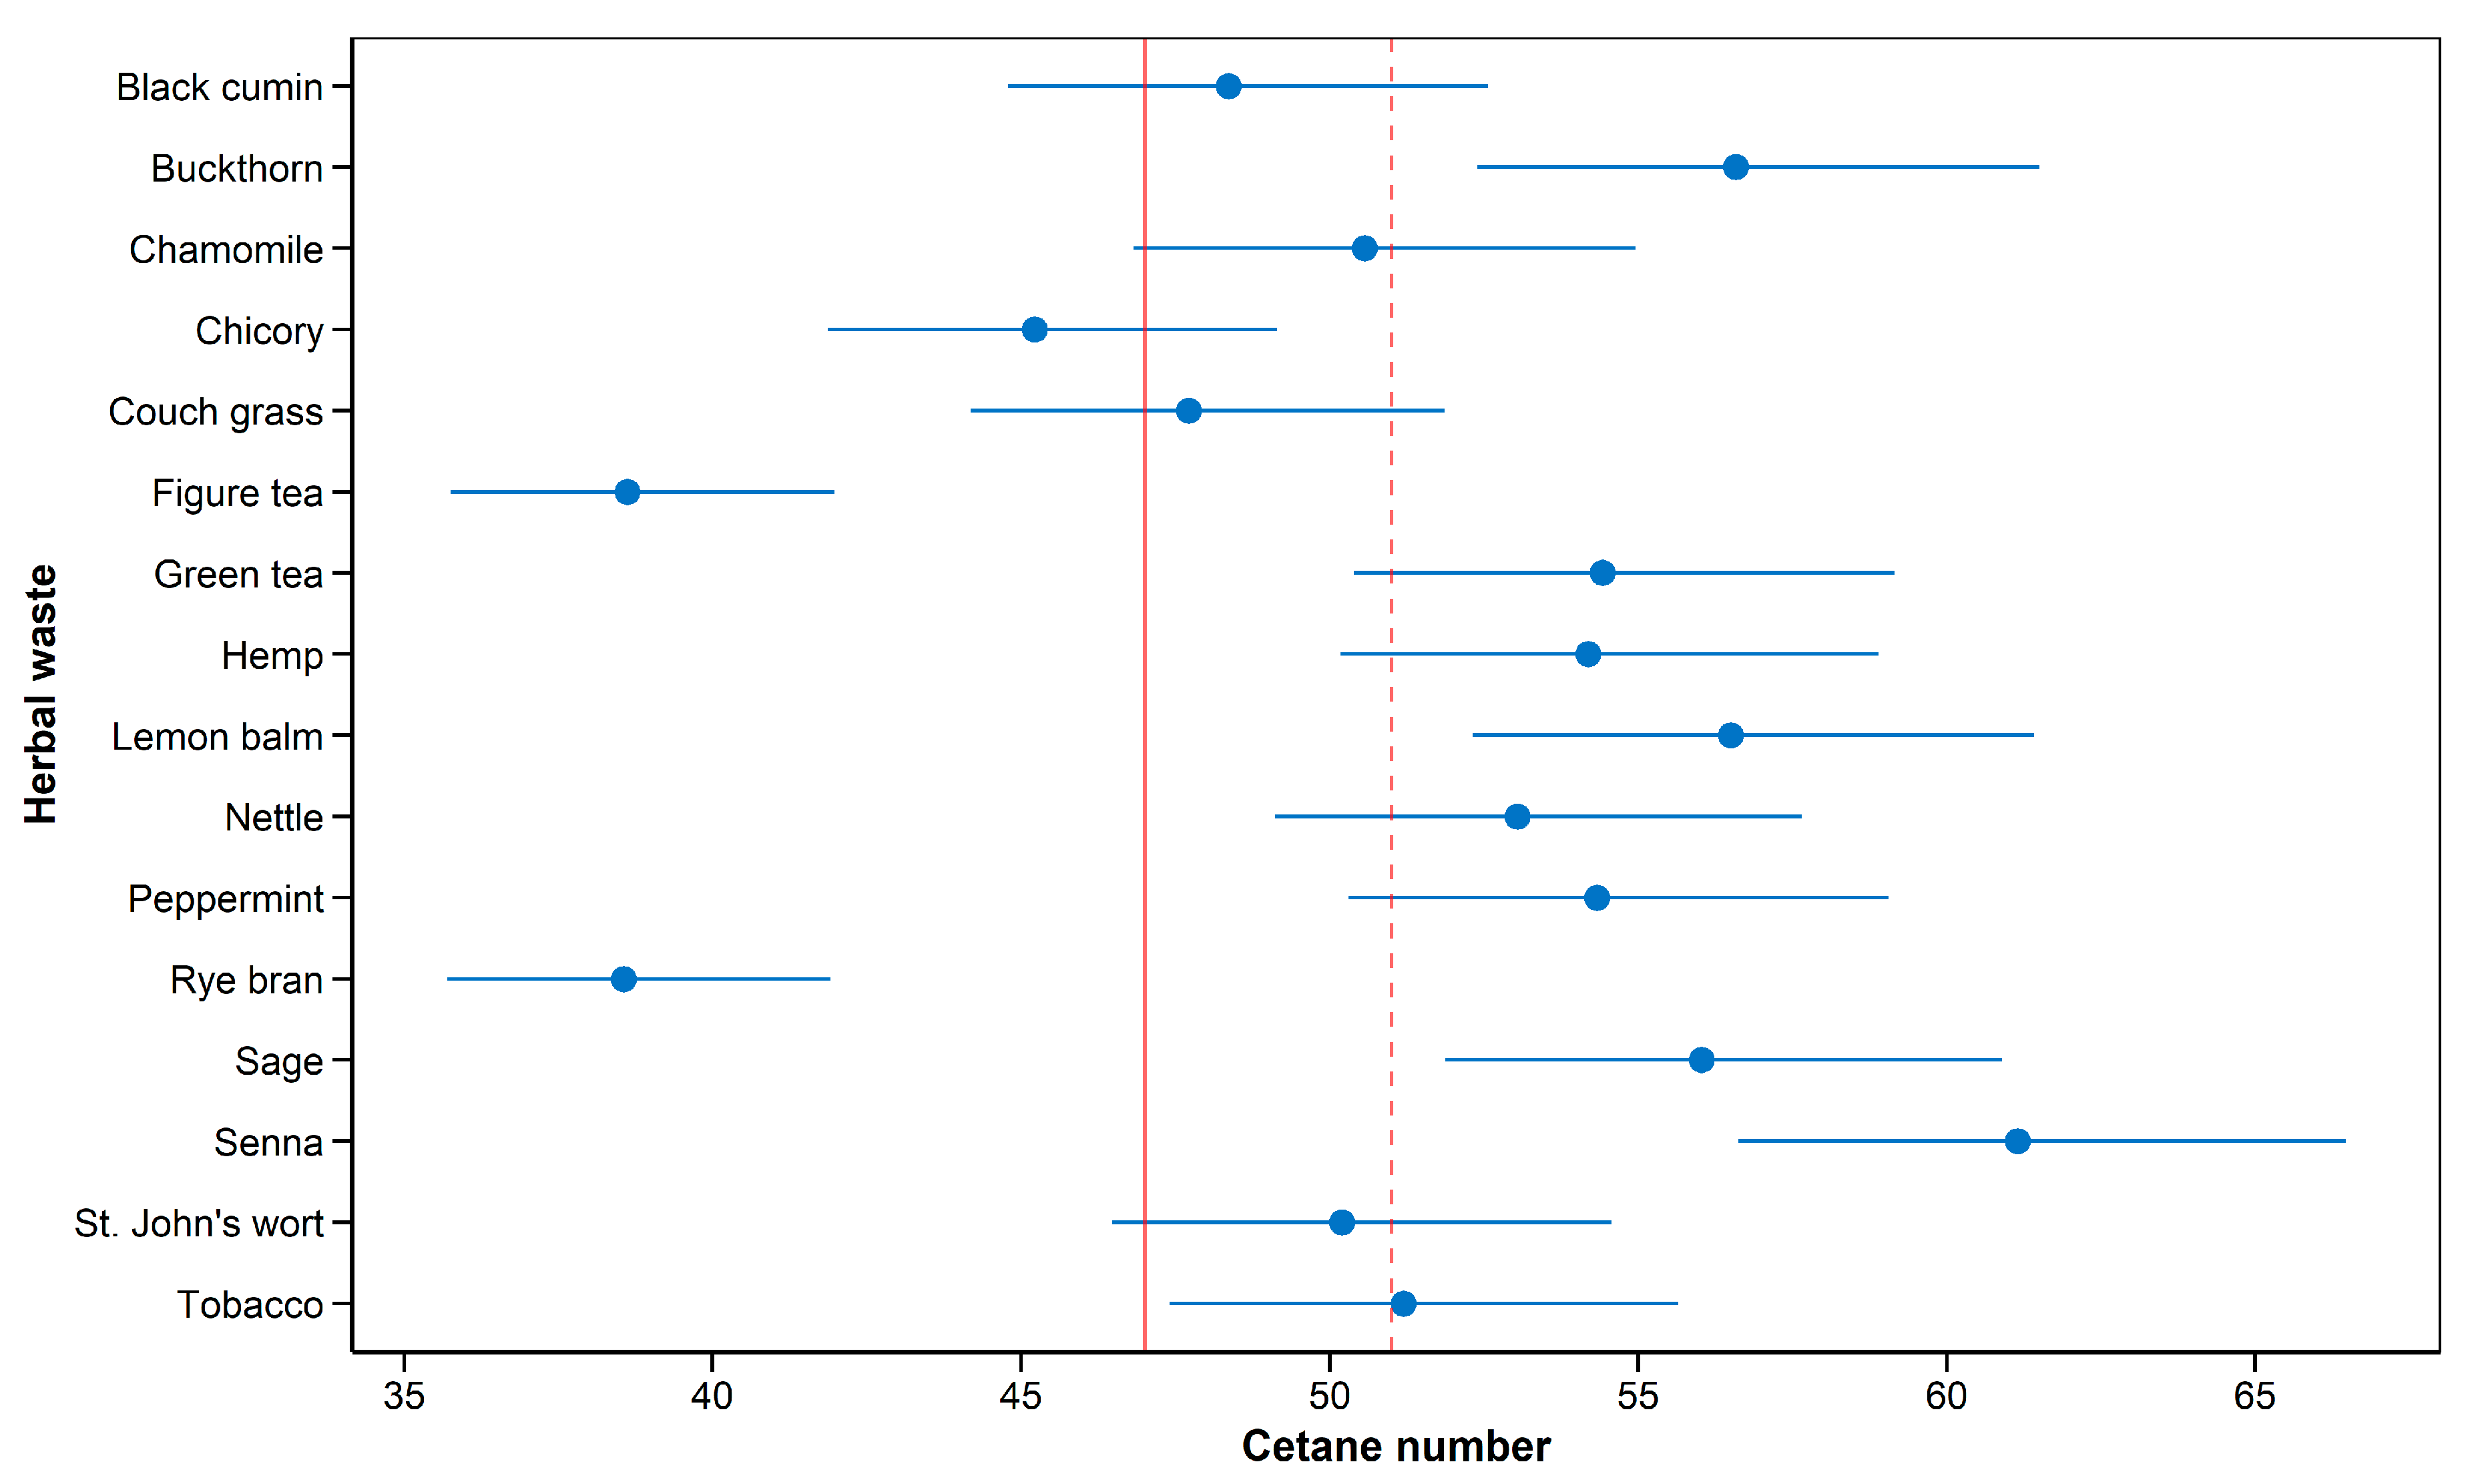
Figure 7.
(a) Biplot of fatty acids profile for each repetition of herbal wastes (n = 3), showing the first two dimensions (Dim1 and Dim2) of the principal component analysis (PCA) model that together explain about 50.27% of the variance. Biplot vectors (colored according to the type of fatty acid) indicate the strength and direction of factor loading for the first two factors. Individuals are colored by the herbal wastes (n = 16). (b) Values of cos2 for variables in the PCA model, showing the quality of representation for variables on the factor map (Dim1-31). (c) Scree plot (a plot of the eigenvalues by the number of the dimensions/principal components) from the PCA model.
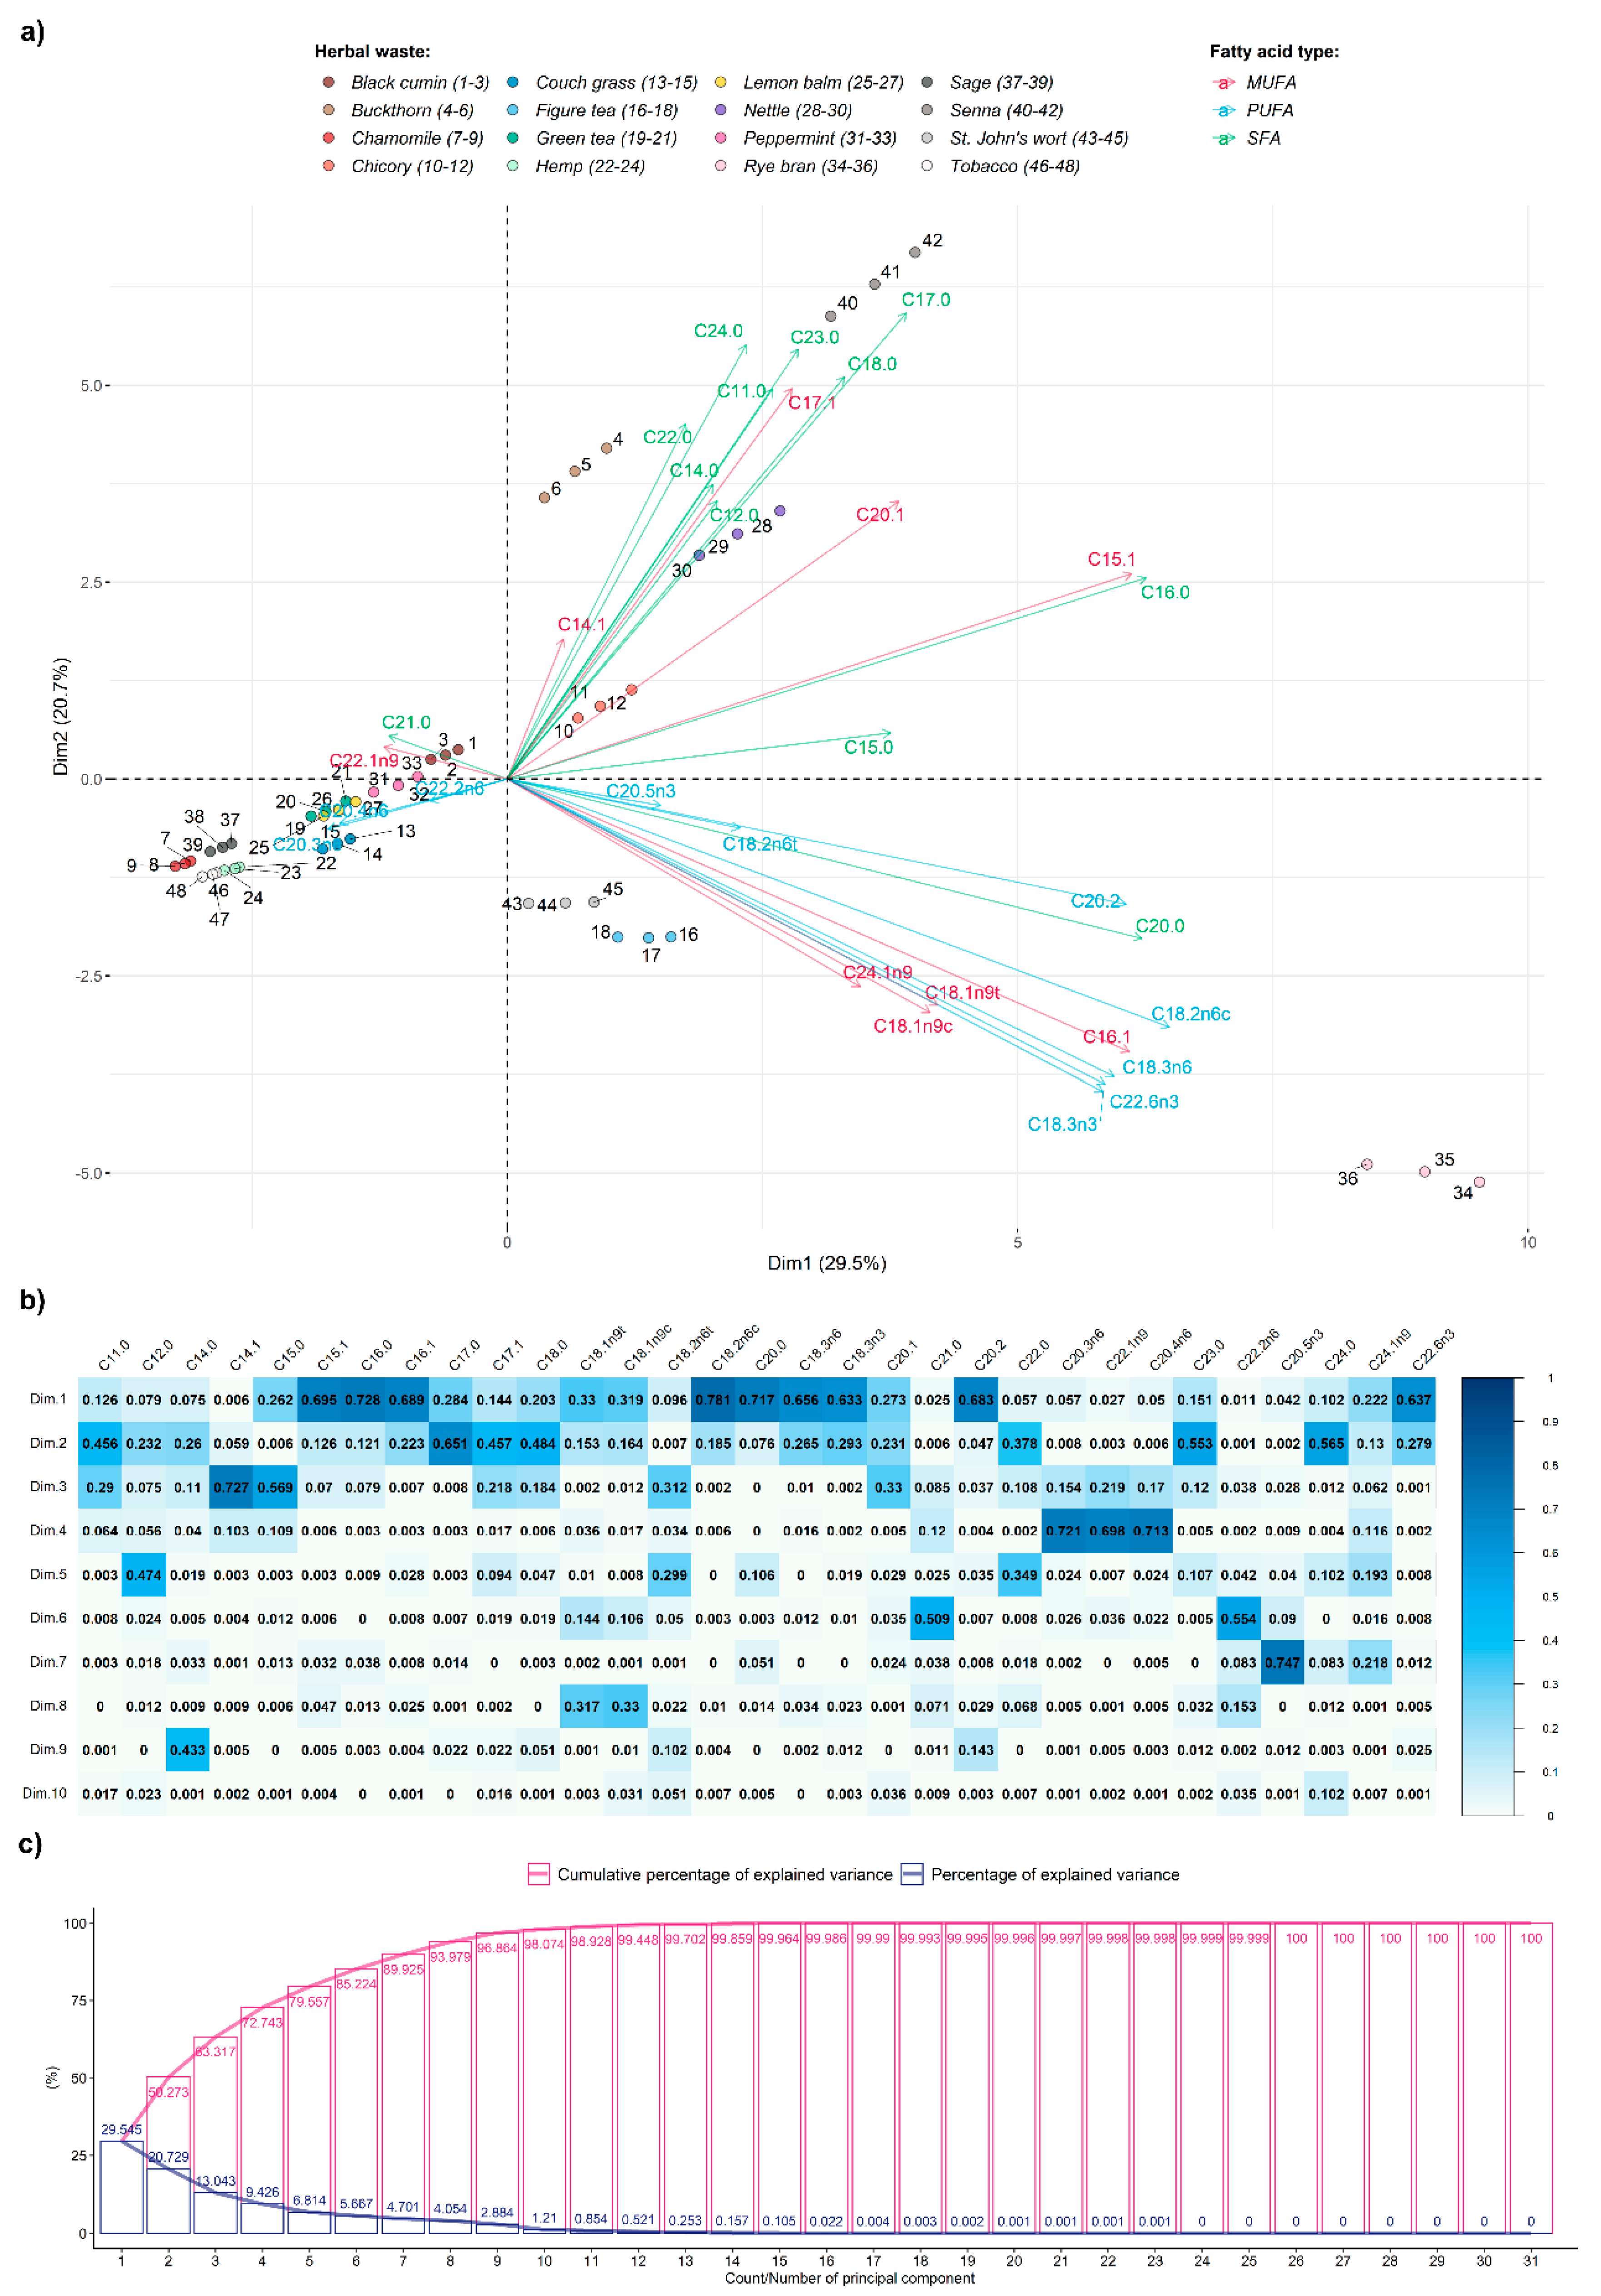
Figure 8.
Dendrogram from the hierarchical clustering on principal components build-up on the PCA model with ten principal components (≈ 98.12% of explained variance), showing the clustering of herbal wastes.
Figure 8.
Dendrogram from the hierarchical clustering on principal components build-up on the PCA model with ten principal components (≈ 98.12% of explained variance), showing the clustering of herbal wastes.

Table 1.
FAMEs standards used in the GC-MS analysis.
| Type of Fatty Acid | Systematic Name | The Common Name of FAME | Abbreviation * |
|---|---|---|---|
| MUFA | Myristoleic acid methyl ester | Myristoleic acid | C14:1 |
| cis-10-Pentadecanoic acid methyl ester | Pentadecanoic acid | C15:1 | |
| 9-Hexadecenoic acid methyl ester | Palmitoleic acid | C16:1 | |
| cis-10-Heptadecenoic acid methyl ester | Heptadecenoic acid | C17:1 | |
| trans-9-Octadecenoic acid methyl ester (Z) | Elaidic acid | C18:1n9t | |
| 9-Octadecenoic acid methyl ester (E) | Oleic acid | C18:1n9c | |
| cis-11-Eicosenoic acid methyl ester | Gondoic acid | C20:1 | |
| 13-Docosenoic acid methyl ester (Z) | Erucic acid | C22:1n9 | |
| 15-Tetracosenoic acid methyl ester (Z) | Nervonic acid | C24:1n9 | |
| PUFA | 9,12-Octadecadienoic acid methyl ester (E,E) | Linolelaidic acid | C18:2n6t |
| 9,12-Octadecadienoic acid methyl ester (Z,Z) | Linoleic acid | C18:2n6c | |
| all-cis-6,9,12-Octadecatrienoic acid | γ-Linolenic acid | C18:3n6 | |
| 9,12,15-Octadecatrienoic acid methyl ester (Z,Z,Z) | Linolenic acid | C18:3n3 | |
| cis-11,14-Eicosadienoic acid methyl ester | Eicosadienoic acid | C20:2 | |
| cis-11,14,17-Eicosatrienoic acid methyl ester | Eicosatrienoic acid | C20:3n3 | |
| cis-8,11,14-Eicosatrienoic acid methyl ester | Dihomo-γ-linolenic acid | C20:3n6 | |
| 5,8,11,14-Eicosatetraenoic acid methyl ester (all-Z) | Arachidonic acid | C20:4n6 | |
| cis-5,8,11,14,17-Eicosapentaenoic acid methyl ester | Eicosapentaenoic acid | C20:5n3 | |
| cis-13,16-Docasadienoic acid methyl ester | Docosadienoic acid | C22:2n6 | |
| 4,7,10,13,16,19-Docosahexaenoic acid methyl ester (all-Z) | Cervonic acid | C22:6n3 | |
| SFA | Butyric acid methyl ester | Butyric acid | C4:0 |
| Hexanoic acid methyl ester | Caproic acid | C6:0 | |
| Octanoic acid methyl ester | Caprylic acid | C8:0 | |
| Decanoic acid methyl ester | Capric acid | C10:0 | |
| Undecanoic acid methyl ester | Undecylic acid | C11:0 | |
| Dodecanoic acid methyl ester | Lauric acid | C12:0 | |
| Tridecanoic acid methyl ester | Tridecylic acid | C13:0 | |
| Tetradecanoic acid methyl ester | Myristic acid | C14:0 | |
| Pentadecanoic acid methyl ester | Pentadecylic acid | C15:0 | |
| Hexadecanoic acid methyl ester | Palmitic acid | C16:0 | |
| Heptadecanoic acid methyl ester | Margaric acid | C17:0 | |
| Octadecanoic acid methyl ester | Stearic acid | C18:0 | |
| Eicosanoic acid methyl ester | Arachidic acid | C20:0 | |
| Heneicosanoic acid methyl ester | Heneicosylic acid | C21:0 | |
| Docosanoic acid methyl ester | Behenic acid | C22:0 | |
| Tricosanoic acid methyl ester | Tricosylic acid | C23:0 | |
| Tetracosanoic acid methyl ester | Lignoceric acid | C24:0 |
* Abbreviations of FAMEs are used consequently in the whole text.
Table 2.
The content of MUFA (µg g−1dw) in the herbal industry wastes. Data, grouped by herb for each fatty acid, represent the mean (n = 3) ± standard deviation. Means with the same letters are not significantly different (p ≥ 0.05) according to Tuckey’s post-hoc test.
Table 2.
The content of MUFA (µg g−1dw) in the herbal industry wastes. Data, grouped by herb for each fatty acid, represent the mean (n = 3) ± standard deviation. Means with the same letters are not significantly different (p ≥ 0.05) according to Tuckey’s post-hoc test.
| Herbal Waste | C14:1 | C15:1 | C16:1 | C17:1 | C18:1n9t | C18:1n9c | C20:1 | C22:1n9 | C24:1n9 |
|---|---|---|---|---|---|---|---|---|---|
| Black cumin | 15.97 ± 0.64 b | 157.68 ± 3.26 de | 26.75 ± 0.56 de | 27.21 ± 0.82 cd | 580.7 ± 17.42 c | 95.84 ± 4.98 fgh | 27.49 ± 1.43 j | 6.99 ± 0.28 c | 1.87 ± 0.06 g |
| Buckthorn | 18.53 ± 0.89 a | 118.23 ± 6.52 fg | 31.01 ± 2.17 de | 2.72 ± 0.13 e | 99.90 ± 2.07 ef | 119.5 ± 8.37 efg | 131.23 ± 6.83 h | 10.56 ± 0.53 c | 2.23 ± 0.10 fg |
| Chamomile | 13.88 ± 0.63 c | ND | 24.51 ± 0.86 e | 1.07 ± 0.07 e | ND | 71.32 ± 3.23 h | 25.45 ± 0.77 j | ND | 1.67 ± 0.05 g |
| Chicory | 19.79 ± 1.09 a | 174.16 ± 8.71 d | 25.73 ± 2.44 de | 1.99 ± 0.10 e | 26.80 ± 1.34 fg | 79.56 ± 3.98 gh | 112.63 ± 5.63 hi | ND | 10.57 ± 0.53 a |
| Couch grass | 14.96 ± 0.75 bc | 74.80 ± 2.99 h | 29.42 ± 1.18 de | 3.57 ± 0.27 e | 185.75 ± 7.43 de | 158.64 ± 3.17 de | 64.46 ± 2.58 ij | 0.49 ± 0.03 c | 3.43 ± 0.19 de |
| Figure tea | 14.00 ± 0.63 bc | 92.89 ± 3.78 gh | 136.48 ± 5.55 b | 31.04 ± 0.64 c | 577.23 ± 23.49 c | 336.21 ± 11.85 c | 434.31 ± 26.01 c | 37.13 ± 1.68 c | 11.22 ± 0.73 a |
| Green tea | 14.29 ± 0.86 bc | 124.89 ± 6.74 f | 32.81 ± 1.99 de | 21.48 ± 1.30 d | 191.34 ± 11.54 de | 161.19 ± 8.06 de | 326.55 ± 16.94 de | 0.43 ± 0.04 c | 2.82 ± 0.24 ef |
| Hemp | 13.96 ± 0.43 c | 10.62 ± 0.48 i | 24.84 ± 0.76 e | 1.17 ± 0.04 e | 57.85 ± 1.78 fg | 101.01 ± 2.02 fgh | 25.79 ± 0.94 j | 1.29 ± 0.06 c | 2.18 ± 0.08 fg |
| Lemon balm | 14.09 ± 0.84 bc | 128.93 ± 3.45 ef | 42.49 ± 1.07 d | 2.29 ± 0.14 e | ND | 111.50 ± 7.23 fgh | 266.92 ± 15.98 f | ND | 2.35 ± 0.12 fg |
| Nettle | 14.10 ± 0.43 bc | 341.67 ± 22.16 c | 76.82 ± 3.24 c | 55.82 ± 3.62 b | 189.08 ± 12.26 de | 159.86 ± 4.80 de | 623.50 ± 40.43 b | 4.73 ± 0.22 c | 2.76 ± 0.18 ef |
| Peppermint | 15.23 ± 0.55 bc | 129.30 ± 9.14 ef | 42.96 ± 3.04 d | 4.45 ± 0.31 e | 6.75 ± 0.52 fg | 108.60 ± 7.68 fgh | 356.80 ± 16.19 d | 9.79 ± 0.69 c | 2.80 ± 0.15 ef |
| Rye bran | 14.65 ± 0.51 bc | 475.78 ± 16.65 b | 586.29 ± 20.52 a | 5.03 ± 0.20 e | 1361.85 ± 47.67 b | 678.91 ± 22.12 b | 292.11 ± 13.22 ef | ND | 8.25 ± 0.25 b |
| Sage | 14.42 ± 0.51 bc | 92.08 ± 4.43 gh | 35.45 ± 2.31 de | 4.95 ± 0.39 e | 14.25 ± 0.45 fg | 129.38 ± 5.19 ef | 196.82 ± 11.94 g | 1066.26 ± 64.7 a | 4.52 ± 0.29 c |
| Senna | 13.99 ± 0.43 bc | 531.34 ± 24.59 a | 72.40 ± 4.00 c | 161.46 ± 8.92 a | 280.87 ± 15.52 d | 201.41 ± 11.13 d | 766.87 ± 27.93 a | 244.22 ± 14.65 b | 2.26 ± 0.15 fg |
| St. John’s wort | 14.78 ± 0.30 bc | 16.49 ± 1.17 i | 31.81 ± 2.25 de | 20.55 ± 1.57 d | 1834.95 ± 113.63 a | 918.29 ± 50.41 a | 210.50 ± 14.88 g | ND | 3.96 ± 0.20 cd |
| Tobacco | 15.59 ± 0.57 bc | ND | 23.58 ± 1.13 e | 1.17 ± 0.07 e | ND | 71.79 ± 1.44 h | 25.52 ± 1.28 j | 5.92 ± 0.36 c | 2.31 ± 0.11 fg |
ND, not detected.
Table 3.
The content of PUFA (µg g−1dw) in the herbal industry wastes. Data, grouped by herb for each fatty acid, represent the mean (n = 3) ± standard deviation. Means with the same letters are not significantly different (p ≥ 0.05) according to Tuckey’s post-hoc test.
Table 3.
The content of PUFA (µg g−1dw) in the herbal industry wastes. Data, grouped by herb for each fatty acid, represent the mean (n = 3) ± standard deviation. Means with the same letters are not significantly different (p ≥ 0.05) according to Tuckey’s post-hoc test.
| Herbal Waste | C18:2n6t | C18:2n6c | C18:3n6 | C18:3n3 | C20:2 | C20:3n6 | C20:4n6 | C22:2n6 | C20:5n3 | C22:6n3 |
|---|---|---|---|---|---|---|---|---|---|---|
| Black cumin | 513.96 ± 17.99 b | 534.95 ± 16.05 e | 97.28 ± 2.92 f | 7.34 ± 0.22 ef | 3.81 ± 0.18 de | 3.57 ± 0.11 b | 2.89 ± 0.10 cd | 40.71 ± 0.85 c | 45.18 ± 1.36 bc | 4.72 ± 0.29 e |
| Buckthorn | 24.72 ± 1.73 fgh | 151.39 ± 4.93 g | 91.02 ± 6.37 f | 6.99 ± 0.35 ef | 3.10 ± 0.25 efg | ND | 2.49 ± 0.17 cd | 40.87 ± 2.30 c | 45.71 ± 2.12 bc | 6.27 ± 0.38 d |
| Chamomile | 3.36 ± 0.21 h | 10.83 ± 0.67 h | 11.25 ± 0.70 f | 1.17 ± 0.07 f | 2.16 ± 0.13 h | ND | ND | 40.32 ± 2.50 c | 43.84 ± 2.97 c | ND |
| Chicory | 809.03 ± 33.24 a | 829.61 ± 25.52 c | 6175.65 ± 165.04 c | 14.69 ± 0.73 ef | 2.83 ± 0.14 fgh | ND | 2.29 ± 0.13 cd | 42.09 ± 2.10 c | 45.74 ± 2.13 bc | 4.75 ± 0.15 e |
| Couch grass | 41.88 ± 1.68 fg | 175.92 ± 7.04 g | 1299.94 ± 52.00 d | 93.44 ± 4.67 c | 2.60 ± 0.14 fgh | ND | 2.39 ± 0.10 cd | 41.68 ± 3.12 c | 44.96 ± 1.80 bc | 5.11 ± 0.20 de |
| Figure tea | 120.49 ± 6.02 e | 1042.53 ± 31.28 b | 7648.76 ± 294.49 b | 553.56 ± 22.52 b | 4.28 ± 0.17 d | 1.59 ± 0.10 b | 17.02 ± 0.69 bc | 58.18 ± 3.19 b | 66.54 ± 2.71 a | 14.73 ± 0.77 b |
| Green tea | 43.30 ± 2.81 fg | 200.97 ± 12.12 g | 188.12 ± 12.46 ef | 14.17 ± 0.85 ef | 2.86 ± 0.23 fgh | ND | 5.21 ± 0.31 bcd | 284.24 ± 8.74 a | 45.39 ± 2.54 bc | 5.84 ± 0.18 de |
| Hemp | 3.45 ± 0.11 h | 12.99 ± 0.72 h | 3.95 ± 0.12 f | 0.68 ± 0.02 f | 2.43 ± 0.07 gh | ND | 5.88 ± 0.18 bcd | ND | 44.00 ± 2.38 c | 5.06 ± 0.24 de |
| Lemon balm | 21.39 ± 1.28 gh | 151.81 ± 3.14 g | 243.79 ± 14.60 ef | 17.3 ± 1.04 ef | 3.13 ± 0.20 efg | ND | 3.01 ± 0.20 cd | 41.79 ± 2.50 c | 51.49 ± 2.90 b | 5.21 ± 0.26 de |
| Nettle | 42.86 ± 2.78 fg | 661.80 ± 42.92 d | 910.30 ± 35.05 de | 66.71 ± 4.33 cd | 7.59 ± 0.45 b | 3.17 ± 0.17 b | 20.55 ± 1.33 b | 40.61 ± 2.19 c | 50.25 ± 3.26 bc | 5.09 ± 0.28 de |
| Peppermint | 21.34 ± 1.07 gh | 201.00 ± 14.21 g | 368.69 ± 18.62 ef | 27.68 ± 1.26 def | 2.87 ± 0.20 fgh | 1.56 ± 0.12 b | 4.25 ± 0.19 bcd | 66.92 ± 4.73 b | 44.13 ± 2.99 c | 5.00 ± 0.27 de |
| Rye bran | 278.51 ± 9.75 d | 3398.81 ± 118.97 a | 25,681.91 ± 898.92 a | 1832.6 ± 54.98 a | 9.16 ± 0.52 a | 0.10 ± 0.001 b | 3.48 ± 0.31 cd | 43.54 ± 2.70 c | 45.53 ± 1.15 bc | 27.04 ± 1.23 a |
| Sage | 16.66 ± 0.80 gh | 107.46 ± 6.52 gh | 45.44 ± 3.62 f | 14.13 ± 0.71 ef | 3.13 ± 0.19 efg | 496.99 ± 20.22 a | 411.18 ± 22.06 a | 44.47 ± 2.83 c | 44.45 ± 2.70 bc | 4.91 ± 0.12 e |
| Senna | 60.17 ± 2.54 f | 411.64 ± 18.50 f | 665.31 ± 39.92 def | 47.85 ± 2.64 de | 3.39 ± 0.19 ef | 1.63 ± 0.09 b | 6.72 ± 0.37 bcd | 41.83 ± 2.51 c | 46.46 ± 1.66 bc | 4.95 ± 0.20 e |
| St. John’s wort | 378.55 ± 26.77 c | 420.86 ± 27.88 f | 230.95 ± 16.33 ef | 17.08 ± 1.45 ef | 5.53 ± 0.50 c | 1.67 ± 0.08 b | 2.17 ± 0.18 cd | 41.50 ± 1.70 c | 43.85 ± 2.37 c | 8.93 ± 0.52 c |
| Tobacco | 2.97 ± 0.18 h | 2.55 ± 0.09 h | 3.05 ± 0.06 f | 0.63 ± 0.02 f | 2.12 ± 0.10 h | 4.76 ± 0.17 b | 2.35 ± 0.09 cd | 41.00 ± 1.34 c | 43.87 ± 2.11 c | 5.26 ± 0.19 de |
ND, not detected.
Table 4.
The content of SFA (µg g−1dw) in the herbal industry wastes. Data, grouped by herb for each fatty acid, represent the mean (n = 3) ± standard deviation. Means with the same letters are not significantly different (p ≥ 0.05) according to Tuckey’s post-hoc test.
Table 4.
The content of SFA (µg g−1dw) in the herbal industry wastes. Data, grouped by herb for each fatty acid, represent the mean (n = 3) ± standard deviation. Means with the same letters are not significantly different (p ≥ 0.05) according to Tuckey’s post-hoc test.
| Herbal Waste | C11:0 | C12:0 | C14:0 | C15:0 | C16:0 | C17:0 | C18:0 | C20:0 | C21:0 | C22:0 | C23:0 | C24:0 |
|---|---|---|---|---|---|---|---|---|---|---|---|---|
| Black cumin | ND | 0.10 ± 0.001 d | 10.23 ± 0.53 c | 1.10 ± 0.03 d | 247.90 ± 6.22 de | 6.70 ± 0.27 def | 33.33 ± 0.84 def | 7.27 ± 0.18 efg | 0.02 ± 0.001 i | 14.26 ± 0.43 de | 5.63 ± 0.17 ef | 282.70 ± 2.83 d |
| Buckthorn | 5.43 ± 0.38 a | ND | ND | 5.94 ± 0.42 b | 202.13 ± 12.27 efg | 13.39 ± 0.62 b | 39.77 ± 2.78 cde | 37.00 ± 2.59 cd | 6.15 ± 0.43 e | 107.79 ± 6.54 a | 14.42 ± 1.01 a | 525.09 ± 10.50 a |
| Chamomile | ND | ND | ND | ND | 4.68 ± 0.29 i | 1.10 ± 0.07 j | 0.09 ± 0.01 j | ND | 0.12 ± 0.01 i | 3.69 ± 0.17 h | 3.56 ± 0.12 i | 1.80 ± 0.11 g |
| Chicory * | 4.51 ± 0.27 b | 5.39 ± 0.32 a | ND | 7.32 ± 0.37 a | 296.46 ± 14.82 d | 8.06 ± 0.40 d | 9.31 ± 0.75 ij | 4.93 ± 0.25 fg | 9.63 ± 0.69 d | 15.29 ± 1.10 de | 7.36 ± 0.37 cd | 28.31 ± 1.42 f |
| Couch grass | ND | ND | ND | 2.35 ± 0.16 c | 131.01 ± 4.77 h | 3.01 ± 0.12 hi | 13.72 ± 0.55 hi | 7.04 ± 0.46 efg | 0.74 ± 0.05 hi | 12.94 ± 0.52 def | 6.06 ± 0.38 e | ND |
| Figure tea | 0.12 ± 0.001 f | ND | ND | ND | 163.72 ± 2.51 gh | 2.97 ± 0.12 hi | 42.39 ± 2.54 cd | 6.38 ± 0.26 efg | 3.01 ± 0.09 fg | 7.39 ± 0.37 fgh | 3.92 ± 0.23 hi | 177.34 ± 8.52 e |
| Green tea | ND | ND | ND | ND | 223.10 ± 13.45 efg | 3.7 ± 0.22 gh | 28.68 ± 1.02 fg | 1.97 ± 0.07 g | 32.81 ± 2.15 a | 7.63 ± 0.27 fgh | 5.06 ± 0.38 efgh | ND |
| Hemp | ND | ND | ND | ND | 23.21 ± 0.71 i | 2.04 ± 0.10 ij | 2.85 ± 0.09 j | 1.65 ± 0.05 g | 0.17 ± 0.001 i | 6.37 ± 0.20 gh | 4.24 ± 0.13 ghi | ND |
| Lemon balm | ND | ND | ND | ND | 227.25 ± 13.61 ef | 5.29 ± 0.32 fg | 29.26 ± 1.32 fg | 11.86 ± 0.71 ef | 26.48 ± 1.72 b | 10.44 ± 0.45 efg | 4.51 ± 0.27 fghi | 7.02 ± 0.42 g |
| Nettle | 2.05 ± 0.09 d | 0.30 ± 0.02 d | 57.2 ± 3.71 a | 0.29 ± 0.02 e | 573.32 ± 29.05 c | 11.00 ± 0.66 c | 77.49 ± 4.65 b | 41.64 ± 2.11 bc | 6.71 ± 0.47 e | 52.84 ± 3.43 b | 8.37 ± 0.54 c | 313.89 ± 11.06 c |
| Peppermint | ND | ND | 0.25 ± 0.02 d | 0.61 ± 0.04 d | 231.25 ± 9.25 ef | 5.82 ± 0.33 ef | 30.77 ± 2.18 efg | 50.90 ± 3.60 b | 2.77 ± 0.21 fgh | 22.71 ± 1.25 c | 6.16 ± 0.52 de | ND |
| Rye bran | 0.67 ± 0.04 e | ND | 0.08 ± 0.001 d | 5.50 ± 0.34 b | 798.44 ± 29.08 b | 7.03 ± 0.40 de | 30.4 ± 1.06 efg | 180.37 ± 11.77 a | 3.20 ± 0.11 f | 13.07 ± 0.59 def | 5.84 ± 0.20 e | 9.64 ± 0.54 g |
| Sage | ND | ND | ND | ND | 164.44 ± 8.22 gh | 3.98 ± 0.22 gh | 21.88 ± 1.33 gh | 0.59 ± 0.04 g | 18.93 ± 0.51 c | 10.48 ± 0.64 efg | 4.15 ± 0.25 ghi | ND |
| Senna | 3.05 ± 0.18 c | 4.25 ± 0.24 b | 17.86 ± 0.99 b | 0.92 ± 0.05 d | 914.69 ± 60.59 a | 24.74 ± 1.73 a | 232.95 ± 10.57 a | 30.08 ± 1.66 d | 6.20 ± 0.34 e | 27.96 ± 1.41 c | 10.08 ± 0.40s b | 367.34 ± 13.11 b |
| St. John’s wort | ND | 1.09 ± 0.08 c | ND | ND | 185.19 ± 6.53 fgh | 5.76 ± 0.41 ef | 49.62 ± 3.97 c | 15.47 ± 0.70 e | 0.92 ± 0.06 ghi | 16.55 ± 1.17 d | 5.38 ± 0.38 efg | ND |
| Tobacco | ND | ND | ND | ND | 0.38 ± 0.02 i | 0.97 ± 0.04 j | ND | ND | ND | 3.53 ± 0.21 h | 3.51 ± 0.13 i | ND |
* C8:0 was detected only in chicory with the level of 0.63 ± 0.03 µg g−1dw. ND, not detected
Table 5.
Sum of mean FAMEs content ± standard deviation (SD) (µg g−1dw) in the herbal industry wastes both with and without distinction for MUFAs, PUFAs, and SFAs.
Table 5.
Sum of mean FAMEs content ± standard deviation (SD) (µg g−1dw) in the herbal industry wastes both with and without distinction for MUFAs, PUFAs, and SFAs.
| Herbal Waste | ∑ MUFAs ± SD | ∑ PUFAs ± SD | ∑ SFAs ± SD | ∑ FAMEs ± SD |
|---|---|---|---|---|
| Black cumin | 940.50 ± 18.51 | 1254.39 ± 24.34 | 609.23 ± 6.93 | 2804.11 ± 31.35 |
| Buckthorn | 533.91 ± 13.00 | 372.56 ± 8.84 | 957.11 ± 17.89 | 1863.58 ± 23.81 |
| Chamomile | 137.90 ± 3.49 | 112.93 ± 4.01 | 15.03 ± 0.38 | 265.86 ± 5.32 |
| Chicory | 451.23 ± 11.51 | 7926.68 ± 170.31 | 397.19 ± 14.99 | 8775.11 ± 171.35 |
| Couch grass | 535.51 ± 9.11 | 1707.93 ± 52.83 | 176.87 ± 4.87 | 2420.31 ± 53.83 |
| Figure tea | 1670.51 ± 37.65 | 9527.68 ± 297.09 | 407.23 ± 9.26 | 11,605.42 ± 299.61 |
| Green tea | 875.79 ± 23.17 | 790.10 ± 19.84 | 302.95 ± 13.67 | 1968.84 ± 33.43 |
| Hemp | 238.71 ± 3.02 | 78.45 ± 2.51 | 40.54 ± 0.77 | 357.70 ± 4.00 |
| Lemon balm | 568.58 ± 17.93 | 538.92 ± 15.51 | 322.12 ± 13.82 | 1429.62 ± 27.44 |
| Nettle | 1468.34 ± 48.20 | 1808.92 ± 55.80 | 1145.10 ± 31.92 | 4422.36 ± 80.35 |
| Peppermint | 676.70 ± 20.37 | 743.45 ± 24.14 | 351.23 ± 10.26 | 1771.38 ± 33.21 |
| Rye bran | 3422.87 ± 60.29 | 31,320.67 ± 908.48 | 1054.23 ± 31.41 | 35,797.77 ± 911.02 |
| Sage | 1558.14 ± 66.19 | 1188.81 ± 31.11 | 224.45 ± 8.37 | 2971.40 ± 73.62 |
| Senna | 2274.82 ± 45.39 | 1289.95 ± 44.25 | 1640.12 ± 62.96 | 5204.89 ± 89.34 |
| St. John’s wort | 3051.33 ± 125.24 | 1151.10 ± 42.09 | 279.97 ± 7.78 | 4482.40 ± 132.35 |
| Tobacco | 145.88 ± 2.33 | 108.55 ± 2.52 | 8.39 ± 0.25 | 262.82 ± 3.44 |
Table 6.
Results for the hierarchical clustering on principal components build-up on the PCA model with ten principal components (about 98.07% of explained variance). The mean of the variable (FAME) for the whole dataset (Overall mean) and in a particular cluster (Mean in a cluster), as well as the associated standard deviations and the p-value corresponding to the v-test with H0: the mean in the cluster is equal to the overall mean. The sign of thev-test indicates if the mean in the cluster is lower or greater than the overall mean. Descriptions of each cluster by quantitative variables (fatty acid types) are sorted by the values of v-test (from strongest to weakest significance in the construction of the particular cluster, i.e., the higher the positive or the lower the negative value is the better/stronger description of the cluster it has). Only variables that characterize each cluster are shown (p-value < 0.05).
| Cluster | Variable | Mean in a Cluster | Overall Mean | V-Test | p-Value |
|---|---|---|---|---|---|
| A | C20:3n6 (P) | 496.99 ± 16.51 | 32.19 ± 120.09 | 6.85 | <0.00001 |
| A | C20:4n6 (P) | 411.18 ± 18.01 | 30.74 ± 98.48 | 6.84 | <0.00001 |
| A | C22:1n9 (M) | 1066.26 ± 52.83 | 86.74 ± 259.90 | 6.67 | <0.00001 |
| A | C21:0 (S) | 18.93 ± 0.41 | 7.37 ± 9.73 | 2.10 | 0.03553 |
| B | C18:2n6t (P) | 81.46 ± 164.27 | 148.91 ± 225.24 | −2.05 | 0.04005 |
| B | C22:1n9 (M) | 3.11 ± 3.62 | 86.74 ± 259.90 | −2.21 | 0.02740 |
| B | C18:3n3 (P) | 20.30 ± 29.10 | 169.75 ± 448.87 | −2.28 | 0.02246 |
| B | C20:0 (S) | 10.09 ± 15.95 | 24.82 ± 43.26 | −2.34 | 0.01953 |
| B | C16:1 (M) | 30.92 ± 7.47 | 77.71 ± 134.45 | −2.39 | 0.01704 |
| B | C17:1 (M) | 7.80 ± 9.74 | 21.62 ± 39.10 | –2.42 | 0.01537 |
| B | C18:3n6 (P) | 277.01 ± 405.99 | 2729.09 ± 6329.10 | −2.66 | 0.00791 |
| B | C18:1n9t (M) | 127.80 ± 187.55 | 337.96 ± 516.95 | −2.79 | 0.00532 |
| B | C15:0 (S) | 0.51 ± 0.80 | 1.50 ± 2.39 | −2.85 | 0.00434 |
| B | C22:0 (S) | 10.20 ± 6.03 | 20.81 ± 25.33 | −2.87 | 0.00408 |
| B | C18:0 (S) | 17.34 ± 13.85 | 40.16 ± 53.53 | −2.92 | 0.00347 |
| B | C24:0 (S) | 36.44 ± 93.11 | 107.07 ± 165.53 | −2.93 | 0.00344 |
| B | C12:0 (S) | 0.01 ± 0.03 | 0.70 ± 1.60 | −2.93 | 0.00334 |
| B | C22:6n3 (P) | 4.53 ± 1.75 | 7.05 ± 5.91 | −2.94 | 0.00333 |
| B | C18:2n6c (P) | 161.38 ± 163.30 | 519.69 ± 800.74 | −3.07 | 0.00216 |
| B | C23:0 (S) | 4.84 ± 1.02 | 6.14 ± 2.77 | −3.21 | 0.00133 |
| B | C18:1n9c (M) | 109.99 ± 32.36 | 218.94 ± 232.00 | −3.22 | 0.00128 |
| B | C20:1 (M) | 139.87 ± 139.68 | 242.93 ± 214.27 | −3.30 | 0.00098 |
| B | C15:1 (M) | 78.28 ± 61.85 | 154.30 ± 155.48 | −3.35 | 0.00080 |
| B | C17:0 (S) | 3.58 ± 2.05 | 6.60 ± 5.74 | −3.61 | 0.00031 |
| B | C16:0 (S) | 136.10 ± 103.82 | 274.20 ± 256.80 | −3.69 | 0.00023 |
| B | C24:1n9 (M) | 2.43 ± 0.55 | 4.08 ± 3.00 | −3.76 | 0.00017 |
| B | C20:2 (P) | 2.75 ± 0.54 | 3.81 ± 1.94 | −3.76 | 0.00017 |
| B | C11:0 (S) | 0 | 0.99 ± 1.74 | −3.90 | 0.00010 |
| C | C14:1 (M) | 19.16 ± 1.03 | 15.14 ± 1.73 | 6.01 | <0.00001 |
| C | C11:0 (S) | 4.97 ± 0.53 | 0.99 ± 1.74 | 5.93 | <0.00001 |
| C | C15:0 (S) | 6.63 ± 0.76 | 1.50 ± 2.39 | 5.56 | <0.00001 |
| C | C23:0 (S) | 10.89 ± 3.59 | 6.14 ± 2.77 | 4.44 | 0.00001 |
| C | C22:0 (S) | 61.54 ± 46.41 | 20.81 ± 25.33 | 4.17 | 0.00003 |
| C | C12:0 (S) | 2.69 ± 2.70 | 0.70 ± 1.60 | 3.24 | 0.00119 |
| C | C18:2n6t (P) | 416.88 ± 392.63 | 148.91 ± 225.24 | 3.08 | 0.00205 |
| C | C24:0 (S) | 276.70 ± 248.46 | 107.07 ± 165.53 | 2.66 | 0.00792 |
| C | C24:1n9 (M) | 6.40 ± 4.18 | 4.08 ± 3.00 | 2.01 | 0.04465 |
| D | C18:1n9c (M) | 627.25 ± 292.57 | 218.94 ± 232.00 | 4.56 | 0.00001 |
| D | C18:1n9t (M) | 1206.09 ± 632.42 | 337.96 ± 516.95 | 4.35 | 0.00001 |
| D | C20:5n3 (P) | 55.20 ± 11.53 | 46.96 ± 5.83 | 3.66 | 0.00025 |
| D | C24:1n9 (M) | 7.59 ± 3.66 | 4.08 ± 3.00 | 3.04 | 0.00240 |
| D | C22:6n3 (P) | 11.83 ± 2.95 | 7.05 ± 5.91 | 2.10 | 0.03615 |
| E | C14:0 (S) | 37.53 ± 19.79 | 5.35 ± 14.25 | 5.85 | <0.00001 |
| E | C17:1 (M) | 108.64 ± 53.12 | 21.62 ± 39.10 | 5.77 | <0.00001 |
| E | C18:0 (S) | 155.22 ± 78.02 | 40.16 ± 53.53 | 5.57 | <0.00001 |
| E | C20:1 (M) | 695.19 ± 77.09 | 242.93 ± 214.27 | 5.47 | <0.00001 |
| E | C17:0 (S) | 17.87 ± 6.95 | 6.60 ± 5.74 | 5.09 | <0.00001 |
| E | C16:0 (S) | 744.01 ± 175.03 | 274.20 ± 256.80 | 4.74 | <0.00001 |
| E | C15:1 (M) | 436.51 ± 96.74 | 154.30 ± 155.48 | 4.70 | <0.00001 |
| E | C24:0 (S) | 340.61 ± 28.50 | 107.07 ± 165.53 | 3.66 | 0.00026 |
| E | C23:0 (S) | 9.22 ± 0.94 | 6.14 ± 2.77 | 2.88 | 0.00397 |
| E | C12:0 (S) | 2.27 ± 1.98 | 0.70 ± 1.60 | 2.56 | 0.01037 |
| E | C11:0 (S) | 2.55 ± 0.51 | 0.99 ± 1.74 | 2.33 | 0.01971 |
| E | C20:2 (P) | 5.49 ± 2.12 | 3.81 ± 1.94 | 2.24 | 0.02525 |
| E | C22:0 (S) | 40.40 ± 12.62 | 20.81 ± 25.33 | 2.00 | 0.04509 |
| F | C16:1 (M) | 586.29 ± 16.76 | 77.71 ± 134.45 | 6.70 | <0.00001 |
| F | C18:3n3 (P) | 1832.60 ± 44.89 | 169.75 ± 448.87 | 6.56 | <0.00001 |
| F | C18:3n6 (P) | 25,681.91 ± 733.97 | 2729.09 ± 6329.10 | 6.42 | <0.00001 |
| F | C20:0 (S) | 180.37 ± 9.61 | 24.82 ± 43.26 | 6.37 | <0.00001 |
| F | C18:2n6c (P) | 3398.81 ± 97.14 | 519.69 ± 800.74 | 6.36 | <0.00001 |
| F | C22:6n3 (P) | 27.04 ± 1.00 | 7.05 ± 5.91 | 5.99 | <0.00001 |
| F | C20:2 (P) | 9.16 ± 0.42 | 3.81 ± 1.94 | 4.89 | <0.00001 |
| F | C15:1 (M) | 475.78 ± 13.60 | 154.30 ± 155.48 | 3.66 | 0.00025 |
| F | C16:0 (S) | 798.44 ± 23.74 | 274.20 ± 256.80 | 3.61 | 0.00030 |
| F | C18:1n9c (M) | 678.91 ± 18.06 | 218.94 ± 232.00 | 3.51 | 0.00045 |
| F | C18:1n9t (M) | 1361.85 ± 38.92 | 337.96 ± 516.95 | 3.51 | 0.00045 |
| F | C15:0 (S) | 5.50 ± 0.28 | 1.50 ± 2.39 | 2.96 | 0.00307 |
| F | C24:1n9 (M) | 8.25 ± 0.20 | 4.08 ± 3.00 | 2.46 | 0.01380 |
(M)—MUFA, (P)—PUFA, (S)—SFA.
© 2020 by the authors. Licensee MDPI, Basel, Switzerland. This article is an open access article distributed under the terms and conditions of the Creative Commons Attribution (CC BY) license (http://creativecommons.org/licenses/by/4.0/).
Share and Cite
MDPI and ACS Style
Sienkiewicz, A.; Piotrowska-Niczyporuk, A.; Bajguz, A. Fatty Acid Methyl Esters from the Herbal Industry Wastes as a Potential Feedstock for Biodiesel Production. Energies 2020, 13, 3702. https://doi.org/10.3390/en13143702
AMA Style
Sienkiewicz A, Piotrowska-Niczyporuk A, Bajguz A. Fatty Acid Methyl Esters from the Herbal Industry Wastes as a Potential Feedstock for Biodiesel Production. Energies. 2020; 13(14):3702. https://doi.org/10.3390/en13143702
Chicago/Turabian StyleSienkiewicz, Aneta, Alicja Piotrowska-Niczyporuk, and Andrzej Bajguz. 2020. "Fatty Acid Methyl Esters from the Herbal Industry Wastes as a Potential Feedstock for Biodiesel Production" Energies 13, no. 14: 3702. https://doi.org/10.3390/en13143702
Note that from the first issue of 2016, this journal uses article numbers instead of page numbers. See further details here.