Trade-Offs in Net Life Cycle Energy Balance and Water Consumption in California Almond Orchards


1
Department of Civil and Environmental Engineering, University of California Davis, 1 Shields Ave, Davis, CA 95616, USA
2
Energy Systems, Energy and Efficiency Institute, University of California Davis, 1605 Tilia, Suite 100, Davis, CA 95616, USA
*
Author to whom correspondence should be addressed.
Energies 2020, 13(12), 3195; https://doi.org/10.3390/en13123195
Submission received: 14 May 2020
/
Revised: 13 June 2020
/
Accepted: 15 June 2020
/
Published: 19 June 2020
(This article belongs to the Special Issue Life Cycle Assessment and Related Systems-Thinking Approaches for Sustainability of Energy and Water Infrastructures)
Abstract
:Perennial cropping systems, such as almond orchards and vineyards, increasingly dominate California’s agricultural landscape. In California’s leading agricultural region, the Central Valley, woody perennials comprise about half of total farmland. Woody perennial orchards produce high value food crops such as almonds, but also generate significant woody biomass which, where feasible, is used to generate biomass-derived electricity. Because of its semi-arid climate, California agriculture is heavily dependent on irrigation, which in some regions, requires energy-intensive pumping processes for both surface and groundwater. This research study explores the tradeoffs in economic, energy and water efficiency, considering the response of almond orchards to water application rates, using a life cycle basis for calculations and considering water scarcity, to reveal one part of the food-energy-water nexus. Findings indicate economic efficiency, represented by business-as-usual practices by growers, and which prioritizes almond yield, does not correspond to the lowest net-energy consumption (i.e. energy consumption minus bioenergy production). Bioenergy production follows a parabolic relationship with applied water, due to almond yield and growth response to water availability. Thus, the net energy footprint of almond production is minimized at about −45% of business-as-usual applied water, at odds with the economic demands of the almond industry that prioritize high value food production.
1. Introduction
The Central Valley (CV), California’s major agricultural growing region, consists of ancient floodplain soils from the Sacramento and San Joaquin river systems bordered by the Coastal Range to the west, and the Sierra Nevada to the east. The CV enjoys a Mediterranean climate, with mild wet winters and a long, hot summer growing season, with little precipitation. As a result, CV agricultural systems require irrigation, drawing on surface water sources stored as snowpack in the Sierra Nevada and delivered via extensive canal and aqueduct infrastructure, as well as groundwater sources recharged by winter rain (but often insufficient to balance groundwater demand). Of the CV’s 5.3 million hectares, some 2.6 million are dedicated to the agricultural production of more than 70 different crops, with 1.3 million hectares in dozens of varieties of woody perennials. The extent and diversity of this agricultural landscape renders the CV unique among global agricultural regions, especially regarding perennial fruit and nut production. This perennial cropping landscape is dominated by almond and grape—about 33% and 21% of cropland area, respectively (Figure 1) [1].
The California almond industry is particularly important on a global scale, accounting for more than 76% of global production, with 675,000 metric tons of almond kernel exported to global markets [2]. Almond (Prunus dulcis), endemic to arid regions, is highly responsive to water application in terms of yield and biomass productivity. This characteristic has been exploited in modern almond production systems, where water application is managed so as to maximize yield potential provided other limiting factors (nutrient, light, etc.) are managed correspondingly [3]. This results in very high almond kernel and biomass co-product production (kg ha−1), but only given comparably high water and input demand [4,5,6].
The demand for water has at times put the California almond industry at odds with the public perception of regional water scarcity, especially during the 2012–2016 drought [9]. The severity and duration of drought prompted a statewide conversation about water scarcity and use prioritization, and the extensive acreage and high water consumption of almond production brought significant attention to the industry and its environmental footprint. It also revealed complex relationships between water application, almond kernel yield, biomass yield and the food-energy-water (FEW) nexus in California (Figure 2). The following example illustrates this nexus and the requirement for almond growers, to consider tradeoffs among the nexus components.
During drought, winter water storage in the Sierra Nevada snowpack is significantly reduced [14], leading to reductions in surface water delivery to agriculture and energy infrastructure (hydroelectric dams), with corresponding increases in economic costs of electricity production [15] and groundwater extraction [16]. During the recent drought, increased groundwater extraction caused significant increases in water table depth, resulting in increased pumping energy demand and costs to almond growers (Figure 2). In turn, these increased costs encouraged growers to reduce water applications where possible, potentially at the cost of almond kernel and biomass productivity.
In many cases, growers made the decision to remove and replant older orchards, under the assumption that water availability would increase in the relatively near future, and reasoning that, in the meantime, fallow fields and young trees demand much less water than a mature orchard [17]. This particular example is one of many that illustrates the importance of the FEW nexus in California, which has the potential to produce economically and environmentally significant tradeoffs in the environmental impacts and resource consumption footprints of California’s perennial cropping systems.
Life cycle assessment (LCA) is widely viewed as a key framework for assessing and improving the environmental sustainability of agriculture and food systems [18,19,20,21,22], including for nuts [23,24,25] and other tree crops [26,27,28,29,30,31], and in this capacity, may be used in myriad ways, including to understand tradeoffs across different environmental impacts and life cycle stages, guide management or production processes towards environmentally preferable outcomes, or characterize the interactions between food, energy, and water supply systems [32,33,34]. However, conducting an LCA that can capture tradeoffs in perennial cropping systems requires a number of features, which are absent in previous LCA studies, including agronomic responses of the orchard agroecosystem to changes in inputs such as water and energy, as well as regionally sensitive indicators such as water scarcity metrics.
While LCA methods are broadly agreed upon and understood [35], LCA practice is subject to a number of limitations and errors, including aggregation errors over space and time. Of particular relevance to agricultural systems is the lack of spatially explicit modeling, both during the life cycle inventory (LCI—the tracking of inputs and outputs from the system), and during impact assessment (where inventory flows are converted to impact indicators). The foreground and background systems that comprise the LCI of agricultural systems are, by nature, highly sensitive to regional and local environmental conditions, market conditions, and supporting infrastructure. For irrigated agriculture in water-scarce regions, one particular and common omission in impact assessment is water scarcity-related impact methods. No previous LCAs that focus on California agroecosystems have yet incorporated water scarcity indicators into life cycle impact assessment (LCIA) calculations.
Although LCA has previously been used to assess the impacts of perennial food crops, these LCAs tended to be based on static views of inputs and yield, with uncertainty in management practice or environmental conditions addressed by statistical analyses of case studies of individual farms and/or production years [19,24,25,28,29,36]. The typical perennial cropping system LCA rarely includes regional, geospatially resolved modeling of irrigation infrastructure. Moreover, the role of woody perennial crops byproducts used for bioenergy production has typically been considered from the perspective of bioenergy infrastructure, without detailed consideration of the cropping system [20]. Where perennial cropping systems have been considered, they have focused on purpose-grown energy crops (for example, [37,38]). This can result in the inaccurate accounting of environmental impacts [29]. Thus, a responsive and spatially explicit LCA model is necessary for an accurate and comprehensive assessment of the life cycle environmental implications of the FEW nexus for perennial crops. A scalable, process-based, agronomically responsive cropping system LCA (SPARCS-LCA) model focused on sensitivity and scenario analysis in a regional cropping system context was developed and used in this study.
Key features of this model include the representation of the water-driven relationship between energy use and bioenergy feedstock production in California almond orchards, as well as the inclusion of the available water remaining (AWARE) water scarcity impact characterization method [39] for almond production and electricity generation in California. The ultimate goal of developing this enhanced model is to answer the following research question:
How does decreased and increased water application affect net life cycle energy use and water use (including water scarcity considerations) of almond production, given trade-offs in water application, orchard product yields, bioenergy production from orchard byproducts, and energy-intensive water supplies in California?
2. Materials and Methods
2.1. Model Structure and Development
The SPARCS-LCA model is based on the model framework used in previous analyses of California almond production [8,40], updated with a number of features required for a responsive and spatially explicit approach, and unique in its utilization of a flexible, spatially and temporally scalable framework for input and environmental flow analyses. (A manuscript detailing the development of SPARCS-LCA is currently under review.) The spatially resolved features germane to this analysis include extent, utilization and depth of ground and surface water resources in irrigation; feedstock demand, and the production capacity of operational biomass electricity facilities; and the extent, productivity, lifespan and age of cropping systems across the California landscape. This allows the SPARCS-LCA model to produce regionally-specific estimates of resource demand, productivity, and environmental flows and impacts in cropping systems.
Agronomic response features for almond orchards include the productivity of kernel, hull and shell [3], as well as standing biomass as a function of applied irrigation water [41]. This allows the SPARCS-LCA model to explicitly account for the effects of changes in water application on a yearly basis, and as a function of orchard age. For example, corresponding changes in biomass productivity occurring earlier in the orchard life cycle (e.g., establishment stage vs. maturity stage) have a greater effect on lifetime biomass accumulation than those occurring later.
Irrigation energy demand (Figure 2) was calculated based on groundwater depths [7], surface water delivery energy demand [42,43], the distribution of surface versus groundwater use for irrigation as estimated by the SWAP model [13], and pump efficiency and capacity data [44]. Orchard age geospatial data generated from a ground-truthed orchard dataset [45], biomass power plant capacity, feedstock demand, and operational status data [46], and almond end-of-life (EoL) biomass removal, energy feedstock value, and transport costs obtained from records provided by a cooperating agriservices firm located in the San Joaquin Valley region, were used to estimate the annual proportion of almond EoL biomass directed to electricity generation in each growing region.
2.2. System Definition and Boundaries
The orchard life cycle is analyzed in four stages: establishment (land preparation and planting), growth (increasing yield, standing biomass accumulation, and input demand), maturity (steady yield, standing biomass accumulation, and input demand), and decline (accumulated tree loss and declining yield). Varied yield, inputs and orchard management practices are considered explicitly in each individual year of the orchard life cycle. The resulting products from this production system include almond kernel, hulls (which make up some 50% of post-harvest biomass and are used for dairy rather than energy feedstock), shells, and woody biomass from tree removal at end-of-life. The functional unit of the SPARCS-LCA model is 1 kg of almond kernel at the hulling and shelling facility gate. While the SPARCS-LCA model is based on a functional unit of 1 kg of almond, understanding the FEW nexus for almond cropping systems on a system-wide level benefits from a landscape or geographic view. As such, results are reported on a per-hectare basis; which is not, strictly speaking, a functional unit, but instead, a modeling unit of analysis.
The SPARCS-LCA model, as parametrized for California almond production, is comprised of a primary input/operation table (which describes the foreground system), informed by regionally-specific orchard management data derived from literature [3,4,5,6], previous modeling efforts [8,40], and GIS calculations (e.g., spatial relationship between orchard blocks and relevant infrastructure and environmental features). The set of orchard management operations and fuel/material/chemical inputs characterized in the SPARCS-LCA model is as comprehensive as possible, including combustion emissions from pruning and other biomass management operations, as well as biomass transport from orchards and processing facilities to power plants. Each individual orchard management operation and input is described using a reference quantity, determined on a per hectare basis from literature, equipment-specific fuel consumption model results [47] and orchard demographic tables.
These demographic tables quantify orchard biomass and yield characteristics on an annual basis, by aggregating individual tree life histories from planting to removal, and are informed by a biomass accumulation model (described in previous work [8,40]), parametrized using data collected from an orchard clearing company operating in the San Joaquin Valley region. EoL biomass data (dry mass per hectare) were obtained from 60 cleared almond orchards, each of which was characterized by planting density (number of trees per hectare), canopy cover, and proportion missing trees using publically available aerial imagery. Individual tree biomass accumulation over the orchard lifespan was then calculated, based on a logarithmic curve which achieves the observed mean biomass per hectare, accounting for average planting density and missing trees, as well as the regional mean orchard lifespan.
The reference input/operation quantities are combined with reference life cycle inventory (LCI) datasets (that characterize relevant background systems) from GaBi ts, for material production, California grid electricity, gasoline and diesel fuel production, and freight transport, to reflect the changing input demands and orchard outputs in each year of the orchard life cycle. The impacts included in the results are: unweighted and scarcity-weighted freshwater consumption, bioenergy feedstock production, and net energy demand (i.e., considering life cycle energy use and generation from orchard biomass) on a mean annual basis and specific to each major growing region within California’s Central Valley and for five distinct management scenarios (Table 1).
Impact assessment is conducted using TRACI 3.1 [48] for freshwater consumption and energy use, and is supplemented with the AWARE water scarcity impact method. AWARE methodology [49] is based on the WaterGAP (water—global assessment and prognosis) hydrological model [50]. This model uses a regionally specific availability minus demand (AMD) approach (Equation (1)): the difference between available freshwater in the given region and all demands including both human water consumption (HWC) and environmental water requirements (EWR) per unit area. The AWARE characterization factor (CF) is calculated based on the inverse of the resulting AMD, normalized with world average AMD for global use, and truncated at a maximum of 100 when the AMD value is negative, resulting in AWARE100 values on a scale of 1 (global average) and 100 (maximum water stress) [49].
Equation (1) Availability minus demand equation for calculation of AWARE water scarcity characterization factor.
AWARE100 values for almond acreage in the Sacramento Valley (SV), San Joaquin Valley (SJV), and Tulare Lake (TL) hydrologic regions (Figure 1) were calculated as area-weighted mean based on, almond block data (Figure 2), from the 2018 Cropscape Data Layer [1], irrigation system-specific water use data from UC Davis almond Cost and Return Studies [4,5,6] and regional AWARE100 indicator values (Figure 3) from a WaterGAP model [33,47]. A county-based distribution of irrigation systems was obtained from California Almond Sustainability Program data, provided by the Almond Board of California [51], and aggregated by almond block area to growing region. AWARE100 values were assigned to California biomass power plants based on geographic location, relative to WaterGAP model values [50].
2.3. Scenario Analysis
A series of scenarios (Table 1) was generated to explore the effects of decreased and increased water application on the net energy use footprint of almond production, relative to a variety of baseline conditions. Five baseline scenarios were examined, with applied water varied systematically from 50% to 150% of regional expected demand in each stage of the orchard life cycle (establishment, growth, maturity, and decline), and in all stages, under the assumption that kernel and biomass yields are maximized at the baseline water application value. The first business as usual (BaU) scenario represents typical regional growing conditions, inputs, and management conditions, based on UC Davis Cost and Return study reports of typical regional orchard inputs and practices [4,5,6], as well as yield data from the County Crop Commission [52].
These regional data were also used to generate a temporally resolved ‘snapshot’ scenario (referred to as the 2018 Snapshot) of the Central Valley almond landscape, accounting for the mix of input demands, operations, and yields specific to each year of the orchard life cycle, weighted by percent of orchard area in each individual age class by region for the year 2018. The maximum bioenergy feedstock scenario uses BaU assumptions, except that 100% of EoL biomass, shells, and post-harvest biomass (twigs) were assumed to be used as an energy feedstock. Scenario four (surface water) follows the same assumptions, with the additional assumption of 100% irrigation water derived from surface sources rather than groundwater. These last two scenarios are designed to explore the effects of water application changes in orchard blocks, that either produce more bioenergy feedstock or use less energy in irrigation than the typical BaU orchard block. Bioenergy uses of biomass require the consideration of the significant water use in thermoelectric power and may present a trade-off in the water-energy nexus. As such, the fate of biomass and the water intensity of biomass power facilities must be modeled as well.
As of 2018, 20 biomass power plants (excluding landfill gas power plants and other biogas power plants) were operational, and they generated 3056 GWh of electricity, or about 1.6 percent of total electricity generation in California. In California, power plants with a generating capacity of 20 MW or larger are required to report water use, but unfortunately, this reporting is not done consistently. Table A1 in the Appendix A shows biopower plants in operation (as of March 2020) and their reported or estimated water use. For the power plants where the water use data were not available, they were estimated at 3.32 m3 per MWh, the median value for a typical biomass power plant using a tower cooling system [53].
3. Results
We find that water and energy demands vary considerably between hydrologic regions in the Central Valley, from 616–1168 scarcity-weighted Ml ha−1 yr−1 and 94–189 GJ ha−1 yr−1, respectively. Biomass productivity was less variable—ranging between 1.46 and 1.66 tonnes ha−1 yr−1, while bioenergy production varied from 28–45 GJ ha−1 yr−1. Baseline water demand for the Central Valley in aggregate (area-weighted mean) was less variable between scenarios than between regions (896–930 Ml ha−1 yr−1), but energy demand varied a great deal (86–146 GJ ha−1 yr−1) (Table 2, Figure 3).
Varying the applied irrigation water rate by plus or minus 50% produced a linear response in freshwater and scarcity-weighted freshwater consumption, but more interesting results for energy demand and bioenergy production. Energy demand was least variable under conditions of lower reliance on groundwater—here, the Sacramento Valley region and the surface water only and surface water/max bioenergy scenarios (Figure 3c). Bioenergy production exhibits a strong negative response to reduced water application, and a much weaker positive response to increased water application. This effect was more pronounced in the maximum bioenergy scenarios, and relatively constant across production regions (Figure 3d).
Analysis of orchard energy demand and bioenergy production as a function of applied water allows quantification of the elasticity of the orchard net energy footprint, in response to changes in water availability in the Central Valley. We find that energy demand increases roughly linearly with increasing water application, but that the slope of this increase is much less steep in the surface water utilization scenario (Figure 4d). Bioenergy production follows a parabolic relationship with applied water, due to the nature of the almond yield and growth response to water availability. Subtracting bioenergy production from energy demand gives the net energy footprint of the orchard system. We find that the net energy footprint of almond production is minimized at about −45% applied water in the BaU scenario (Figure 4a), moves closer to the baseline water application rate in ‘Snapshot’ and maximum bioenergy scenarios (Figure 4b,c), and is achieved at about +10% applied water in maximum bioenergy + surface water scenario (Figure 4d).
4. Discussion
The productivity of the CV agricultural economy is made possible by two major water sources: Sierra Nevada snowpack and CV aquifers. Surface water flow from the Sierra Nevada to the CV is gravity-driven, and is utilized in hydroelectric generation on its way (Figure 3). The distribution of surface water within the CV is both gravity-driven (SV, eastern SJV and TL) and pumped (western SJV and TL). Groundwater from aquifers must be pumped, but the energy demand varies significantly by location as a function of groundwater depth (Figure 2). Water delivery to almond orchards can be from any of these sources, determined by availability of a given source in a particular location, as well as economic and political factors (i.e., water rights, policy limitations) [9]. This, coupled with the high water demand of a productive almond orchard, causes the energy footprint of the almond orchard to be driven largely by the energy demand of irrigation water delivery (Figure 4).
Potential energy production from almond biomass coproducts is a function of biomass productivity, both standing and as post-harvest coproduct (shells and twigs), the proportion of biomass coproduct directed to electricity generation, and the generation efficiency of power plants utilizing almond biomass as a feedstock. In turn, biomass productivity is a function of orchard management practices, growing conditions, and inputs—especially nutrients and water. As demonstrated in Figure 4, biomass energy generation as a function of water application follows a parabolic function, derived from the yield and standing biomass production functions established by [3,41], respectively.
Assuming that the typical almond orchard in California under BaU conditions will apply water at a rate consistent with optimal economic return, any significant increase or decrease in water application—with all other inputs held constant—will tend to decrease biomass productivity and thus energy feedstock production attributable to the almond production system. The BaU assumption of optimized economic efficiency in the almond production system is based on the fact that almond yield and biomass productivity are highly responsive to increasing water application, up to a certain threshold, and then plateau and eventually decline [3,41]. Given the costs and limitations on irrigation water supply, maximum economic efficiency is reached where water is applied such that kernel yield is maximized without reaching the point of diminishing returns of yield for applied water—in other words, for irrigated orchards in regions with a high water energy footprint such as California’s Central Valley, the almond production system tends to be optimized for an economic return on investment in applied water (Figure 4a).
This analysis demonstrates that space exists in the water-scarce production landscape of California’s Central Valley to optimize almond, and potentially other perennial crop production, for maximized energy feedstock return on applied water invested (Figure 4, Table 2). Accounting for orchard co- and by-product utilization for energy feedstock as a displacement of fossil-fuel based electricity generation in the regional grid, we find that net-energy optimal scarcity-weighted water use does not necessarily match the economic-optimal water use assumed as the BaU baseline in the SPARCS-LCA model.
Figure 4 illustrates this disparity, showing that net energy use is optimal with significantly lower water application under BaU management conditions, as well as scenarios in which applied water energy demand is reduced through the use of surface water (Figure 4b), and in which biomass energy feedstock utilization is maximized (Figure 4c). Interestingly, when irrigation water energy demand is sufficiently reduced, and potential biomass utilization is maximized simultaneously, the orchard system is net energy-optimal at a water application rate significantly higher than the BaU, economically-optimal rate. These scenarios may be understood as potentially representative of various individual orchard blocks, with particular management and geographic and environmental contexts differing from the assumed statewide ‘typical’ BaU conditions.
This finding suggests that, given sufficient incentives to growers, the delivery and use of California’s freshwater supply in the perennial cropping industry of the Central Valley could be optimized towards greater net energy efficiency on a landscape scale. This would require that the ongoing closure and suspension of biomass-based energy infrastructure be curtailed and eventually reversed, either by subsidization and retrofit of existing power plants or by further development of alternative biomass energy technologies, such as gasification-pyrolysis systems. Such a development would require significant policy intervention, but could serve to support existing statewide policy goals of increased reliance on renewable over fossil energy supplies, as well as the reduction of undesirable alternative biomass disposal practices such as in-field burning, which result in serious environmental and human health burdens throughout the Central Valley.
5. Conclusions
Scenario and sensitivity analyses, combined with crop agronomic responses to applied water, highlight the conditions under which California almond production systems can be optimized for net energy efficiency, and show that optimizing for energy efficiency may represent a tradeoff with optimizing for food yield productivity.
Under BaU production conditions for biomass energy facilities and water sources (Figure 4a), almond production is net energy optimal with reduced water application rates—which can result in lower almond kernel yields. However, when the proportion of biomass coproduct directed to energy production is maximized and pumping energy consumption is minimized through the use of more surface water (Figure 4d), net energy use is minimized at higher water application rates, and correspondingly higher yields. These scenarios are meant to model potential conditions at a particular orchard, and do not imply that any particular scenario could be implemented at the scale of the whole industry.
This analysis does not account for the grower decision-making in response to resource constraints and changing economic factors. Changing costs and availability of groundwater and surface water resources will undoubtedly play a major role in the ongoing development and evolution of the perennial crop landscape in the Central Valley. Grower decisions on when to initiate orchard EoL biomass removal and what use to put the land to afterwards are driven by a complex interplay of local, regional, and global economic and environmental factors. Future work will attempt to incorporate grower decision-making, including changes to the cropping system, into the SPARCS-LCA model in order to generate more robust consequential analyses of the FEW nexus, related to the California perennial crop landscape.
Author Contributions
E.M. led Formal analysis; Visualization; and Writing—original draft. Marvinney is the primary developer of the SPARCS-LCA model. Marvinney conducted and produced text, figures and tables describing the scenario analysis, using the SPARCS-LCA model to quantify the effects of variable water application on the net energy footprint of California almond orchards presented in this study; as well as text and figures describing the FEW nexus and regional context for this study. J.W.R. contributed to Data curation and Investigation. Ro collected data on biopower plant status and water use and led the effort to map AWARE impact characterization factors in California, in addition to contributions of relevant text. A.K. contributed Funding acquisition; Supervision; and Writing—review and editing. Kendall originated the concept for this paper, served as Principle Investigator for funding that supported this work, reviewed the analysis conducted, and helped write and edit the manuscript. All authors have read and agreed to the published version of the manuscript.
Funding
This research was funded by the Almond Board of California, grant number 17.AIR8.Kendall and 18.AIR8.Kendall. Contributions by Jin Wook Ro were funded by a National Center for Sustainable Transportation & Pacific Southwest Region UTC Dissertation Grant—Spring 2019.
Conflicts of Interest
The authors declare no conflict of interest. The funders had no role in the design of the study; in the collection, analyses, or interpretation of data; in the writing of the manuscript, or in the decision to publish the results. The funder does have a contractual right to review work and provide feedback prior to submission for publication, but is not permitted to impede submission, require changes, or prevent publication.
Appendix A

Table A1.
Biomass power plant characteristics.
| Name | Gross Generation (MWh yr−1) | Reported Water Use (m3 MWh−1) | Estimated Water Use (m3 MWh−1) | Water Use (m3 yr−1) | Biomass Fuel Type * |
|---|---|---|---|---|---|
| SPI—Lincoln | 108,289 | -- | 3.324 | 359,908 | A/S |
| Burney Forest Products | 220,403 | 3.720 | -- | 819,856 | F/S |
| Merced Power | 74,997 | -- | 3.324 | 249,259 | U/A |
| Chowchilla II Biomass | 79,062 | -- | 3.324 | 262,770 | U/A |
| Collins Pine Co Project | 15,398 | -- | 3.324 | 51,177 | F/S |
| Desert View Power | 386,443 | 1.471 | -- | 568,618 | U/A |
| DG Fairhaven Power Plant | 44,702 | -- | 3.324 | 148,571 | S |
| SPI—Sonora | 33,794 | -- | 3.324 | 112,317 | A/F/S |
| HL Power Company | 209,349 | 3.779 | -- | 791,084 | F/S |
| Scotia | 153,954 | 3.589 | -- | 552,481 | F/S |
| SPI—Burney | 89,565 | -- | 3.324 | 297,677 | F/S |
| SPI—Quincy | 123,657 | -- | 3.324 | 410,985 | F/S |
| Wheelabrator Shasta | 312,613 | -- | 3.324 | 1,038,998 | U/A/F/S |
| Rio Bravo Fresno | 215,749 | 3.532 | -- | 762,088 | U/A |
| Rio Bravo Rocklin | 200,299 | 2.441 | -- | 488,889 | U/A/F/S |
| Pacific Ultrapower Chinese | 163,846 | -- | 3.324 | 544,557 | U/A/F/S |
| Wadham | 186,264 | 0.003 | -- | 548 | A |
| Woodland Biomass Power Ltd | 211,860 | -- | 3.324 | 704,136 | U/A |
| Roseburg Forest Products | 59,298 | -- | 3.324 | 197,082 | F/S |
| SPI—Anderson 2 | 166,180 | -- | 3.324 | 552,314 | A/F/S |
* U: Urban wood waste/A: Agricultural biomass/F: Forestry residues/S: Sawmill.
References
- United States Department of Agriculture National Agriculture Statistics Service (USDA NASS). CropScape—Cropland Data Layer. Available online: https://nassgeodata.gmu.edu/CropScape/ (accessed on 18 September 2019).
- United States Department of Agriculture Foreign Agricultural Service (USDA FAS). Tree Nuts: World Markets and Trade. Washington, DC, USA; 2017. Available online: downloads.usda.library.cornell.edu/usda-esmis/files/tm70mv16z/2b88qc65d/f4752h181/treenutwm-02-17-2017.pdf (accessed on 15 June 2020).
- Goldhamer, D.A.; Fereres, E. Establishing an almond water production function for California using long term yield response to variable irrigation. Irrig. Sci. 2017, 35, 169–179. [Google Scholar] [CrossRef]
- Pope, K.S.; Lightle, D.M.; Buchner, R.P.; Niederholzer, F.; Klonsky, K.; Sumner, D.A.; Gutierrez, C.A. Sample Costs to Establish an Orchard and Produce Almonds: Sacramento Valley Micro-Sprinkler Irrigation; University of California Cooperative Extension: Davis, CA, USA, 2016. [Google Scholar]
- Yaghmour, M.; Haviland, D.R.; Fichtner, E.J.; Sanden, B.L.; Viveros, M.; Sumner, D.A.; Stewart, D.; Culumber, M. Sample Costs to Establish an Orchard and Produce Almonds: San Joaquin Valley South Double-Line Drip Irrigation; University of California Cooperative Extension: Davis, CA, USA, 2016. [Google Scholar]
- Duncan, R.A.; Holtz, B.A.; Doll, D.A.; Klonsky, K.; Sumner, D.A.; Gutierrez, C.A.; Stewart, D.E. Sample Costs to Establish an Orchard and Produce Almonds: San Joaquin Valley North Micro Sprinkler Irrigation; University of California Cooperative Extension: Davis, CA, USA, 2016. [Google Scholar]
- California Natural Resources Agency. Open Data. Periodic Groundwater Level Measurements. Available online: https://data.cnra.ca.gov/dataset/periodic-groundwater-level-measurements (accessed on 25 November 2019).
- Kendall, A.M.; Marvinney, E.M.; Zhu, W.; Brodt, S.B. Life Cycle–based Assessment of energy use and greenhouse gas emissions in almond production, Part I: Analytical framework and baseline results. J. Ind. Ecol. 2015, 19, 1008–1018. [Google Scholar] [CrossRef]
- Wittwer, G. From Almond Shaming to Water Trading: CGE Insights into Managing California’s Drought; Centre of Policy Studies: Melbourne, VIC, Australia, 2015. [Google Scholar]
- California Energy Commission (CEC). California Electricity Data, Facts, and Statistics. California Electrical Energy Generation. Available online: www.energy.ca.gov/almanac/electricity_data/electricity_generation.html (accessed on 15 June 2020).
- University of California Agriculture and Natural Resources (UCANR). Woody Biomass Utilization. The Resource. Available online: https://ucanr.edu/sites/WoodyBiomass/Woody_Biomass_Library/The_Resource/ (accessed on 24 October 2019).
- Public Policy Institute of California (PPIC). Publications. Available online: https://www.ppic.org/publication/water-use-in-california/ (accessed on 24 October 2019).
- Medellín-Azuara, J.; Howitt, R.E.; MacEwan, D.J.; Lund, J.R. Economic impacts of climate-related changes to California agriculture. Clim. Change 2011, 109 (Suppl. 1), S387–S405. [Google Scholar] [CrossRef]
- Margulis, S.A.; Cortés, G.; Girotto, M.; Huning, L.S.; Li, D.; Durand, M. Characterizing the extreme 2015 snowpack deficit in the Sierra Nevada (USA) and the implications for drought recovery. Geophys. Res. Lett. 2016, 43, 6341–6349. [Google Scholar] [CrossRef]
- Vine, E. Adaptation of California’s electricity sector to climate change. Clim. Change 2012, 111, 75–99. [Google Scholar] [CrossRef]
- Hyles, T. The Water-Electricity Nexus in California: Drought-Induced Risk to Thermal Electricity Generation. Master’s Thesis, Humboldt State University, Arcata, CA, USA, 2017. [Google Scholar]
- Wilson, T.S.; Sleeter, B.M.; Cameron, R.D. Mediterranean California’s water use future under multiple scenarios of developed and agricultural land use change. PLoS ONE 2017, 12, E0187181. [Google Scholar] [CrossRef] [Green Version]
- Notarnicola, B.; Sala, S.; Assumpcio, A.; McLaren, S.J.; Saouter, E.; Sonesson, U. The role of life cycle assessment in supporting sustainable agri-food system: A review of the challenges. J. Clean Prod. 2017, 140, 399–409. [Google Scholar] [CrossRef]
- Poore, J.; Nemecek, T. Reducing food’s environmental impacts through producers and consumers. Science 2018, 360, 987–992. [Google Scholar] [CrossRef] [Green Version]
- Bessou, C.; Basset-Mens, C.; Tran, T.; Benoist, A. LCA applied to perennial cropping systems: A review focused on the farm stage. Int. J. Life Cycle Assess. 2012, 18, 340–361. [Google Scholar] [CrossRef] [Green Version]
- Heller, M.C.; Keoleian, G.A. Assessing the sustainability of the US food system: A life cycle perspective. Agric. Syst. 2003, 76, 1007–1041. [Google Scholar] [CrossRef]
- Heller, M.C.; Willits-Smith, A.; Meyer, R.; Keoleian, G.A.; Rose, D. Greenhouse gas emissions and energy use associated with production of individual self-selected US diets. Environ. Res. Lett. 2018, 13, 044004. [Google Scholar] [CrossRef] [PubMed]
- Bartzas, G.; Komnitsas, K. Life cycle analysis of pistachio production in Greece. Sci. Total Environ. 2017, 595, 13–24. [Google Scholar] [CrossRef] [PubMed]
- Rosa, D.; Figueiredo, F.; Castanheira, É.; Freire, F. Life-cycle assessment of fresh and frozen chestnut. J. Clean Prod. 2017, 140, 742–752. [Google Scholar] [CrossRef]
- Volpe, R.; Messineo, S.; Volpe, M.; Messineo, A. Carbon footprint of tree nuts-based consumer products. Sustainability 2015, 7, 14917–14934. [Google Scholar] [CrossRef] [Green Version]
- Bartzas, G.; Vamvuka, D.; Komnitsas, K. Comparative life cycle assessment of pistachio, almond and apple production. Inform. Proc. Agric. 2017, 4, 188–198. [Google Scholar] [CrossRef]
- Bessou, C.; Basset-Mens, C.; Latunussa, C.; Velu, A.; Heitz, H.; Vanniere, H.; Caliman, J.-P. Partial modelling of the perennial crop cycle misleads LCA results in two contrasted case studies. Int. J. Life Cycle Assess. 2016, 21, 297–310. [Google Scholar] [CrossRef]
- Giudice, A.; Mbohwa, C.; Clasadonte, M.T.; Ingrao, C. Environmental assessment of the citrus fruit production in Sicily using LCA. Ital. J. Food. Sci. 2013, 25, 202–212. [Google Scholar]
- Nicolò, B.; De Salvo, M.; Ramirez-Sanz, C.; Estruch, V.; Sanjuan, N.; Falcone, G.; Strano, A. Life cycle assessment applied to different citrus farming systems in Spain and Italy. Agroecol. Sust. Food 2018, 42, 1092–1105. [Google Scholar]
- Vinyes, E.; Asin, L.; Alegre, S.; Muñoz, P.; Boschmonart, J.; Gasol, C. Life cycle assessment of apple and peach production, distribution and consumption in Mediterranean fruit sector. J. Clean Prod. 2017, 149, 313–320. [Google Scholar] [CrossRef]
- Ingrao, C.; Matarazzo, A.; Tricase, C.; Clasadonte, M.T.; Huisingh, D. Life cycle assessment for highlighting environmental hotspots in Sicilian peach production systems. J. Clean Prod. 2015, 92, 109–120. [Google Scholar] [CrossRef]
- Lofman, D.; Petersen, M.; Bower, A. Water, energy and environment nexus: The California experience. Water Res. Dev. 2002, 18, 73–85. [Google Scholar] [CrossRef]
- Hamdy, A.; Driouech, N.; Hmid, A. The water-energy-food security nexus in the Mediterranean: Challenges and opportunities. In Proceedings of the Fifth International Scientific Agricultural Symposium, Pale, Bosnia and Herzegovina, 23–26 October 2014. [Google Scholar]
- Albrecht, T.R.; Crootof, A.; Scott, C.A. The Water-Energy-Food Nexus: A systematic review of methods for nexus assessment. Environ. Res. Lett. 2018, 13, 043002. [Google Scholar] [CrossRef]
- International Standards Organization (ISO). Environmental Management—Life Cycle Assessment—Principles and Framework. ISO/TC 207/SC 5; International Standards Organization: Geneva, Switzerland, 2016. [Google Scholar]
- Alaphilippe, A.; Boissy, J.; Simon, S.; Godard, C. Environmental impact of intensive versus semi-extensive apple orchards: Use of a specific methodological framework for Life Cycle Assessments (LCA) in perennial crops. J. Clean Prod. 2016, 127, 555–561. [Google Scholar] [CrossRef]
- Fazio, S.; Monti, A. Life cycle assessment of different bioenergy production systems including perennial and annual crops. Biomass Bioenergy 2011, 35, 4868–4878. [Google Scholar] [CrossRef]
- Monti, A.; Fazio, S.; Venturi, G. Cradle-to-farm gate life cycle assessment in perennial energy crops. Eur. J. Agron. 2009, 31, 77–84. [Google Scholar] [CrossRef]
- Water Use in Life Cycle Assessment (WULCA). AWARE: Consensus-Based Method Development to Assess Water Use in LCA. Available online: http://www.wulca-waterlca.org/aware.html (accessed on 19 October 2019).
- Marvinney, E.M.; Kendall, A.M.; Brodt, S.B. Life Cycle-based assessment of energy use and greenhouse gas emissions in almond production, Part II: Scenario and sensitivity analysis. J. Ind. Ecol. 2015, 19, 1019–1029. [Google Scholar] [CrossRef]
- Egea, G.; Nortes, P.A.; Gonzalez-Real, M.M.; Baille, A.; Domingo, R. Agronomic response and water productivity of almond trees under contrasted deficit irrigation regimes. Agric. Water Manag. 2010, 97, 171–181. [Google Scholar] [CrossRef]
- Burt, C.; Howes, D.; Wilson, G. California Agricultural Water Electrical Energy Requirements; Irrigation Training and Research Center; California Polytechnic State University: San Luis Obispo, CA, USA, 2003. [Google Scholar]
- Klein, G.; Krebs, M.; Hall, V.; O’Brien, T.; Blevins, B.B. California’s Water—Energy Relationship. Prepared in Support of the 2005 Integrated Energy Policy Report Proceeding (04-IEPR-01E); California Energy Commission: Sacramento, CA, USA, 2005. [Google Scholar]
- Goulds Water Technology. Turbine Catalog: Performance Curves. Available online: http://goulds.com/turbine-catalog/ (accessed on 24 May 2019).
- Kimmelshue, J.E.; Heilmann, M.H.; Wang, Z.; Mulder, S.; Stall, C. Almond Industry Maps: A Comprehensive, Living Map of California Almonds. Available online: https://www.almonds.com/growers/resources/crop-forecasts/tc-almond-industry-maps (accessed on 18 January 2019).
- California Air Resources Board (CARB). CARB Pollution Mapping Tool. Available online: https://ww3.arb.ca.gov/ei/tools/pollution_map/ (accessed on 7 November 2018).
- California Air Resources Board (CARB). OFF ROAD 2007; Mobile Source Emissions Inventory Program: Sacramento, CA, USA, 2007. [Google Scholar]
- United States Environmental Protection Agency (USEPA). Tool for Reduction and Assessment of Chemicals and Other Environmental Impacts (TRACI). Available online: https://www.epa.gov/chemical-research/tool-reduction-and-assessment-chemicals-and-other-environmental-impacts-traci (accessed on 20 January 2017).
- Boulay, A.-M.; Bare, J.; Benini, L.; Berger, M.; Lathuillière, M.J.; Manzardo, A.; Margni, M.; Motoshita, M.; Núñez, M.; Pastor, A.V.; et al. The WULCA consensus characterization model for water scarcity footprints: Assessing impacts of water consumption based on available water remaining (AWARE). Int. J. Life Cycle Assess. 2018, 23, 368–378. [Google Scholar] [CrossRef] [Green Version]
- Schmied, H.M.; Eisner, S.; Franz, D.; Wattenbach, M.; Portmann, F.T.; Flörke, M.; Döll, P. Sensitivity of simulated global-scale freshwater fluxes and storages to input data, hydrological model structure, human water use and calibration. Hydrol. Earth Sys. Sci. 2014, 18, 3511–3538. [Google Scholar] [CrossRef] [Green Version]
- Almond Board of California (ABC). California Almond Sustainability Program. Available online: https://www.sustainablealmondgrowing.org/ (accessed on 24 July 2019).
- United States Department of Agriculture National Agriculture Statistics Service (USDA NASS). Statistics by State. Available online: www.nass.usda.gov/Statistics_by_State/California/Publications/AgComm/index.php (accessed on 4 May 2019).
- Macknick, J.; Newmark, R.; Heath, G.; Hallett, K. Operational water consumption and withdrawal factors for electricity generating technologies: A review of existing literature. Env. Res. Lett. 2012, 7, 045802. [Google Scholar] [CrossRef]
Figure 1.
Energy demand for irrigation water delivery in the Central Valley, accounting for groundwater depth as a mean of test well measurements from 2012–2017 [7] and energy use in surface water pumping via the California Aqueduct, overlaid by almond production, biomass energy facilities and major irrigation infrastructure [8].

Figure 2.
The food-energy-water nexus in California’s Central Valley growing region. When surface water delivery is reduced, as during the 2011–2016 drought, a greater proportion of agricultural water is drawn from groundwater sources, resulting in greater energy requirements and cost to growers—potentially causing reduction in applied water and subsequent agronomic consequences. The quantity of water recharging aquifers either deliberately, or via environmental use, is uncertain, and as such, is represented by a dashed line. Value ranges represent data from wet (2006) and dry (2014) years. Almond orchards produce biomass co-products commonly used as an energy feedstock, in the form of EoL tree removals and shells from post-harvest operations. Electric grid data from [10], biomass data from [11], and water application data from [12,13].
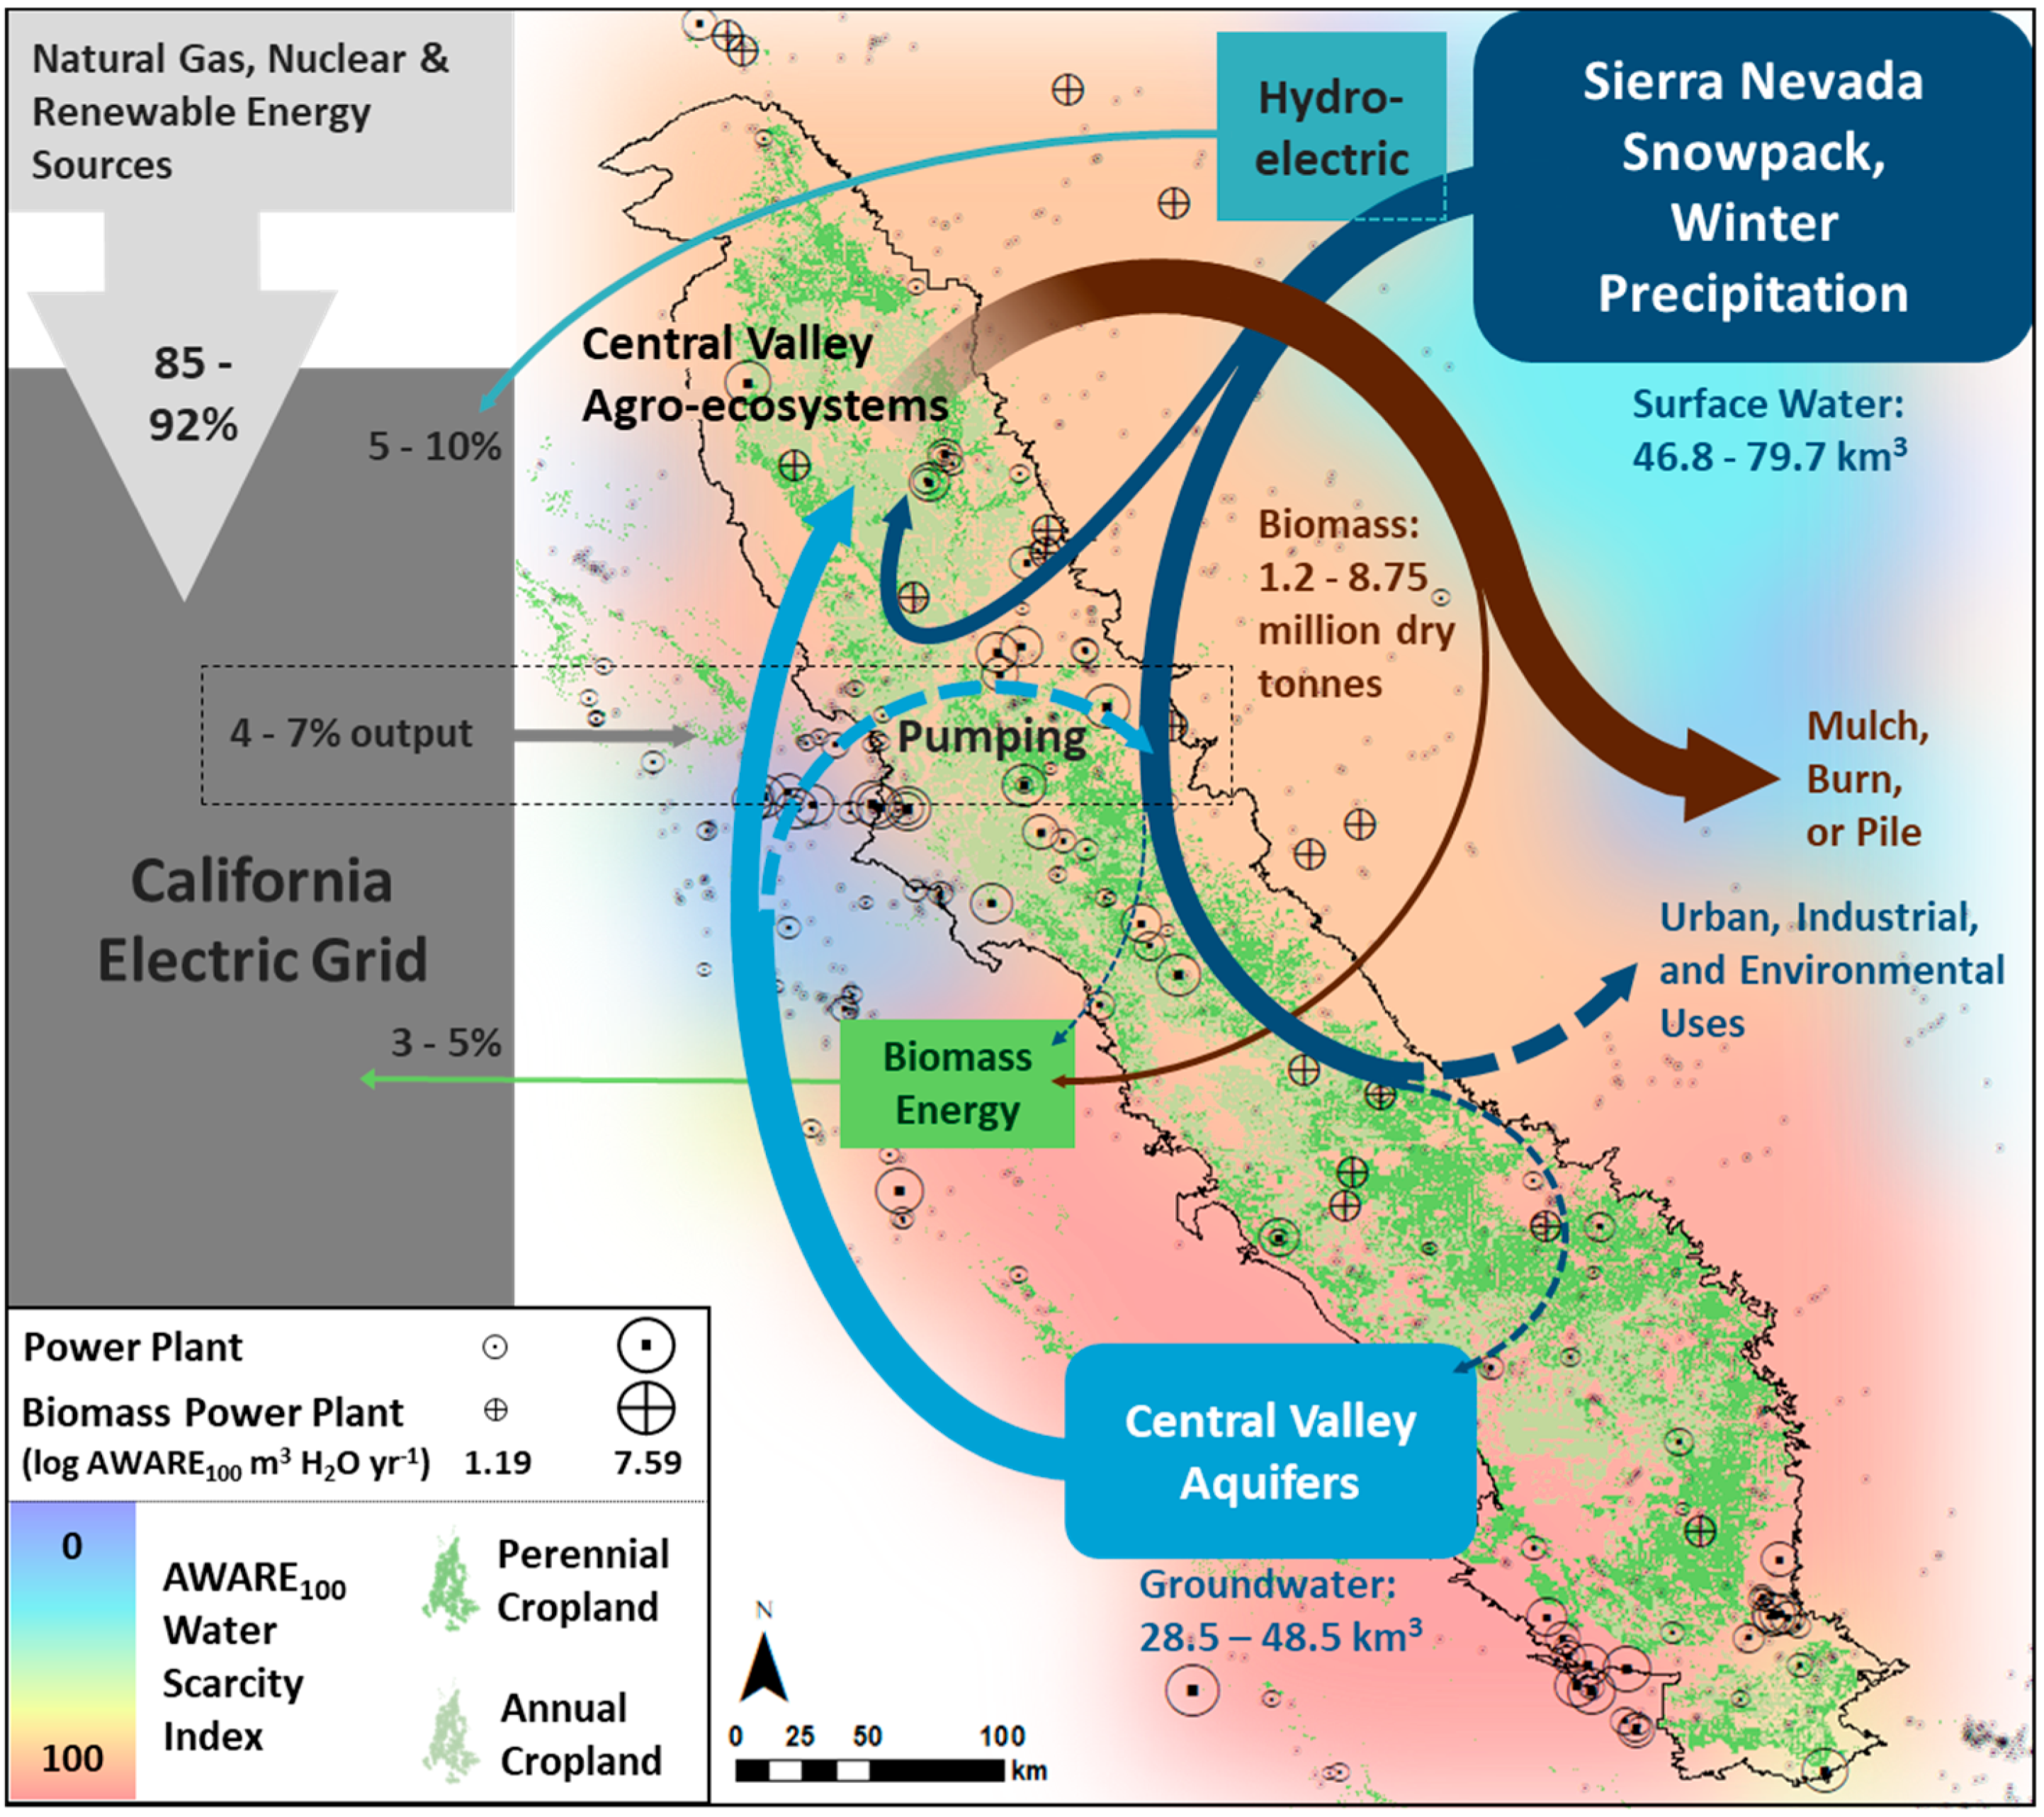
Figure 3.
Regional baseline outputs from the SPARCS-LCA model for five almond production scenarios: Business-as-Usual (BaU), which relies on regionally-specific “typical” inputs and practices; a time sensitive “snapshot” accounting for the distribution of various stages of orchard development on a regional basis; maximum utilization of orchard biomass co- and by-products for bioenergy production; use of surface water only for irrigation; and maximum bioenergy and surface water use combined. Model results are presented as (a) Freshwater consumption, (b) AWARE100 scarcity-weighted water consumption, (c) net energy consumption, and (d) biomass energy production. Error bars represent the range of output values obtained by varying applied irrigation water, plus or minus 50%. Regional (SV, SJV, and TL) results are aggregated by production area to the CV total, based on 2018 almond orchard distribution among regions: 16.8% total area in SV, 44.7% total area in SJV, and 38.3% total area in TL [1]. Freshwater use and AWARE100 water scarcity are expressed as mega-liters (Ml).

Figure 4.
Mean annual biomass energy production from almond residue, as a function of applied water under four scenarios. (a) A business-as-usual (BaU) representing a ‘typical’ almond orchard in the Central Valley, with water demand and biomass productivity area-weighted to account for regional variation. (b) An age-weighted snapshot of the Central Valley almond landscape in 2018, accounting for the regional distribution of almond acreage at different stages in the orchard life cycle and corresponding water demand, probability of orchard removal, and availability of bioenergy production as a sink for orchard biomass coproduct. (c) As in BaU scenario (b), except all biomass co-product is directed to bioenergy production. (d) As in Bioenergy scenario (c), except irrigation water is obtained from surface sources, reducing pumping energy demand.

Table 1.
Descriptions of modeling scenarios used to generate baseline results.
| Baseline Scenario | Description |
|---|---|
| Business-as-Usual (BaU) | Almond orchard water use, irrigation energy demand, and biomass energy feedstock production/utilization parameters represent estimates of typical regional practices and infrastructure conditions [4,5,6,51]. |
| 2018 Time-Sensitive Snapshot | Orchard planting date distribution data [42] is used to weight orchard water use, energy demand, and biomass energy feedstock production/utilization by orchard age in year 2018. |
| Maximum Bioenergy Feedstock | As in BaU scenario, except 100% of almond biomass co-product is assumed to be utilized for energy production. |
| Surface Water Only | As in BaU scenario, except 100% of irrigation water is assumed to be delivered via regional surface water sources. |
| Maximum Bioenergy + Surface Water | As in BaU scenario, 100% of almond biomass co-product is assumed to be utilized for energy production and 100% of irrigation water is assumed to be delivered via regional surface water sources. |
Table 2.
Regional scenario baseline results.
| Region | Baseline Scenario | Freshwater Use (Ml ha−1 yr−1) | Available Water (AWARE)100 Water Scarcity (Ml ha−1 yr−1) | Energy Use (GJ ha−1 yr−1) | Biomass Production (tonne ha−1 yr−1) | Biomass Electricity Production (GJ ha−1 yr−1) |
|---|---|---|---|---|---|---|
| Central Valley Aggregate Mean | BaU | 11.53 | 895.95 | 138.1 | 1.76 | 34.5 |
| 2018 Time-Sensitive Snapshot | 11.95 | 930.78 | 121.6 | 1.50 | 26.1 | |
| Maximum Bioenergy Feedstock | 11.51 | 895.94 | 149.5 | 4.78 | 88.3 | |
| Surface Water Only | 11.51 | 895.94 | 85.6 | 1.76 | 34.5 | |
| Max Bioenergy + Surface Water | 11.50 | 895.93 | 97.0 | 4.78 | 88.3 | |
| San Joaquin Valley | BaU | 9.69 | 686.18 | 94.5 | 2.01 | 45.0 |
| 2018 Time-Sensitive Snapshot | 9.68 | 686.04 | 51.4 | 1.59 | 32.2 | |
| Maximum Bioenergy Feedstock | 9.68 | 686.17 | 100.8 | 4.40 | 80.5 | |
| Surface Water Only | 9.68 | 686.18 | 66.5 | 2.01 | 45.0 | |
| Max Bioenergy + Surface Water | 9.67 | 686.17 | 72.8 | 4.40 | 80.5 | |
| Tulare Lake | BaU | 14.13 | 1178.22 | 189.4 | 1.66 | 27.7 |
| 2018 Time-Sensitive Snapshot | 14.96 | 1247.51 | 192.4 | 1.49 | 22.8 | |
| Maximum Bioenergy Feedstock | 14.11 | 1178.21 | 205.3 | 5.23 | 97.5 | |
| Surface Water Only | 14.11 | 1178.20 | 100.8 | 1.66 | 27.7 | |
| Max Bioenergy + Surface Water | 14.09 | 1178.19 | 116.7 | 5.23 | 97.5 | |
| Sacramento Valley | BaU | 8.71 | 616.46 | 100.7 | 1.46 | 27.7 |
| 2018 Time-Sensitive Snapshot | 9.04 | 640.04 | 94.1 | 1.24 | 20.7 | |
| Maximum Bioenergy Feedstock | 8.69 | 616.44 | 112.0 | 4.43 | 81.3 | |
| Surface Water Only | 8.70 | 616.45 | 89.9 | 1.46 | 27.7 | |
| Max Bioenergy + Surface Water | 8.69 | 616.44 | 101.1 | 4.43 | 81.3 |
© 2020 by the authors. Licensee MDPI, Basel, Switzerland. This article is an open access article distributed under the terms and conditions of the Creative Commons Attribution (CC BY) license (http://creativecommons.org/licenses/by/4.0/).
Share and Cite
MDPI and ACS Style
Marvinney, E.; Ro, J.W.; Kendall, A. Trade-Offs in Net Life Cycle Energy Balance and Water Consumption in California Almond Orchards. Energies 2020, 13, 3195. https://doi.org/10.3390/en13123195
AMA Style
Marvinney E, Ro JW, Kendall A. Trade-Offs in Net Life Cycle Energy Balance and Water Consumption in California Almond Orchards. Energies. 2020; 13(12):3195. https://doi.org/10.3390/en13123195
Chicago/Turabian StyleMarvinney, Elias, Jin Wook Ro, and Alissa Kendall. 2020. "Trade-Offs in Net Life Cycle Energy Balance and Water Consumption in California Almond Orchards" Energies 13, no. 12: 3195. https://doi.org/10.3390/en13123195
Note that from the first issue of 2016, this journal uses article numbers instead of page numbers. See further details here.