Connecting Parking Facilities to the Electric Grid: A Vehicle-to-Grid Feasibility Study in a Railway Station’s Car Park


1
Department of Energy, Politecnico di Milano, via La Masa, 34–20156 Milan, Italy
2
CanmetENERGY Research Centre, Natural Resources Canada, 1 Haanel Drive, Ottawa, ON K1A 1M1, Canada
*
Authors to whom correspondence should be addressed.
Energies 2020, 13(12), 3083; https://doi.org/10.3390/en13123083
Submission received: 24 March 2020
/
Revised: 6 June 2020
/
Accepted: 9 June 2020
/
Published: 15 June 2020
(This article belongs to the Special Issue Modeling and Simulation of Electricity Systems for Transport and Energy Storage)
Abstract
:This study evaluates the impact of energy on the distribution network at the point of connection of an electric plant of a railway car parking facility in which charging points for electric vehicles (EVs) were installed. The objective is to identify a possible load curve of the simulated car park and, based on the principle of vehicle-to-grid (V2G) technology, to develop an appropriate algorithm. Such an algorithm explores the possibility of a two-way energy flow between the connected vehicles and the electricity grid, and performs a peak shaving of the load curve of the plant under examination in order to avoid absorption peaks, which are usually difficult to manage when using the distribution system operator (DSO). The work also presents the coupling with a photovoltaic system designed specifically for the car park. The study results are presented after a summary of the current state of development of electric mobility, describing the various types of EVs, the charging infrastructure, and the possible applications in smart grids (SGs).

1. Introduction
Electric mobility represents a necessary transition to extricate from a mode of transport that depends on the use of harmful fossil fuels, of which emissions into the environment make living in urban centers increasingly hazardous. Electric mobility, being one of the branches of “smart mobility”, is therefore a part of a pillar of “smart cities”, which are a congregation of urban planning strategies and plans aimed at ensuring sustainable economic development and a high quality of life through a skillful management of available resources (food, mining, energy, services, etc.) [1,2].
However, it would be reductive to limit “smart nobility” by merely switching from a type of transport with an internal combustion engine to one with an electric motor. The reality is that “smart mobility” is a much broader concept involving different stakeholders (public administrations, private/public or mixed companies, end users, etc.) and technologies/services (car sharing, autonomous driving, trip planning apps, etc.). A comprehensive review is outside the scope of this study, which deals instead with the concept of vehicle-to-grid (V2G), as previously mentioned. Nowadays, in reality, the concept of the electric vehicle (EVs) is still of the “passive” type, of the grid-to-vehicle type (G2V), conceived to mere electric load. However, this paradigm could be destined to change in the immediate future. The idea of V2G fits into the more general concept of the “smart grid” (SG).
The current electrical system originated at the start of the 20th century and was conceived as an exclusively unidirectional system [3,4].
Going back in time, debates about the desirability of migrating to electric mobility commenced at the end of the 19th century. Even before problems associated with fossil fuel use in transportation began to manifest, a jury announced its introduction in 1898, following a contest in which several prototypes of cars (both electric and with an internal combustion engine) were presented.
Indeed, the early 1900s witnessed the evolution of this unique electricity-powered mode of transportation [5,6,7]. Electric cars seemed preferable to petrol cars, which were noisy, had annoying vibrations and smoky exhausts with attendant risks of fire and explosion. Furthermore, the manual gearbox and cranking made them difficult to use. Although the first electric cars could only cover minimal distances of 80–90 km, this did not constitute a problem since the movements at the time were confined to domestic destinations, at least in the initial phase. However, that mild status seemed destined for change following the massive production of the famous T model of Tesla, a reduction in oil price, and improvements in road networks, which enabled greater distances to be covered. An alternative method of transport with an internal combustion engine became a necessity [8,9,10].
All these factors contributed to a change in direction towards fossil fuel mobility, which became predominant throughout the 20th century up to the present day. The oil crisis of the 1970s and the resultant economic crisis, however, highlighted the vulnerability of an economic system that depended heavily on fossil fuels, which, in addition to their obvious limitation of heavily polluting the environment, tended to be found predominantly in regions that were plagued with profound political instability. The crisis prompted world governments to radically modify their assets with the aim of reducing the West’s dependency on Middle Eastern oil sources. This would be accomplished by reduced consumption, the reorganization of industrial production, and a search for alternative energy sources. The crisis clearly also involved the transport sector, and the migration to an electric transport mode—which, until then, had been confined to specific applications—began to attract considerable interest again [11,12].
As stated in the introduction to this paper, it is still premature to talk about an “electrical revolution”. However, the subject of environmental protection is increasingly topical, and coupled with the reality that fossil fuels will likely become a rare resource, thus, the switch to an alternative in the form of electrical mobility has become a topic of considerable debate over the last ten years.
As stated in [1], regarding the current Europe panorama, the transportation sector occupies the fourth place as one of the largest emitters of greenhouse gases with a share of 14%. Increased use of electric mobility would certainly reduce this proportion and mitigate the critical problem of pollution in urban centers. Despite the initial problems and criticalities linked to the migration from thermal to electric mobility, a multigovernmental initiative known as the Electric Vehicles Initiative (EVI) was inaugurated in 2009 to accelerate and control the deployment of EVs worldwide [13]. Another recent initiative proposed by the EVI is the EV30@30 [2] Campaign, which was launched at the Eighth Clean Energy Ministerial in 2017 in Beijing (China). The aspirational goal of this campaign is to achieve 30% sales share for EVs by 2030. The main actions to attain this goal include the following: (i) provide support to the governments in need of policy and technical assistance; (ii) promote programs (such as the Global EV Pilot City Programme) to facilitate the exchange of experiences in the EV field, and propose the best practices for the promotion of EVs in cities; (iii) encourage public and private sector commitments for EV uptake in company and supplier fleets; (iv) support the deployment of EV chargers and track progress. In 2017, the global stock of electric passenger cars reached 3.1 million, which was a 57% increase on the number for 2016 and approximately two-thirds of the world’s electric car fleet are battery-operated electric vehicles (BEVs).
In addition to the 3.1 million passenger electric cars, there were nearly 250,000 electric light commercial vehicles (LCVs) on the road in 2017. The largest electric LCV fleet is in China (170,000 vehicles), followed by France (33,000 vehicles) and Germany (11,000 vehicles). Electric LCVs are often part of a company or government fleet. For instance, the DHL Group, which is a major logistics company, operates with the largest EV fleet in Germany with 16,000 electric vans, bicycles and tricycles. The company has also undertaken in-house development and manufacturing of its own electric vans, tricycles, and bicycles as part of this vision. Following its success in this venture, the company is now selling its EVs to third parties (mainly municipalities and other businesses).
The year 2017 recorded over one million sales of EVs worldwide, which was an increase of 50% in comparison to the previous year. Despite this, it is acknowledged that this is still a modest figure to refer to as an “electric mobility revolution”. The two leading nations in this sector are Norway and China, with different merits. China has the largest car market and nearly 580,000 electric cars were sold there in 2017. On the other hand, Norway can boast a greater market penetration of EVs, as 39% of vehicles sold in 2017 were electric.
In addition to e-mobility, it is necessary to give a brief overview of smart-mobility, which represents all the new possibilities of using the car and its interaction with the network [14]. On average, electric cars, due to their charging and autonomy characteristics, are used for their own movement and transport activities for very short periods, that is, they are in movement for just 5% of the time, while they remain stationary and therefore unused for the remaining 95% of time [15]. Given their flexible load when electric storage available, as well as the development of communication systems, it would be irrational to view them as just a regular load [16,17]. Their main function will remain in the transportation sector, but with a high potential in providing services, both to the grid and to the market [18].
The V2G mode of operation can be applied, exchanging energy in the system during critical conditions, and since electric vehicles are dispersed by nature, this increases their impact on grid regulation, facilitating the work of the network operator [19]. This application for EVs can reduce the overall costs of purchasing and maintaining storage units in the future, and reduce the need for grid upgrades, which would result in an economic benefit for the Distribution System Operator (DSO). Consumers providing this service through their vehicles, of course, should be properly compensated, with the possible creation of new markets [20,21]. However, the management of this resource is extremely complex, with some elements requiring strong regulation. Furthermore, charging and discharging the battery for V2G increases the cycles carried out, causing greater degradation to the battery. The owner must also be paid for this reason, and must be informed about the amount of the remaining charge to be sure of being able to use the vehicle after having transferred energy to the network. The fee will depend on the market price and the time in which the vehicle remains available for the service [22,23].
Finally, vehicles must communicate with the electrical system via a special connection inside the plug. From this analysis was born the idea of a full time use of electric vehicles, using them not only for traditional activities but also as energy accumulators. In the energy management process, the role played by storage systems is certainly complementary to renewable generation and contributes in giving stability to the network, both as a quick response to the required needs and as a reduction in power fluctuations related to renewable energy generation produced by other sources, such as photovoltaics and wind [24,25].
The latter, in fact, being dependent on climatic factors and therefore not programmable, cannot provide optimal and immediate solutions to sudden requests from the network, so an efficient storage system is essential to manage the differences between production and use. By taking advantage of the charged batteries of electric cars connected to the network, it is possible to offer, in a very short period of time, an adequate response to a sudden peak in demand. If on one hand the diffusion of electric vehicles could contribute to the stability of the network by regulating the frequency and reducing the power fluctuations linked to renewable generation, on the other hand, the uncontrolled growth of electric cars, not adequately supported by an expansion of the distribution network, could produce an opposite effect [26]. According to the simulations performed, the current network infrastructure has the potential to support a medium–low EV penetration (below 50%). In particular, considering the trend of the load in the tertiary sector, the effects of electric vehicles are not significant since the requests of recharge are concentrated in the morning and are not summed up to the typical afternoon peak.
In the residential area, however, the effect of electric vehicles affects the network more heavily, since the recharges are concentrated mainly in the evening, thus producing greater peaks. It is possible to make the vehicles interact with the grid at different levels with several options, such as V2H (vehicle-to-home), V2B (vehicle-to-building) and V2G. In this way, the bidirectionality of the battery is exploited to allow an energy flow from the vehicle to the network. Vehicle batteries store a lot of energy, on average about 25 kWh (but those of the latest generation reach up to 90 kWh), which correspond to about two and a half days of energy required by normal users. It is therefore a big amount of energy that can be used. Taking advantage of this capacity is not easy, and it is convenient only when large quantities of energy are involved or when many vehicles are in the same place, located together as the only source such as in parking lots, near charging stations and in residential areas during the night. V2G can be used to provide power supply at peak demand for an intervention time varying between four and six hours every day, or for ancillary services in order to occasionally supply power to support the system in case of frequency variations due to loss of generation or problems on transmission lines. In this case, these are single interventions with a limited average duration of ten minutes. Finally, regulation can also be performed in order to exchange active and reactive power to guarantee the voltage regulation of the system. The amount of operations that can be performed is very high, but they can only be performed for short time intervals of a few minutes at a time.
V2G energy transfer has been extensively investigated in various nations to mitigate fluctuating demands and supply availability changes. For instance, Perujo and Ciuffo [27] assessed the introduction of electric vehicles in the private fleet with regard to potential impact on the electricity supply and on the environment for a case study for Milan, Italy. Ekman [28] investigated the interaction between large EV fleets and high wind penetration in Denmark. Hartman et al. [29] assessed the influence of various exploitation scenarios of EVs on the German grid in 2030. Drude et al. [30] examined photovoltaics and V2G approaches for peak demand reduction in Brazilian urban regions in a smart grid environment. Similar studies were performed for other areas in the world [31,32,33,34].
Moreover, as disclosed in a literature review, several researchers have dealt with V2G and renewable energy source integration [35,36,37,38,39]; smart grid operation considering large-scale integration of EVs enabling V2G systems [40,41]; peak shaving and valley filling of power consumption using an EV parking lot [42,43]; optimization of integration of EVs in SG and EV charging stations [44,45,46,47,48,49].
As per the authors’ understanding, it appears that no V2G feasibility study or alternative form of work has been accomplished on connecting the car park of Ferrara railway station in the region of Emilia-Romagna, northern Italy, to the SG.
Therefore, considering the V2G concerns and challenges in the context of the SG described above, this study aims to evaluate the impact of energy on the distribution network at the point of connection of an electric plant of a railway car park in which some charging points for EVs were installed. Case studies are presented after an overview of peak shaving and load levelling, descriptions of the various types of EVs, the charging infrastructure and the possible applications in SGs. The objective is to identify a possible load curve of the simulated car park and, based on the principle of V2G technology, an appropriate algorithm will be developed. This algorithm will explore the possibility of a two-way energy flow between the connected vehicles and the electricity grid, and perform a peak shaving of the load curve of the plant under examination in order to avoid absorption peaks which are normally difficult to manage by the distribution system operator (DSO). The work also presents the coupling with a photovoltaic system designed specifically for the car park.
2. Overview of Peak Shaving and Load Levelling
The management of the electricity grid is very complex, since the power consumption by the users is characterized by very marked fluctuations [14,15]. Peak production by Renewable Energy Sources (RES) such as solar panels does not correspond with the peak loads of the system, so storing that energy in the electrical vehicles would be suitable for guaranteeing system adequacy, reducing the need of investments in the generation sector. In addition, the stability of the system might be endangered due to a high percentage of uncontrollable loads. The use of an electrical energy storage system according to the load levelling logic consists in the storage of energy during the low load hours of the electrical system and its subsequent supply during periods of high demand from users, as simulated in the QDSL battery model [16,17]. This operating criterion entails, above all, technical benefits, in particular by optimizing the operation of the thermal plants and the management of the electricity network, in addition to the peak shaving operation, which is useful for levelling the peaks of maximum electricity demand. Furthermore, the intervention of a storage system can satisfy the peak demand while maintaining a more homogeneous generation profile. Thermal plants, in particular those that exploit low-cost primary sources, are not designed to operate at a partial load with good efficiencies. By accumulating the surplus of electricity that they generate during periods of low demand, it is possible to allow these systems to always operate near nominal load and efficiency. The stored energy can be subsequently supplied during the hours of maximum demand by reducing the load of expensive peaking systems powered by natural gas. Higher penetration of EVs means higher electrical energy requirements, as well as bigger stress on the electrical grid. The storage systems can intervene, as previously described, to level the load curve and manage the periods of maximum demand by postponing investments on new network infrastructures and on increasing installed power (Figure 1). This operating strategy also favors the practice of energy price arbitrage. It takes advantage of the price difference of electricity that occurs between two times of the day or week to make an economic profit for the storage system. Electricity is purchased and stored when it costs little due to the low demand from users, and then it is resold during the hours when prices are higher. From an economic point of view, it is possible to affirm that energy storage systems favor the reduction and stabilization of prices in the electricity market because they release electricity production from speculation and the volatility of prices linked to fossil fuels.
3. Case Study
The location of this study is the parking lot situated adjacent to the train station. The area is marked by an intensive one-modal exchange for the presence of the railway station, bus stops and terminals, bike parking and taxi stops, as shown in Figure 2. It is expected that a new parking lot will soon be located adjacent to the railway station and will consist of 115 parking spaces, 5 of which will be equipped for charging EVs. The total area occupied will be 4300 m2.
In order to estimate the car park’s energy consumption and then derive the relative load curve, it is necessary to determine the electrical loads belonging to the parking lot. After that, a hypothetical load curve is developed in for each utility in the most unfavorable conditions from a grid absorption point of view. The fusion of the various load curves is represented by the effective parking absorption curve which will ultimately be the reference energy consumption used during the successive analysis.
3.1. Lighting Systems
Lighting for the parking lot is optimized by the provision of 18 lampposts, which run along two main panels across the entire length of the parking lot. Each lamp’s strength is 74 W, which aggregates to a total of 1.3 kW. For the most unfavorable case, December 21st was chosen because it is the shortest day of the year. It was hypothesized as a continuous operation that goes from 4:30 p.m. at 8:00 a.m. The resulting power curve is presented in Figure 3.
3.2. Entry/Exit System
The parking access points consist of an input gate and an output gate with a rated output of 650 W each. In order to realize the load curve, it was assumed that the entrance gates will be most frequently used between 6:30 a.m. and 9:00 a.m. Similarly, the second peak time was assumed to be between 4:30 p.m. and 8:30 p.m. This hypothesis is quite plausible considering that railway parking lots are mainly patronized by commuters. Thus, it can be assumed that there would be greater movement in and out of the car park’s access and exit gates within the time bands where people go to their workplaces and when they return to go home. The relative load curve is represented in Figure 4.
3.3. Video Surveillance System
The parking lot is equipped with a 24-h video surveillance system. The total number of cameras is nine; each camera absorbs a rated power of 5 W for a total absorption of 45 W. This is a very modest load when compared to the previous loads analyzed. The load curve shows a consistent, trend as indicated in Figure 5.
3.4. Technical Room
The parking area has a technical room available for use by parking operators. The main load that can be hypothesized is the air conditioning system, which is attested on a power of about 800 W. In order to factor in accessory loads, a constant absorption of 1000 W is assumed over the entire period of service of the car park. Figure 6 indicates the expected trend.
3.5. Electric Vehicle Supply Equipment
Another load to introduce is the one constituted by the EV supply equipment. The car park in question allows charging for five vehicles at a time. An uncontrolled connection of gives electric vehicles, albeit modest in number, goes to engage the distribution network. Figure 7 assumes the worst case, that is, the simultaneous presence of five EVs that require a complete recharge (substantially, from 0% to 100%) in the load peak.
3.6. Electric Vehicle
The reference car used as EV is the Nissan Leaf 2018. It was selected because that model is one of the few electric cars certified for use in V2G applications [50]. Table 1 shows some of the car’s technical characteristics. The Nissan Leaf features two charging sockets—Type 2 and CHAdeMO. The on-board charger has a rated power of 6.6 kW, while the CHAdeMO socket supports a rated output of up to 50 kW.
Concerning the effective charging power, it is important to keep in mind that the discriminant is the minimum value of the power between the supply equipment and the charger of the vehicle itself according to the following relation (Equation (1)):
with:
: rated power of recharge;
: rated power of the electrical vehicle supply equipment;
: rated input power of the electrical vehicle charger.
The maximum power absorbed by the network that will be considered is that of the electric vehicle supply equipment (EVSE), which is equal to 10.5 kW. Of the 10.5 kW, 10 kW is actually used to recharge the vehicle, while the remainder represents the losses of the charging system. Figure 8 indicates the trend of the power absorbed by the grid at three different power levels, based on standard value.
4. Analysis of the Energy Absorption of the Car Park
As seen so far, the car park under examination is equipped with a series of electrical loads, which, overall, indicates power absorption similar to that shown in Figure 9. The red dotted line represents the maximum power limit that can be absorbed by the car park’s electrical system, which stands at around 14 kW. Figure 9 shows the basic load of the car park. Now, assuming that power absorbed by electric cars is added, it will derive a load curve that is similar to that in Figure 7, which assumed the simultaneous recharge of five EVs during the first peak. However, this assumption presents a rather burdensome situation, because it requires a considerable amount of energy to be absorbed from the grid over an extensive period. This is a classic example of an uncontrolled charging without the implementation of any smart charging feature.
The relative energy consumption is shown in Figure 10. Appreciably, greater energy absorption occurs between 7.00 a.m. and 10.00 a.m. and between 5.00 p.m. and 9.00 p.m., and as a result of which, two peaks of power are derived. The daily total energy absorbed is approximately 114 kWh.
Table 2 shows a summary of the overall energy absorption at the car park when deploying a full charge of five Nissan Leaf cars for every day of the year.
5. Design of the Photovoltaic System
One of the major criticisms also giving rise to skepticism about electric mobility is that the energy to recharge this fleet of vehicles must be sourced from somewhere. This point is not trivial should fossil fuels constitute and remain the source of this much-needed energy for the recharging of vehicles. It means that the thorny problem of environmental pollution remains unresolved, and the problem is transferred to the supply chain. In fact, if one considers the tank-to-wheel transformation chain, the CO2 emissions into the atmosphere of both the EV and the Internal Combustion Engine (ICE) become equivalent.
However, the problem does not arise (or, is mitigated) if instead, the energy used came from a renewable source. Therefore, concurrently with the development and widespread use of the EVs, it is important to launch initiatives that aim at a greater diffusion of renewable energy sources [52,53]. Following from this, a photovoltaic power plant will be designed in this section in order to provide the car park’s load demand. As already described, the reference car park is the parking lot adjacent to the railway station. In this car park, the installation of three EVSEs with V2G technology was planned. Geographically, the site of interest has an azimuth of 30° towards the west, as shown in Figure 11. The optimal tilt angle of the panels was instead set at 30°.
The average daily solar radiation of this site, characteristic for each month, was obtained from [52]. From these data, the graph depicted in Figure 12 was derived.
From the solar irradiance dataset, exploiting Equation (2) [53], the associated produced power can be computed as
where:
: the output power from a single panel as a function of the solar irradiance ;
: the forecasted solar irradiance measured in W/m2 at a certain time t in a day;
: the nominal output power of the photovoltaic panel chosen;
: solar radiation in the standard environment set as 1000 W/m2;
: a certain radiation point set as 150 W/m2.
Considering that the data have been sampled at intervals of a quarter of an hour from one another, the energy can be easily obtained through Equation (3):
5.1. Photovoltaic (PV) Panel Technology
The PV panel selected for this study case is the panel NeON® 2 BiFacial. The peculiarity of this panel is its double-sided structure which is able to exploit both direct light and reflected light. It is possible to appreciate the differences between a conventional photovoltaic module and one considered with double-sided technology. The bifacial cell is designed in a symmetrical structure in order to gain additional sunlight absorption from the rear.
The panel therefore uses the Albedo effect [48]. The Albedo is an index derived from the ratio between the light incident on a surface and the corresponding reflected light. Consequently, the Albedo index can vary between 100% for perfectly reflective surfaces and 0% for perfectly absorbent surfaces.
In a context such as the one under examination, it is assumed that the surface is mostly made up of asphalt, which corresponds to an Albedo between 10% and 20%. A power gain of 5% with respect to the nominal power is therefore assumed.
5.2. PV Support Structure
The project involves the installation of specific support structures for the PV modules to allow an optimal exploitation of the available surface. The proposed structure is illustrated in Figure 13. It is a modular solution that simultaneously occupies two parking spaces and can also hold up to 9 PV panels at a time. The steel structure guarantees the best balance between lightness and strength of the structure. Evidently, the presence of the support rails, due to their shadowing, implies an inversely proportional impact on the power gain of the double-sided technology. For the present work, a gain in power of 5% will be cautiously considered.
5.3. PV Matching Panels/Inverters
The car park has 114 parking spaces. The maximum number of shelters will therefore be 57 for a total of 513 PV panels to be installed. The maximum peak power of the generation plant will therefore be equal to 200 kWp. The plant was divided into three inverters of equal size, each with a rated power of 70 kW. 171 PV panels will be connected to each inverter, which are divided into 10 parallel strings. 9 strings consist of 17 panels in series and the 10th consists of 18 panels. Table 3 presents a summary table of these data. It proceeds with the verification of correct matching string/inverter, considering the limit temperatures of +70 °C and −10 °C. The conditions are summarized in Table 3 as well.
In particular:
Therefore, after all the calculations are completed, the matching conditions are verified and are as reported in Table 4.
5.4. Producibility of the Designed PV Plant
Once the system is dimensioned, it is possible to evaluate the producibility, that is, the energy that this plant is able to generate in the calendar year. We have seen that the power generated by a single panel is given by Equation (2), which does not take into account any loss factors. Thus, in order to evaluate the actual power generated, Equation (7) must be considered:
where
: a factor including all electrical losses (cables, inverters, etc.);
: a corrective factor affecting the output power of the panels due to various causes, including the difference in thermal gradient of the modules, different shading of the modules for passing clouds, accumulation of dirt, intrinsic differences of the modules, etc.
A correction factor = 0.85 was assumed for this project. Figure 14 presents an estimate of the power supplied and the relative energy that can be produced by the PV plant.
6. Smart Charging of the Electric Vehicles
A possible algorithm for optimizing the charging process of EVs is presented. As discussed earlier in this study, the implementation of the smart charge for EVs is mandatory in order to avoid situations of dangerous overloads in the distribution network. However, the management of energy flows is only possible in a mature context that has a reliable and stable smart grid. In the following paragraph, two separate optimization algorithms, which exploit two different principles, are proposed:
“Green” algorithm: the first algorithm proposed is based on a very simple principle. Given the presence of a photovoltaic system on the site of interest, the charging of the EVs is entrusted only to this last resource. That way, their recharge does not affect the distribution network. It is easy to see that if the generation system does not work (at night, or on a cloudy day), this algorithm will no longer be valid. In this case, we must consider a different principle such as that which will be explained later.
“Peak shaving” algorithm: this algorithm is applicable regardless of the presence of a renewable resource. Based on the energy absorption in the network and the presence of the parked EVs, the controller will decide whether to extract energy from the vehicles in order to reduce the peak rate of energy absorption, or whether to recharge them. The ultimate goal is therefore to level the power peaks and obtain a load curve that is as smooth as possible.
6.1. Green Algorithm
This algorithm allows one to take advantage of the renewable resource in order to recharge the EVs. Its basic principle is illustrated in the flowchart of Figure 15 and it is structured in a manner that allows recharging only when energy comes from the photovoltaic system, otherwise the vehicles are not recharged. In this way, the recharging phase minimizes the impact on the distribution network. Let us therefore see a practical application of the “green” algorithm to the case in question. In the previous paragraphs, both the energy absorption of the car park under analysis and the photovoltaic production of the designed power plant were analyzed.
Figure 16 and Figure 17 present a comparative analysis of both. As a reference month, January was chosen because it has the lowest amount of energy produced and thus represents the most critical case. The presence of a fleet of five vehicles was also assumed. A 25% charge was set for each vehicle. In Figure 18, the orange boxes indicate the load curve of the parking lot, while the green boxes indicate the power generated by the photovoltaic system. At a glance, even considering January’s low producibility, photovoltaic production appears to effectively compensate for the parking energy demand, thus leaving a good margin of power for recharging the EVs.
Figure 18 presents the load curve before and after the energy introduced by the PV plant has been used.
Due to the residual energy produced, it is possible to recharge the fleet of vehicles in approximately 5 h, as Figure 19 indicates. The red curve shows the power used to completely recharge the fleet composed of five vehicles. This power is not absorbed by the network, but is entirely produced on site.
The green curve represents instead the residual photovoltaic energy that is still usable. From the producibility analysis carried out in the other months, it is also shown that the addition of the new electric load still leaves a good margin of unused power, which can thus be transferred to the network, for example, through the net-metering.
Alternatively, the design of a suitable energy storage system can also be assumed. In January for example, photovoltaic production provided 75% of energy needs. Instead, if we consider the most productive month, the estimated average daily reducibility would be about 0.77 MWh. If the energy needed to feed the parking lot and the EVs is subtracted, the portion of energy that can be exchanged with the network would be equal to 0.58 MWh. This amounts to nearly three times the energy actually needed.
6.2. Peak Shaving Algorithm
A different perspective to view or appraise EVs is to consider them not as a passive load, but as possible active elements of the electric network in order to explore their storage capacities. Implementation of a possible “peak shaving” algorithm is attempted in this paragraph. To do this, the energy stored in the batteries of cars connected to the EVSEs will be exploited. Based on the value of the power required by the car park’s utilities, the controller will make an evaluation of whether to take the energy required from the network, or extract it from the vehicles.
In order to have a clearer idea of the applied operating principle, let us consider the graph shown in Figure 20.
The red dashed line represents the maximum absorbable power before the protections are activated. The two dotted lines in blue, Pref1 and Pref2, represent the two control values of the algorithm. In particular, if the energy demand is higher than Pref1, then the energy is taken from the car rather than from the grid. If the requested power is below Pref1, then the cars are loaded, on the whole, with a power equal to Pref2. Naturally, the nominal power of the supply equipment must always be respected.
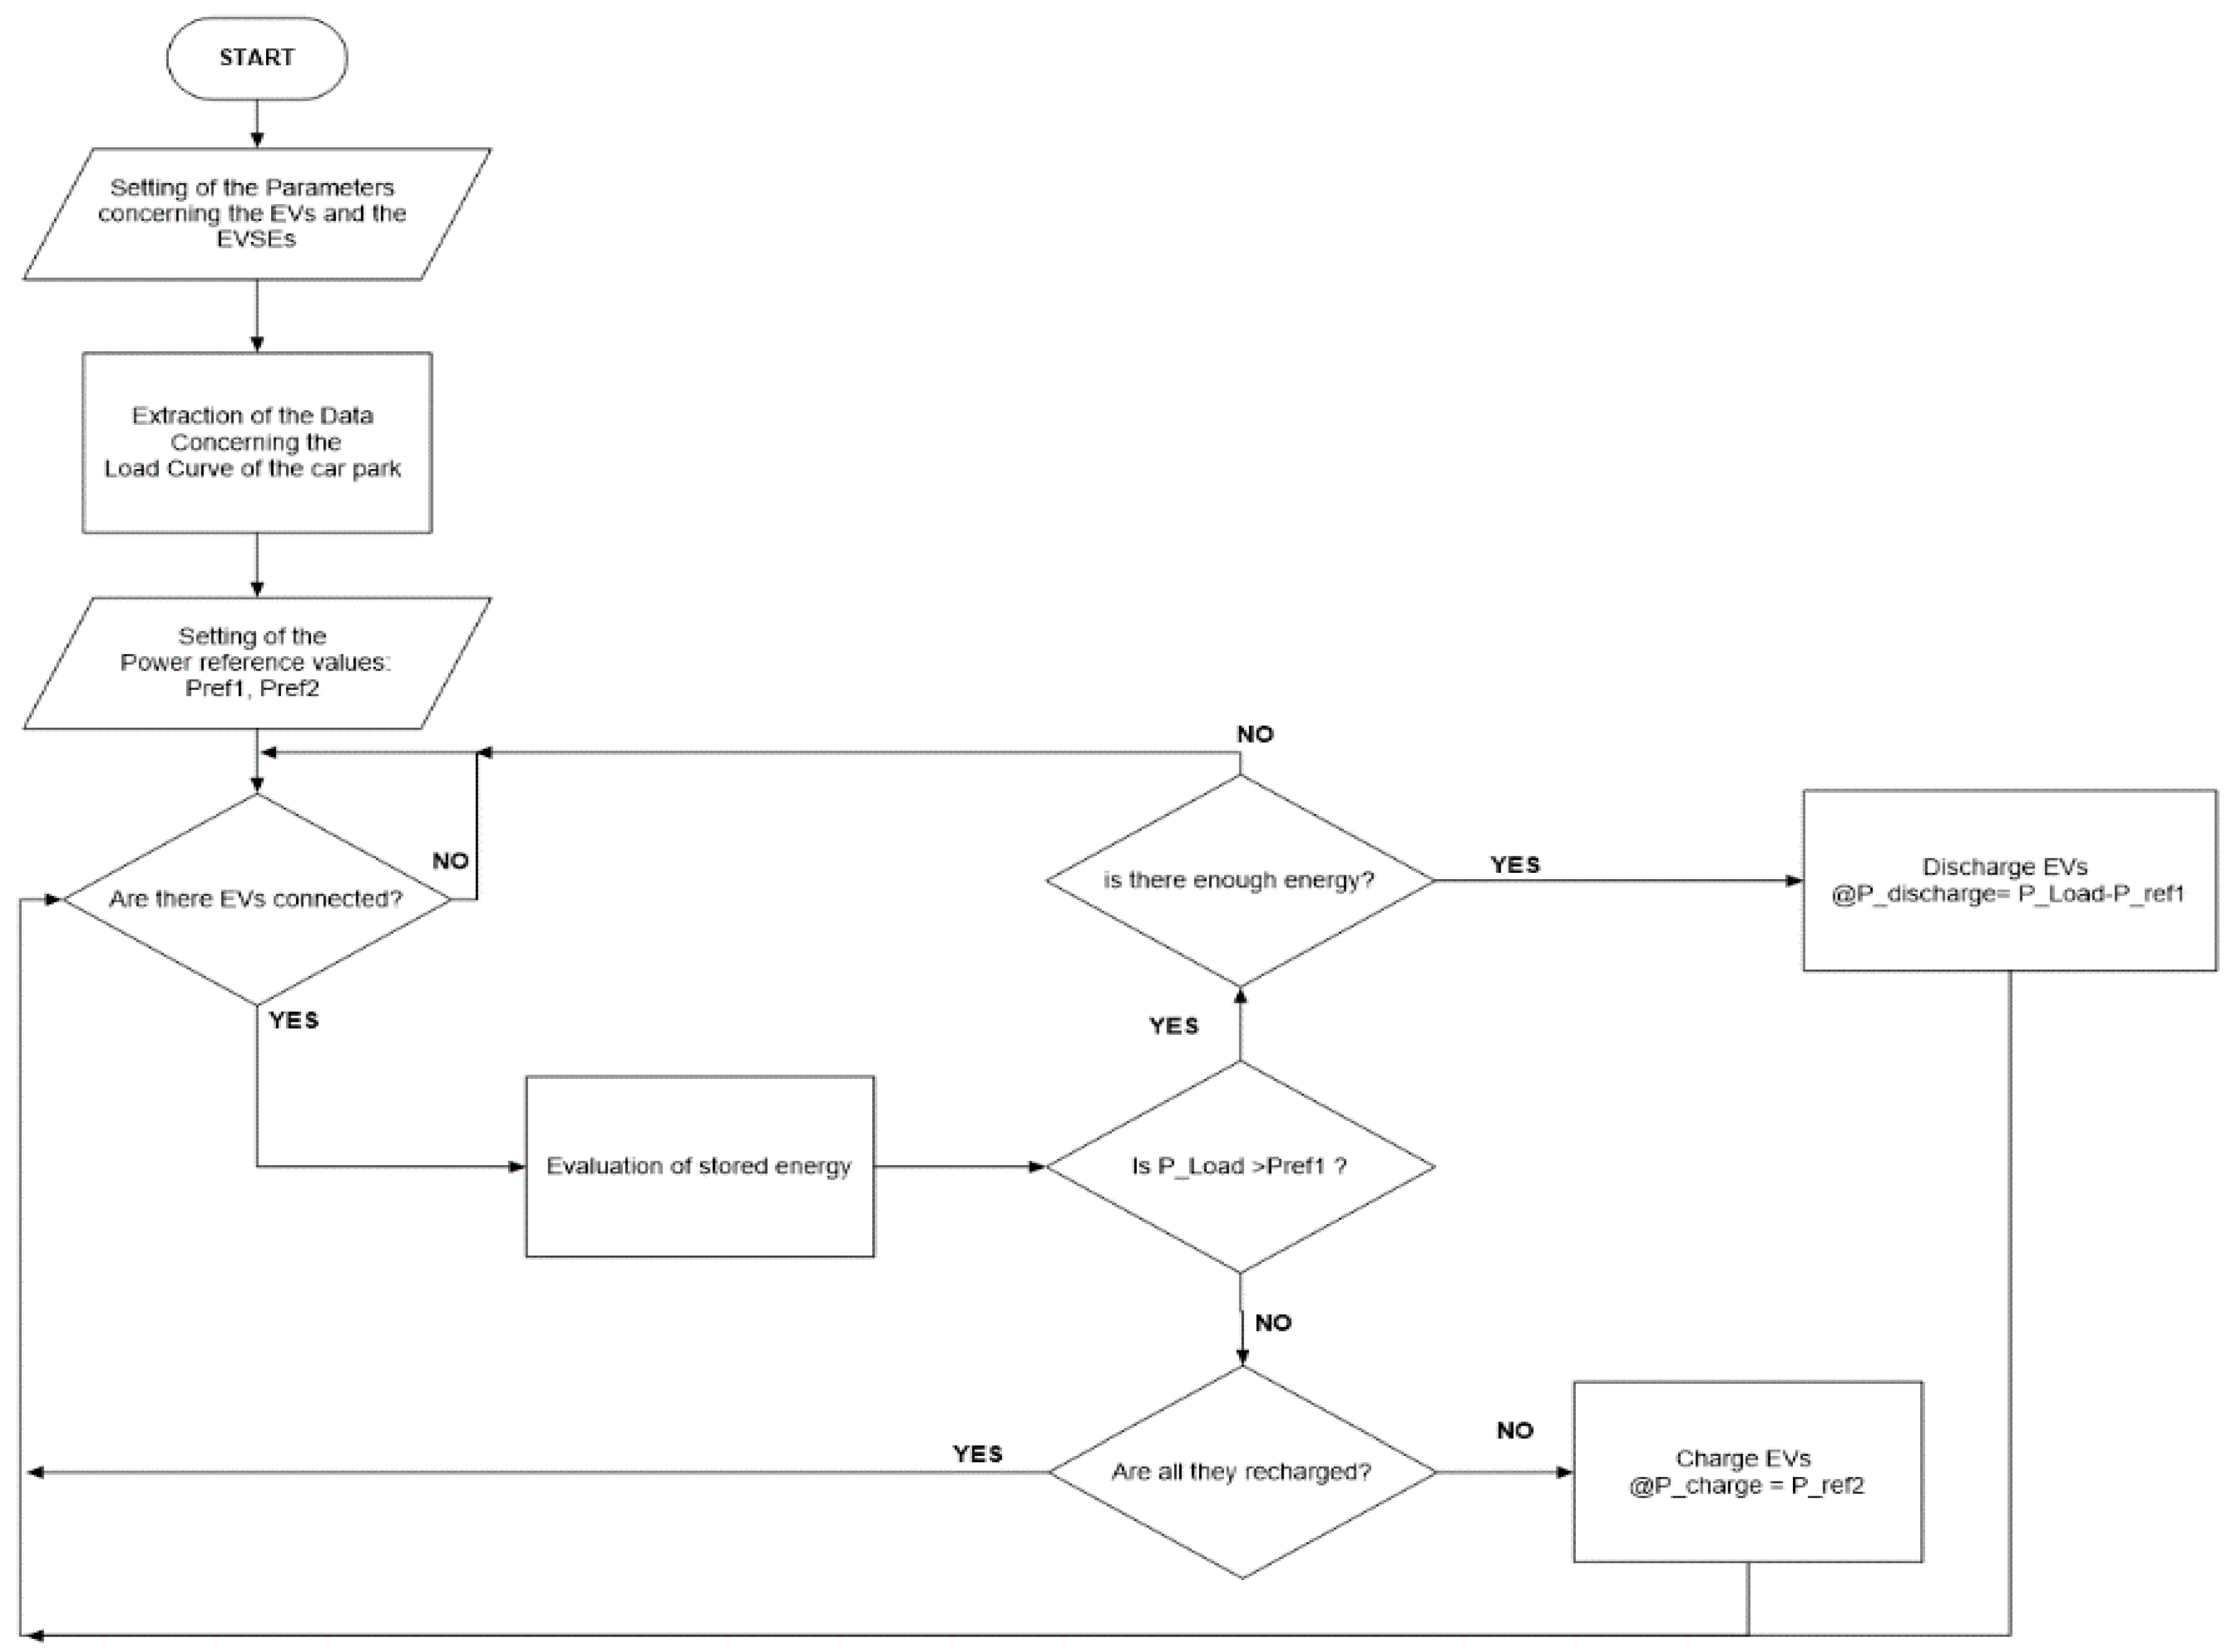
In Figure 21, it is possible to appreciate the final result of this algorithm. The dotted grey line represents the old load curve, while the red one shows the new load curve after the “peak shaving” algorithm is applied. The blocks in green represent the energy extracted from EVs to feed the parking in the phases of greater absorption, while the dotted blue line indicates the trend over time of the fleet’s State Of Charge (SOC). As noted, through this algorithm, the charging of EVs can be extended for up to 10 or 11 h. For conclusive purposes, the flowchart related to the “peak shaving” algorithm is presented in Figure 22.
7. Conclusions
During this study, an attempt was made to outline the current status and possible future trends regarding electric mobility in the most complete and concise way possible. To date, the overall use of electric vehicles is still modest, although, as we have seen, the market is likely to expand in the coming years. The increasing frequency of extreme meteorological phenomena related to climate change due to greenhouse gases, and the continuous reduction in fossil fuel deposits make it not only necessary, but a duty to migrate to a more sustainable means of transportation.
However, the unsupervised use of EVs on the roads could lead to dangerous overloads and sudden voltage drops for the distribution network, which would increase the probability of disservice. It is therefore true that, in parallel with their diffusion, it is necessary to envisage the implementation of an appropriate scheduling of the recharging process through intelligent recharging systems that are able to predict and analyze the situations of the distribution network and act accordingly.
Moreover, every new EV that is introduced into circulation also means a new load that needs electricity to recharge. Consequently, careful planning of renewable energy plants and their diffusion is also necessary in order to provide (in a manner as sustainably as possible) the huge amount of energy that these new “wheeled loads” will need.
In the second part of this study, we saw a practical application of this proposition. The electrical producibility of a photovoltaic system designed specifically for the car park of Ferrara railway station was analyzed and it was observed that not only was this plant able to supply energy for the basic load of the parking, but it also met the energy requirement for recharging the EVs. Furthermore, it leaves an additional residual energy that may be exploited through on-site exchanges. In conclusion, it may be stated that the biggest challenges facing V2G technology are those outlined below:
- From a technical point of view, the evolution of smart grids has yet to prove their robustness and reliability.
- From a technical perspective, the evolution of smart grids are yet to prove their robustness and reliability.
- From a regulatory perspective, an appropriate regulatory framework has to be defined in order to regulate the introduction of this new “active” load.
- From an economic viewpoint, in order to explore all the possible monetary advantages linked to this new paradigm, appropriate business plans need to be written alongside marketing campaigns that encourage the end user to connect their vehicles and enable operators to perform such activities described.
- Finally, from a political perspective, public administration ought to be sensitive to a change of direction towards more sustainable modes of transport. It will be very important to encourage and support these technologies, and provide appropriate planning in terms of both logistics and infrastructure.
Author Contributions
R.G. and M.L. proposed the core idea and developed the models. R.G. and M.L. performed the simulations, exported the results, and analyzed the data. W.Y. and F.F. revised the paper. M.L. and W.Y. contributed to the design of the models and the writing of the manuscript. All authors have read and agreed to the published version of the manuscript.
Funding
This research received no external funding.
Conflicts of Interest
The authors declare no conflict of interest.
References
- IEA/OECD. Global EV Outlook 2018: Towards Cross-Modal Electrification. International Energy Agency. Available online: https://webstore.iea.org/download/direct/1045?filename=global_ev_outlook_2018.pdf (accessed on 29 May 2020).
- IEA/OECD. 3030 Campaign. International Energy Agency. Available online: https://www.iea.org/media/topics/transport/3030CampaignDocumentFinal.pdf (accessed on 29 May 2020).
- Ramos, G.A.; Rios, M.A. Connection Schemes for Electric Vehicle Supply Equipment Retrieved. 2012, pp. 1–2. Available online: https://ieeexplore.ieee.org/document/6955230 (accessed on 29 May 2020).
- Qian, K.; Zhou, C.; Allan, M.; Yuan, Y. Modeling of Load Demand Due to EV Battery Charging in Distribution Systems. IEEE Trans. Power Syst. 2010, 26, 4–9. [Google Scholar] [CrossRef]
- Monteiro, V.; Pinto, J.; Afonso, J.L. Operation Modes for the Electric Vehicle in Smart Grids and Smart Homes: Present and Proposed Modes. IEEE Trans. Veh. Technol. 2016, 65, 1007–1020. [Google Scholar] [CrossRef] [Green Version]
- Gungor, V.C.; Sahin, D.; Kocak, T.; Ergut, S.; Buccella, C.; Cecati, C.; Hancke, G.P. Smart grid and smart homes, Key players and pilot projects. IEEE Ind. Electron. Mag. 2012, 6, 18–34. [Google Scholar] [CrossRef]
- Liu, C.; Chau, K.T.; Wu, D.; Gao, S. Opportunities and challenges of vehicle-to-home, vehicle-to-vehicle, and vehicle-to-grid technologies. Proc. IEEE 2013, 101, 2409–2427. [Google Scholar] [CrossRef] [Green Version]
- Habib, S.; Kamran, M. A Novel Vehicle-to-Grid Technology with Constraint Analysis-A Review. In Proceedings of the International Conference on Emerging Technologies (ICET), Islamabad, Pakistan, 8–9 December 2014. [Google Scholar]
- Uddin, K.; Dubarry, M.; Glick, M.B. The viability of vehicle-to-grid operations from a battery technology and policy perspective. Energy Policy 2018, 113, 342–347. [Google Scholar] [CrossRef]
- Berger, L.; Iniewski, K. Smart Grid, Applications, Communications and Security; Wiley: Hoboken, NJ, USA, 2012. [Google Scholar]
- Binding, C.; Gatenbain, D.; Jansen, B.; Sundostroem, O.; Andersen, P.; Marra, F.; Træholt, C. Electric Vehicle Fleet Integration in the Danish EDISON Project. Presented at 2010 IEEE Power & Energy Society General Meeting, Providence, RI, USA, 25–29 July 2010. [Google Scholar] [CrossRef] [Green Version]
- Østergaard, J.; Foosnæs, A.; Xu, Z.; Mondorf, T.; Andersen, C.; Holthusen, S.; Holm, T.; Bendtsen, M.; Behnke, K. Electric Vehicles in Power Systems with 50% Wind Power Penetration: The Danish Case and the EDISON programme. Presented at European Conference on Electricity & Mobility, Wurzbug, Germany, 26–30 July 2009. [Google Scholar]
- Surender Reddy, S.; Bijwe, P.; Abhyankar, A. Real-Time Economic Dispatch Considering Renewable Power Generation Variability and Uncertainty over Scheduling Period. IEEE Syst. J. 2015, 9, 1440–1451. [Google Scholar] [CrossRef]
- Khan, S.U.; Mehmood, K.K.; Haider, Z.M.; Bukhari, S.B.A.; Lee, S.-J.; Rafique, M.K.; Kim, C.-H. Energy Management Scheme for an EV Smart Charger V2G/G2V Application with an EV Power Allocation Technique and Voltage Regulation. Appl. Sci. 2018, 8, 648. [Google Scholar] [CrossRef] [Green Version]
- De Carne, G.; Zou, Z.; Buticchi, G.; Liserre, M.; Vournas, C. Overload Control in Smart Transformer-Fed Grid. Appl. Sci. 2017, 7, 208. [Google Scholar] [CrossRef] [Green Version]
- Haider, Z.M.; Mehmood, K.K.; Rafique, M.K.; Khan, S.U.; Lee, S.J.; Kim, C.H. Water-filling algorithm based approach for management of responsive residential loads. J. Mod. Power Syst. Clean Energy 2018, 6, 118–131. [Google Scholar] [CrossRef] [Green Version]
- Jhala, K.; Natarajan, B.; Pahwa, A.; Erickson, L. Coordinated Electric Vehicle Charging for Commercial Parking Lot with Renewable Energy Sources. Electr. Power Compon. Syst. 2017, 45, 344–353. [Google Scholar] [CrossRef]
- Mehmood, K.K.; Khan, S.U.; Lee, S.J.; Haider, Z.M.; Rafique, M.K.; Kim, C.H. Optimal sizing and allocation of battery energy storage systems with wind and solar power DGs in a distribution network for voltage regulation considering the lifespan of batteries. IET Renew. Power Gener. 2017, 11, 1305–1315. [Google Scholar] [CrossRef]
- Khosrojerdi, F.; Taheri, S.; Taheri, H.; Pouresmaeil, E. Integration of Electric Vehicles into a Smart Power Grid: A Technical Review. In Proceedings of the IEEE Electrical Power and Energy Conference (EPEC), Ottawa, ON, Canada, 12–14 October 2016. [Google Scholar]
- Knezović, K.; Martinenas, S.; Andersen, P.B.; Zecchino, A.; Marinelli, M. Enhancing the role of EVs in the grid: Field validation of multiple ancillary services provision. IEEE Trans. Transp. Electrif. 2017, 3, 201–209. [Google Scholar] [CrossRef] [Green Version]
- Project, P. Parker | Parker-Project. 2016. Available online: http://parker-project.com/ (accessed on 4 May 2020).
- Martinenas, S.; Knezovic, K.; Marinelli, M. Management of Power Quality Issues in Low Voltage Networks using Electric Vehicles: Experimental Validation. IEEE Trans. Power Deliv. 2017, 32, 971–979. [Google Scholar] [CrossRef] [Green Version]
- Parker Project. World’srst Cross-Bran d V2G Demonstration Conducted in Denmark. 2017. Available online: http://parker-project.com/wp-content/uploads/2017/11/Worlds-rst-cross-brand-V2G-demonstration-conducted-in-Denmark.pdf (accessed on 4 May 2020).
- Marinelli, M.; Martinenas, S.; Knezović, K.; Andersen, P.B. Validating a centralized approach to primary frequency control with series-produced electric vehicles. J. Energy Storage 2016, 7, 63–73. [Google Scholar] [CrossRef]
- Rezkalla, M.; Zecchino, A.; Martinenas, S.; Prostejovsky, A.M.; Marinelli, M. Comparison between Synthetic Inertia and Fast Frequency Containment Control on Single Phase EVs in a Microgrid. Appl. Energy 2018, 210, 764–775. [Google Scholar] [CrossRef] [Green Version]
- Longo, M.; Lutz, N.; Daniel, L.; Zaninelli, D.; Pruckner, M. Towards an impact study of electric vehicles on the Italian electric power system using simulation techniques. In Proceedings of the 2017 IEEE 3rd International Forum on Research and Technologies for Society and Industry (RTSI), Modena, Italy, 11–13 September 2017. [Google Scholar]
- Perujo, A.; Ciuffo, B. The introduction of electric vehicles in the private fleet: Potential impact on the electricity supply and on the environment. A case study for the Province Milan, Italy. Energy Policy 2010, 38, 4549–4561. [Google Scholar] [CrossRef]
- Ekman, C.K. On the synergy between large electric vehicle fleet and high wind penetration—An analysis of the Danish case. Renew. Energy 2011, 36, 546–553. [Google Scholar] [CrossRef]
- Hartmann, N.; Özdemir, E. Impact of different utilization scenarios of electric vehicles on the German grid in 2030. J. Power Sources 2011, 196, 2311–2318. [Google Scholar] [CrossRef]
- Brenna, M.; Corradi, A.; Foiadelli, F.; Longo, M.; Yaici, W. Numerical simulation analysis of the impact of photovoltaic systems and energy storage technologies on centralised generation: A case study for Australia. Int. J. Energy Environ. Eng. 2020, 11, 9–31. [Google Scholar] [CrossRef] [Green Version]
- Kempton, W.; Tomic, J. Vehicle-to-grid power implementation: From stabilising the grid to supporting large-scale renewable energy. J. Power Sources 2005, 144, 280–294. [Google Scholar] [CrossRef]
- Tomic, J.; Kempton, W. Using fleets of electric-drive vehicles for grid support. J. Power Sources 2007, 168, 459–468. [Google Scholar] [CrossRef]
- Sovacool, B.K.; Hirsh, R.F. Beyond batteries: An examination of the benefits and barriers to plug-in hybrid electric vehicles (PHEVs) and a vehicles-to-grid (V2G) transition. Energy Policy 2009, 37, 1095–1103. [Google Scholar] [CrossRef]
- Zhang, Q.; Tezuka, T.; Ishihara, K.N.; Mclellan, B.C. Integration of PV power into future low-carbon electricity systems with EV and HP in Kansai Area, Japan. Renew. Energy 2012, 44, 99–108. [Google Scholar] [CrossRef]
- Mwasilu, F.; Justo, J.J.; Kim, E.K.; Do, T.D.; Jung, J.W. Electric vehicles and smart grid interaction: A review on vehicle to grid and renewable energy sources integration. Renew. Sustain. Energy Rev. 2014, 34, 501–516. [Google Scholar] [CrossRef]
- Drude, L.; Junior, L.C.P.; Rüther, R. Photovoltaics (PV) and electric vehicle-to-grid (V2G) strategies for peak demand reduction in urban regions in Brazil in a smart grid environment. Renew. Energy 2014, 68, 443–451. [Google Scholar] [CrossRef]
- Habib, S.; Kamran, M.; Rashid, U. Impact analysis of vehicle-to-grid technology and charging strategies of electric vehicles on distribution networks—A review. J. Power Sources 2015, 277, 205–214. [Google Scholar] [CrossRef]
- Van der Kam, M.; van Sark, W. Smart charging of electric vehicles with photovoltaic power and vehicle-to-grid technology in a microgrid; a case study. Appl. Energy 2015, 152, 20–30. [Google Scholar] [CrossRef] [Green Version]
- Mozafar, M.R.; Amini, M.H.; Moradi, M.H. Innovative appraisement of smart grid operation considering large-scale integration of electric vehicles enabling V2G and G2V systems. Electr. Power Syst. Res. 2018, 154, 245–256. [Google Scholar] [CrossRef]
- Uddin, K.; Jackson, T.; Widanage, W.D.; Chouchelamane, G.; Marco, J. On the possibility of extending the lifetime of lithium-ion batteries through optimal V2G facilitated by an integrated vehicle and smart-grid system. Energy 2017, 13315, 710–722. [Google Scholar] [CrossRef]
- Das, H.S.; Rahman, M.M.; Li, S.; Tan, C.W. Electric vehicles standards, charging infrastructure, and impact on grid integration: A technological review. Renew. Sustain. Energy Rev. 2020, 120, 109618. [Google Scholar] [CrossRef]
- Ioakimidis, C.S.; Thomas, D.; Rycerski, P.; Genikomsakis, K.N. Peak shaving and valley filling of power consumption profile in non-residential buildings using an electric vehicle parking lot. Energy 2018, 1481, 148–158. [Google Scholar] [CrossRef]
- Zhang, L.; Jabbari, F.; Brown, T.; Samuelsen, S. Coordinating plug-in electric vehicle charging with electric grid: Valley filling and target load following. J. Power Sources 2014, 267, 584–597. [Google Scholar] [CrossRef]
- Fazelpour, F.; Vafaeipour, M.; Rahbari, O.; Rosen, M.A. Intelligent optimization to integrate a plug-in hybrid electric vehicle smart parking lot with renewable energy resources and enhance grid characteristics. Energy Convers. Manag. 2014, 77, 250–261. [Google Scholar] [CrossRef]
- Hota, A.R.; Juvvanapudi, M.; Bajpai, P. Issues and solution approaches in PHEV integration to smart grid. Renew. Sustain. Energy Rev. 2014, 30, 217–229. [Google Scholar] [CrossRef]
- Tan, K.M.; Ramachandaramurthy, V.K.; Yong, J.Y. Integration of electric vehicles in smart grid: A review on vehicle to grid technologies and optimization techniques. Renew. Sustain. Energy Rev. 2016, 53, 720–732. [Google Scholar] [CrossRef]
- Liu, J.; Zhang, T.; Zhu, J.; Ma, T. Allocation optimization of electric vehicle charging station (EVCS) considering with charging satisfaction and distributed renewables integration. Energy 2018, 164, 560–574. [Google Scholar] [CrossRef]
- Hariri, A.M.; Hashemi-Dezaki, H.; Hejazi, M.A. A novel generalized analytical reliability assessment method of smart grids including renewable and non-renewable distributed generations and plug-in hybrid electric vehicles. Reliab. Eng. Syst. Saf. 2020, 196, 106746. [Google Scholar] [CrossRef]
- Sultana, U.; Khairuddin, A.B.; Sultana, B.; Rasheed, N.; Qazi, S.H.; Malik, N.R. Placement and sizing of multiple distributed generation and battery swapping stations using grasshopper optimizer algorithm. Energy 2018, 165, 408–421. [Google Scholar] [CrossRef]
- Reuters. Nissan Leaf Gets Approval for Vehicle-To-Grid Use in Germany. 23 October 2018. Available online: https://www.reuters.com/article/us-autos-electricity-germany/nissan-leaf-approved-for-vehicle-to-grid-use-in-germany-idUSKCN1MX1AH (accessed on 26 May 2019).
- Nissan Leaf 2018. Available online: https://www-europe.nissan-cdn.net/content/dam/Nissan/gb/brochures/Vehicles/Nissan_Leaf_UK.pdfgermany/nissan-leaf-approved-for-vehicle-to-grid-use-in-germany-idUSKCN1MX1AH (accessed on 26 May 2019).
- Robalino, D.M.; Kumar, G.; Uzoechi, L.; Chukwu, U.C.; Mahajan, S.M. Design of a Docking Station for Solar Charged electric and Fuel Cell Vehicles. In Proceedings of the International Conference on Clean Electrical Power (ICCEP), Capri, Italy, 9–11 June 2009; pp. 655–660. [Google Scholar]
- Chukwu, U.C.; Mahajan, S.M. V2G Parking lot with PV Rooftop for Capacity Enhancement of a Distribution System. IEEE Trans. Sustain. Energy 2014, 5, 119–127. [Google Scholar] [CrossRef]
Figure 1.
Peak shaving and load levelling example.
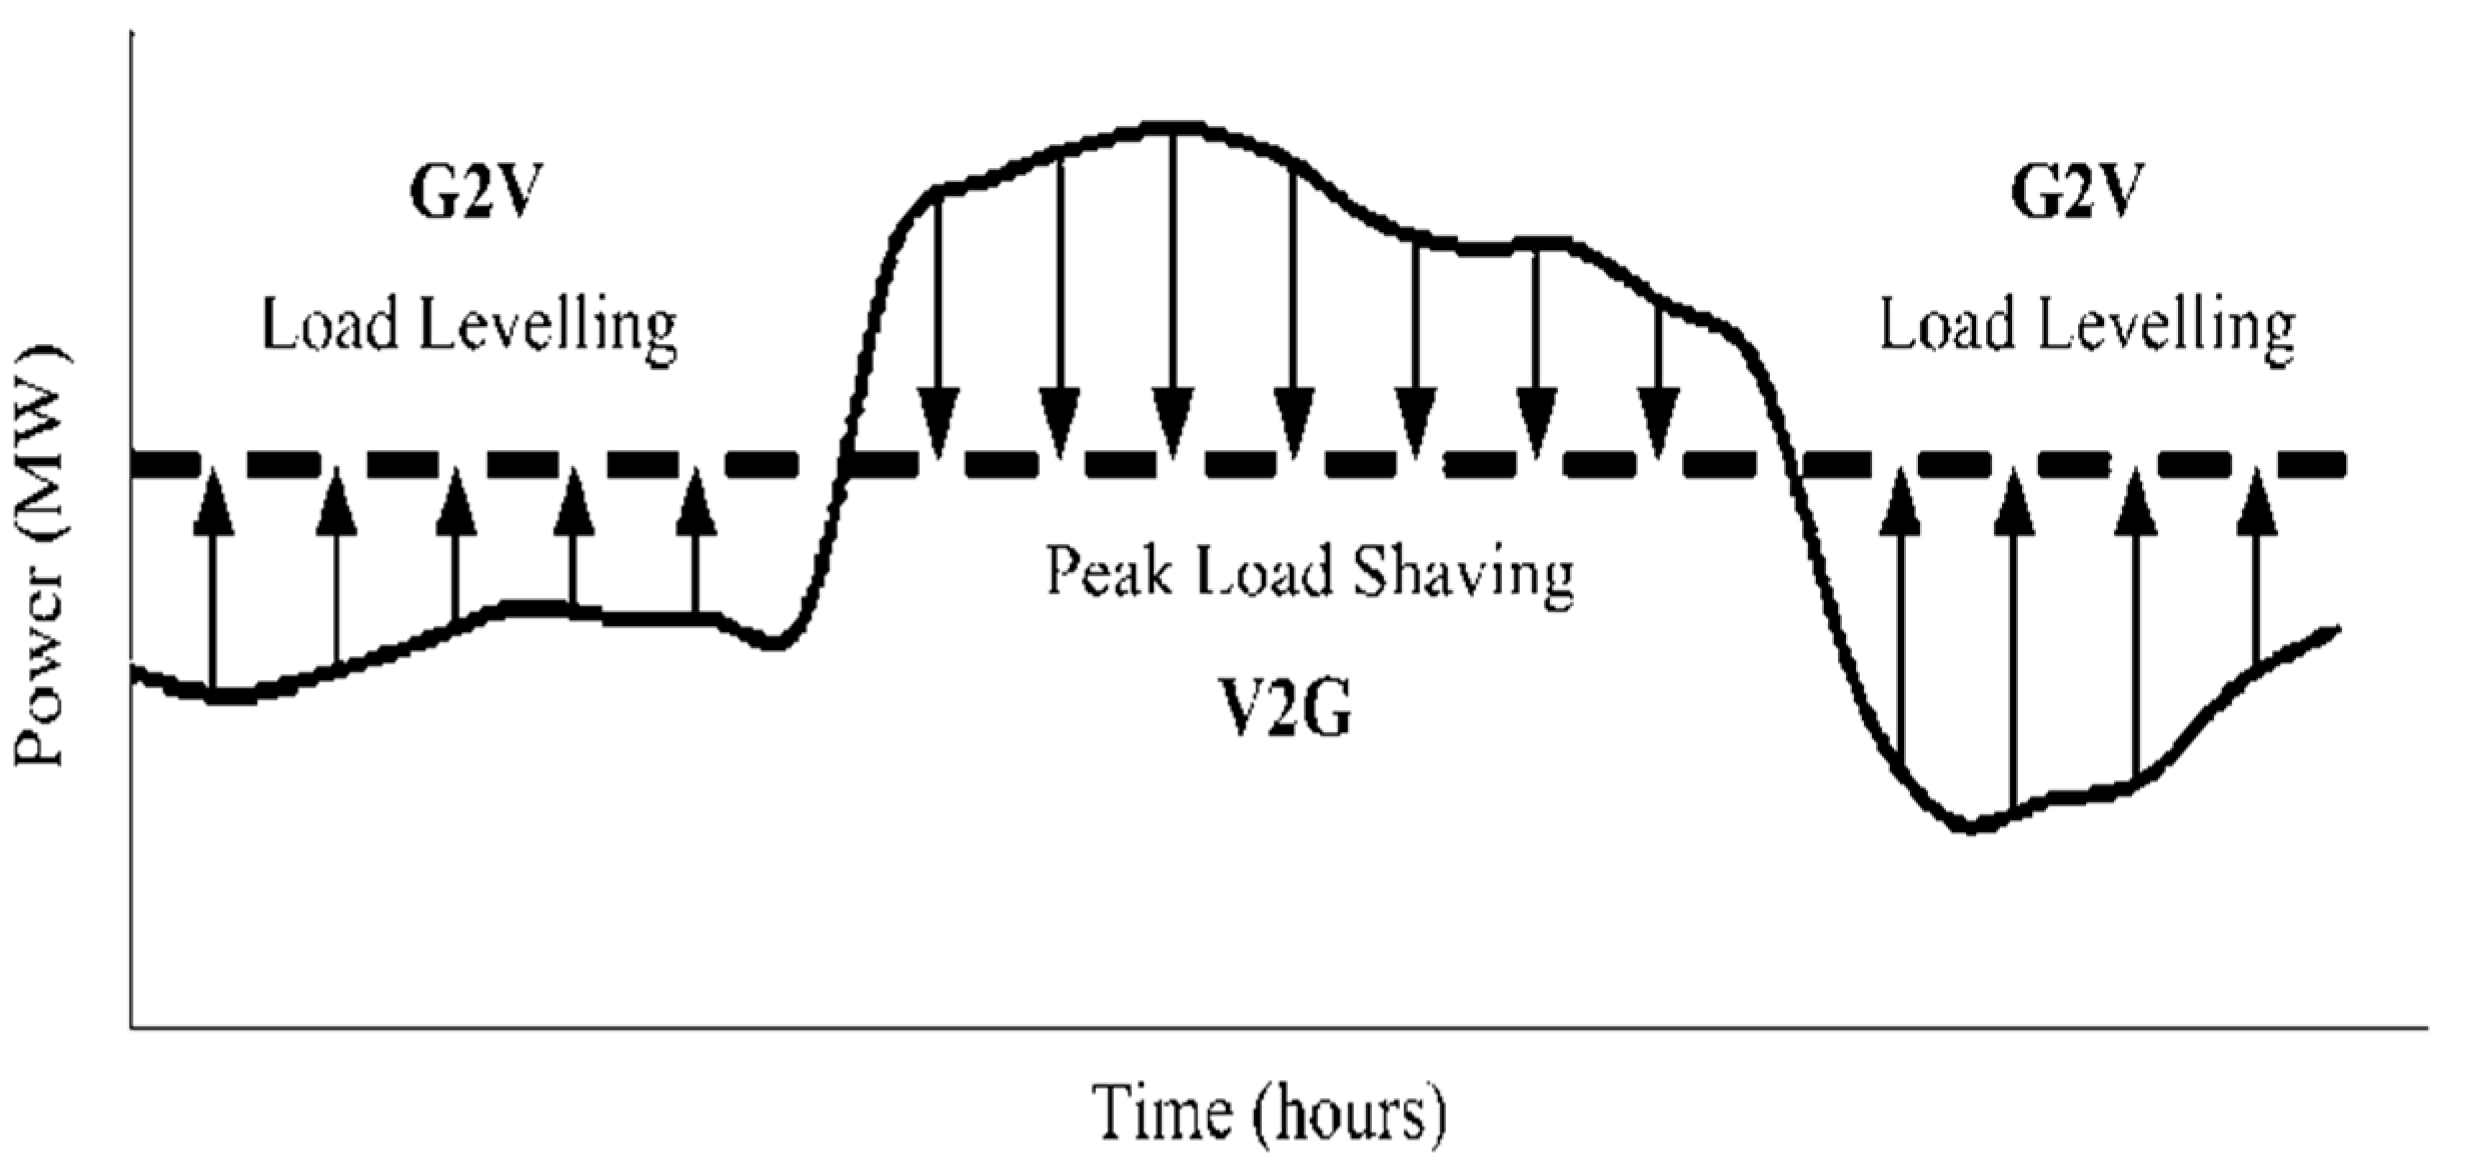
Figure 2.
Top view of the parking lot.
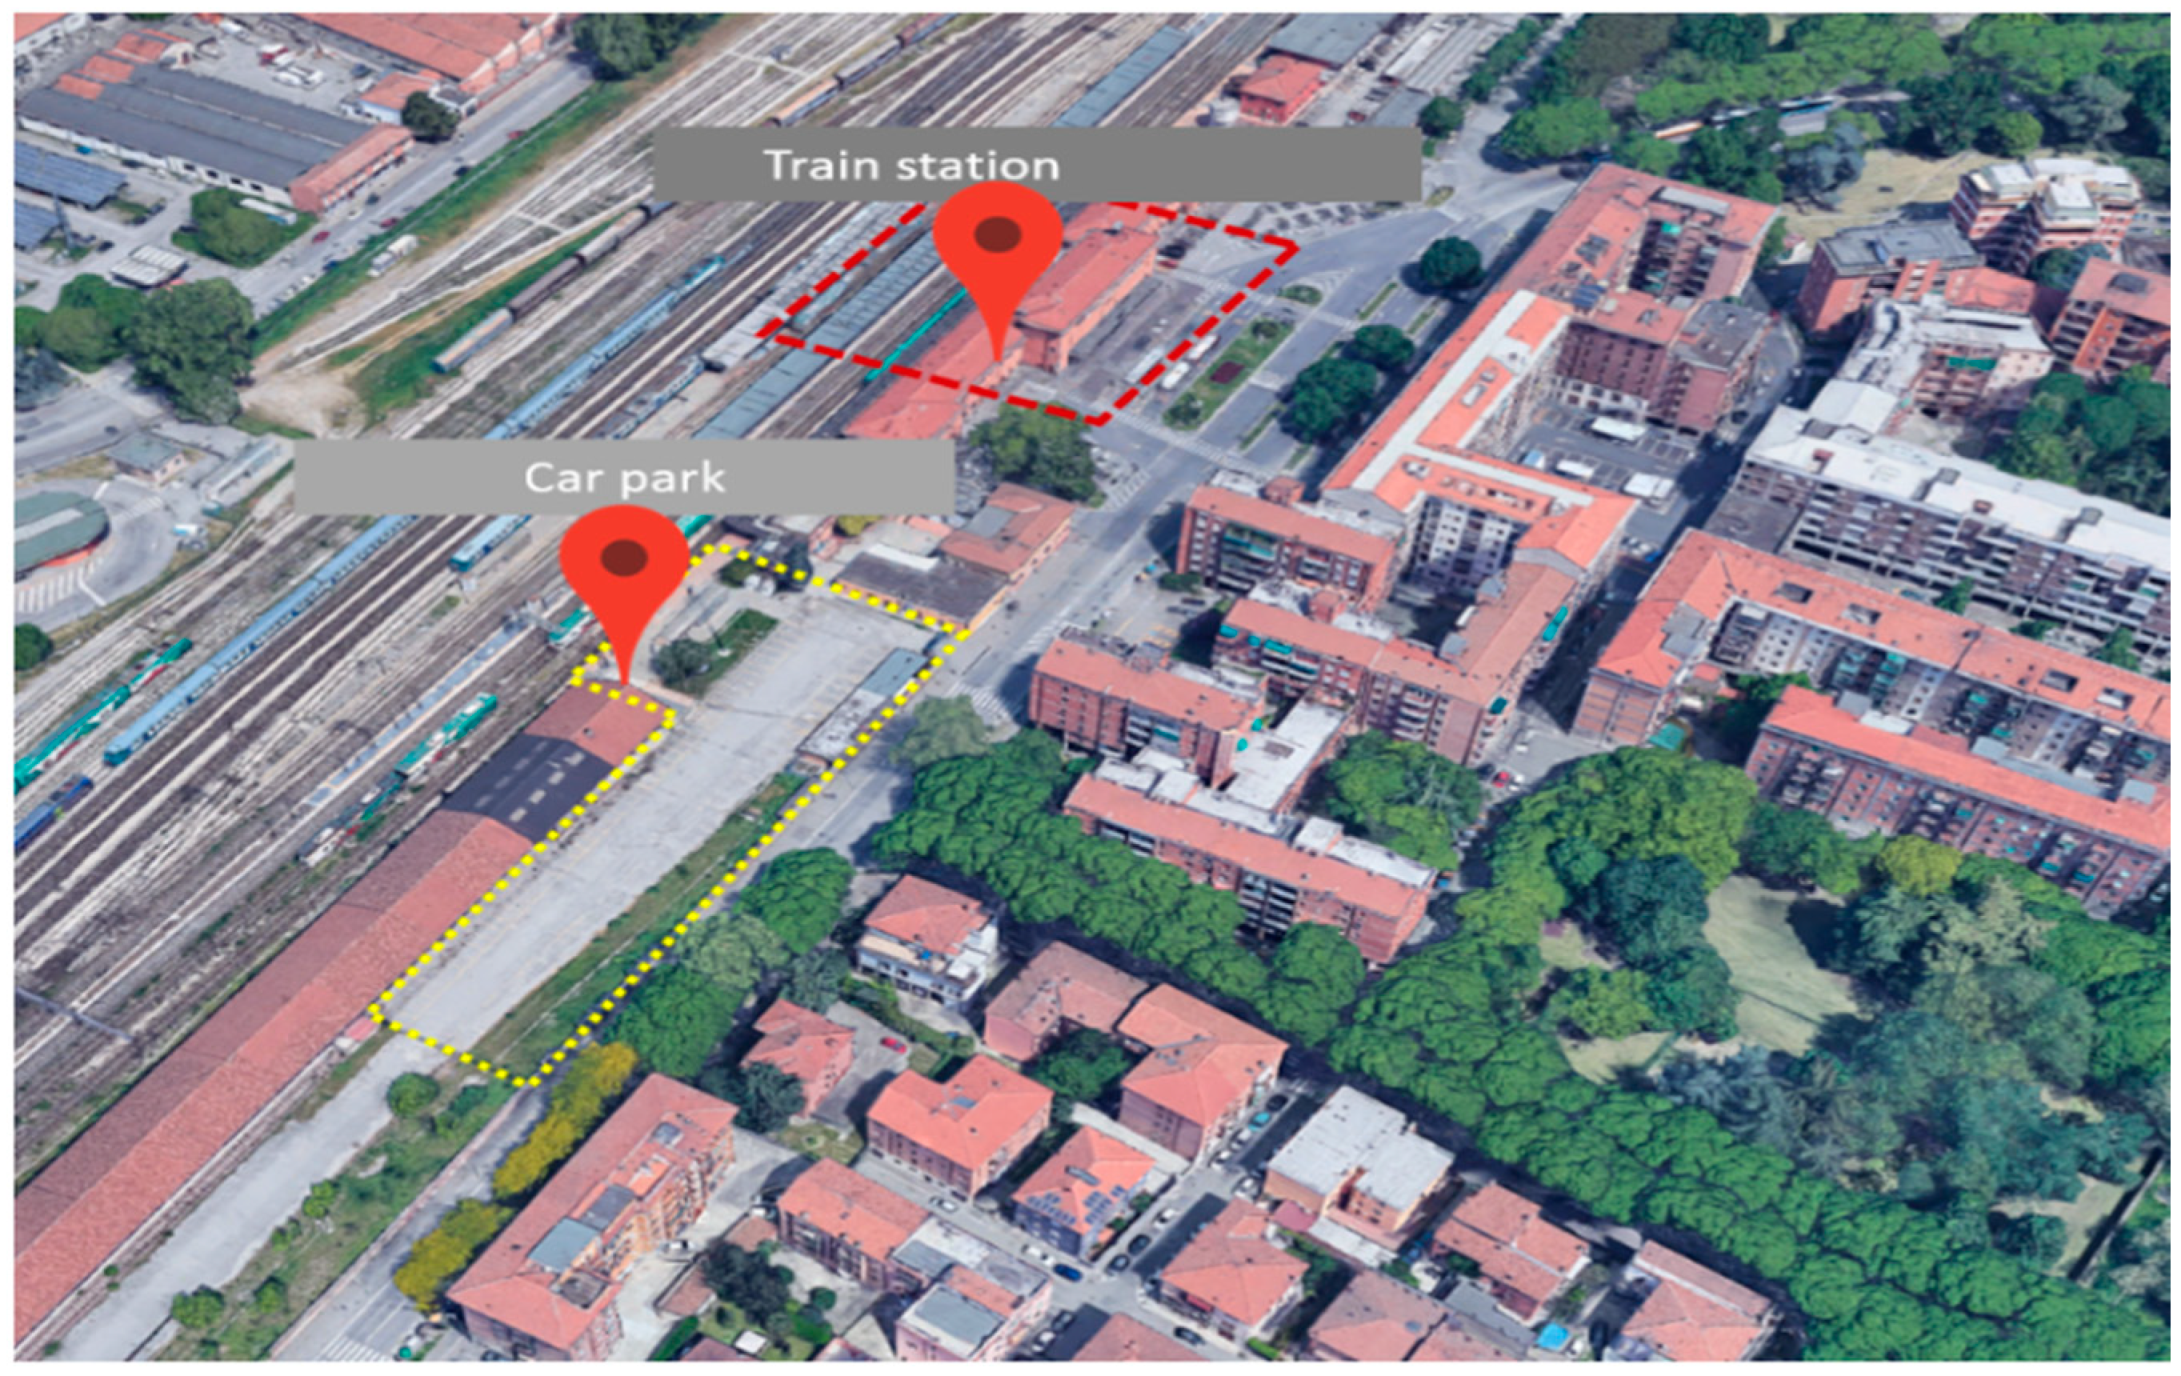
Figure 3.
Load curve of the lighting system.

Figure 4.
Load curve of the entry/exit system.

Figure 5.
Load curve of the video surveillance system.
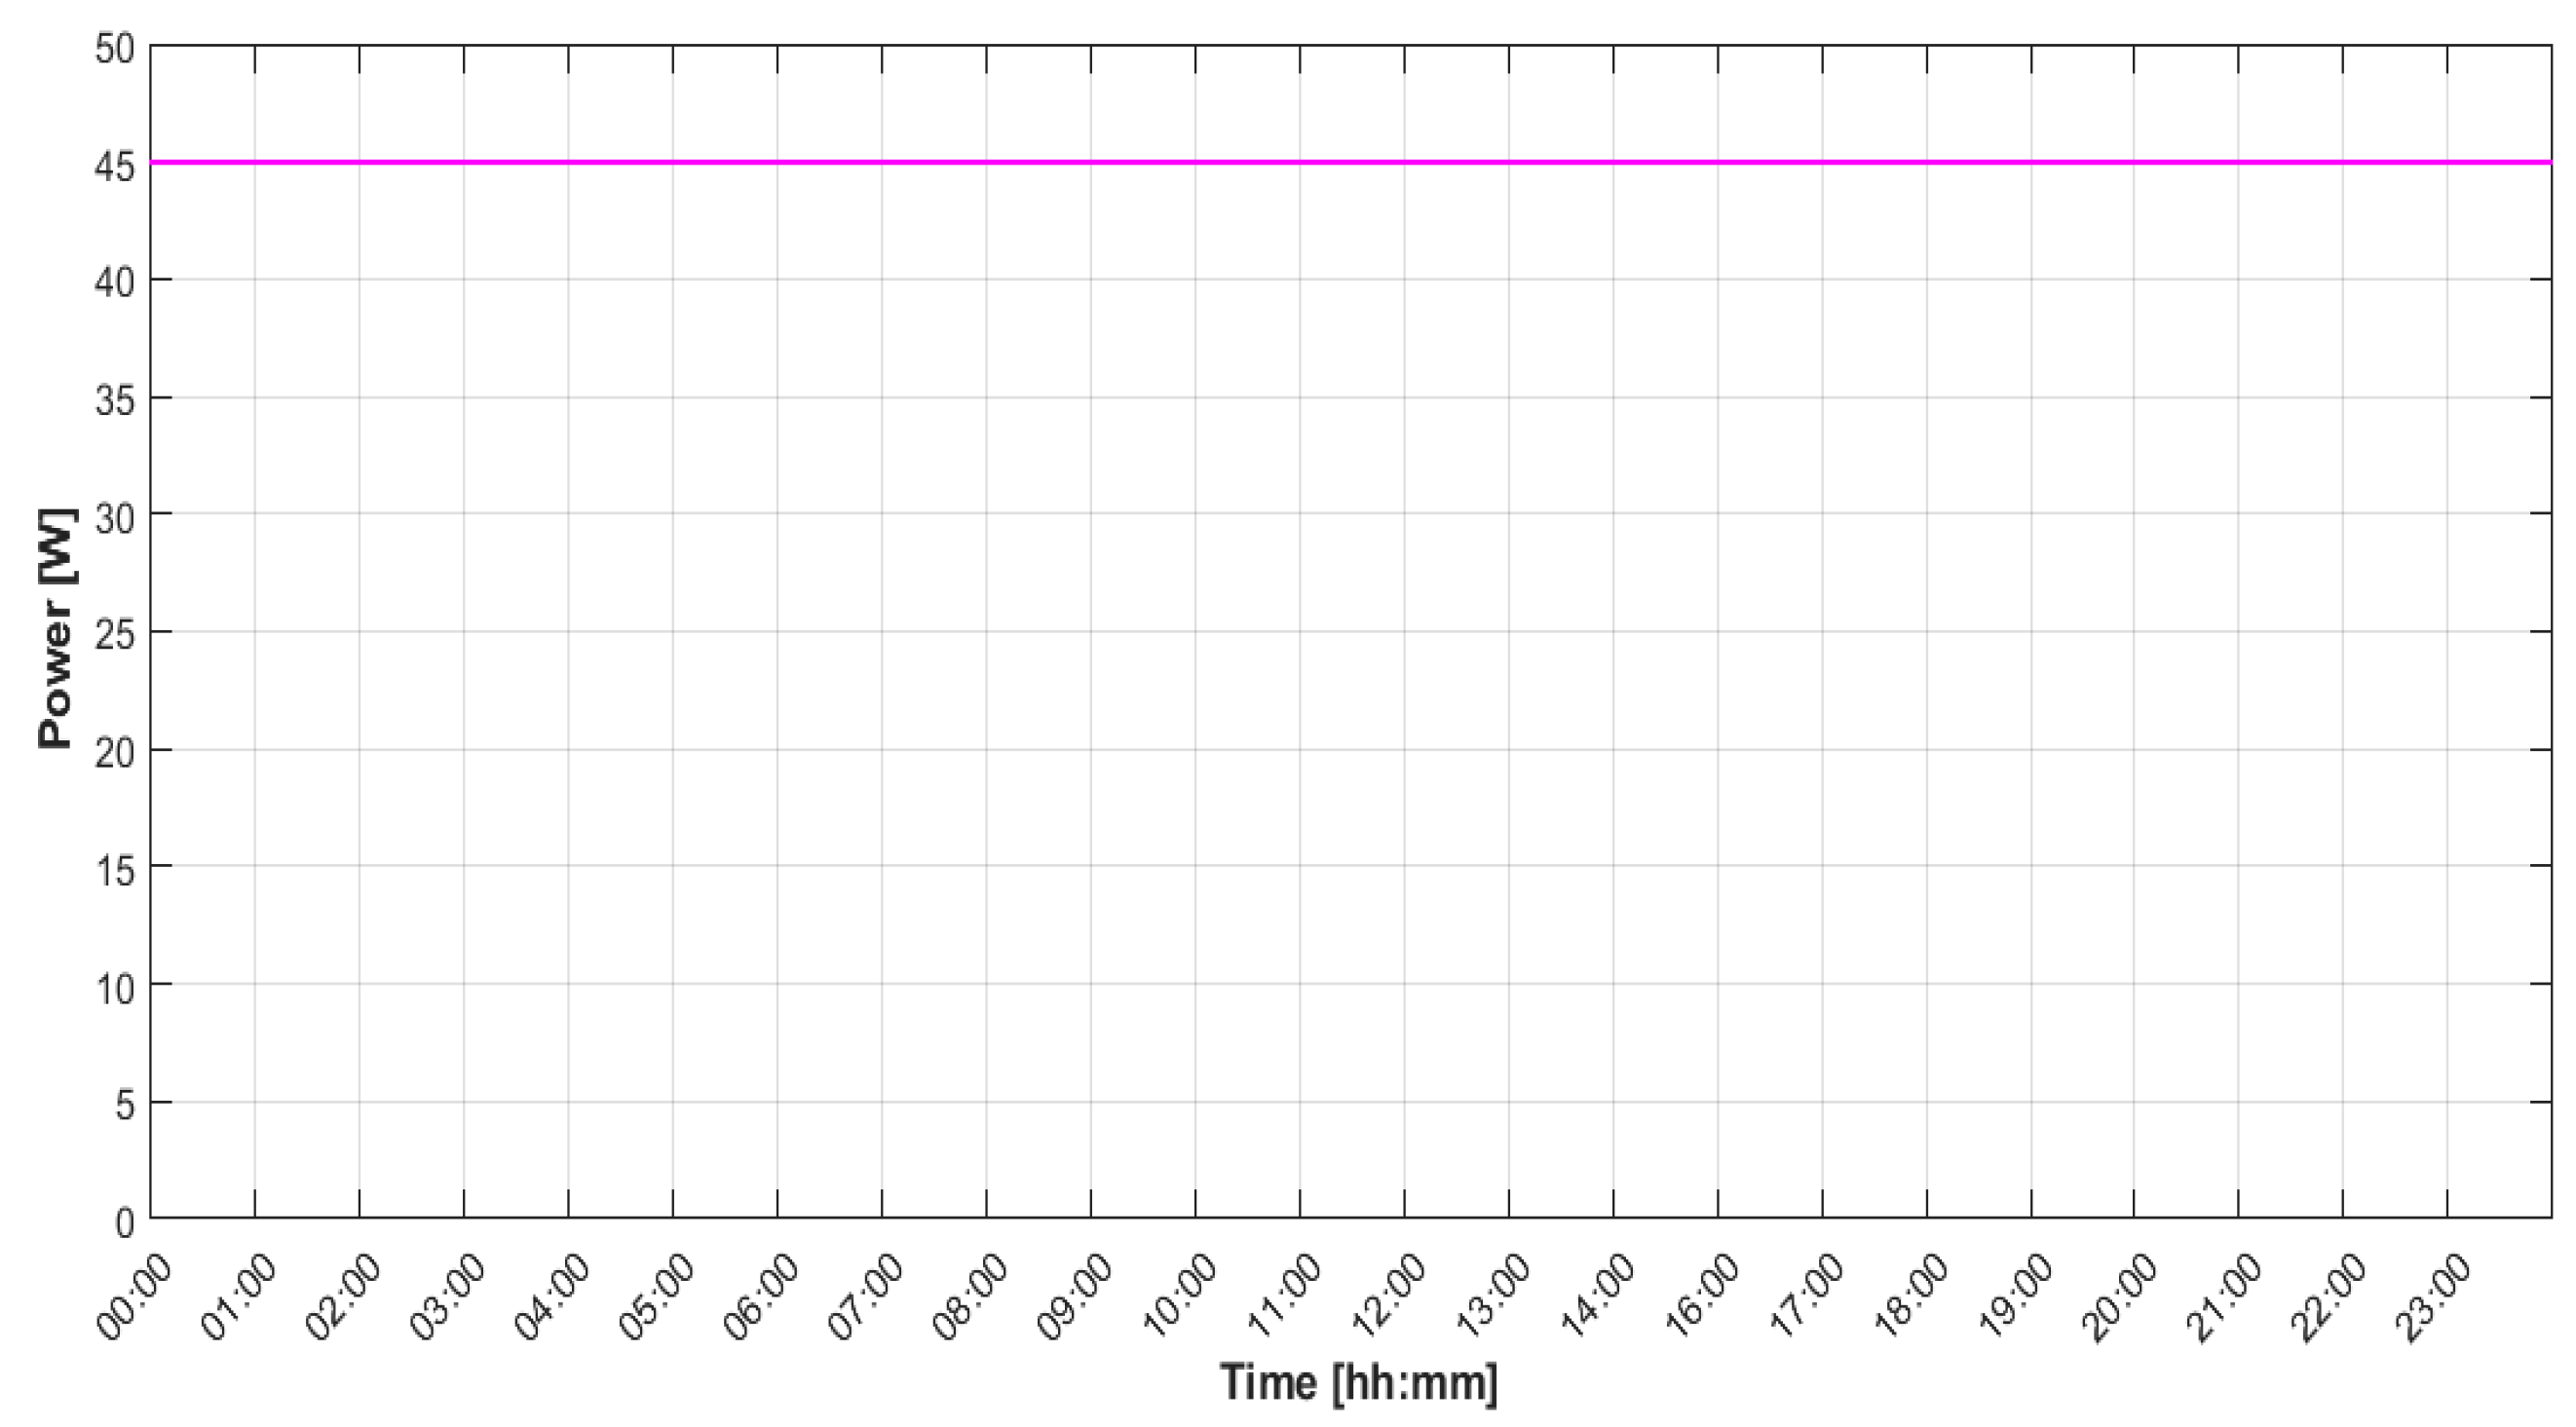
Figure 6.
Load curve of the technical room.

Figure 7.
Example of uncontrolled charging of the five EVs implemented in the car park.

Figure 8.
Charging load at different power levels considering five Nissan Leaf EVs.
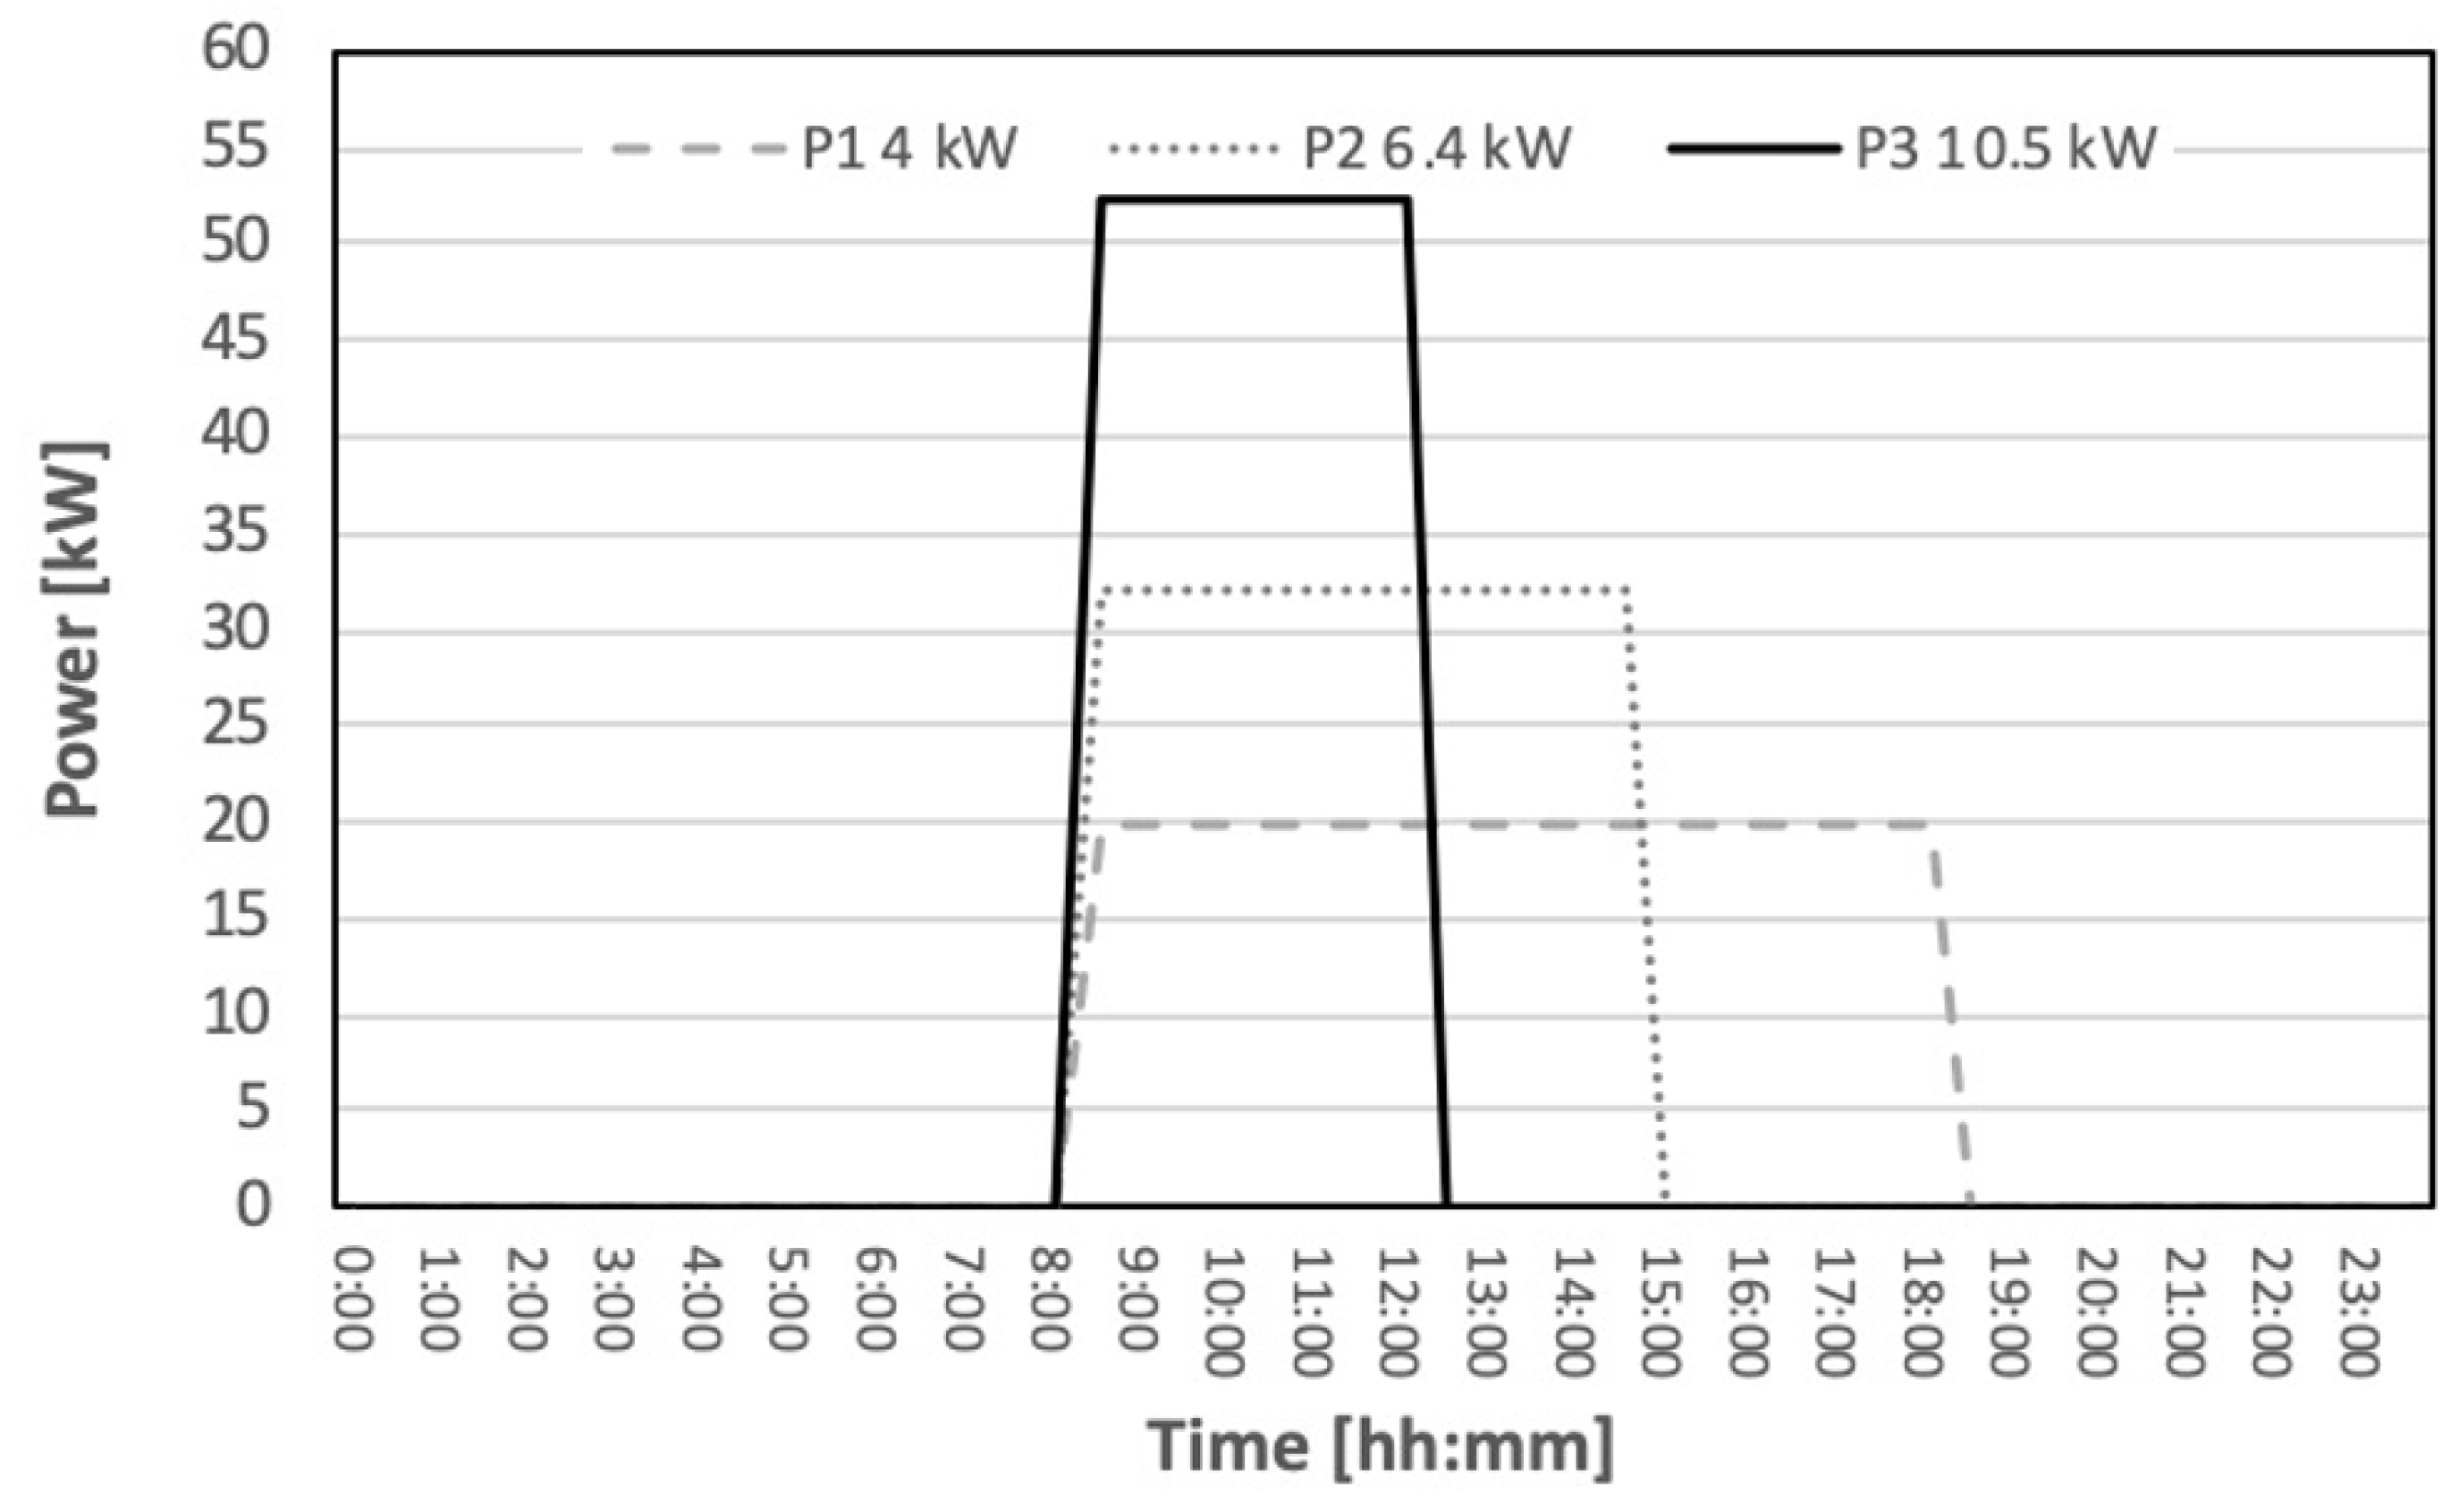
Figure 9.
Overall load curve of the car park.

Figure 10.
Overall daily energy absorption of the car park (without Electric Vehicle Supply Equipment—EVSE).
Figure 10.
Overall daily energy absorption of the car park (without Electric Vehicle Supply Equipment—EVSE).
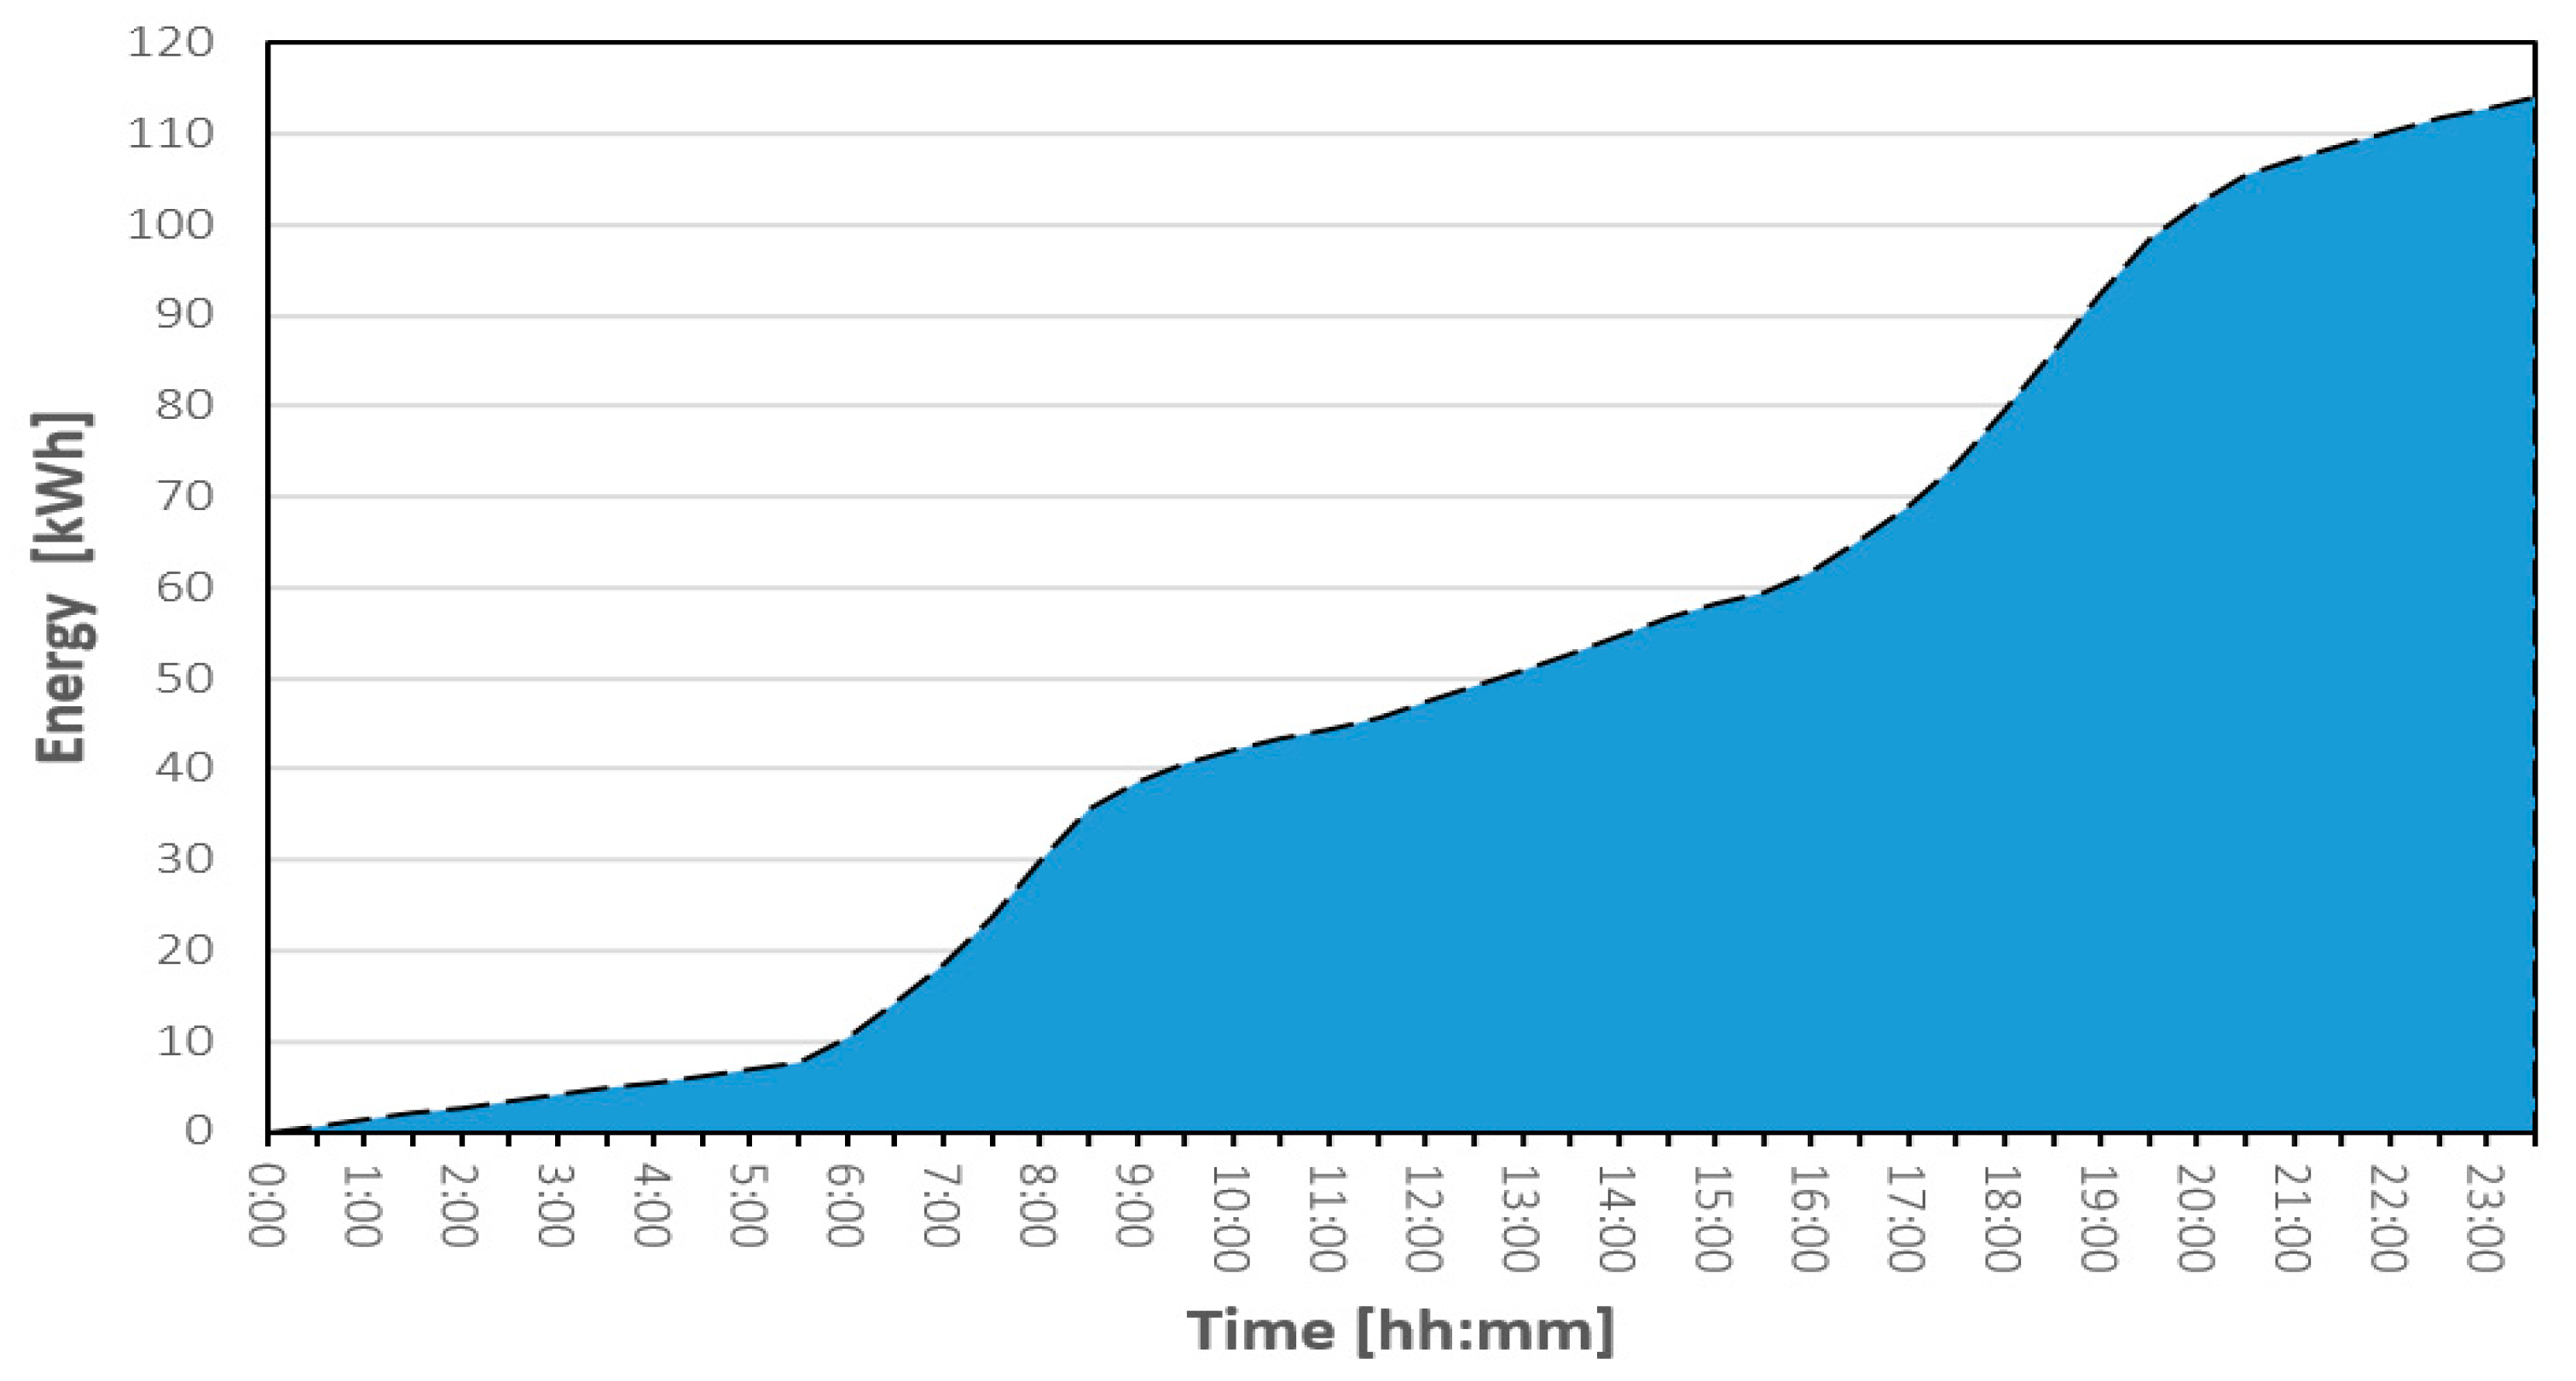
Figure 11.
Bird-eye view for the site of interest—the car park.
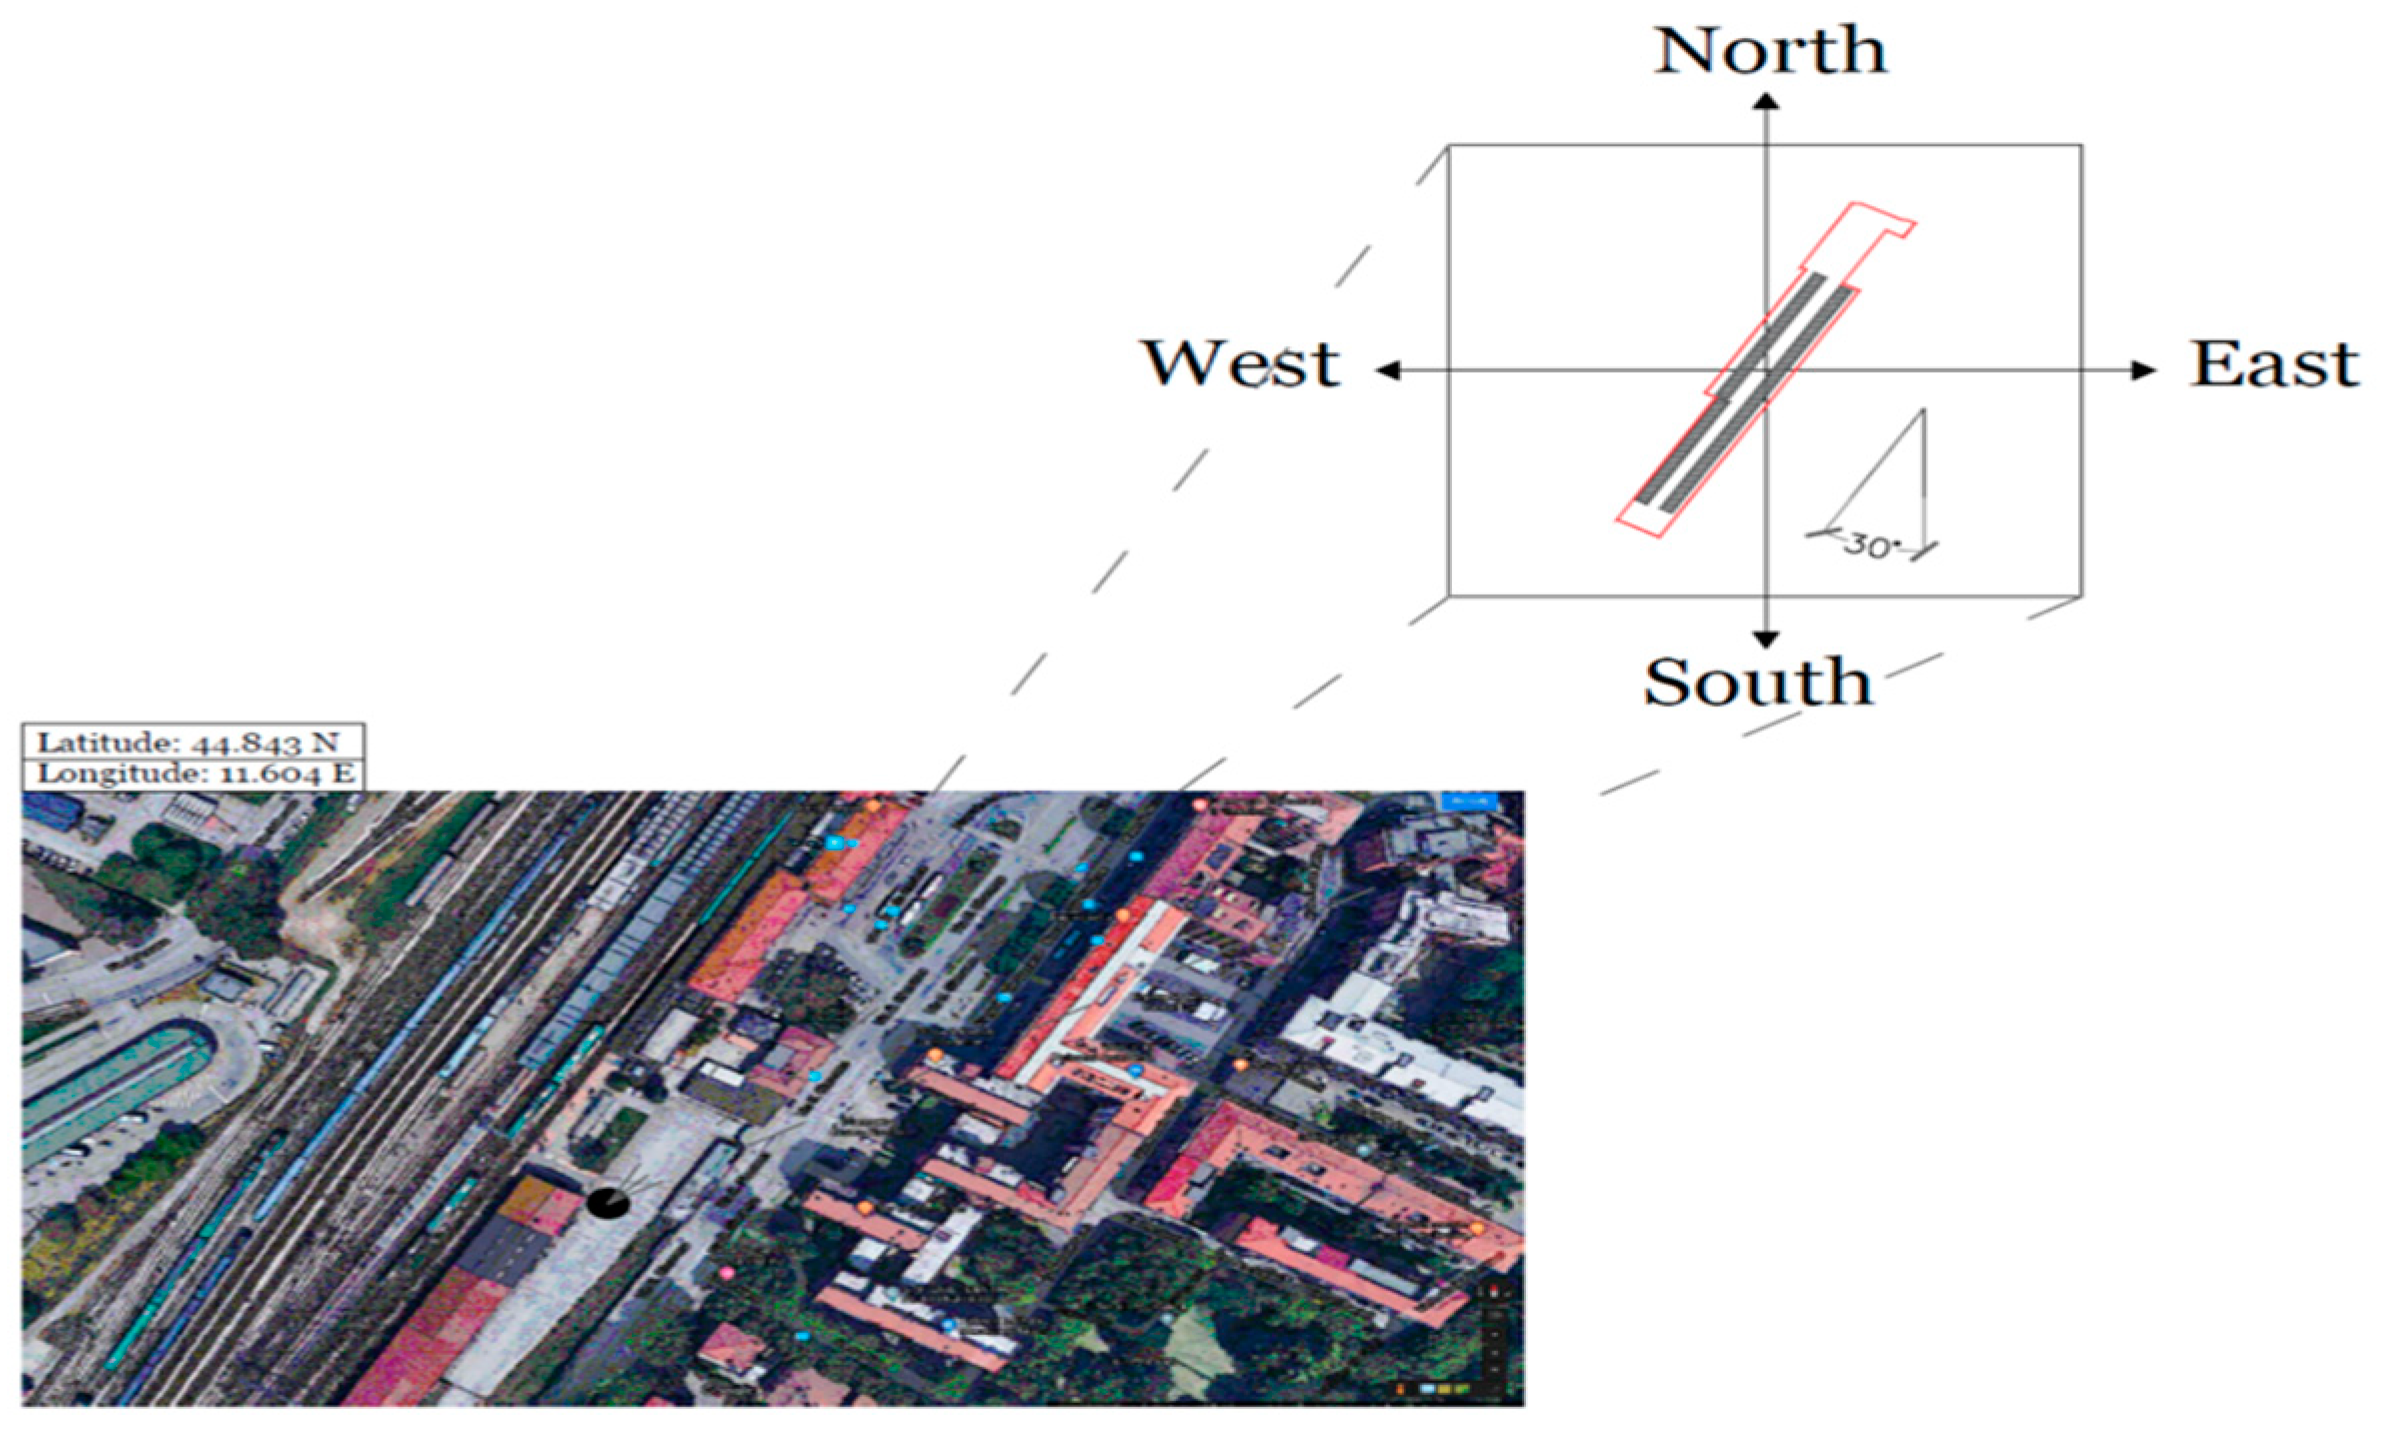
Figure 12.
Daily irradiance in Ferrara for each month.

Figure 13.
Concept of installation (top view).

Figure 14.
(a) Daily output power of the photovoltaic (PV) plant month by month and (b) overall monthly producibility of the PV plant.
Figure 14.
(a) Daily output power of the photovoltaic (PV) plant month by month and (b) overall monthly producibility of the PV plant.

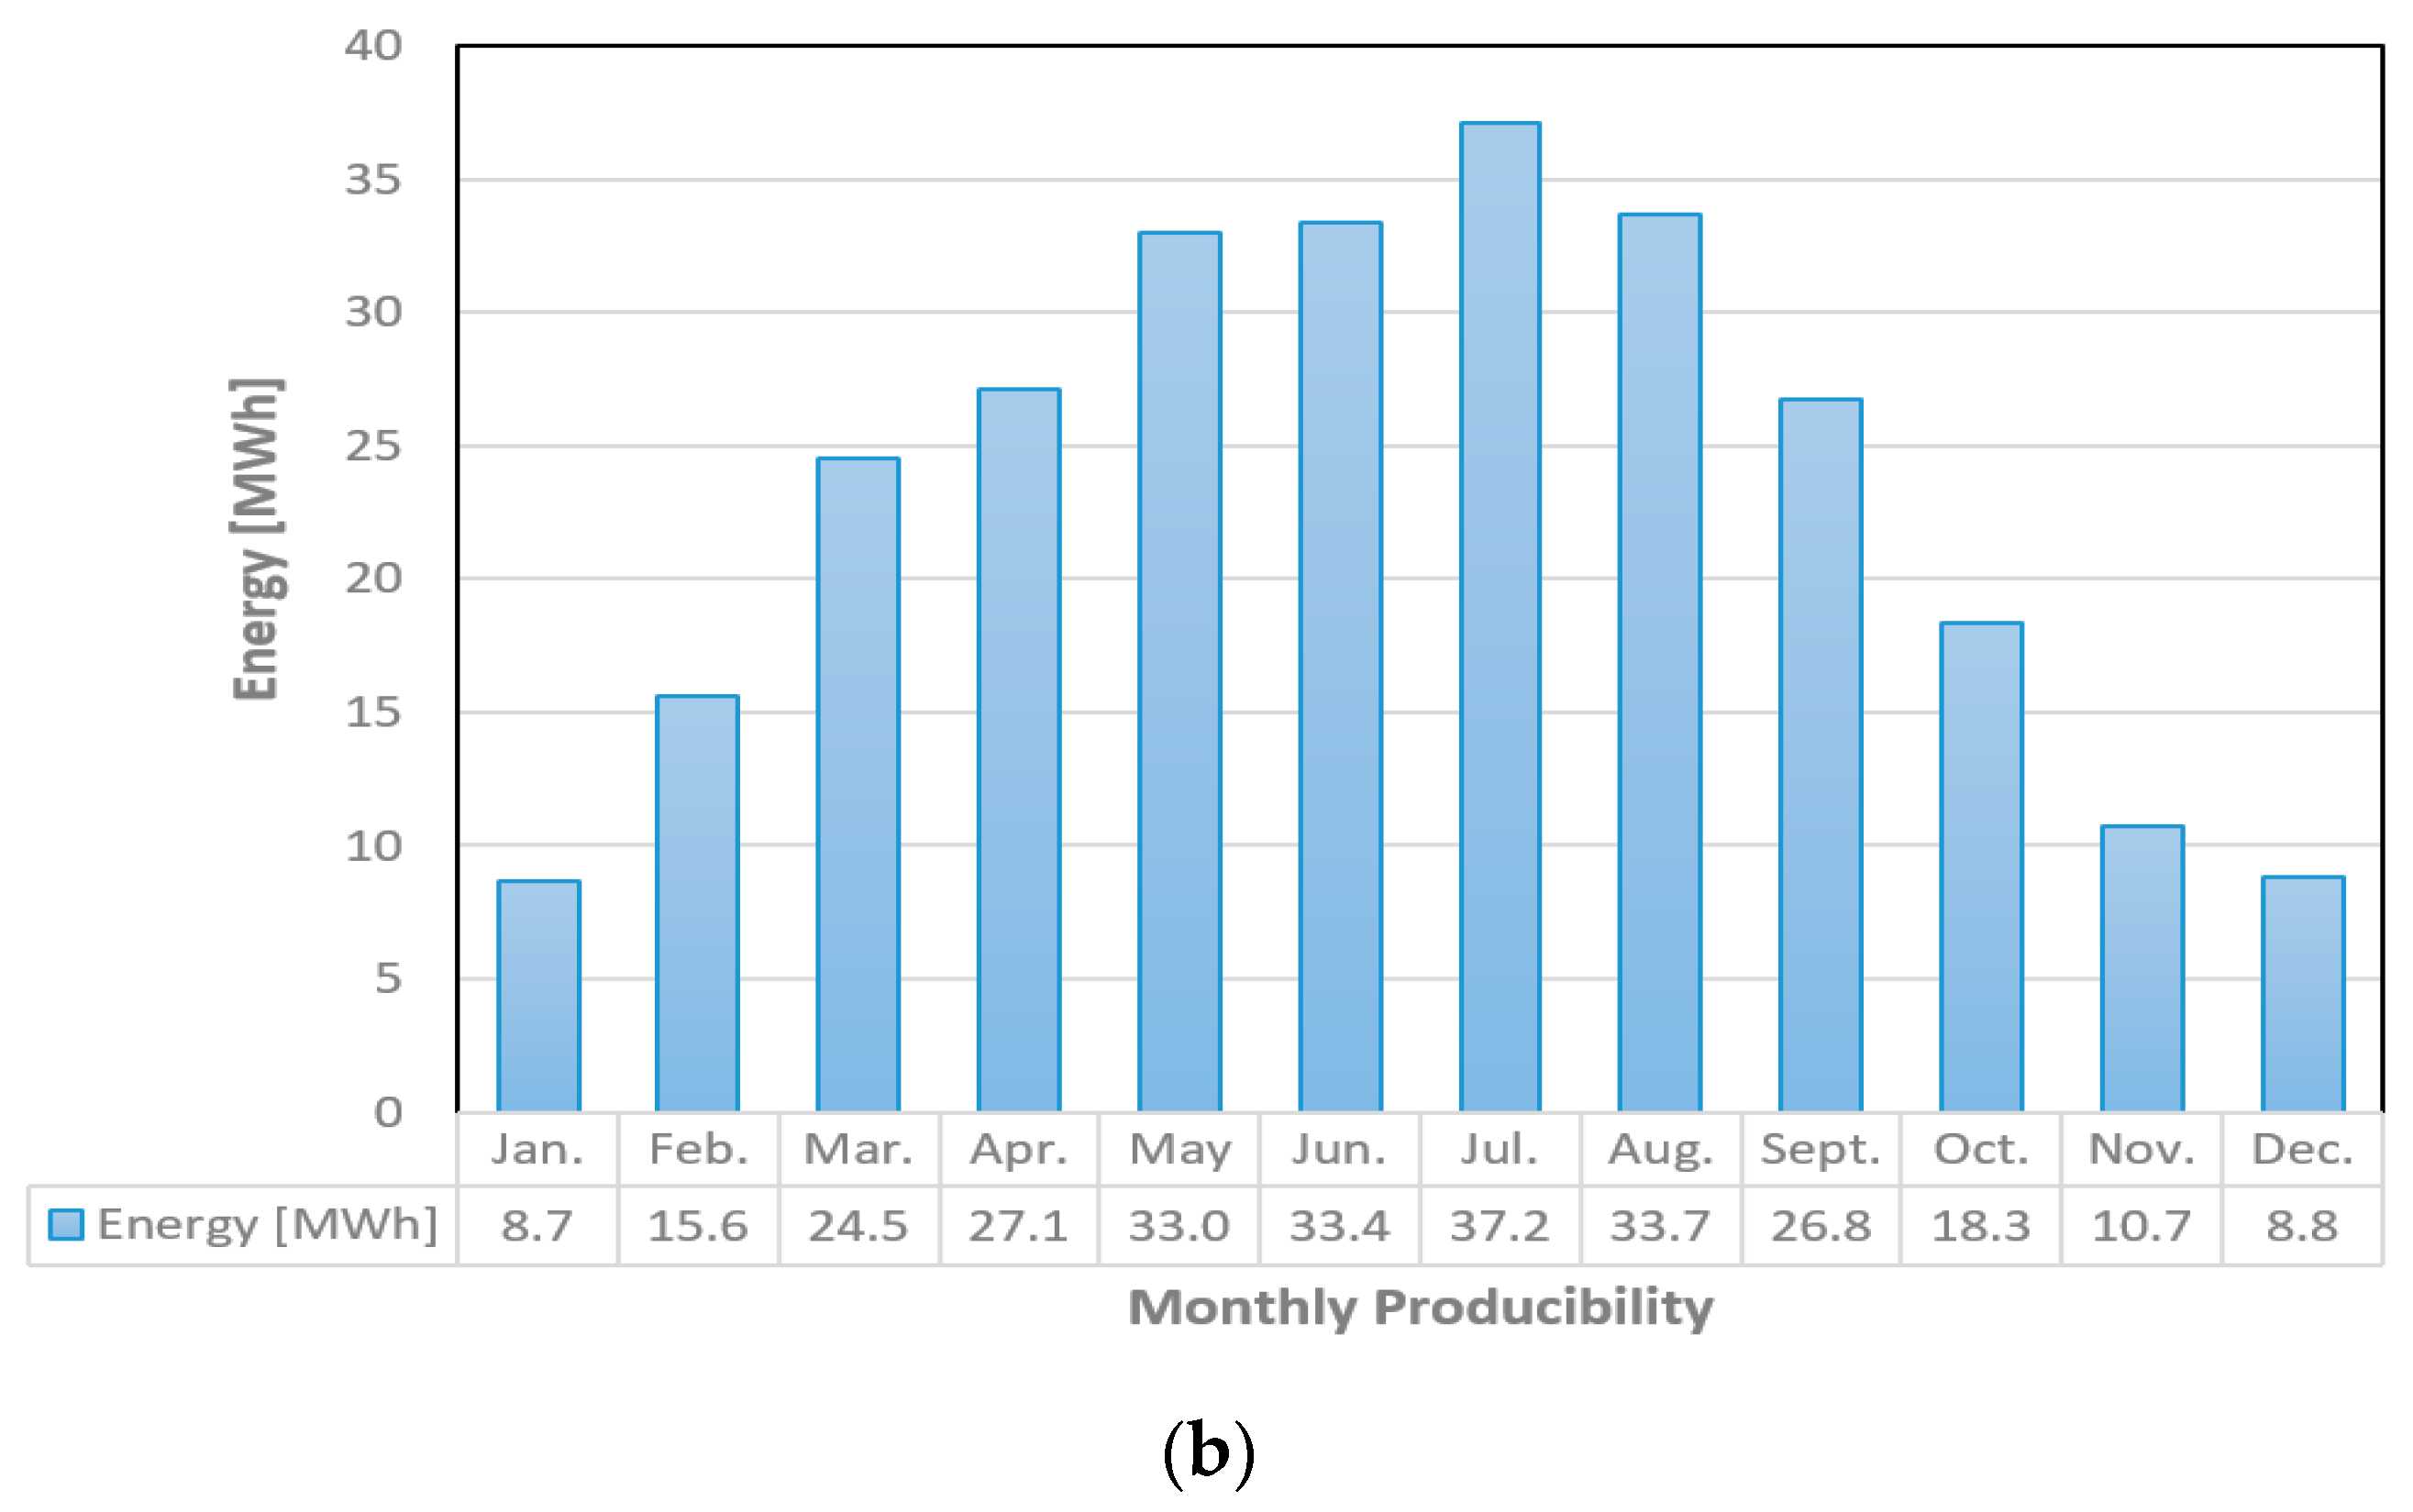
Figure 15.
Flowchart of the “green” algorithm.
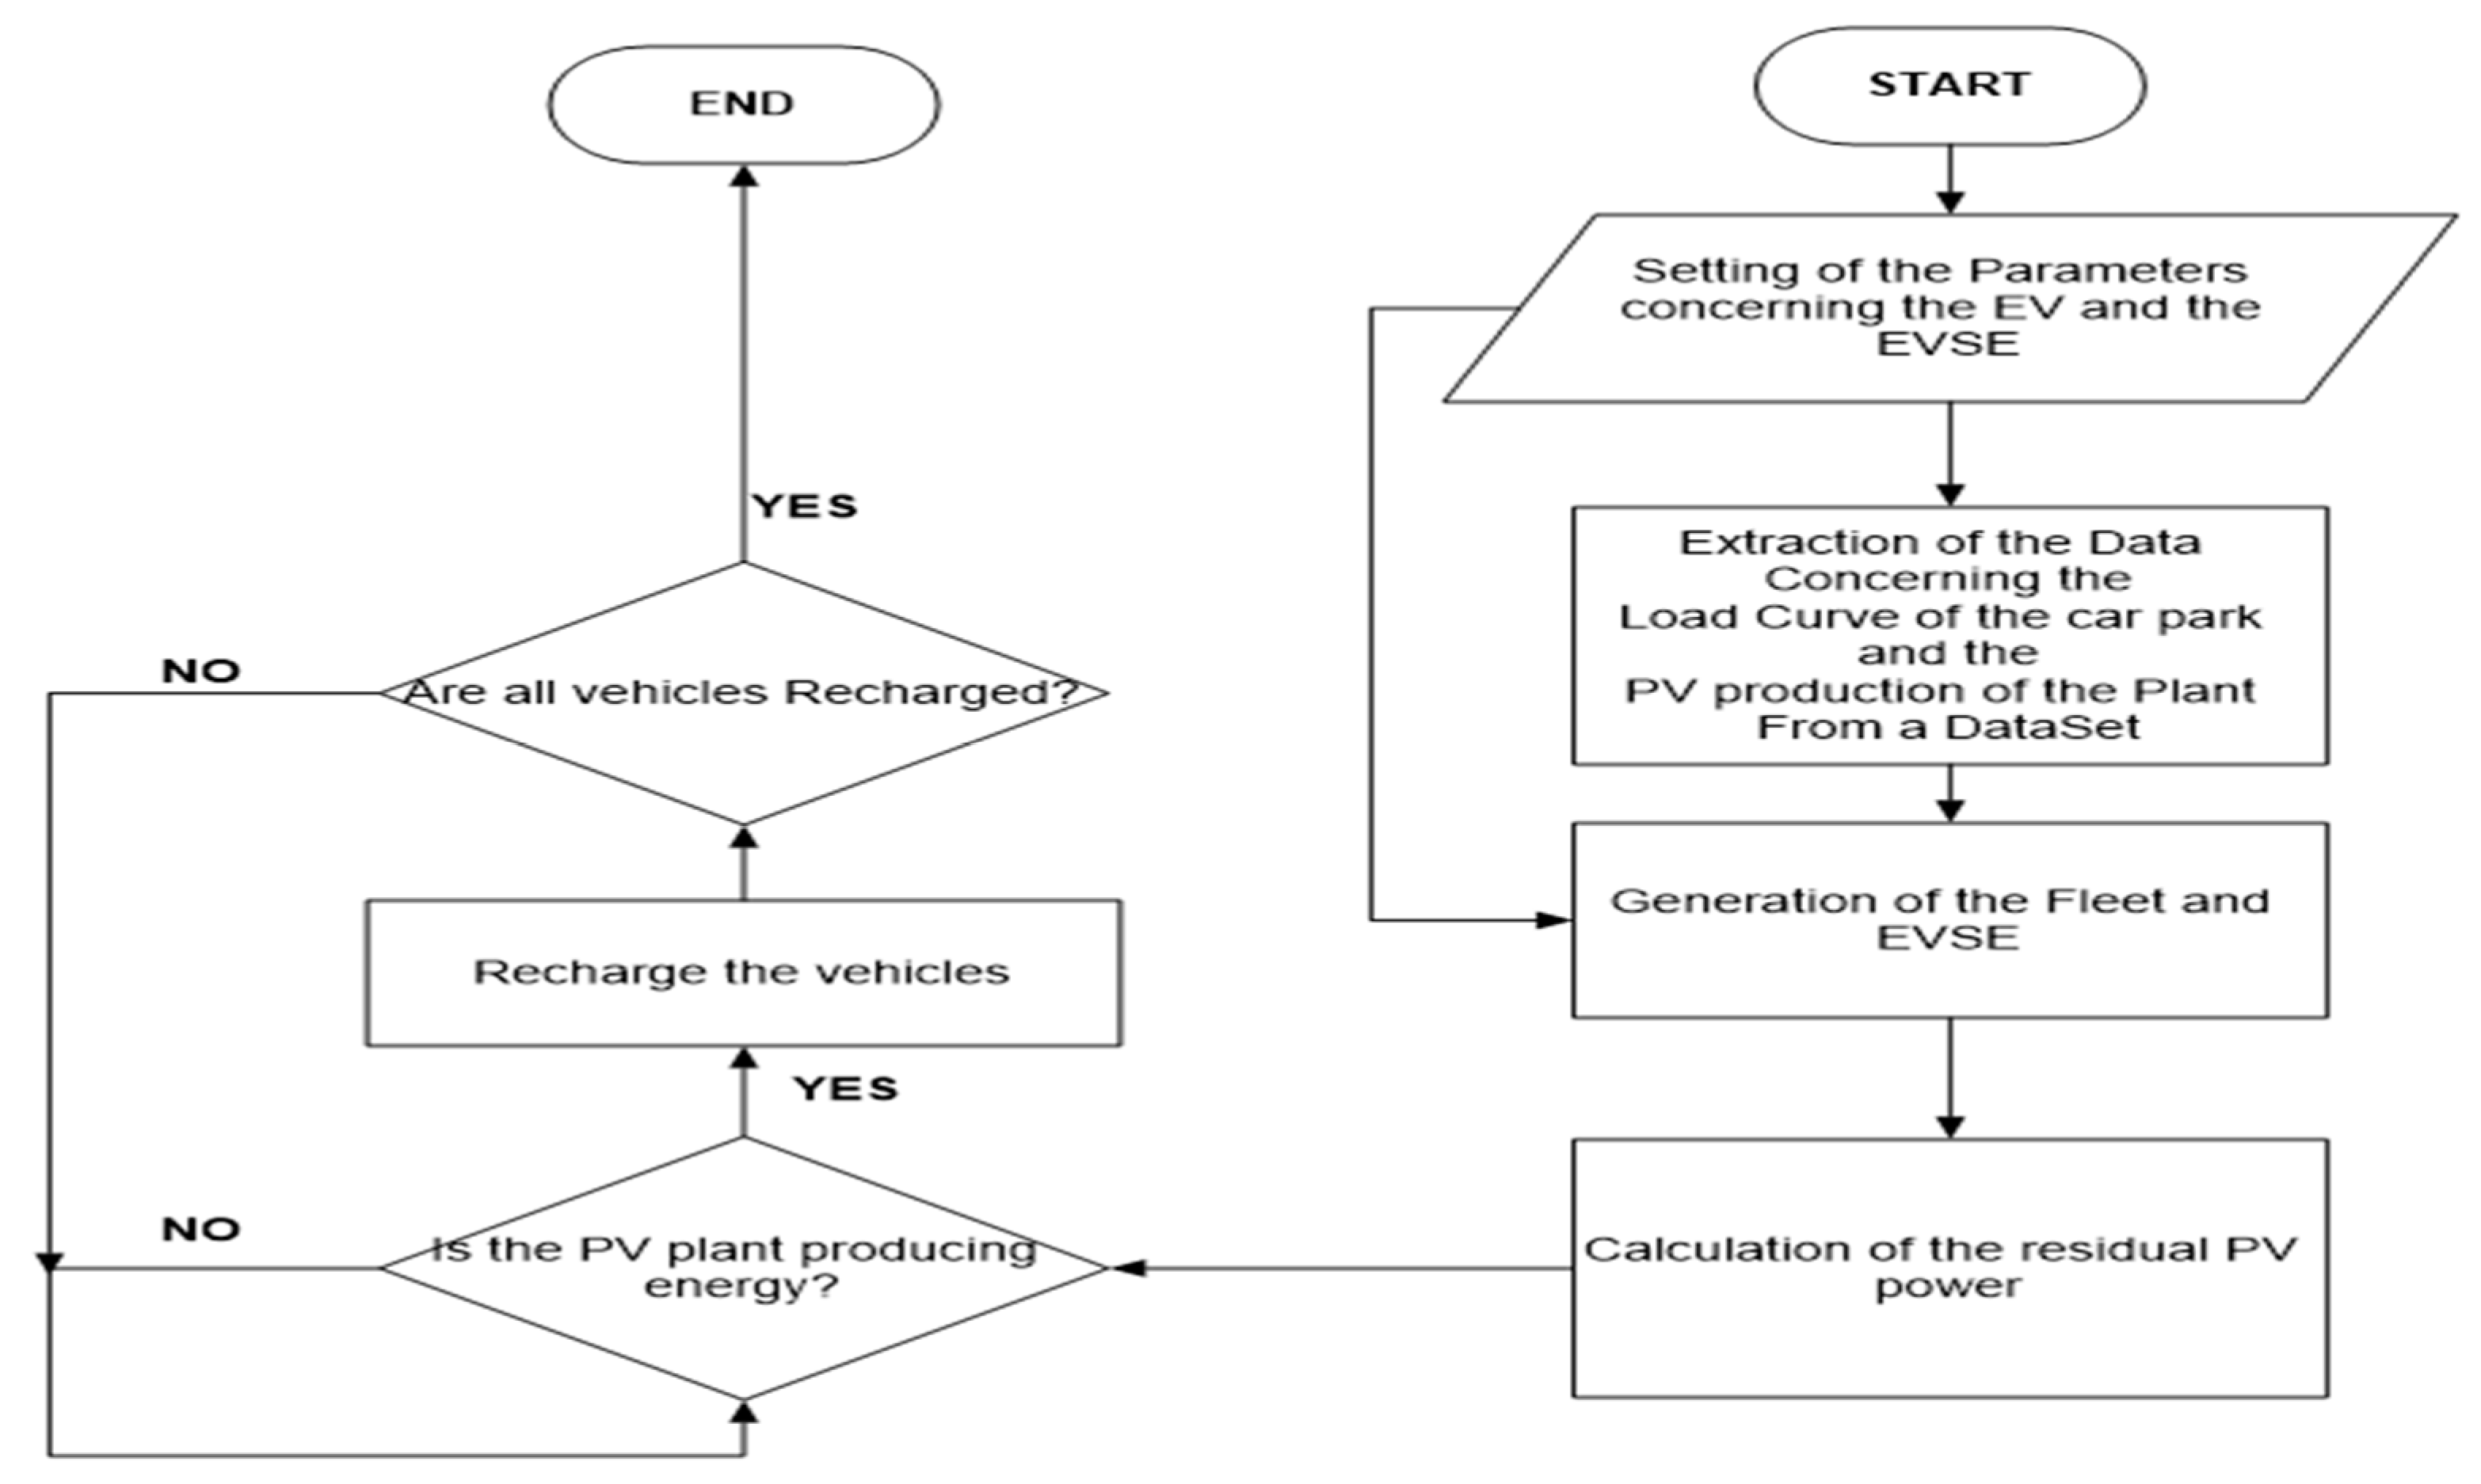
Figure 16.
Comparison of load curve of the car park and PV production distributions.

Figure 17.
Comparison between the old load curve and the new one.
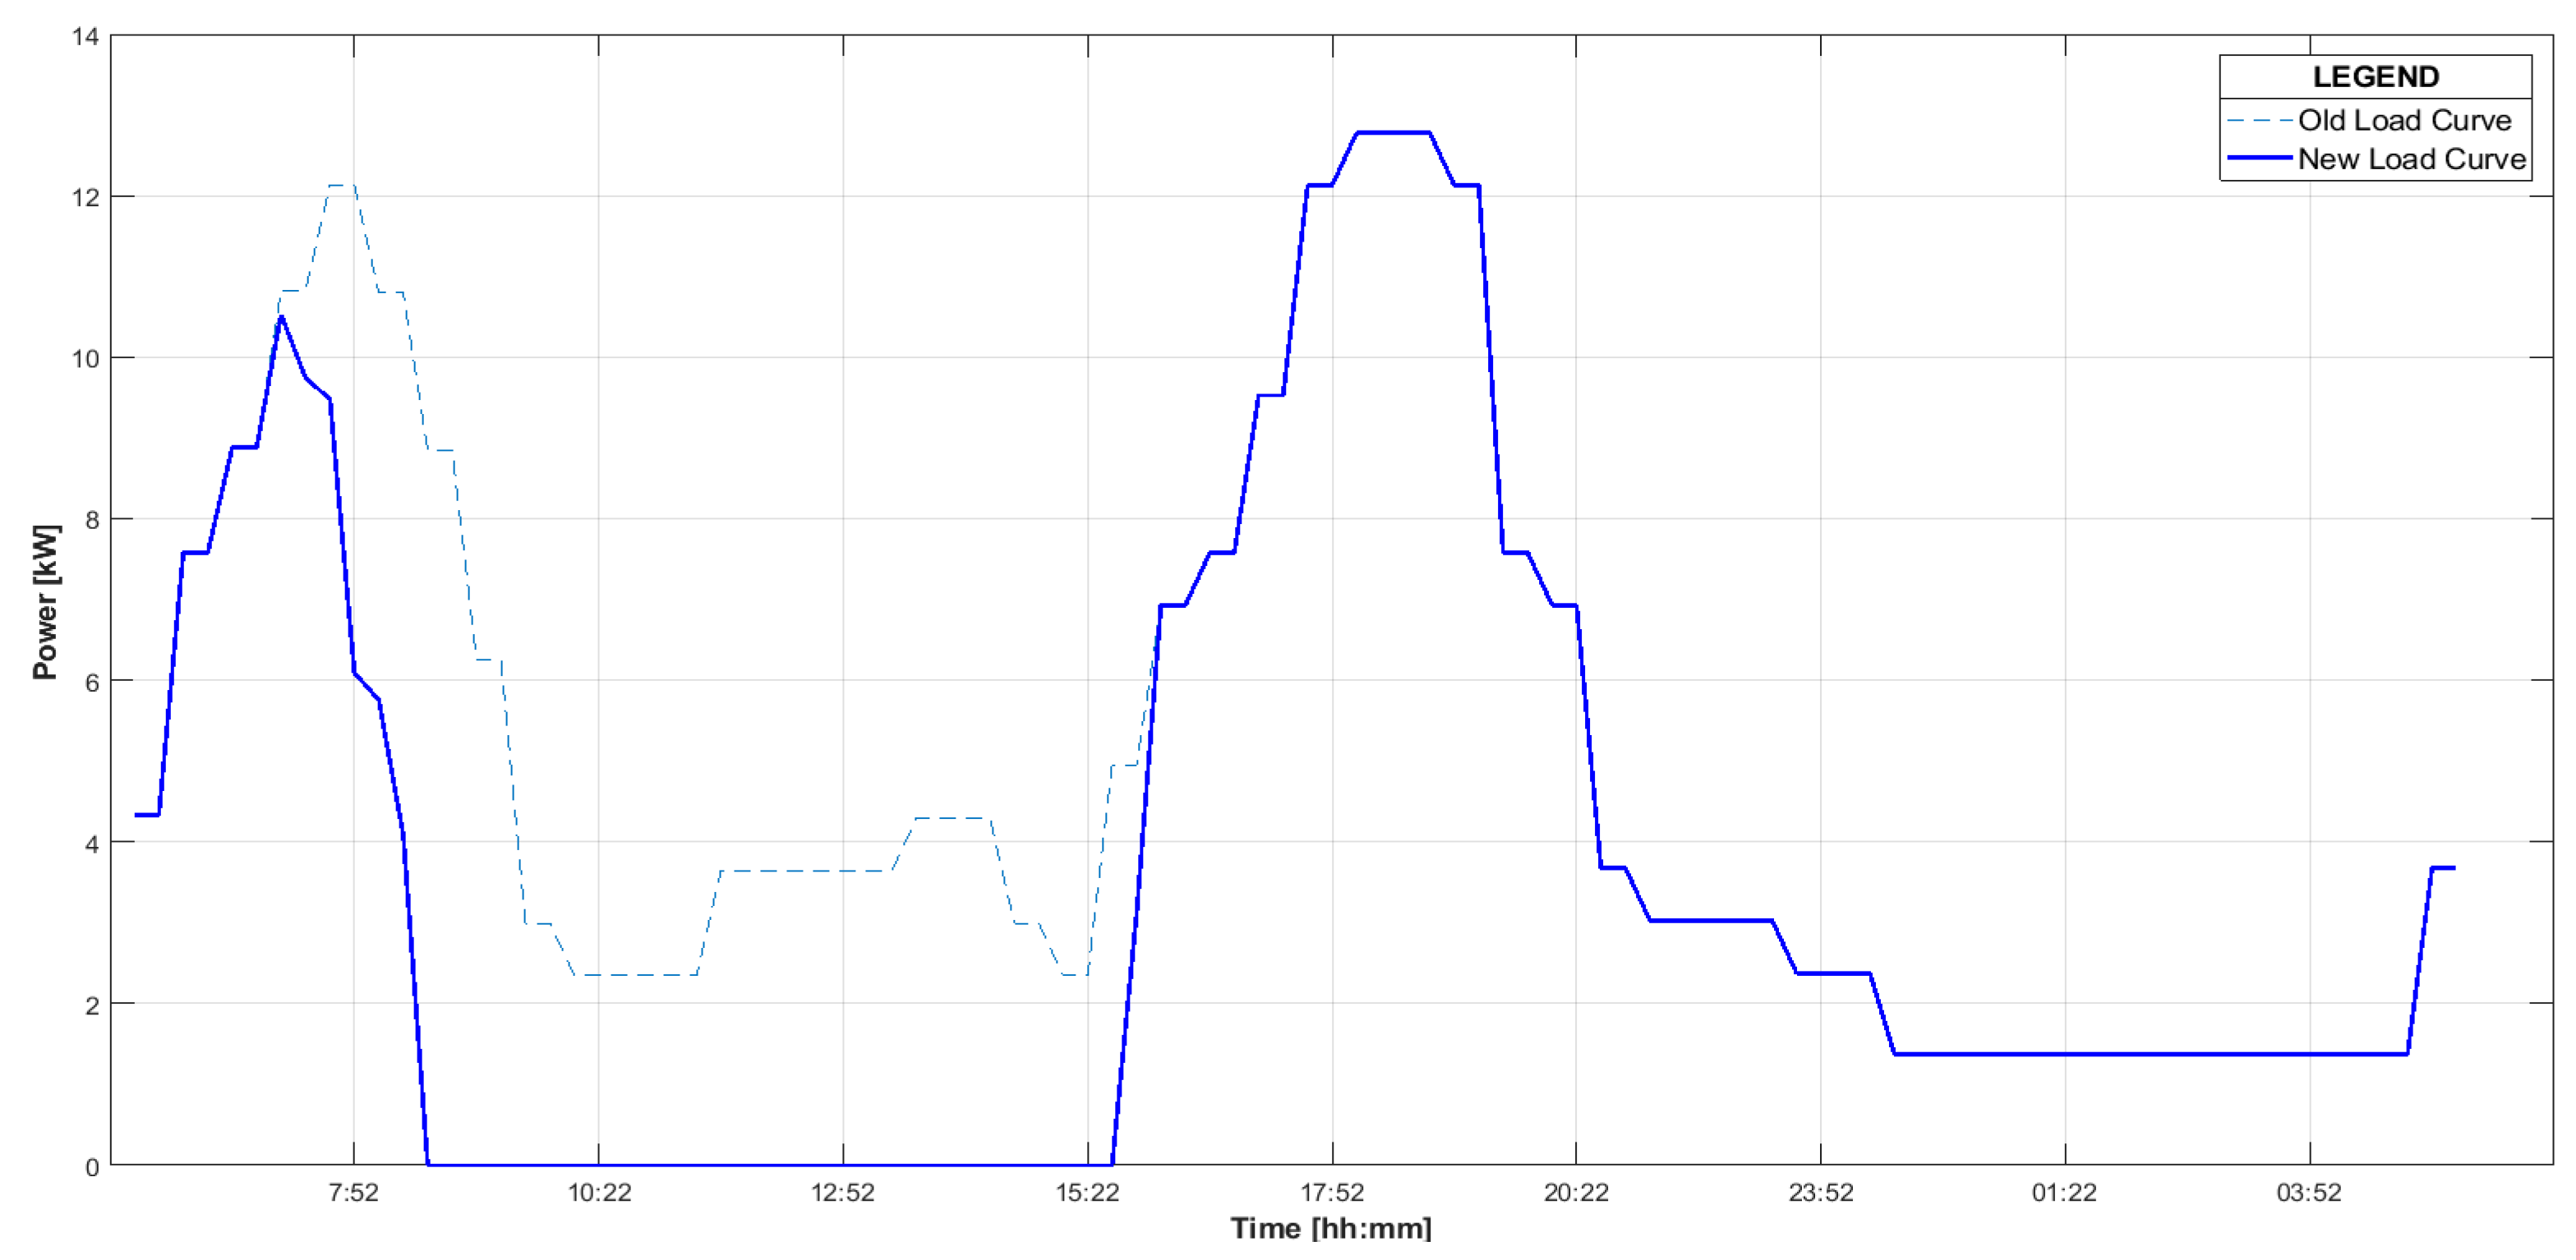
Figure 18.
Net power production and power absorption distributions.
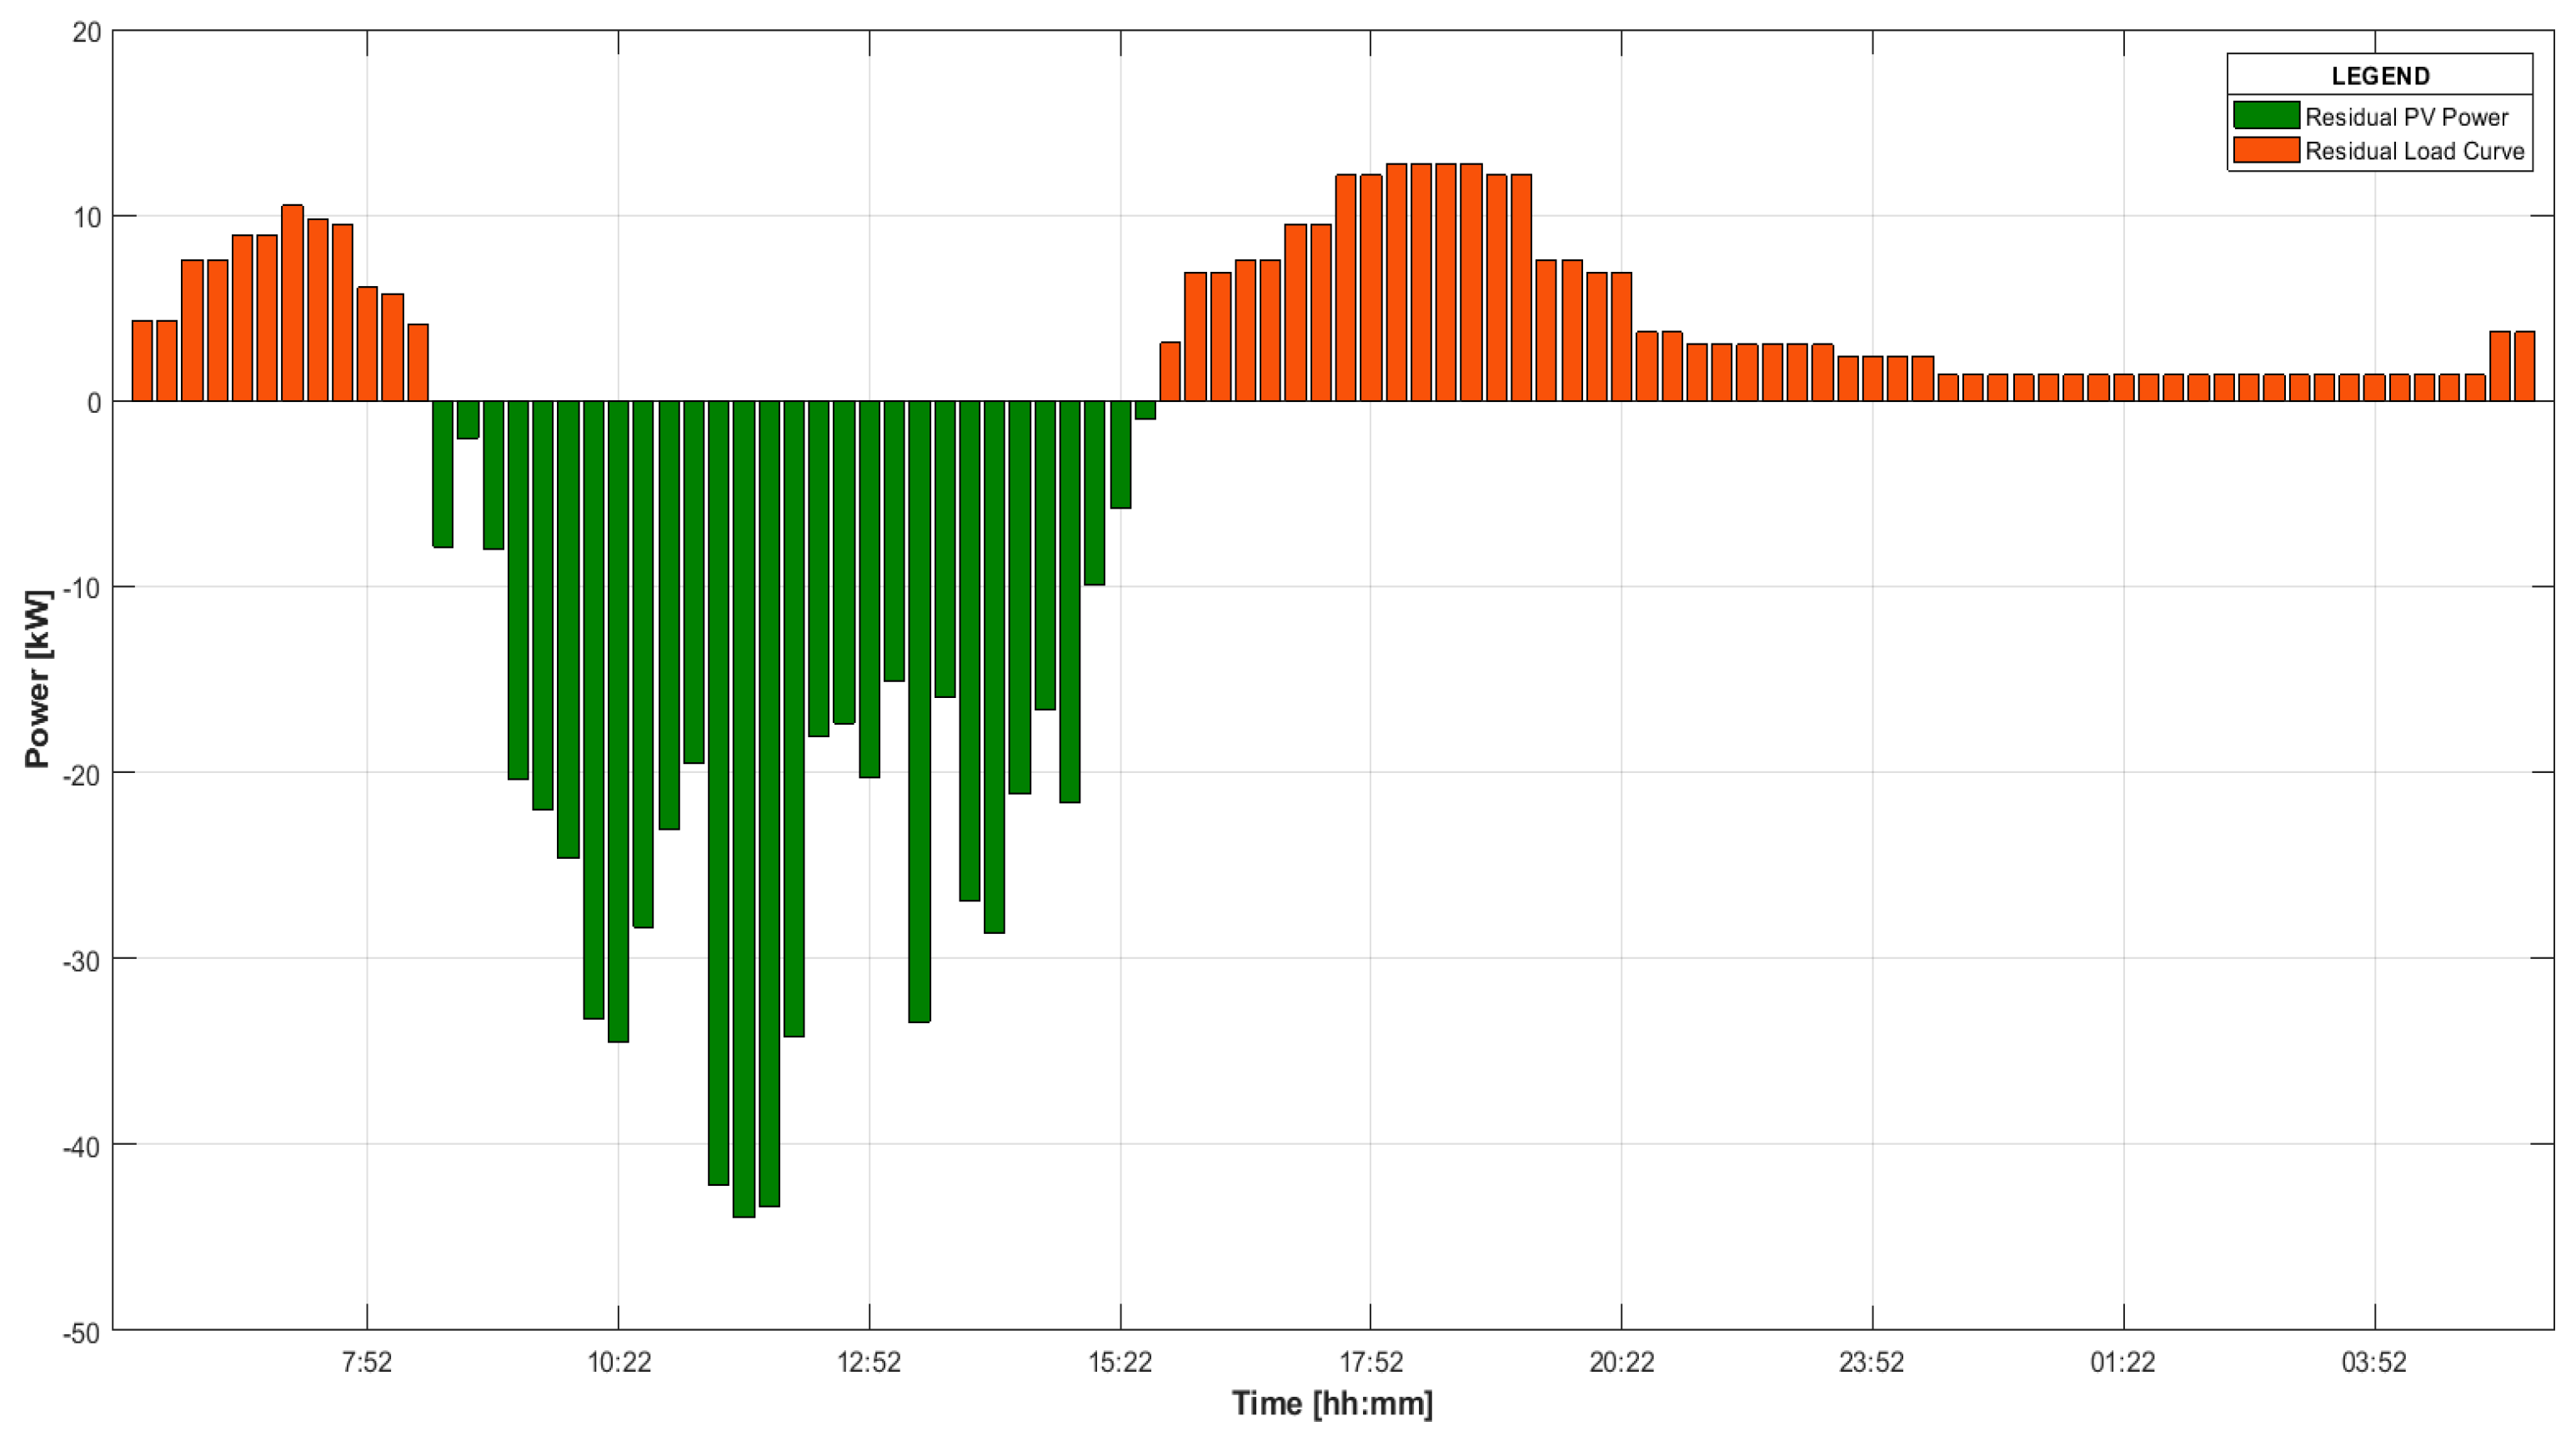
Figure 19.
Final energy absorption of the car park distribution.

Figure 20.
Operating principle of the peak shaving algorithm.
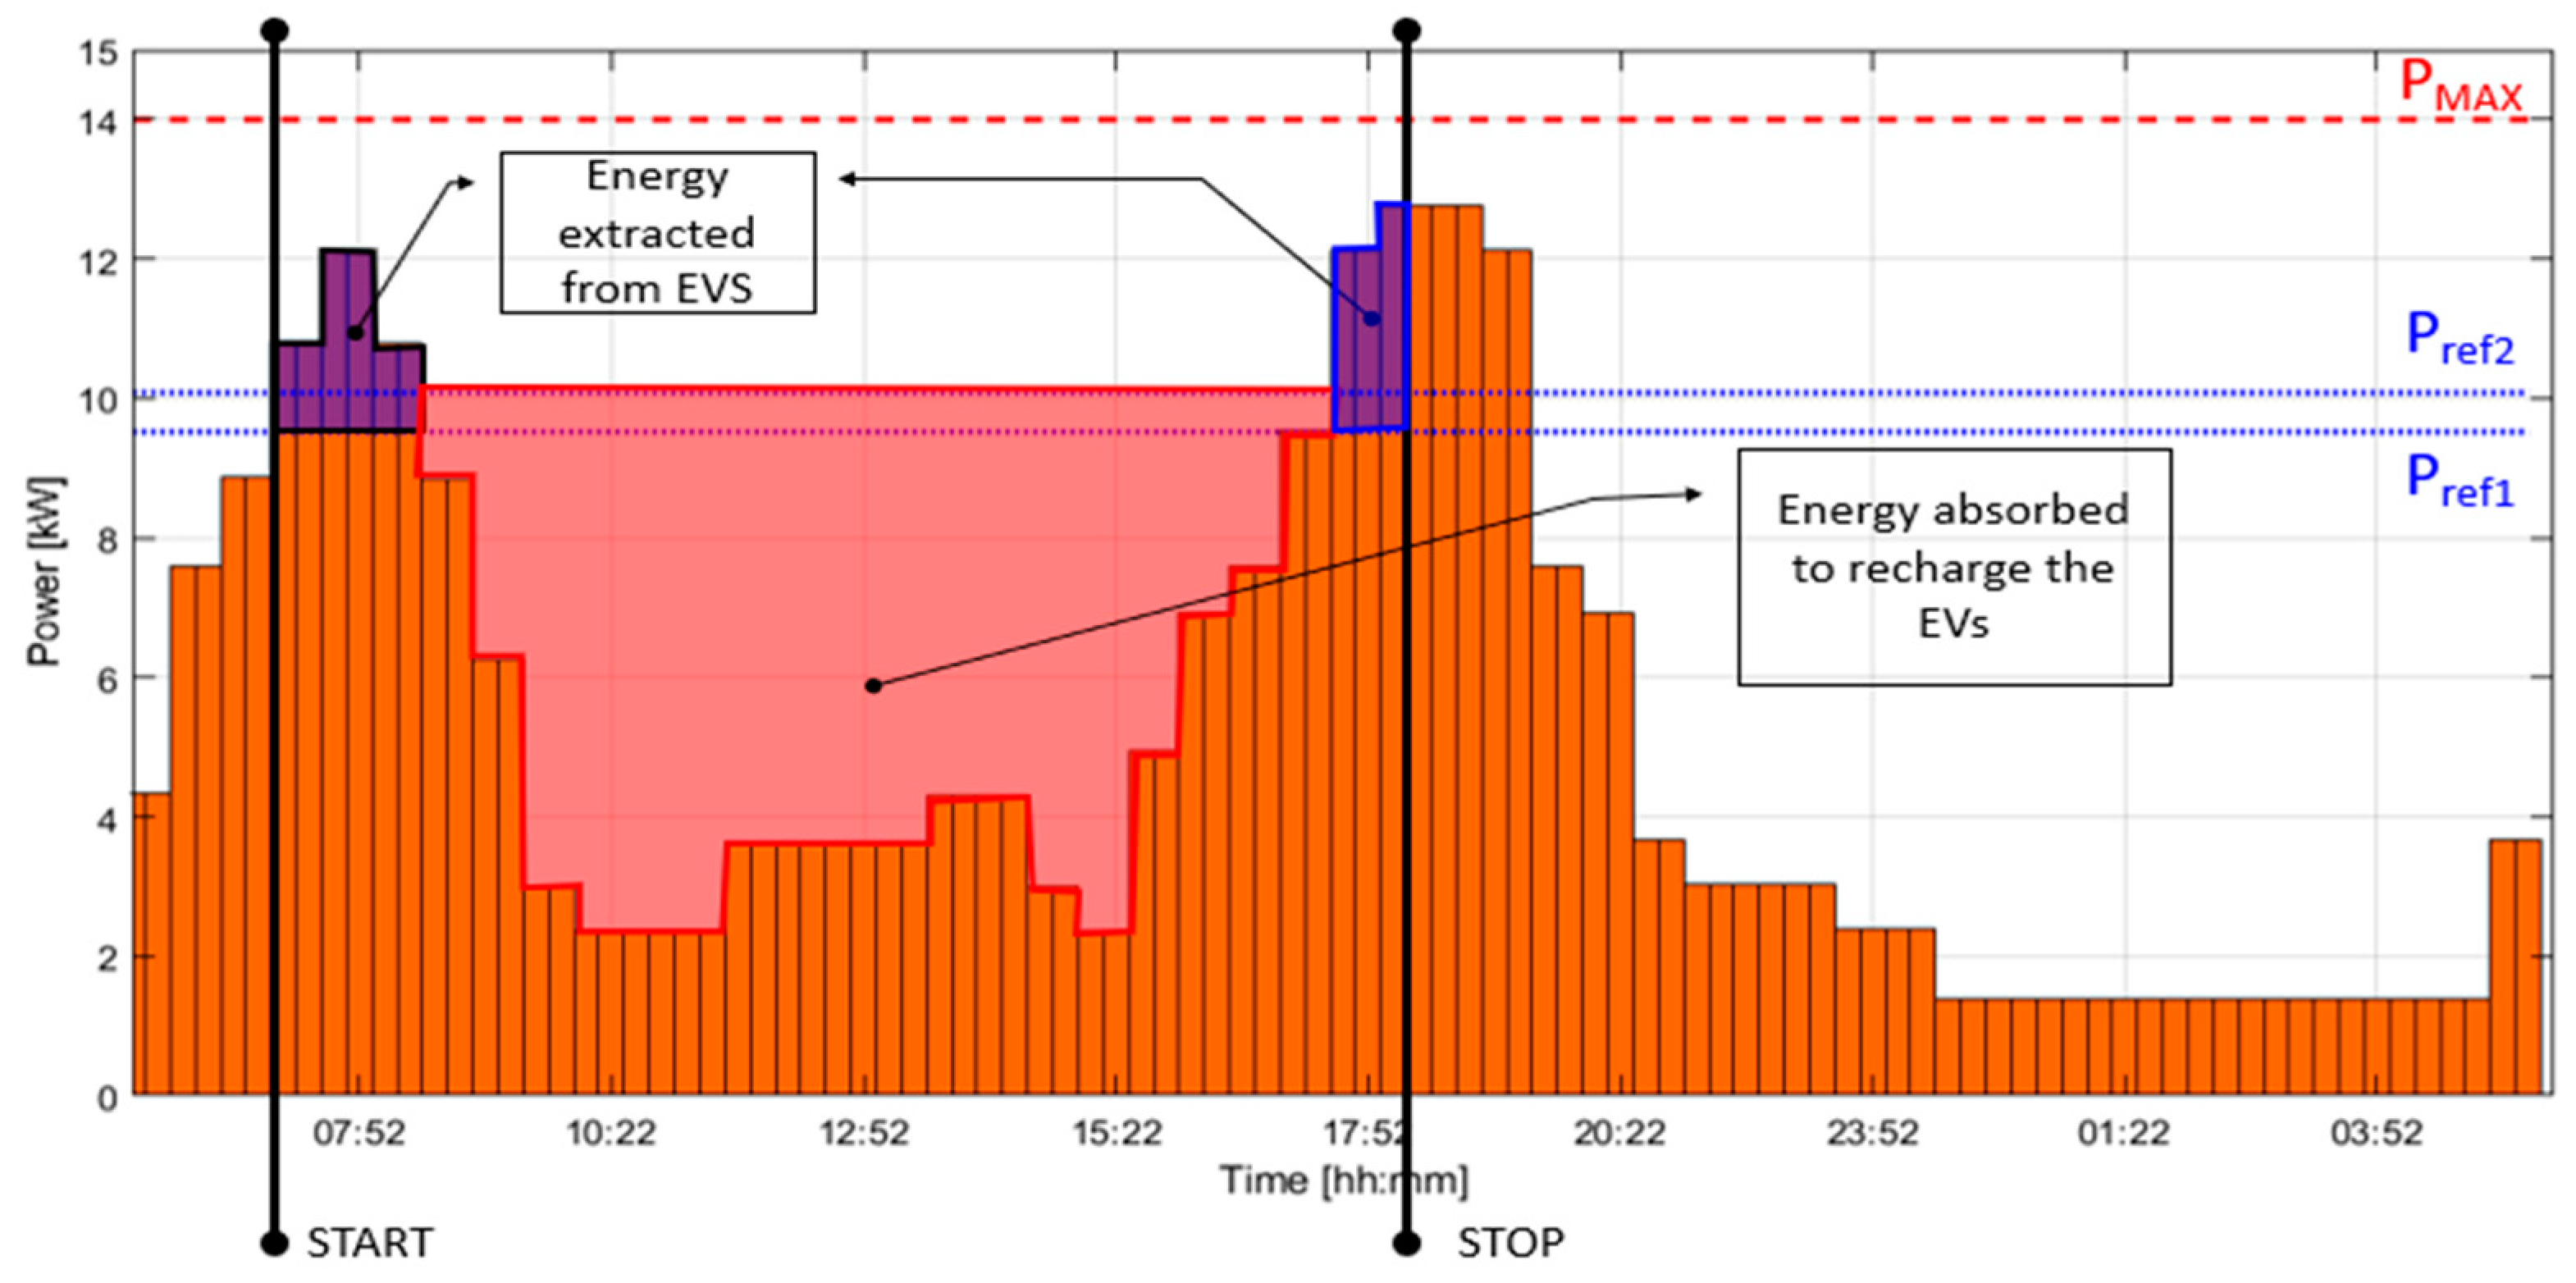
Figure 21.
Comparison between the old load curve and the new load curve.

Figure 22.
Flowchart of the “peak shaving” algorithm.

Table 1.
Electrical specification data for Nissan Leaf 2018 electric vehicle (EV) [51].
Table 1.
Electrical specification data for Nissan Leaf 2018 electric vehicle (EV) [51].
| Parameter | Value | |
|---|---|---|
| Battery capacity | 40 | [kWh] |
| Charge power/Type 2 | 6.6 | [kW], 1 or 3-phase |
| Fastcharge port/CHAdeMO type | 50 | [kW], DC |
| Input voltage | 360 | [V] |
| Vehicle consumption 1 | 236 | [Wh/km] |
1 “worst case” based on −10 °C and use of heating along a highway.
Table 2.
Overall energy absorption of the car park.
| Parameter | Basic Consumption | Consumption with EVs |
|---|---|---|
| Daily energy absorption [kWh] | 118.2 | 328.2 |
| Monthly energy absorption [MWh] | 3.55 | 9.85 |
| Annual energy absorption [MWh] | 43.1 | 119.8 |
Table 3.
String/inverter matching conditions.
| Case | String | Inverter | Condition | |
|---|---|---|---|---|
| 1 | The minimum output voltage of the string (the one corresponding to +70 °C) must be greater than the activation voltage of the inverter. | |||
| 2 | The maximum output voltage of the string (the one corresponding to −10 °C) must be lower than the maximum Maximum Power Point (MPP) input voltage tolerable by the inverter. | |||
| 3 | The maximum open circuit voltage of the string (the one corresponding to −10 °C) must be lower than the maximum input voltage tolerable by the inverter. | |||
| 4 | The sum of all the N-string currents must be lower than the maximum input current tolerable by the inverter. | |||
| 5 | The total power of the M panels connected to the inverter must be less than its nominal power |
Table 4.
String/inverter matching conditions and calculations.
| String | Inverter | ||
|---|---|---|---|
| @25°C | |||
| @25°C | |||
| @70°C | |||
| @−10°C | |||
| ✔ | @−10°C | ||
| ✔ | = 94.3 A | ||
| ✔ | |||
© 2020 by the authors. Licensee MDPI, Basel, Switzerland. This article is an open access article distributed under the terms and conditions of the Creative Commons Attribution (CC BY) license (http://creativecommons.org/licenses/by/4.0/).
Share and Cite
MDPI and ACS Style
Garruto, R.; Longo, M.; Yaïci, W.; Foiadelli, F. Connecting Parking Facilities to the Electric Grid: A Vehicle-to-Grid Feasibility Study in a Railway Station’s Car Park. Energies 2020, 13, 3083. https://doi.org/10.3390/en13123083
AMA Style
Garruto R, Longo M, Yaïci W, Foiadelli F. Connecting Parking Facilities to the Electric Grid: A Vehicle-to-Grid Feasibility Study in a Railway Station’s Car Park. Energies. 2020; 13(12):3083. https://doi.org/10.3390/en13123083
Chicago/Turabian StyleGarruto, Ruben, Michela Longo, Wahiba Yaïci, and Federica Foiadelli. 2020. "Connecting Parking Facilities to the Electric Grid: A Vehicle-to-Grid Feasibility Study in a Railway Station’s Car Park" Energies 13, no. 12: 3083. https://doi.org/10.3390/en13123083
Note that from the first issue of 2016, this journal uses article numbers instead of page numbers. See further details here.