Carbon Nanofibers Production via the Electrospinning Process


National Research and Development Institute for Cryogenics and Isotopic Technologies—ICSI Rm. Valcea, Uzinei Street no. 4, 240050 Râmnicu Vâlcea, Romania
*
Author to whom correspondence should be addressed.
Energies 2020, 13(11), 3029; https://doi.org/10.3390/en13113029
Submission received: 21 May 2020
/
Revised: 9 June 2020
/
Accepted: 10 June 2020
/
Published: 11 June 2020
(This article belongs to the Special Issue Polymer Electrolyte Membrane Fuel Cell Systems)
Abstract
:Electrospun fibers with different concentrations of polyacrylonitrile (PAN) were synthesized and the results are reported in this study. The aim was to obtain carbon nanofibers for manufacturing gas diffusion layers for proton exchange membrane (PEM) fuel cells. The electrospun fibers obtained were carbonized at 1200 °C, 1300 °C, and 1400 °C, in order to have nanofibers with more than 96% of carbon atoms. The scanning electron microscopy (SEM) results revealed an increase in the diameter from 400–700 nm at 1200 °C to 1000–1400 nm at 1300 °C and 1400 °C. The Raman measurements disclose a higher degree of crystallinity for the sample carbonized at elevated temperatures. The surface area was estimated from the Brunauer–Emmett–Teller (BET) method and the results revealed an increase from 40.69 m2g−1 to 66.89 m2g−1 and 89.92 m2g−1 as the carbonization temperature increased. Simultaneously, the pore volume increased with increasing carbonization temperature. The Fourier-transform infrared spectroscopy (FTIR) spectra reveal that during carbonization treatment, C≡N triple bonds are destroyed with the appearance of C=N double bonds. Decreasing the ID/IG intensities’ ratio from ~1.07 to ~1.00 denotes the defects reduction in carbonaceous materials due to the graphitization process. Therefore, the carbon fibers developed in optimum conditions are appropriate to be further used to produce gas diffusion layers for Proton-exchange membrane fuel cells (PEMFC).

1. Introduction
Carbon-based materials offer many scientific and technological benefits thanks to their properties and opportunities to be implemented in various fields. These materials are mainly applied in fields, such as: health, aerospace, automotive, marine, nuclear and electro-chemistry, biomedical application, and air filtration [1,2,3,4,5]. They have many important properties, such as: chemical inertia, resistance to corrosion, and the highest steadiness in a wide range of temperature into inert atmosphere (sublimates at 3900 K in standard state and liquefies at 4800 K). Moreover, the low density of carbon in carbon-based materials, in contrast with metals and mixed metal, make them appropriate for various applications. Different structures are available nowadays for the carbon-based materials: foams, nanofibers, nanotubes, and matrix composites [6,7,8].
Carbon nanofibers (CNF) show outstanding mechanical and electro-chemical properties and present capability for a wide category of applications, like superconductor applications, batteries, and catalyst supports. Polyacrylonitrile (PAN) is the most used precursor for the production of carbon-based nanofibers presenting pore dimensions from nanometers to micrometers, large surface area, and good electrical conductivity [9]. Moreover, carbon nanofibers present the advantage of being cheap compared to carbon nanotubes. Therefore, such materials can be used in some areas, comprising hardening materials, catalytic supports, heat-resistant filters, orthopedic prostheses, etc. [10,11,12,13].
One method to produce carbon-based nanofibers is the classically chemical vapor deposition (CVD) or plasma enhanced chemical vapor depositing process (PECVD) that was highlighted in the last century, but involves high costs [14]. Sutasinpromprae et al. [15] suggested that the carbon nanofibers can be obtained by stabilization in oxygen, carbonization, and activation in inert atmosphere of electrospun nanofibers. The stabilization of electrospun precursors takes place in an oxygen-containing atmosphere and is the key operation step for carbon fiber production from PAN fibers [16,17,18]. The main reactions involved in the oxidative stabilization process comprise dehydrogenations and cyclizations, cyclization of the nitrile groups (C≡N), and reticulation of the molecular chains as -C=N-C=N- [19]. Faraji et al. [19] reported that the thermal treatment, heating rate, stretching of the fiber, process time, residence time, and air flow rate are the main factors influencing the stabilization process. The next step in producing carbon nanofibers is represented by the carbonization. Carbonization processes are performed in inert atmosphere and can be splitted in: two carbonization steps, at low and high temperature, and graphitization at over 2000 °C [20,21,22]. Along this process, the removal of the by-products (N2, O2, and H2) and contaminants is faster together with the increase in carbon content.
It has been found that most of the carbon nanofibers are obtained starting with the PAN precursor, which is an organic polymer, having carbon interconnection sequences. It is hard, insoluble, and has a relatively high melting point. Starting from PAN, carbon nanofibers may be produced with a high carbon content, thus creating a stable molecular structure that is stable when it is under a low temperature treatment [23]. Likewise, the rapid decomposition rate in pyrolysis of the PAN fibers does not alter the primary structure [24]. Moreover, to ensure the production of carbon nanofiber with increased performance, it is necessary to optimize the pyrolysis of PAN fibers [20].
The electrospinning technique is used to produce nanofibers that can have potential application in fuels cells, lithium-ion batteries and hydrogen storage. Zhou et al. used electrospinning to fabricate tungsten carbide nanofibers with high electrocatalytic activity for oxygen reduction reaction (ORR [25]. Likewise, Wang et al. prepared nitrogen-doped carbon nanofibers via electrospinning as an active ORR electrocatalyst [26]. In order to improve Li storage in the anodes of lithium-ion batteries (LIBs), Zhao et al. [27] prepared SnO2-ZnO nanofibers through electrospinning, which present higher electrochemical yields comparative to nanofibers containing only SnO2 due to the synergy among Sn and Zn. Additionally, PAN fibers were used for hydrogen storage and they presented a reversible capacity of 3–10 wt.% [28]. The authors assigned this high capacity to the surface morphologies during the hydrogen sorption. Furthermore, Ren et al. obtained a hydrogen storage capacity of 50% by using PAN fibers together with Zr and Cr nanocrystals supported on metal organic frameworks (MOFs) [29].
In this paper, the development of electrospun fibers via the electrospinning procedure of polymeric precursor solutions is described. The carbon nanofibers obtained will be used further to produce a gas diffusion layer (GDL) for Proton-exchange membrane fuel cells (PEMFC) applications. Thus, two important parameters, namely temperature and concentration, were chosen due to their influence on the nanofibers properties. Moreover, the quality of the carbon fibers was studied by taking into account the specific structural analysis (SEM, Brunauer–Emmett–Teller (BET) method, FTIR, elemental analysis, XRD, and Raman), in order to identify the main changes that occurred in the structure of materials.
2. Materials and Methods
2.1. Materials
The polymer considered in this study is polyacrylonitrile (PAN) (MW = 150,000 g/mol, Sigma-Aldrich, Steinheim, Germany) and N, N-dimethylformamide (DMF), 99% (Alfa Aesar, Kandel, Germany) have been used as solvent.
2.2. The Solution Preparation
Various concentrations of polymer solutions: 4%, 6%, 8%, 10%, and 12% (wt.%) of PAN dissolved in DMF were prepared. The mixtures were homogenized via sonication at 70 °C, until dissolution of the polymer, usually 4–5 h.
2.3. Electrospinning Method
For the synthesis of polymeric nanofibers a Nanofiber Electrospinning Unit from Kato Tech Co., LTD, Japan was utilized. The polymeric solution was pushed into the syringe at a constant speed of the piston. A stainless-steel needle was mounted at the end of the syringe. The electrode was connected to the needle in order to apply a high positive voltage up to 20 kV. Electric current should not fluctuate, however, 50 μA or less drain current may fluctuate during filling.
In the electrospinning technique, nanofiber spraying begins when the balance between the pressure at the tip of the needle and the applied voltage is diminished. The droplet form of the solution becomes tapered and approximately 10 μL of solution is sprayed onto the collector. Approaching the target electrode, due to electrostatic repulsion, it is subsequently transformed into fiber while evaporating the solvent. For the production of PAN fibers, a 40 mm long stainless-steel needle with 1.2 mm thickness, a target speed of 0.62 m/min, a traverse speed of 2.23 cm/min, an experimental voltage of 18 kV, and a working interval of 10 cm have been used. These parameters were optimized in our previous work [30].
The electrospun fibers were subjected to thermal treatment at 1200 °C, 1300 °C, and 1400 °C.
2.4. Physico-Chemical Characterization
The chemical composition of the samples was determined using Flash 2000/Thermo Scientific Analyzers (Thermo Fisher Scientific, Loughborough, UK) equipment. Samples were placed in tin crucibles (1–3 mg). For the quantification of C, N, and H, the combustion method was used at 950 °C. Combustion gases were separated with a Porapak column (Agilent, Santa Clara, CA, USA) heated to 70 °C. For the determination of oxygen, the pyrolysis method was used at 1050 °C. The gas is separated on an SM5A column (molecular site) (Restek, Bellefonte, PA, USA) and detected by a thermal conductivity detector (TCD). In this latter case, the samples were placed in silver crucibles.
Specific surfaces areas analysis was achieved through the BET approach by conducting nitrogen sorption measurements by means of a Quantachrome Autosorb IQ device (Quantachrome, Boynton Beach, FL, USA). Adsorption and desorption assays were conducted at 77 K after a previous degassing at 115 °C for 4 h.
Fourier-transform infrared spectroscopy (FTIR) was carried out on a robust and light-weight Agilent Cary 630 ATR-FTIR (Agilent Technologies, Inc., Santa Clara, CA, United States). This apparatus is adaptable, ingenious, and instinctive, assuring extraordinary quantitative and qualitative details for common analysis of gases, solids, and liquids. The Agilent Cary 630 FTIR affords proper results due to its characteristics, like a large variety of sample interfaces and highly efficient optics.
The microstructural investigation was achieved with a Sigma VP FEG Carl Zeiss SEM, (Zeiss, Oberkochen, Germany). The samples were arranged on a carbonic strip and then analyzed in liquid nitrogen atmosphere.
The XRD analysis was conducted through a MiniFlex 600 (Rigaku, Japan) by 40 kV and 15 mA in the 2-theta field within 10° and 90°.
For Raman spectroscopy, a Witec alpha300 + RAS system (WITec, Ulm, Germany), composed of an Ar laser (532 nm, 75 mW) in conjunction with an inverted microscope with a magnification of 100X and a dispersion system with a spectral resolution between 3 cm−1 and 5 cm−1 on a spectral range from 100 cm−1 to 3800 cm−1 was used. As a detector, a charged coupled devices (CCD) camera with an acquisition time of 5 ms was used. To improve the signal-to-noise ratio, the acquisition time varied between 5 s and 15 s.
3. Results and Discussion
Two processing parameters were taken into account for the fabrication of carbon nanofibers: solution concentration and carbonization temperature. The polymer concentrations used to make nanofibers were 4%, 6%, 8%, 10%, and 12%, respectively (wt.%). These nanofibers were carbonized at three different temperatures 1200 °C, 1300 °C, and 1400 °C, in order to notice the changes in chemical composition after thermal treatment. The outcomes presented in Table 1 illustrate that by increasing the temperature, a higher quantity of carbonaceous material is acquired (~95% for 1200 °C versus ~97% to 1300° C and 1400 °C). Simultaneously, increasing the temperature leads to a decrease in concentration of nitrogen, hydrogen, and an increase in oxygen concentration [9]. Improving the wettability of a permeable support solid will mitigate the inner concentration polarization and enhance water flow [31,32,33,34].
Further, the samples with a 12% concentration of PAN (C-5and C-10) carbonized at the three temperatures have been analyzed. From the SEM images of the carbon nanofibers after carbonization at various temperatures, it can be observed that the fiber diameter increases as the temperature increases, from 400–700 nm at 1200 °C to 1000–1400 nm and 1300 °C (Figure 1).
From Figure 1, it can be noticed that the nanofibers are separated and overlapped in different directions. Likewise, Rezende et al. [35] noted that, after the thermal treatment, some modifications in the fibers’ diameter take place mainly as a result of the elimination of unstable substances with reduced molecular weight. Additionally, a decrease of the fibers’ diameter before and after carbonization occurs as a consequence of volumetric contraction of the polymeric matter during the conversion in carbonaceous materials [34].
Figure 2 shows the Raman spectra for the samples carbonized at 1200 °C, 1300 °C, and 1400 °C in the N2 atmosphere, together with the vibration bands of D and G type related with the graphite structure-type material. The position of the D band is the same for the three samples (i.e., 1348 cm−1). For samples prepared at 1200 °C (C-5) and 1300 °C (C-10), the G band is positioned at 1576 cm−1. For the sample prepared at 1400 °C (C-15), the position of the G band is shifted to a lower value (i.e., 1568 cm−1), indicating a relaxation of the molecular orbitals at high temperatures (Table 2). This is also correlated with the lower degree of overlap of the D and G vibrational spectral lines. For samples C-5 and C-10, the ratio of ID/IG intensities is over unity (~1.07). This means that a higher ratio provides more defects on carbon-based samples. For the C-15 sample, the ID/IG intensity ratio is ~1.00 (Table 2). The decrease of the ID/IG intensities ratio from ~1.07 to ~1.00 indicates the decrease of the carbon material defects, which means that the graphitization process starts.
In Figure 3, the diffractograms corresponding to the samples calcined at 1200 °C, 1300 °C, and 1400 °C respectively, are represented on the same graph for a better visualization of the results, after removing the background component. The three diffractograms are fitted on the same hexagonal graphite crystal structure (ICDD 01-073-5918), with group crystalline symmetry R-3m. The three spectra indicate that the samples are single-phase, consistent with the crystalline structure of the graphite, with the difference that the positions, intensities, and widths of the peaks are slightly different, denoting that the degree of amorphization of the crystalline structure depends on the temperature used in carbonization process. For the sample prepared at 1200 °C, the crystal lattice constants obtained from the fit to the corresponding data are a = b = 0.2439 nm and c = 1.0596 nm. At 1300 °C, the corresponding values are a = b = 0.2431 nm and c = 1.0492 nm, respectively. Compared with the values of the lattice constants determined for the sample prepared at 1400 °C (i.e., with a = b = 0.2446 nm and c = 1.0566 nm), these values are similar in the limit Δa/a ~0.28% and respectively Δc/c ~0.99%, denoting a small impact attributed to the preparation temperature, with respect to crystalline structure. However, the intensity of the main Bragg reflection (003) is much more prominent for the diffractogram of the sample prepared at 1400 °C, indicating a higher degree of crystallinity, compared to the samples prepared at lower temperatures.
The porosity and the structure of the prepared samples were studied considering N2 physisorption isotherms and applying the Brunauer–Emmett–Teller (BET) method. The corresponding isotherms for the three samples are provided in the Figure 4. The isotherms show characteristics of type IV with a uniform H4 hysteresis loop at a relative pressure domain of 0.4–0.95, with steep adsorption/desorption branches, highlighting a good transport property between the microporous and mesoporous channels. The hysteresis loop is a consequence of various mechanisms that occur in pores between capillary condensation and evaporation processes.
The surface area estimated from the BET method was 40.69 m2g−1 (for C-5), 89.92 m2g−1 (for C-10), and 66.89 m2g−1 (C-15) (Table 3). It can be noticed an increase of the surface area as the carbonization temperature is increasing from 1200 °C to 1300 °C, followed by a decrease in surface area as the temperature is further increased to 1400 °C. At the same time, the pore volume increases with increasing carbonization temperature, i.e., the 0.044 mLg−1 value is obtained at 1400 °C (Table 3). The significant difference in pore volume between the solids treated at 1300 °C and 1400 °C can explain the smaller surface area in the case of the solids carbonized at 1400 °C.
Using the Barrett–Joyner–Halenda (BJH) method and taking into account desorption branches, we were able to evaluate the distribution of the pore size (Figure 5). We can observe a unimodal peak with a mean pore radius of 15.652 Å (C-5) and a slightly higher mean pore radius for the C-10 and C-15 samples (~17.510 Å). It can be noticed in Figure 5a that a 1200 °C carbonization temperature is not enough for releasing the mesopores. Likewise, the pore size distributions confirm the presence of both micro and mesopores, ensuring a gradual porous arrangement in developed samples.
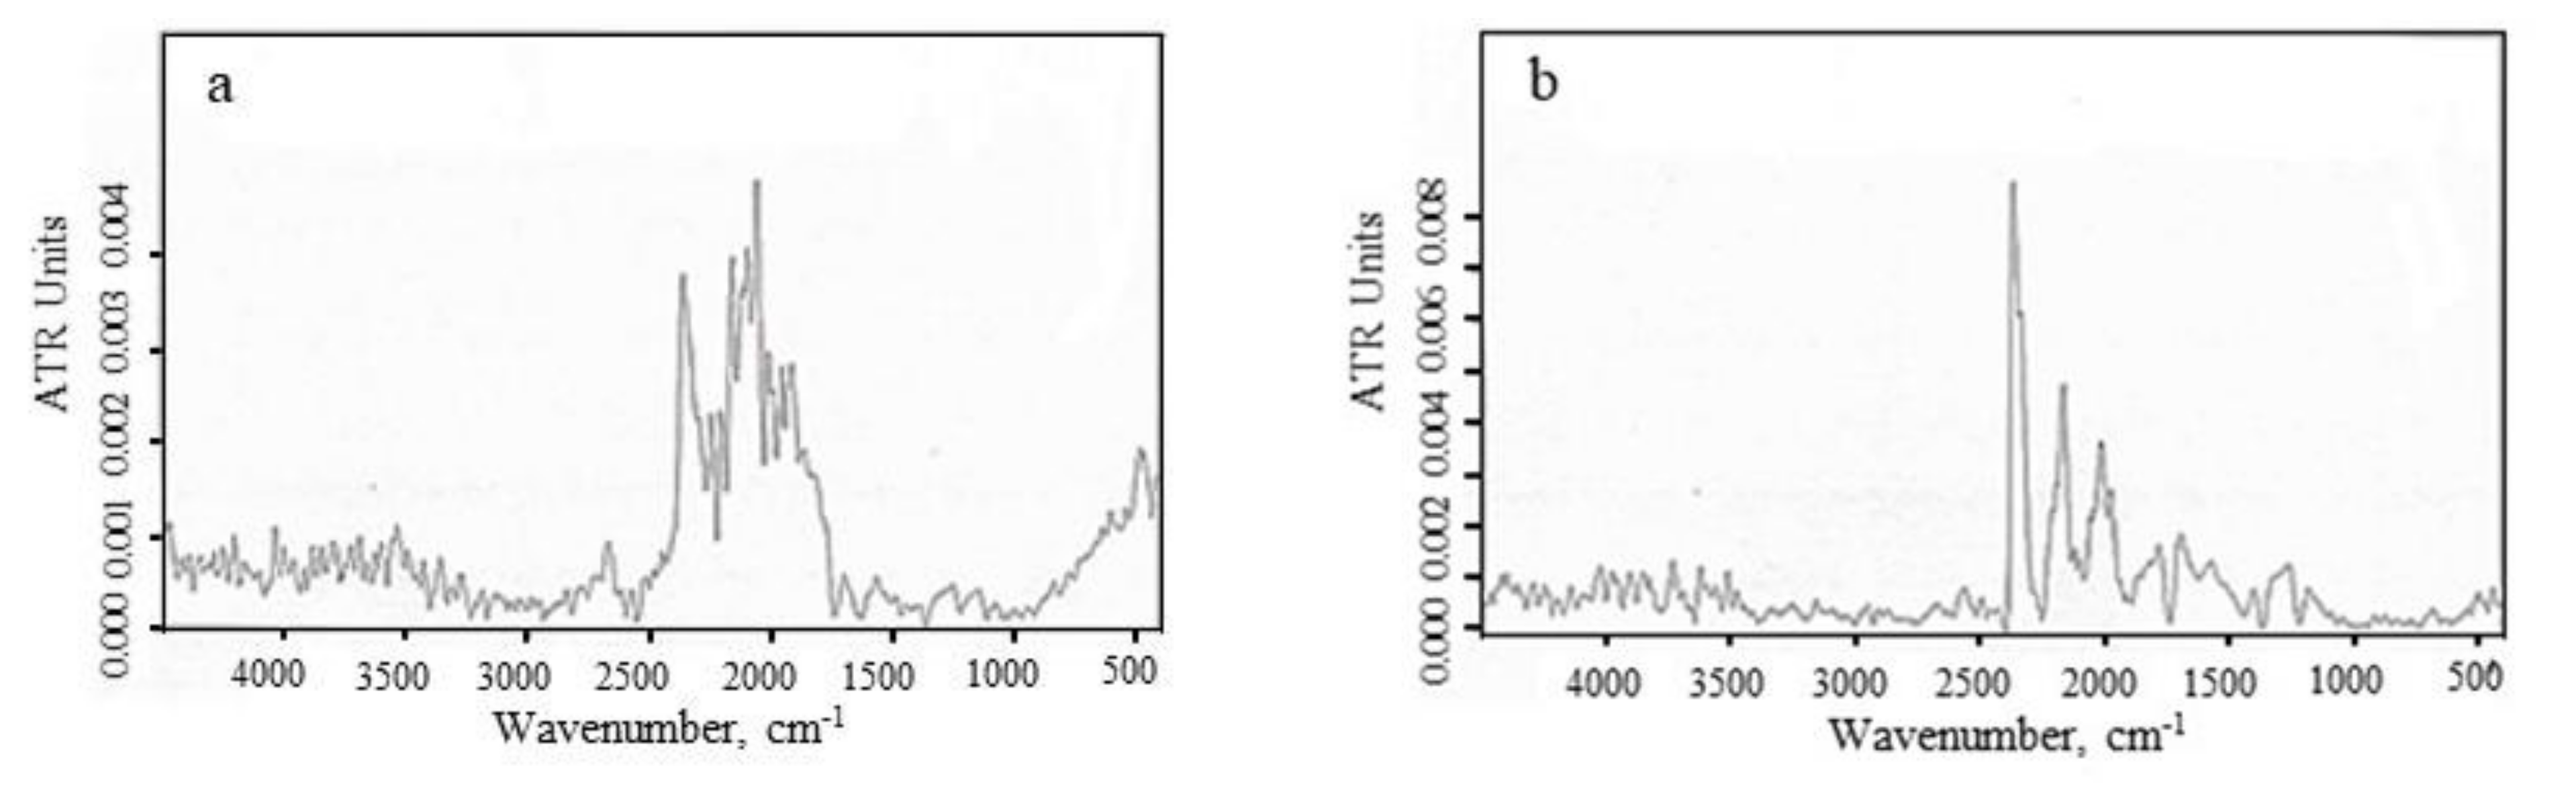
In order to evaluate the structural changes during the carbonization treatment, we conducted an FTIR analysis (Figure 6). Figure 6 presents the FTIR spectrum of the C-5 and C-15 samples. The C-N bands can be identified at ~2350 cm−1 and ~1570 cm−1. The peaks at ~1690 cm−1 are allocated to the stretching vibration assimilated to aromatic carbon and carboxyl carbon. -C≡C-H and C≡C bands show peaks at ~2100 cm−1 and ~2189 cm−1. The signal at ~2670 cm−1 is ascribed to the O=C-H stretch mode of the aldehydes. According to these data, it may be concluded that, by increasing the carbonization temperature, the C≡C bands become less important while the C=C bands become more significant [35,36,37]. The peak at around 2245 cm−1 is associated with the C≡N triple bond uptake [38,39,40]. It was concluded that during this carbonization treatment, C≡N triple bonds are destroyed with the appearance of C=N double bonds [41].
4. Conclusions
In this study, we reported the production of carbon nanofibers through the electrospinning technique, followed by proper thermal carbonization at three various temperatures, 1200 °C, 1300 °C, and 1400 °C. The following results are reported as the main findings of the study:
- An increased fiber diameter is obtained as the temperature increases, from 400–700 nm at 1200 °C to 1000–1400 nm at 1300 °C and 1400 °C. Additionally, the percentage of carbon increases from ~95% to ~97%, by increasing the heat treatment temperature. Meanwhile, the concentration of nitrogen and hydrogen decreases and the oxygen content increases as the temperature rises.
- A relaxation of the molecular orbitals at high temperatures is noticed, the G band from Raman measurements being shifted to a lower value (i.e., 1568 cm−1 at 1400 °C compared to 1576 cm−1 at 1200 °C).
- From XRD measurements, it was revealed that all diffractograms are fitted on the same hexagonal graphite crystal structure, but a higher degree of crystallinity for the sample treated at 1400 °C was obtained, as compared to the samples prepared at lower temperatures.
- The pore size distribution investigation done confirms the presence of both micro and mesopores, ensuring a gradual porous arrangement in developed samples.
- The carbon fibers developed in this study are adequate to produce gas diffusion layers (GDLs) for PEMFC applications and will be further used in our experimental work.
Author Contributions
R.D.A. wrote the manuscript, prepared the polymers solutions and obtained the carbon nanofibers. A.M. and E.M. were responsible for nitrogen sorption measurements and interpretations. S.E. conducted the XRD and Raman analysis and interpretations. E.C. was responsible for the manuscript supervising. All authors have read and agreed to the published version of the manuscript.
Funding
This work is supported by the National Agency of Scientific Research from Romania by the National Plan of R&D, Project No. PN 19 11 02 01.
Acknowledgments
We are grateful to F. Bucura, A. Zaharoiu, and M. Constantinescu for their help in elemental analysis, and to A. Soare for her help in the SEM analysis.
Conflicts of Interest
The authors declare no conflict of interest.
References
- Strelko, V.V.; Stavitskaya, S.S.; Gorlov, Y.I. Proton catalysis with active carbons and partially pyrolyzed carbonaceous materials. Chin. J. Catal. 2014, 35, 815–823. [Google Scholar] [CrossRef]
- Gao, S.; Tang, G.; Hua, D.; Xiong, R.; Han, J.; Jiang, S.; Zhang, Q.; Huang, C. Stimuli-responsive bio-based polymeric systems and their applications. J. Mater. Chem. B 2019, 7, 709–729. [Google Scholar] [CrossRef] [PubMed]
- Hua, D.; Liu, Z.; Wang, F.; Gao, B.; Chen, F.; Zhang, Q.; Xiong, R.; Han, J.; Samal, S.K.; De Smedt, S.C.; et al. pH responsive polyurethane (core) and cellulose acetate phthalate (shell) electrospun fibers for intravaginal drug delivery. Carbohydr. Polym. 2016, 151, 1240–1244. [Google Scholar] [CrossRef] [PubMed] [Green Version]
- Lv, D.; Wang, R.; Tang, G.; Mou, Z.; Lei, J.; Han, J.; De Smedt, S.; Xiong, R.; Huang, C. Ecofriendly Electrospun Membranes Loaded with Visible-Light-Responding Nanoparticles for Multifunctional Usages: Highly Efficient Air Filtration, Dye Scavenging, and Bactericidal Activity. ACS Appl. Mater. Interfaces 2019, 11, 12880–12889. [Google Scholar] [CrossRef] [PubMed] [Green Version]
- Zhu, M.; Han, J.; Wang, F.; Shao, W.; Xiong, R.; Zhang, Q.; Pan, H.; Yang, Y.; Samal, S.K.; Zhang, F.; et al. Electrospun Nanofibers Membranes for Effective Air Filtration. Macromol. Mater. Eng. 2017, 302, 1600353–1600380. [Google Scholar] [CrossRef]
- Joshi, V.S.; Gokhale, S.P.; Patil, K.R.; Haram, S. Fabrication, characterization and electrochemical performance of single strand carbon fiber prepared by catalytic chemical vapor decomposition method. Electrochem. Acta 2012, 55, 2022–2028. [Google Scholar] [CrossRef]
- Wang, Q.; Han, X.H.; Sommers, A.; Park, Y.; Joen, C.T.; Jacobi, A. A review on application of carbonaceous materials and carbon matrix composites for heat exchangers and heat sinks. Int. J. Refrig. 2012, 35, 7–26. [Google Scholar] [CrossRef]
- Tsai, H.Y.; Tseng, P.T. Field emission characteristics of diamond nano-tip array fabricated by anodic aluminium oxide template with nano-conical holes. Appl. Surf. Sci. 2015, 351, 1004–1011. [Google Scholar] [CrossRef]
- Gergin, I.; Ismar, E.; Sarac, A.S. Oxidative stabilization of polyacrylonitrile nanofibers and carbon nanofibers containing graphene oxide (GO): A spectroscopic and electrochemical study. Beilstein J. Nanotechnol. 1616, 8, 1616–1628. [Google Scholar] [CrossRef] [Green Version]
- Liu, C.K.; Feng, Y.; He, H.J.; Zhang, J.; Sun, R.J.; Chen, M.Y. Effect of carbonization temperature on properties of aligned electrospun polyacrylonitrile carbon nanofibers. Mater. Des. 2015, 85, 483–486. [Google Scholar] [CrossRef]
- Zhu, X.; Li, J.; He, H.; Huang, M.; Zhang, X.; Wang, S. Application of nanomaterials in the bioanalytical detection of disease-relayed genes. Biosens. Bioelectron. 2015, 74, 113–133. [Google Scholar] [CrossRef] [PubMed]
- Wei, G.; Su, W.; Wei, Z.; Jing, M.; Fan, X.; Liu, J.; Yan, C. Effect of the graphitization degree for electrospun carbon nanofibers on their electrochemical activity towards VO2+/VO2+ redox couple. Electrochim. Acta 2016, 199, 147–153. [Google Scholar] [CrossRef]
- Zhang, X. An electrochemical non-enzymatic immunosensor for ultrasensitive detection of microcystin-Ir using carbon nanofibers as the matrix. Sens. Actuators B 2016, 233, 624–632. [Google Scholar] [CrossRef] [Green Version]
- Gu, S.Y.; Ren, J.; Wu, Q.L. Preparation and structures of electrospun PAN nanofibers as a precursor of carbon nanofibers. Synth. Metals 2005, 155, 157–161. [Google Scholar] [CrossRef]
- Sutasinpromprae, J.; Jitjaicham, S.; Nithitanakul, M.; Meechaisue, C.; Supaphol, P. Preparation and characterization of ultrafine electrospun polyacrylonitrile fibers and their subsequent pyrolysis to carbon fibers. Polym. Int. 2006, 55, 825–833. [Google Scholar] [CrossRef]
- Ko, T.H. Influence of continuous stabilization on the physical properties and microstructure of pan-based carbon-fibers. J. Appl. Polym. Sci. 1991, 42, 1949–1957. [Google Scholar] [CrossRef]
- Shokuhfar, A.; Sedghi, A.; Farsani, R.E. Effect of thermal characteristics of commercial and special polyacrylonitrile fibres on the fabrication of carbon fibres. Mater. Sci. Technol. 2006, 22, 1235–1239. [Google Scholar] [CrossRef]
- Yusof, N.; Ismail, A.F. Post spinning and pyrolysis processes of polycrylonitrile (PAN)-based carbon fiber and activated carbon fiber: A review. Anal. Appl. Pyrolysis 2012, 93, 1–13. [Google Scholar] [CrossRef]
- Faraji, S.; Yardim, M.F.; Can, D.S.; Sarac, A.S. Characterization of polyacrylonitrile, poly(acrylonitrile-co-vinyl acetate),and poly(acrylonitrile-co-itaconic acid) based activated carbonnanofibers. J. Appl. Polym. Sci. 2017, 134, 1–10. [Google Scholar] [CrossRef]
- Rahaman, M.S.A.; Ismail, A.F.; Mustafa, A. A review of heat treatment on polyacrylonitrile fiber. Polym. Degrad. Stab. 2007, 92, 1421–1432. [Google Scholar] [CrossRef] [Green Version]
- Arshad, S.N.; Naraghi, M.; Chasiotis, I. Strong carbon nanofibers from electrospun polyacrylonitrile. Carbon 2011, 49, 1710–1719. [Google Scholar] [CrossRef]
- De Almeida Coelho, N.M.; Furtado, J.L.B.; Pham-Huu, C.; Vieira, R. Carbon nanofibers: A versatile catalytic support. Mater. Res. 2008, 11, 353–357. [Google Scholar] [CrossRef] [Green Version]
- Schwartz, M. Encyclopedia of Materials, Parts, and Finishes, 2nd ed.; CRC Press: Boca Raton, FL, USA, 2002. [Google Scholar]
- Wiles, K.B. Determination of Reactivity Ratios for Acrylonitrile/Methyl Acrylate Radical Copolymerization via Nonlinear Methodologies Using Real Time FTIR. Master’s Thesis, Faculty of the Virginia Polytechnic Institute and State University, Blacksburg, VA, USA, 2002. [Google Scholar]
- Zhou, X.; Qiu, Y.; Yu, J.; Yin, J.; Gao, S. Tungsten carbide nanofibers prepared by electrospinning with high electrocatalytic activity for oxygen reduction. Int. J. Hydrogen Energy 2011, 36, 7398–7404. [Google Scholar] [CrossRef]
- Wang, S.; Dai, C.; Li, J.; Zhao, L.; Ren, Z.; Ren, Y.; Qiu, Y.; Yu, J. The effect of different nitrogen sources on the electrocatalytic properties of nitrogen-doped electrospun carbon nanofibers for the oxygen reduction reactions. Int. J. Hydrogen Energy 2015, 40, 4673–4682. [Google Scholar] [CrossRef]
- Zhao, Y.; Li, X.; Dong, L.; Yan, B.; Shan, H.; Li, D.; Sun, X. Electrospun SnO2-ZnO nanofibers with improved electrochemical performance as anode materials for lithium-ion batteries. Int. J. Hydrogen Energy 2015, 40, 14338–14344. [Google Scholar] [CrossRef]
- Srinivasan, S.S.; Ratnadurai, R.; Niemann, M.U.; Phani, A.R.; Goswami, D.Y.; Stefanakos, E.K. Reversible hydrogen storage in electrospun polyaniline fibers. Int. J. Hydrogen Energy 2010, 35, 225–230. [Google Scholar] [CrossRef]
- Ren, J.; Musyoka, N.M.; Annamalai, P.; Langmi, H.W.; North, B.C.; Mathe, M. Electrospun MOF nanofibers as hydrogen storage media. Int. J. Hydrogen Energy 2015, 40, 9382–9387. [Google Scholar] [CrossRef]
- Andrei, R.D.; Marinoiu, A.; Bucura, F.; Zaharoiu, A.; Niculescu, V.; Sisu, C.; Carcadea, E. Synthesis via electrospinning of electrospun polyacrylonitrile fibers—Preliminary Results. Prog. Cryog. Isot. Sep. 2018, 21, 81–90. [Google Scholar]
- McCutcheon, J.R.; Elimelech, M. Influence of membrane support layer hydrophobicity on water flux in osmotically driven membrane processes. J. Membr. Sci. 2008, 318, 458–466. [Google Scholar] [CrossRef]
- Arena, J.T.; McCloskey, B.; Freeman, B.D.; McCutcheon, J.R. Surface modification of thin film composite membrane support layers with dopamine: Enabling use of reverse osmosis membrane in pressure retarded osmosis. J. Membr. Sci. 2011, 375, 55–62. [Google Scholar] [CrossRef]
- Huang, L.; Bui, N.N.; Meyering, M.T.; Hamlin, T.J.; McCutcheon, J.R. Novel hydrophilic nylon 6, 6 microfiltration membrane supported thin film composite membranes for engineered osmosis. J. Membr. Sci. 2013, 437, 141–149. [Google Scholar] [CrossRef]
- Rezende, M.C.; Costa, M.L.; Botelho, E.C. Compósitos Estruturais: Tecnologia e Práctica; Artliber: São Paulo, Brazil, 2011; p. 34. [Google Scholar]
- Atuart, B. Infrared Spectroscopy: Fundamentals and Applications; John Wiley&Sons Ltd.: Hoboken, NJ, USA, 2004. [Google Scholar]
- Coates, J. Interpretation of Infrared Spectra, A Practical Approach, Encyclopedia of Analytical Chemistry; John Wiley&Sons Ltd.: Chichester, UK, 2000; p. 10815. [Google Scholar]
- Smith, B. Infrared Spectral Interpretation; CRC Press: Boca Raton, FL, USA, 1999. [Google Scholar]
- Lee, S.; Kim, J.; Ku, B.-C.; Kim, J.; Joh, H.-I. Structural Evolution of Polyacrylonitrile Fibers in Stabilization and Carbonization. Adv. Chem. Eng. Sci. 2012, 2, 275–282. [Google Scholar] [CrossRef] [Green Version]
- Kakida, H.; Tashiro, K.; Kobayashi, M. Mechanism and Kinetics of Stabilization Reaction of Polyacrylonitrile and Related Copolymers I. Relationship between Isothermal DSC Thermogram and FT/IR Spectral Change of an Acrylonitrile/Methacrylic Acid Copolymer. Polym. J. 1996, 28, 30–34. [Google Scholar] [CrossRef] [Green Version]
- Ouyang, Q.; Cheng, L.; Wang, H.; Li, K. Mechanism and kinetics of the stabilization reactions of itaconic acid-modified polyacrylonitrile. Polym. Degrad. Stab. 2008, 93, 1415–1421. [Google Scholar] [CrossRef]
- Green, K.J.; Dean, D.R.; Vaidya, U.K.; Nyairo, E. Multiscale Fiber Reinforced Composites Based on a Carbon Nanofiber/Epoxy Nanophased Polymer Matrix: Synthesis, Mechanical, and Thermomechanical Behavior. Compos. Part A: Appl. Sci. Manuf. 2009, 40, 1470–1475. [Google Scholar] [CrossRef]
Figure 1.
SEM micrographs of the electrospun fibers treated at: (a) 1200 °C; (b) 1300 °C.
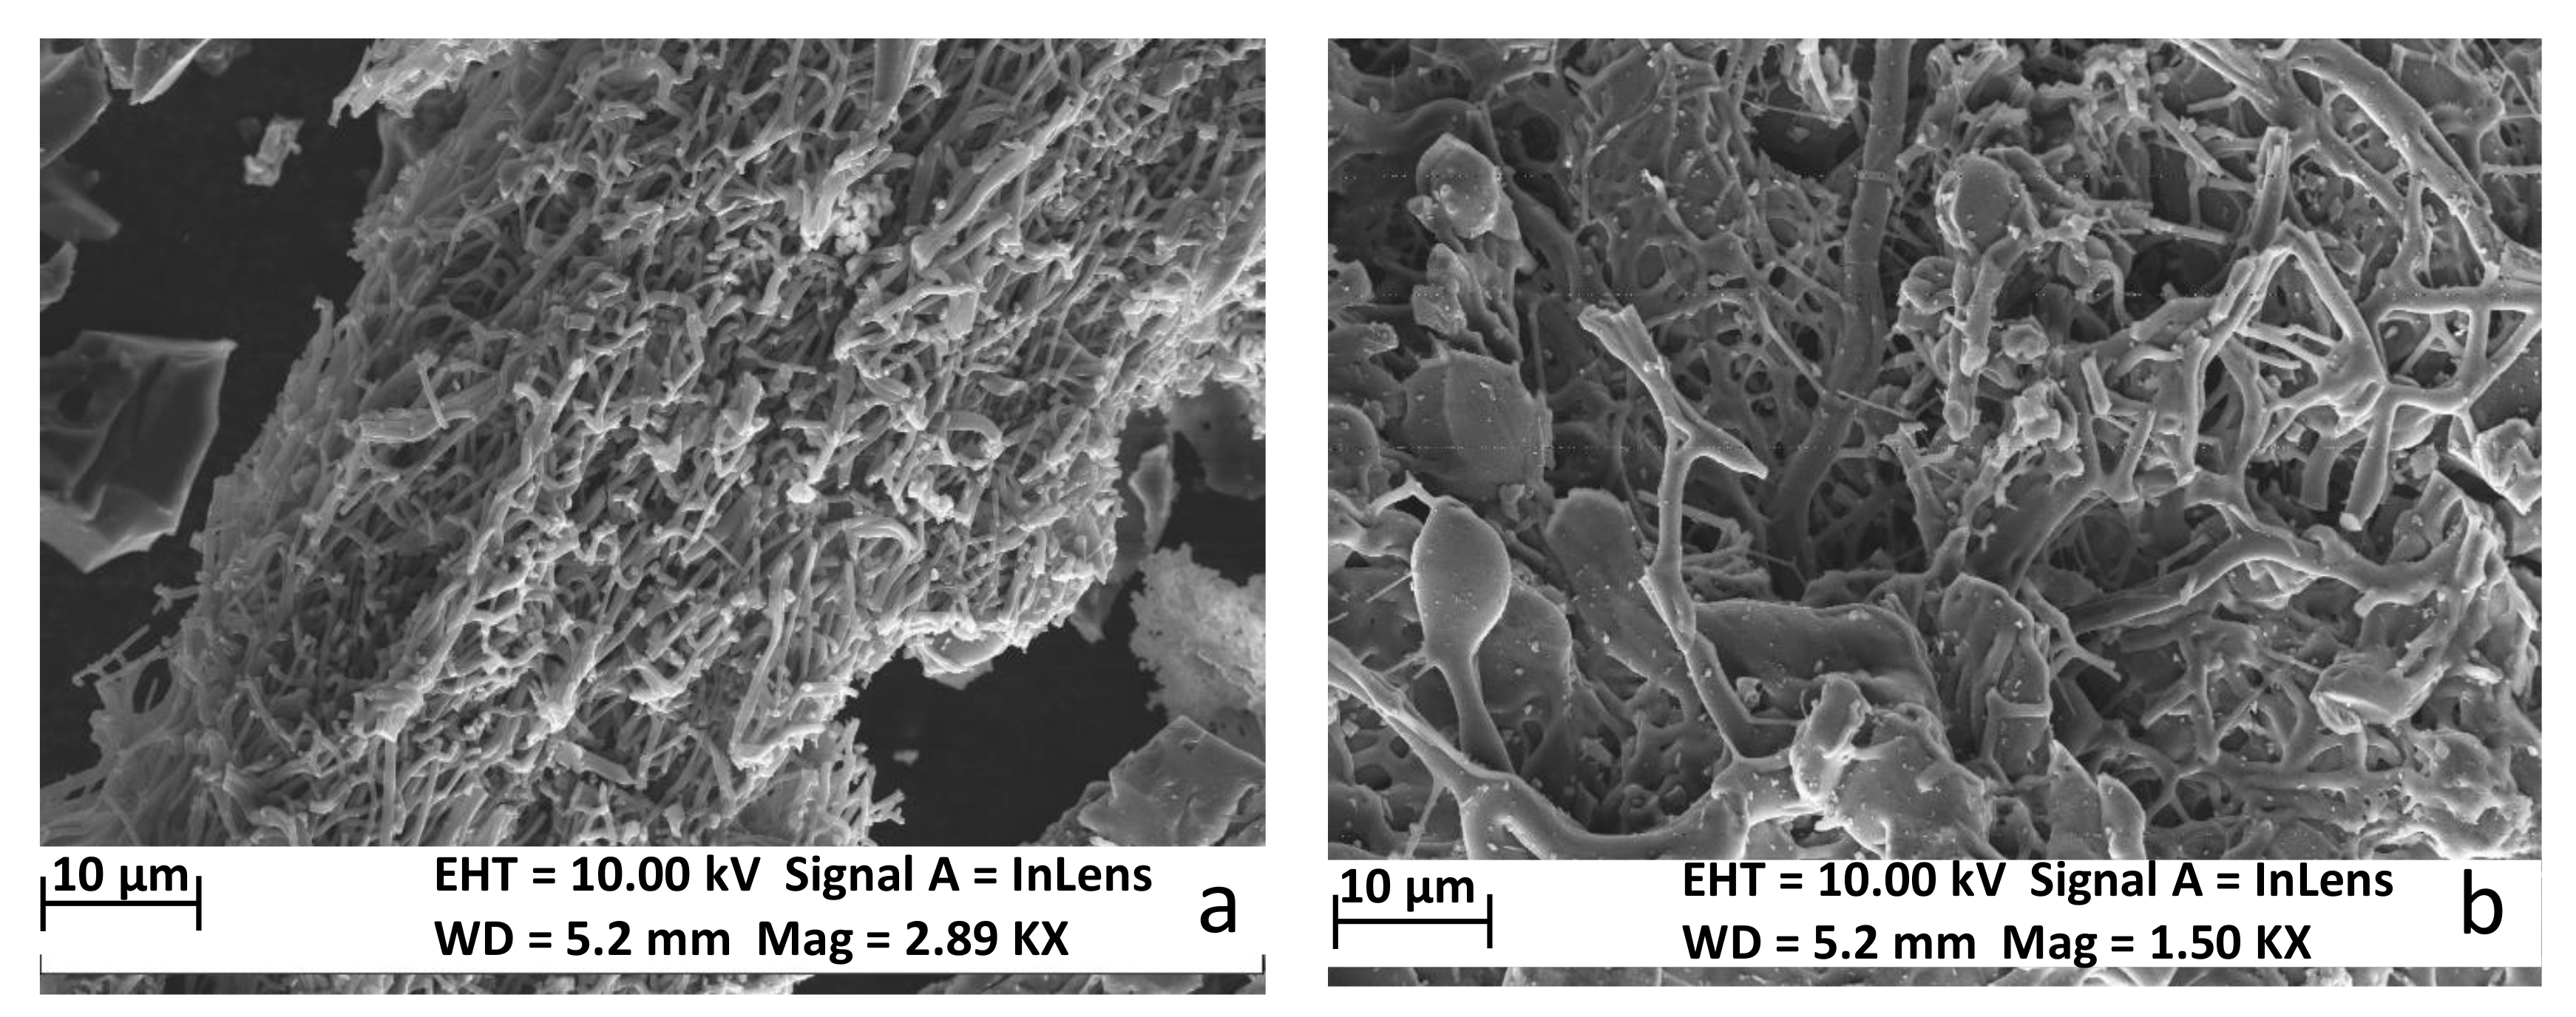
Figure 2.
Raman spectrum of the samples carbonized at 1200 °C (C-5), 1300 °C (C-10), and 1400 °C (C-15).
Figure 2.
Raman spectrum of the samples carbonized at 1200 °C (C-5), 1300 °C (C-10), and 1400 °C (C-15).
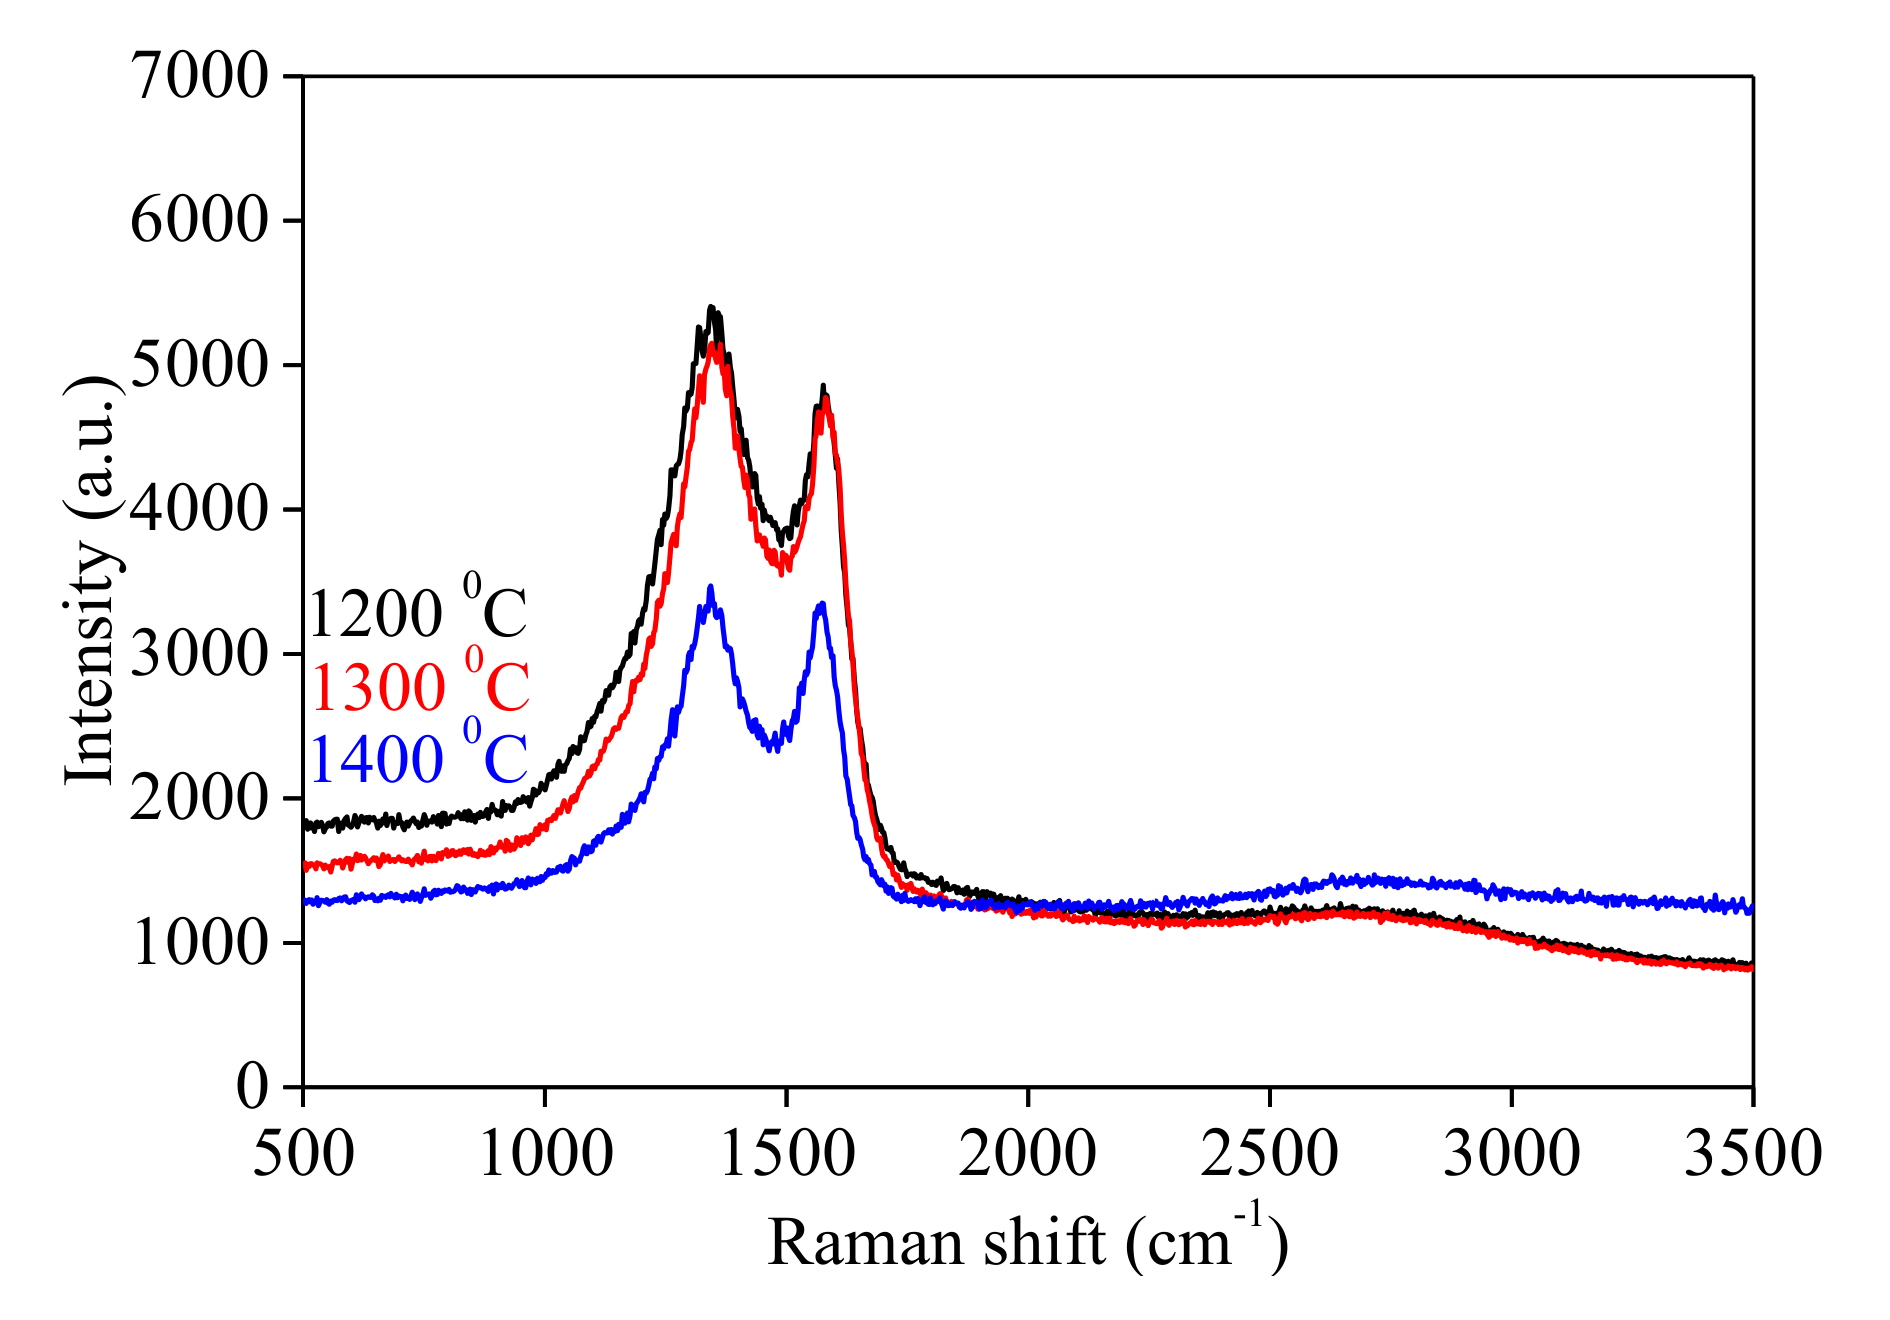
Figure 3.
X-rays difraction difractograms of the samples carbonized at 1200 °C (C-5), 1300 °C (C-10), and 1400 °C (C-15). The continuous lines are fits to data.
Figure 3.
X-rays difraction difractograms of the samples carbonized at 1200 °C (C-5), 1300 °C (C-10), and 1400 °C (C-15). The continuous lines are fits to data.

Figure 4.
N2 sorption measurements of: (a) 1200 °C (C-5); (b) 1300 °C (C-10); (c) 1400 °C (C-15) samples.
Figure 4.
N2 sorption measurements of: (a) 1200 °C (C-5); (b) 1300 °C (C-10); (c) 1400 °C (C-15) samples.

Figure 5.
Pore size distribution of: (a) 1200 °C (C-5); (b) 1300 °C (C-10); (c) 1400 °C (C-15) samples.
Figure 5.
Pore size distribution of: (a) 1200 °C (C-5); (b) 1300 °C (C-10); (c) 1400 °C (C-15) samples.
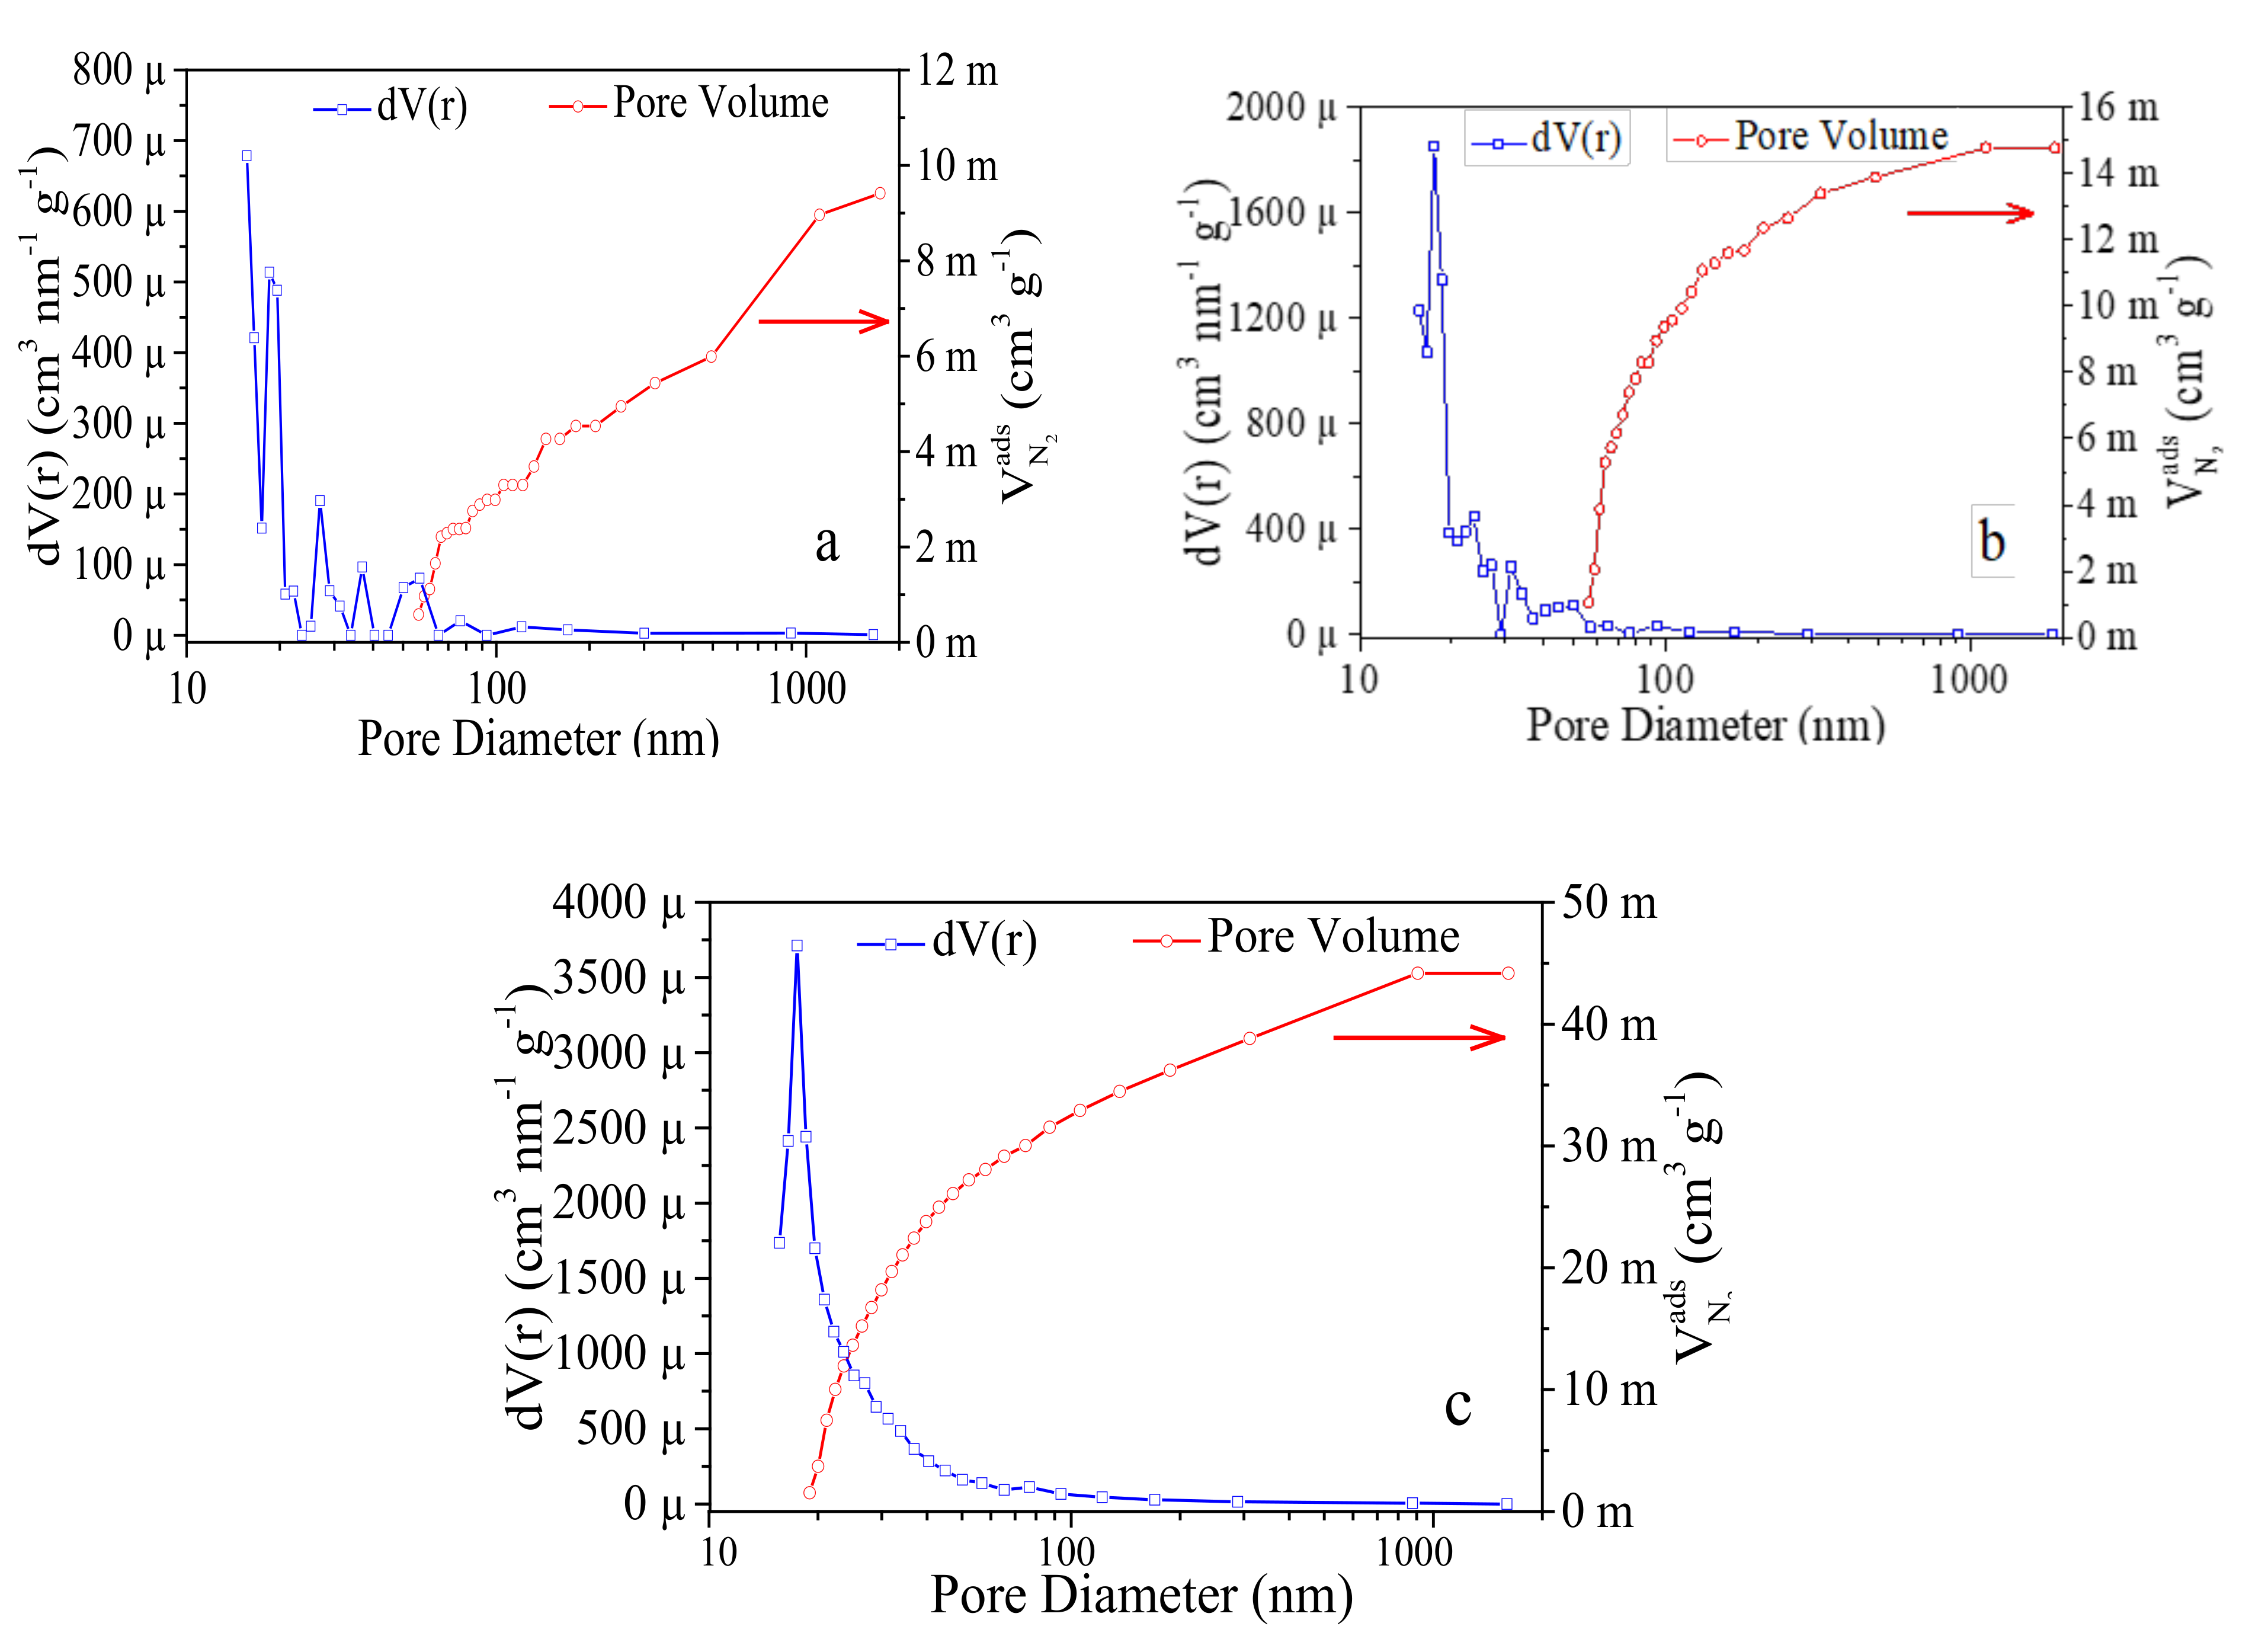
Figure 6.
FTIR spectra of: (a) 1200 °C (C-5) and (b) 1400 °C (C-15) samples.

Table 1.
Elementary composition of carbonized samples at various temperatures.
| Sample | % PAN | Thermal treatment, °C | % C | % N | % H | % O |
|---|---|---|---|---|---|---|
| C-1 | 4 | 1200 | 96.08 | 3.1 | 0.35 | 0.47 |
| C-2 | 6 | 1200 | 94.80 | 4.19 | 0.6 | 0.41 |
| C-3 | 8 | 1200 | 96.21 | 3.08 | 0.3 | 0.41 |
| C-4 | 10 | 1200 | 95.85 | 3.53 | 0.20 | 0.42 |
| C-5 | 12 | 1200 | 95.56 | 3.36 | 0.7 | 0.38 |
| C-6 | 4 | 1300 | 96.44 | 2.94 | 0.36 | 0.26 |
| C-7 | 6 | 1300 | 96.71 | 2.67 | 0.36 | 0.26 |
| C-8 | 8 | 1300 | 97.12 | 2.24 | 0.39 | 0.25 |
| C-9 | 10 | 1300 | 97.55 | 1.94 | 0.24 | 0.27 |
| C-10 | 12 | 1300 | 97.12 | 2.24 | 0.39 | 0.25 |
| C-11 | 4 | 1400 | 97.64 | 2.19 | 0.15 | 0.02 |
| C-12 | 6 | 1400 | 97.95 | 2.03 | – | 0.02 |
| C-13 | 8 | 1400 | 97.96 | 2.02 | – | 0.02 |
| C-14 | 10 | 1400 | 97.92 | 2.06 | – | 0.02 |
| C-15 | 12 | 1400 | 97.89 | 2.04 | 0.06 | 0.01 |
| PAN | 12 | - | 65.54 | 26.34 | 5.88 | 2.24 |
Moreover, increasing PAN concentration from 4% to 12% leads to small variations in the elementary composition of the samples.
Table 2.
The positions of D and G bands ant the ratio of ID/IG intensity corresponding to the heat-treated samples.
Table 2.
The positions of D and G bands ant the ratio of ID/IG intensity corresponding to the heat-treated samples.
| Sample | Thermal Treatment (°C) | D band (cm−1) | G band (cm−1) | ID/IG |
|---|---|---|---|---|
| C-5 | 1200 | 1348 ± 0.001 | 1576 ± 0.001 | 1.076 ± 0.001 |
| C-10 | 1300 | 1348 ± 0.002 | 1576 ± 0.002 | 1.072 ± 0.002 |
| C-15 | 1400 | 1348 ± 0.002 | 1568 ± 0.001 | 1.008 ± 0.002 |
Table 3.
Results of nitrogen sorption isotherms of carbonized metallic polymer structures.
| Sample | Thermal Treatment, (°C) | SBET (m2g−1) | Vtot (mLg−1) | Pore Radius (Å) |
|---|---|---|---|---|
| C-5 | 1200 | 40.69 ± 0.02 | 0.009 ± 0.001 | 15.652 ± 0.004 |
| C-10 | 1300 | 89.92 ± 0.02 | 0.015 ± 0.001 | 17.512 ± 0.004 |
| C-15 | 1400 | 66.89 ± 0.02 | 0.044 ± 0.001 | 17.504 ± 0.004 |
© 2020 by the authors. Licensee MDPI, Basel, Switzerland. This article is an open access article distributed under the terms and conditions of the Creative Commons Attribution (CC BY) license (http://creativecommons.org/licenses/by/4.0/).
Share and Cite
MDPI and ACS Style
Andrei, R.D.; Marinoiu, A.; Marin, E.; Enache, S.; Carcadea, E. Carbon Nanofibers Production via the Electrospinning Process. Energies 2020, 13, 3029. https://doi.org/10.3390/en13113029
AMA Style
Andrei RD, Marinoiu A, Marin E, Enache S, Carcadea E. Carbon Nanofibers Production via the Electrospinning Process. Energies. 2020; 13(11):3029. https://doi.org/10.3390/en13113029
Chicago/Turabian StyleAndrei, Radu Dorin, Adriana Marinoiu, Elena Marin, Stanica Enache, and Elena Carcadea. 2020. "Carbon Nanofibers Production via the Electrospinning Process" Energies 13, no. 11: 3029. https://doi.org/10.3390/en13113029
Note that from the first issue of 2016, this journal uses article numbers instead of page numbers. See further details here.