Cooperative Demand Response Framework for a Smart Community Targeting Renewables: Testbed Implementation and Performance Evaluation


Department of Electronics, University of Alcala, Alcala de Henares, 28805 Madrid, Spain
*
Author to whom correspondence should be addressed.
Energies 2020, 13(11), 2910; https://doi.org/10.3390/en13112910
Submission received: 21 April 2020
/
Revised: 27 May 2020
/
Accepted: 30 May 2020
/
Published: 5 June 2020
(This article belongs to the Special Issue Green and Smart Energy and the Bid to Reconcile Climate Change and Growth Prospects)
Abstract
:Demand response (DR) is emerging as the workhorse of achieving energy efficiency and reducing our carbon footprint, which persists as a major challenge amongst all the different energy-chain players, i.e., the utility providers, policy makers, consumers, and the technology sector. For instance, the Internet-of-Things (IoT) paradigm and network-enabled appliances/devices have escalated the expectations of what technology could do for the acceptance of DR programs. In this work, we design, deploy on a scalable pilot testbed, and evaluate a collaboration-based approach to the demand-side management of a community of electricity consumers that jointly targets green consumption. The design of the framework architecture is centralized via the so-called aggregator, which optimizes the demand scheduled by consumers along with their time frame preferences towards the maximization of the consumption of renewables. On the pilot, we opt for lightweight, yet efficient platforms such as Raspberry Pi boards, and evaluate them over a series of network protocols, i.e., MQTT-TLS and CoAP-DTLS, paying special attention to the security and privacy of the communications over Z-Wave, ZigBee, and WiFi. The experiments conducted are configured using two active Living Labs datasets from which we extract three community scenarios that vary according to the flexibility or rigidity of the appliances’ operation time frame demand. During the performance evaluation, processing and communication overheads lie within feasible ranges, i.e., the aggregator requires less than 2 s to schedule a small consumer community with four appliances, whereas the latency of its link to households’ controllers adds less than 100 ms. In addition, we demonstrate that our implementations running over WiFi links and UDP sockets on Raspberry Pi 4 boards are fast, though insecure. By contrast, secure CoAP (with DTLS) offers data encryption, automatic key management, and integrity protection, as well as authentication with acceptable overheads.
1. Introduction
Today, the growing demand from the public for access to clean energy is posing one of the biggest challenges for many utilities that are moving beyond deciding whether or not to prioritize a switch to renewable sources [1]. For instance, consumers’ lifestyle choices, such as hybrid/electric vehicles, diets from sustainable food agriculture, and/or energy-efficient habits, are reflecting the new reality of green energy. In addition, governments and policy makers are providing program support, e.g., appliance retrofitting, tax credits, and other incentives, to promote energy efficiency in households, public and municipal facilities, residential and commercial buildings, and industry [2]. For example, rate changes and price transparency form part of a larger suite of approaches to deliver and encourage energy efficiency by encouraging consumers to understand their rates and energy usage [3].
In the smart, energy-efficient home, consumer engagement is commonly promoted by financial incentives [4]; consumers respond to increases in energy prices by changing energy usage behavior, as well as by investing in energy-saving technologies and practices [5,6]. The Internet-of-Things (IoT) technology and applications, such as in the smart home, are driving multiple opportunities not only to increase residential energy efficiency and peak demand reduction, but also to expand grid assets as a cyber-physical system [7]. Indeed, network-enabled appliances and user devices have escalated the expectations of what technology can do for energy efficiency, e.g., bill reduction, household comfort, and safety enhancement [8,9]. Moreover, the emergence of low cost platforms has also enabled the implementation of a series of home controllers to obtain consumption data, generate demand/load profiles, and control smart appliances [10,11]. For example, the architecture of a smart home Energy Management System (EMS) proposed in [12] simultaneously monitors both energy consumption and renewable energy generation over ZigBee and Power Line Communications (PLC). A remote energy management server aggregates the energy data from numerous home systems for statistics and data analytics. Furthermore, the test bench described in [13,14] uses low performance processing platforms to emulate four smart homes and generate energy demand profiles from datasets produced by monitoring campaigns. This test bench implements a demand forecasting method based on an optimization algorithm that tends to reduce the uncertainty of renewable generation and the power exchanged between the consumers and the utility. Other testbed pilots such as in Belgium [15], Shanghai [16,17], The Netherlands [18,19], and others [4] have measured the time flexibility of smart appliances, electricity consumption feedback from in-home displays, performance indicators for recognizing patterns, and the effectiveness of price incentives, respectively.
Although the consumer community could also benefit from any of the aforementioned achievements, they look at the problem on a household scale. By contrast, we believe that the cooperation amongst groups of consumer communities towards common goals can indeed catapult the acceptance of energy efficiency programs such as Demand Response (DR) [20,21] and the slow advance of microgeneration [22]. Figure 1 depicts the main objectives and technical players involved in the development of energy efficient communities emphasizing the evolution of the role and engagement of both utilities and consumers in response to new energy system structures and policies, technology innovation, and expectations. Indeed, emerging digitalization and secure IoT innovations for monitoring and balance of supply and demand enable consumers to be much more active participants in the electricity market and will help them pursue not only bill reduction, but also sustainability goals. On the one hand, the improvement of building energy efficiency involves reducing the total energy consumption of buildings, reducing the peak energy demand, the energy cost of EV charging and other fixed building energy load, and also, leveraging renewable energy sources. The approach in [23] co-scheduled multiple energy sources such as grid electricity, on-site fuel cell generators, solar, wind, and battery storage along with the control of the building HVAC (Heating, Ventilation, and Air Conditioning) system. Its implementation on an ARM processor monitored battery status, controlled charging and discharging at the circuit level, and provided battery protection. Another good example of new energy innovations is the application of the Geographic Information System (GIS); it can provide insights into communities’ lifestyle choices that relate to green energy, but also, it can guide location-based decisions, e.g., where to site renewable energy infrastructure [24,25,26].
On the other hand, demand-side management and DR programs have become the workhorse of achieving energy efficiency under both individual energy management and, more recently, residential (multi-consumer) scenarios [27,28,29,30,31,32]. The latter scenarios seek decentralization so as to provide highly available and scalable approaches to cooperative consumers/prosumers. In particular, the authors in [27] dealt with the lack of aggregators through smart-contracts into a blockchain environment where the participants of a community of smart-buildings iteratively proposed a forecast of their power profile (consumption and/or production) and until a consensus was collectively reached. From their simulation results, the authors showed a community of 30 buildings taking 2 h to get a reliable forecast, which also depended on the computational time of each node and other factors. Further discussion on the optimization of the day-ahead sequence, on the computational and communication costs, as well as on the network architecture of their framework would enlighten the feasibility of their decentralized approach. Blockchain technology was again the scheme applied to the distributed and secure DR program in [33]. Self-enforcing smart contracts were defined and used to implement the levels of energy demand flexibility (the expected energy demand and adjustments to its energy baseline) the prosumers may provide during DR events, associated incentive and penalty rates, as well as rules for balancing the energy demand with the energy production. From their simulations, the authors showed how the aggregated energy demand profile of all participating prosumers was shifted by 7% so as to match the expected level during high energy production peaks. Moreover, based also on simulations, residential cogeneration was scheduled in [34] considering delay intolerant and delay tolerant load demands in the community. This algorithm was based on cooperative resource sharing and assumed the existence of a central controller. Their validation however lacked addressing the consequences of non-cooperation.
In summary, this type of scenario, which requires multiple-household coordinated load scheduling, motivates our work, which aims at validating the following challenges or working assumptions:
- (i)
- The potential and acceptance of DR frameworks mostly depend on the accessibility, security, and user-friendliness of the technology that will manage the consumers’ response. The results of a consumer survey of 207 Japanese households [35] revealed that end-users in the studied pilots preferred technologies that automatically shifted their energy use. In this regard, our proposal requires minimal human intervention and relies on home controllers and a community aggregator for re-adjustments of the participants’ joint consumption and energy load reallocation. Besides, our testbed deployment opts for lightweight cost-effective hardware platforms such as Raspberry Pi boards to implement both roles/devices.
- (ii)
- Only a small fraction of a wide variety of recompiled DR frameworks has been tested in physical systems [25]. The use of data augmentation or feature extraction techniques has also barely been explored, and the use of data-driven support models should be further investigated as well. For instance, the work in [29] compared a novel DR for collaborative purposes, which was effective for a larger number of participants, but it did not state how practical the framework could be under real data validation. In our framework, the scheduling algorithm was built and evaluated considering real datasets so as to validate the feasibility and performance overheads of cooperative scenarios. In particular, we extracted three types of consumer communities according to the elasticity of the appliances’ operation time frame demand.
- (iii)
- DR has been addressed and approached from different technologies, standards, configurations, and implementations that can result in different measurement and security requirements [4,36,37]. Our system and network architecture is validated on prototypes that showcase the feasibility of our proposal under a series of network protocols and links, community scenarios (so varying the complexity of the algorithm) and consumer behaviors, and over different hardware platforms.
Hence, our work contributes to addressing these challenges as follows:
- We implement and deploy a pilot testbed of the cooperative DR framework described in [38]. The system defines a set of consumers reaching coordinated behavior through an aggregator, which implements a fair scheduler (or shared resource allocation algorithm) in response to the utility’s incoming supply from renewables. Participating households’ controllers, which connect to and control the smart appliances via wireless communications, compile a 24h vector of planned consumption per appliance in slots of 1 h of granularity. The aggregator then optimizes the preferred time intervals of operation for the community consumers’ appliances and other household devices, maximizing the consumption of the 24 h vector of available supply from renewable sources. We implement both system roles over five different hardware platforms (a laptop, Raspberry Pi 4, 3B+, and 3B boards, and an Arduino Mega board) for performance comparison. The deployment of the pilot testbed is located in the Department of Electronics (DEPECA) at the University of Alcala (Madrid, Spain).
- We analyze the computational cost involved in the centralized scheduling and compare our results with the relevant related work. In this regard, we configure a series of community settings varying the number of appliances, so the complexity of the algorithm, and extracting different consumer behaviors from two active Living Labs anonymized datasets [39,40]. In particular, we look at the appliances’ operation time frames so as to set our consumers’ preferences. The identified scenarios represent three types of consumer communities according to the tolerance or elasticity of their demands. From our experiments, the processing overhead lies within feasible ranges, i.e., the aggregator requires less than 2 s to schedule small consumer communities that involve six appliances. Measurement and comparison of performance overhead on five different hardware platforms show the Raspberry Pi 4 board being an efficient, lightweight deployment option for both home controllers and aggregator devices. Our results enhance the calculations in [14], which, implementing a similar EMS at both the household and community levels on Raspberry Pi boards, showed an execution time of 1800 s for four households.
- We analyze the communication overheads imposed by the following network protocols: sockets-UDP, MQTT (MQ Telemetry Transport, ISO/IEC PRF 20922) [41,42], the Constrained Application Protocol (CoAP) [43], and links over WiFi, ZigBee, and Z-Wave. These are chosen due to their lightweight properties regarding message size, management, and overhead. We also evaluate the security of the communication between the aggregator and home controllers adding Transport Layer Security/Datagram Transport Layer Security (TLS/DTLS). Measures on our pilot testbed demonstrate that MQTT-TLS incurs additional cost compared to CoAP-DTLS. For instance, we demonstrated that our applications running over WiFi links and UDP sockets on Raspberry Pi 4 boards are fast, though insecure. Secure CoAP (with DTLS) displays data encryption, automatic key management, and integrity protection, as well as authentication with acceptable overheads (about 200 ms). In addition, we compare our results to other studies’ simulations [44,45] and analyze MQTT [46] and CoAP libraries [47,48] over highly constrained platforms. Our study concludes that certain implementations are interoperable and faster while achieving the confidentiality and integrity of messages as, well as authentication and solving availability problems.
The reminder of the article is organized as follows. The system design and network architecture are presented in Section 2. A pilot testbed description and the evaluation of the computational and communication cost, as well as an informal security analysis are detailed in Section 3. Finally, Section 4 concludes considering some future research directions.
2. Framework Architecture
Figure 2a depicts the cooperative framework’s roles and their interaction flow, where a community of households shares a utility provider and an aggregator. Similarly, a residential building may accommodate a series of households, as illustrated in Figure 2b. At a glance, a home controller device (C-diamond) communicates via WiFi with the household connected appliances and devices and with the common aggregator (A-diamond). In the scope of the household, the home controller was implemented on a Raspberry Pi 3; the consumer interacts with this device via a mobile app, also connected through WiFi, to introduce the appliances’ load time preferences. The community aggregator, developed on a Raspberry Pi 4, is located in the proximity of consumers and communicates with the home controllers via WiFi and with the utility provider (RW-diamond). The latter represents the electricity supply from renewables, and its communication link (likely cellular 4G-5G) was not tested on our testbed. More specifically, our framework’s devices implement the network protocol stack in Figure 3. We further elaborate on these devices’ implementations in the following sections.
2.1. Home Controller
A household participating in the framework connects the smart appliances to a Raspberry Pi 3B+ board, which functions as a home controller and communicates through: (1) ZigBee [49], a protocol that counts on a low data rate and power consumption; (2) Z-Wave [50], used for short-range communication due to its low latency; and (3) WiFi, which has a high data rate and long range. We are not considering PLC here; though it performs well in smart grid applications [51], some challenges are, however, still unsolved such as IP integration or real-time communication issues [52].
This device not only handles the appliances’ operation, but it is also the gateway to the aggregator, as well as the collector of the consumer’s load time frame preference for every appliance to be scheduled. We developed an app in this regard. The home controller receives the following input data from the user app via WiFi: fixed demand f (kWh cost in standby mode), variable demand v (kWh when the appliance is on), duration in number of hours of activation, and the period , which represents the time frames of flexibility and has to be no less than , for every smart appliance identified by . This information is compiled on a bi-dimensional array (as many rows as the number of appliances; notation: ) and sent to the aggregator as shown in Figure 4.
Figure 5 illustrates the aforementioned messages between app-home controller, and home controller-aggregator. Therefore, the aggregator gathers all consumers’ demands and, considering their time preferences, generates a 24 h reallocated demand vector for every consumer’s smart appliance. Reallocated vectors are sent privately back to the corresponding controller via WiFi. A discussion on the security of the links is included in Section 3.4.
The home controller performs appliance control according to the reallocated vector without human intervention.
2.2. Aggregator
The aggregator role can be decentralized over the group of consumers following different strategies (e.g., a round robin between the involved consumers or a more complex distributed method). On our pilot testbed, we centralized the role on a single point of data collection and processing. Therefore, it centralizes the collection of the participating consumers’ electricity demand and applies a resource allocation sharing to the optimization of the joint consumption targeting the available supply from renewable sources. A Raspberry Pi 4 platform implemented the algorithm, which was coded in C++ language and compiled using Linaro toolchain Version 7.4.0. It provided the dual-band IEEE 802.11ac wireless network and the possibility to boot the Linux OP on a MicroSD card.
Figure A1 (see Appendix A) illustrates a sequence diagram with the main steps of the algorithm design. The algorithm runs every 24 h dealing with an optimization problem of local search such that, for every slot (1 h), the sum of the appliances’ consumption minimizes the depletion of the available renewable supply. A 24 h vector (in kWh) represents this supply and is sent by the utility to the aggregator daily.
There could be different possible solutions on which, for every appliance, the requested operative time in hours lies within the preferred activation period . The algorithm searches along the joint demand matrix looking for the optimal time to begin the uninterrupted operation of the every appliance during its hours and within the operating time tolerance as shown in Figure 6. The objective function in Appendix A, Figure A1, illustrates this method, which determines the optimal adjustment on , that is the matrix that minimizes the total overconsumption (in hours) of the supply at a certain time slot. Further discussion on the algorithm implementation would be beyond the scope of this paper, and we therefore refer the interested reader to [38] for details on the algorithm in pseudocode.
The interaction aggregator–utility was simulated on our testbed; we identified two types of scenarios regarding the availability and the homogeneity of the incoming supply along the day slots. Indeed, it is an influential factor on the performance of the algorithm if the power supply comes from storage, so homogeneously received by the consumer community, by contrast, it displays peaks. A further description of the identified scenarios is included in Section 3.1.
Finally, a 24 h reallocated demand vector results from the algorithm execution for every appliance; the aggregator forwards this vector privately to the corresponding consumer’s home controller that controls and monitors the appliance functioning. Backup to the app is also performed for user visualization. In terms of formal validation of the optimization algorithm, we have to remark that
In terms of formal validation of the optimization algorithm, we have to remark that our cooperative DR framework forms a coalitional game with transferable utility, which enables the study of the emergence and stability of the cooperative behavior between a community of consumers. The coalition of consumers cooperates and obtains a certain overall gain from that cooperation, i.e., jointly achieves a greener consumption of electricity. Since some consumers may contribute more to the coalition than others, it is important to decide the final distribution of generated surplus among them. Consumers can autonomously make a decision to join or leave a coalition based on well-defined individual preference relations. These preferences are based on a coalition value function that takes into account the benefits received from joining the coalition, in terms of effective supply and satisfaction of own demand, as well as the cost in terms of the deviation of final supply from the pre-planned demand scheduling. The Shapley value can provide one possible answer under this cooperative game situation by seeking the characterization of the properties and stability of the “grand coalition”, i.e., joint action of all players. It was our aim to show that the grand coalition of the community consumers was stand-alone stable if and only if no consumer was interested in leaving the cooperative agreement to adopt free rider behavior. This formal validation is out of the scope of this paper.
Regarding the design, our network architecture considered basic security capabilities desired for IoT environments, such as (i) the privacy of the transmitted data (e.g., by using cryptographic protocols), (ii) the integrity of the data to guarantee that the data have not been modified during transit, and (iii) the authentication between end parties (e.g., by using authentication protocols). Section 3.4 further elaborates on the security of the proposal. In addition, the complexity of decentralizing the aggregator role was analyzed in [53] by evaluating traffic volume and communication reliability during the home-to-home collaboration. The strategy of clustering was adopted to reduce traffic volumes. Their simulation results showed more efficient communication and reliable smart community services when the home controller communicated without intermediaries.
3. Testbed Evaluation
We deployed a pilot testbed in DEPECA as depicted in Figure 7a to validate the aforementioned architecture under a controlled environment comprised of two households and the aggregator. Smart appliances, which we emulated by smart plugs and switches, were connected to the home controller via Z-Wave, ZigBee, or WiFi, as depicted in Figure 7b. We evaluate the application-level and network-level performance (computational and communication) overheads in the following sections, starting with the analysis of the datasets used to generate our experiments and scenarios.
3.1. Dataset and Scenarios
We generated a series of scenarios for the appliances’ consumption and activation time periods, extracting this information from real datasets, i.e., UK Domestic Appliance Level Electricity (UK-DALE-2017) [39], Pecan Street Dataport [40], and Reference Energy Disaggregation Data Set (REDD) [54]. These sources gather volunteers’ energy data, previously anonymized, that contain detailed power usage information from several homes. In some cases, we needed to determine the component appliance contributions from an aggregated electricity signal so as to identify types of appliances and to approximate the power/standby usage per type. Table 1 shows extracted information for the different types of device; this feeds a pre-set configuration of the consumer app.
Preliminary results from simulations of the algorithm described in [38] helped us to identify the influential factors that impacted the final output of the algorithm in different terms such as performance time, fairness of the scheduling, as well as the indicators to extract potential consumer behaviors. For instance, we established the following three types of community scenarios:
- Scenario I.
- Flexible community, where consumers’ time preferences are relaxed, so demanded load can be satisfied for a very delay tolerant range. Figure 8a displays the aggregated demand vector at the aggregator prior to the reallocation and Figure 8d,g as a result of the optimized scheduling. The sample community, though delay tolerant, demands at similar time frames, generating peaks or overloading. However, our result from the aggregation was satisfactory in distributing the load along the different time slots and their supply.
- Scenario II.
- Rigid community, where participants demand a more selfish preferred period, thus limiting the possibilities of reallocation at the aggregator. Figure 8e,h shows how the aggregator has a low margin to adjust the demand homogeneously along the day.
- Scenario III.
- Diverse community, where demands display more heterogeneous dynamism. Figure 8f,i illustrates this behavior where the appliances’ activation preferences of the two households vary with no pattern. The aggregator is able to balance the load uniformly throughout the day.
Experiments consisting of two households with 16 appliances showed a benevolent scheduling algorithm when Scenario I was applied. Note that the appliance operative time was equally set in all scenarios. More selfish behaviors made the algorithm suffer in achieving a proportionate aggregated matrix. We elaborate further on the effects on the performance of the different scenarios in the following section.
3.2. Computational Cost
We now measure the computational time at the aggregator on our testbed deployment. We implemented the scheduling algorithm on different platforms and operative systems as shown in Table 2. We sought a cost-effective solution for our cooperative energy-efficient community, and we looked for the most reliable and scalable.
Figure 9 compares the computational cost of the scheduling process on the aggregator for the two consumers in the different scenarios of preference tolerance and size in terms of the number of appliances. The results of the algorithm in the deployment were in accordance with our prior simulations in [38], where we showed how the size of the community in the number of appliances impacted the computational cost the most. We also measured the effect of other variables, i.e., the number of consumers collaborating, the volume of fixed and/or shiftable demand, the total community load from the demanded duration, the flexibility of the preferred time interval, and the volume of available renewable supply. The performance time was feasible and suitable (19 s for scheduling 52 appliances for both Scenarios I and II) for the deployment in real settings on a Raspberry Pi board. We remark that the board temperature increased 6.90% during the optimization process, reaching up to 62 C.
Our aggregator performed efficiently for communities with very high variable demand under Scenario I. Peaks of both consumption and supply (as in Figure 8d,g), were handled in less than 3 s. Moreover, our scheduling algorithm better managed the reallocation of a rigid demand when supply came uniformly along the day (see Figure 8e). By contrast, Scenario III represents the upper bound of 4 s when dealing with irregular supply as shown in Figure 8i. Moreover, we implemented the logic of the aggregator on other platforms such as Arduino MEGA board, which presented an extra delay of about 1000 s compared to the performance on the Raspberry Pi board and limited the scheduling of large appliance number scenarios due to its variable storage of 8KB SRAM.
3.3. Communication Cost
Table 3 compiles the message structure and size of the interactions between the consumers’ app, home controller, and aggregator. We conducted a series of experiments varying the network protocol, the Quality of Service (QoS), and security requirements, as follows.
- Sockets UDP:
- We configured a communication architecture based on UDP over IEEE 802.11 and the use of sockets on our pilot testbed. Figure 10 illustrates the interaction home controller-aggregator to be analyzed.
- CoAP:
- We implemented CoAP over UDP/DTLS to guarantee message confidentially, integrity, and authentication. In particular, we used DTLS v1.2 [55] under FreeCoAP, a C library developed by targeting GNU/Linux devices using GnuTLS. Figure 11a illustrates the handshake procedure for a particular DTLS session, in which both the home controller and aggregator are equipped with certificates and private keys so as to establish a secure channel. The implementation handles reordering and loss of the packets used for the DTLS handshake (and cipher selection). Figure 11b shows a capture of the complete message sequence and how the consumer concludes with a message “Encrypted Alert” to finalize the DTLS session. We could encapsulate the application data on a single CoAP message, which was not exceeding the maximum transmission unit in IEEE 802.11 WiFi (1500 bytes); therefore, there was no need for packet fragmentation. Note that the duplicated “Application Data” message in the sniffer’s capture was neither generated by UDP, nor by our application.
- MQTT:
- Widely used between IoT devices due to its high portability and reduced footprint in terms of memory and power, we implemented MQTT over TCP port 1883 for a non-secure communication and over TCP port 8883 to add TLS. Figure 12a illustrates MQTT’s publish/subscribe model and the application data messages along with the Quality of Service (QoS) level demanded by the client. In particular, MQTT QoS Level 2, which avoids message duplication and sends acknowledgments as shown Figure 12b, was the most suitable for our framework deployment.
We measured the communication cost between consumer and aggregator over the aforementioned network protocols. Table 3 compiles the average cost, whereas Figure 13 shows the Round Trip Time (RTT) on the box plot. CoAP/DTLS proved to be faster (90 ms) than MQTT/TLS (160 ms), even though DTLS was slow due to the public key cryptography methods applied. Moreover, under congested networks, MQTT achieved an RTT of 30–100 ms under any of the QoS levels, which was an acceptable delay range over a non-secure context. We also measured the additional resources needed during the communication process in terms of processor and memory usage and chip temperature in Table 4.
3.4. Informal Security Analysis
In this section, we provide an informal analysis of the security of the proposed framework discussing several attack scenarios and forms of malicious behavior that can occur during entities’ interaction.
Eavesdropping and Related Attacks. An attacker cannot listen to the messages transmitted during the communication between the home controller and aggregator when the transport layer implements DTLS/TLS protocols; these allow parties to mutually authenticate and establish a session key under which all the communication is encrypted. Similarly, message reply attacks are prevented too since the attacker will not be able to reproduce the session by using previously exchanged information.
Message Modification Attacks. An attacker can modify some messages with the hope of altering application data sent from consumers to the aggregator, or vice versa. As in the previous case, a secure channel established between both parties prevents this situation from occurring. Nonetheless, such a modification can be detected due to it leading to an incorrect message authentication during the DTLS/TLS verification, which gives no gains for the attacker.
Message Insertion Attacks. An attacker can try to generate fake messages and insert them into the channel; it is, however, detectable as in the case of message modification.
Message Dropping Attacks. Given enough control over the network infrastructure, an attacker can try to delete some of the messages exchanged. By doing so, the only result achieved is a failure in the correct execution of the scheduling algorithm, which can be viewed as a denial of service, but it cannot enable the attacker to gain any useful information.
Impersonation Attacks. Assume that an attacker can be successful in hijacking a session between any pair of participants. Even in this case, messages exchanged among trusted peers are safe from spoofing, since they are encrypted by authenticated public keys. In other words, the attacker cannot generate the correct encryption. Note that this is a particular case of trying to exhibit malicious behavior against the other party.
Attacks Against the Public Key Authentication Process. TLS/DTLS cipher suites negotiated between the aggregator and consumers include: Elliptic Curve Diffie–Hellman (ECDHE) exchange of the asymmetric keys used for the encryption decryption of the symmetric key (in this case, the AES 128 bit key) that encrypts the data transmission on an efficient mode of operation known as Galois/Counter Mode (GCM); the Elliptic Curve Digital Signature Algorithm (ECDSA) used to authenticate the aforementioned key exchange; and the negotiated hash function SHA256. We applied the encrypt-then-MAC design that avoids some padding oracle attacks. In addition, every piece of the handshake is hashed together, and the final hash is transmitted along with the encrypted pre-master secret. The other side verifies this hash to ensure all data that was meant to be sent was received.
Assurance of Data Integrity. We assumed that the hash function could not be manipulated. Any modification on the TLS/DTLS protocol messages could be easily detected.
ID Spoofing. TLS/DTLS adds a stateless cookie sent by the server as a protection from spoofed IP addresses’ attacks. This mechanism forces the attacker/client to be able to receive the cookie.
Denial-of-Service Attacks. TLS/DTLS’s stateless cookie exchange is also a protection from possible Denial-of-Service (DoS) attacks. This mechanism, however, does not provide any defense against DoS attacks mounted from valid IP addresses. We configured the retransmission timers to handle message loss. Furthermore, whether reliability of home controllers incurs a problem, our network architecture may switch from using the WiFi-based community network to using the relatively reliable and ubiquitously available cellular network for data communication. Similarly, the availability of the aggregation device is at stake in centralized architectures.
Brute force attacks. To avoid password cracking at the home controller, default passwords and user accounts should be disabled, SSH secured, allowing access only from machines with authorized SSH keys (as for communication with the app), as well as a firewall installed and well-configured. Non-required services should be disabled as well. In addition, whenever both the controller and the aggregator act as the TLS/DTLS server, the secret value should change frequently. We refer the reader to [56] for a review of the attacks on Raspberry Pi boards and their possible countermeasures, including physical attacks.
Non-cooperative Consumer. A consumer might try to exhibit a malicious behavior by individually deviating from the framework rules, e.g., by sending an incorrect schedule or canceling his/her home controller’s control of the appliances according to the reallocated load. The aggregator is capable of detecting non-consistent consumption data of a certain consumer and remove it from consideration by computing the distance between the data to be scheduled and a consumption pattern.
Overall, we believe that TLS/DTLS protocols provide sufficient security and privacy of the communications between consumers-aggregator, though specific authentication protocols could be adopted to protect consumers’ information at the aggregator.
4. Conclusions
The development of innovative Demand Response (DR) services leverages consumers to get more control over their electricity consumption. In our proposal, residential households have the chance to cooperate towards the integration of renewable energy resource information into the community’s energy management. We implemented a new scheduling algorithm that aggregates the electricity demand of the appliances of a community of participating consumers. This aggregation of the appliances’ time frame preferences is optimized given an objective function, which is fed with the available supply from renewable sources. This algorithm, though previously presented in [38], was refined and further explained here. In this work, we described decisions made on the network architecture and hardware platforms for deploying a cost-efficient solution based on Raspberry Pi boards and network-enabled plugs and switches as retrofitted appliances. The pilot testbed deployed served to evaluate the feasibility of (i) the centralized aggregation algorithm’s overheads, (ii) the suitability of cost-effective platforms as home controllers that autonomously control the appliances, and (iii) the overheads and security of the communication links between the aggregator and the home controllers. To validate the feasibility of (i), we analyzed the pilot performance in terms of the computational and communication costs under a series of network protocols (sockets-UDP, MQTT/TLS, and CoAP/DTLS) and links (WiFi, ZigBee, and Z-Wave), community scenarios (varying the number of appliances, so the complexity of the algorithm), and consumer behaviors (regarding their preferences’ flexibility). We extracted consumption information in time frames from the Living Labs datasets in [39,40] that configured the experiments conducted on our testbed. In particular, the scenarios represented three types of consumer communities according to the flexibility or rigidity of the appliances’ operation time frame demand. Processing and communication overheads lied within feasible ranges, i.e., the aggregator required less than 2 s to schedule consumer communities with four appliances each, whereas the latency of the link with home controllers took less than 100 ms. To validate the feasibility of (ii), we implemented our framework over five different hardware platforms (a laptop, Raspberry Pi 4, 3B+, and 3B board, and an Arduino Mega board). Experiments conducted considering different sizes of consumer communities showed feasible results, the Raspberry Pi 4 board being an efficient, lightweight deployment option for both home controllers and aggregator devices. Finally, to validate the feasibility of (iii), the security of the communication between the aggregator and home controllers was analyzed and found to comply with the relevant security properties such as availability, confidentiality, and integrity. For instance, we demonstrated that our applications running over WiFi links and UDP sockets on Raspberry Pi 4 boards were fast though insecure. Secure CoAP (with DTLS) displayed data encryption, automatic key management, and integrity protection, as well as authentication with acceptable overheads (about 200 ms).
Immediate future work will focus on a deeper analysis of the consumers’ behavior so as to extract potential patterns and/or automatize the estimation of consumption by using machine learning techniques. The inclusion of microgeneration on the framework will also be considered. We are also progressing on the negotiations with some local utility providers to get their inputs from real estimations of the renewable supply. For instance, measuring consumption and energy utilization, as well as instilling energy-efficient behaviors in consumers are as necessary as promoting advances on energy utilization and therefore production and provision mechanisms with the same or bigger emphasis. We envision our cooperative DR framework and testbed to evolve towards achieving a balanced method between green energy consumption and provision. Furthermore, the study of an efficient mechanism to distribute the aggregator role is still an open issue.
Author Contributions
Conceptualization, C.C. and E.P.; methodology, C.C. and E.P.; editing and visualization, C.C. and E.P.; software, C.C.; validation, C.C.; resources C.C.; formal analysis, C.C.; investigation, C.C. and E.P.; writing, original draft preparation, C.C.; writing, review and editing, C.C., E.P., I.B., and A.G.; supervision, E.P., I.B., and A.G.; project administration, E.P.; funding acquisition, E.P. All authors read and agreed to the published version of the manuscript.
Funding
This research was funded by Comunidad Autonoma de Madrid (CAM, Spain) under Talent Attraction Grant 2017. Reference 2017-T1/TIC- 5184.
Acknowledgments
This document presented the results of the research project funded by Comunidad Autonoma de Madrid (CAM, Spain) Talent Attraction Grant 2017, Reference 2017-T1/TIC- 5184. Carlos Cruz’s second affiliation: The Institute for Physical and Information Technologies (ITEFI-CSIC, Madrid, Spain).
Conflicts of Interest
The authors declare no conflict of interest.
Abbreviations
The following abbreviations are used in this manuscript:
| Consumer number | |
| Twenty-four h supply vector from renewables | |
| Scheduled start time of the appliance | |
| Latest final time appliance | |
| Earliest start time appliance | |
| Latest final time appliance | |
| Variable demand | |
| Fixed demand | |
| Duration of the planned operation of the appliance in the next day | |
| Internet-of-Things | |
| Information and Communication Technologies | |
| Message Queuing Telemetry Transport | |
| Datagram Transport Layer Security | |
| Transport Layer Security | |
| Transmission Control Protocol | |
| User Datagram Protocol | |
| Constrained Application Protocol | |
| Round Trip Time | |
| Demand Response | |
| Demand Function | |
| Objective Function | |
| Demand-Side Management |
Appendix A. Aggregator: Design of the Cooperative Scheduling Algorithm
We include as an Appendix a more detailed design of the scheduling algorithm process. Figure A1 shows the C++ refined code for the aggregator that was initially presented and simulated in [38]. It depicts the sequence diagram of the aggregation of all consumer participants’ appliance demands and the optimization of the time frames given their preference tolerance.
The main demand function ( calls the additional functions that will search for the minimum from the maximum values of diary consumption, i.e., . This function leads the reallocation until any of the 24 slots with the remaining renewable supply in the global variable becomes null. Note that at the initial call and at every iteration given the current appliance’s consumption. When in this initialization of for any slot, the function terminates. The algorithm not only outputs the vector with the used supply from renewables, but also an additional array with the energy needed to complete the demand from fossil sources in the case of depleting the provision from renewables. Furthermore, this function outputs an array of 24 slots with the definitive supply for every appliance given the operation time demanded , the preference interval , and the available supply .
For instance, this reallocation occurs within the function (’s domains. It is responsible for searching the optimum time slot for starting the appliance’s operation. The optimization will determine how appropriate an adjustment is by minimizing the total overconsumption (in hours) of the community appliances against the available renewable supply at a certain time slot.
Figure A1.
Activity graph describing the implementation of the aggregation and optimization algorithm.
Figure A1.
Activity graph describing the implementation of the aggregation and optimization algorithm.

References
- Ponds, K.T.; Arefi, A.; Sayigh, A.; Ledwich, G. Aggregator of Demand Response for Renewable Integration and Customer Engagement: Strengths, Weaknesses, Opportunities, and Threats. Energies 2018, 11, 2391. [Google Scholar] [CrossRef] [Green Version]
- Herter, K. Residential implementation of critical-peak pricing of electricity. Energy Policy 2007, 35, 2121–2130. [Google Scholar] [CrossRef] [Green Version]
- Venizelou, V.; Makrides, G.; Efthymiou, V.; Georghiou, G.E. Methodology for deploying cost-optimum price-based demand-side management for residential prosumers. Renew. Energy 2020, 153, 228–240. [Google Scholar] [CrossRef]
- Christensen, T.H.; Friis, F.; Bettin, S.; Throndsen, W.; Ornetzeder, M.; Skjølsvold, T.M.; Ryghaug, M. The role of competences, engagement, and devices in configuring the impact of prices in energy demand response: Findings from three smart energy pilots with households. Energy Policy 2020, 137, 111142. [Google Scholar] [CrossRef]
- Shareef, H.; Ahmed, M.S.; Mohamed, A.; Al Hassan, E. Review on Home Energy Management System Considering Demand Responses, Smart Technologies, and Intelligent Controllers. IEEE Access 2018, 6, 24498–24509. [Google Scholar] [CrossRef]
- Zhou, B.; Li, W.; Chan, K.W.; Cao, Y.; Kuang, Y.; Liu, X.; Wang, X. Smart home energy management systems: Concept, configurations, and scheduling strategies. Renew. Sustain. Energy Rev. 2016, 61, 30–40. [Google Scholar] [CrossRef]
- Li, X.; Lu, R.; Liang, X.; Shen, X.; Chen, J.; Lin, X. Smart community: An internet of things application. IEEE Commun. Mag. 2011, 49, 68–75. [Google Scholar] [CrossRef]
- Lobaccaro, G.; Carlucci, S.; Löfström, E. A Review of Systems and Technologies for Smart Homes and Smart Grids. Energies 2016, 9, 348. [Google Scholar] [CrossRef] [Green Version]
- Mendes, T.D.P.; Godina, R.; Rodrigues, E.M.G.; Matias, J.C.; Catalão, J.P. Smart Home Communication Technologies and Applications: Wireless Protocol Assessment for Home Area Network Resources. Energies 2015, 8, 7279–7311. [Google Scholar] [CrossRef] [Green Version]
- Maksimović, M.; Vujović, V.; Davidović, N.; Milošević, V.; Perišić, B. Raspberry Pi as Internet of things hardware: Performances and constraints. Des. Issues 2014, 3, 8. [Google Scholar]
- Amer, M.; M El-Zonkoly, A.; Aziz, N.; M’Sirdi, N. Smart Home Energy Management System for Peak Average Ratio Reduction. Ann. Univ. Craiova 2014, 38, 180. [Google Scholar]
- Han, J.; Choi, C.S.; Park, W.K.; Lee, I.; Kim, S.H. Smart home energy management system including renewable energy based on ZigBee and PLC. IEEE Trans. Consum. Electron. 2014, 60, 198–202. [Google Scholar] [CrossRef]
- Di Piazza, M.; La Tona, G.; Luna, M.; Di Piazza, A. A two-stage Energy Management System for smart buildings reducing the impact of demand uncertainty. Energy Build. 2017, 139, 1–9. [Google Scholar] [CrossRef]
- La Tona, G.; Luna, M.; Di Piazza, A.; Di Piazza, M.C. Towards the Real-World Deployment of a Smart Home EMS: A DP Implementation on the Raspberry Pi. Appl. Sci. 2019, 9, 2120. [Google Scholar] [CrossRef] [Green Version]
- D’hulst, R.; Labeeuw, W.; Beusen, B.; Claessens, S.; Deconinck, G.; Vanthournout, K. Demand response flexibility and flexibility potential of residential smart appliances: Experiences from large pilot test in Belgium. Appl. Energy 2015, 155, 79–90. [Google Scholar] [CrossRef]
- Zhang, X.; Shen, J.; Yang, T.; Tang, L.; Wang, L.; Liu, Y.; Xu, P. Smart meter and in-home display for energy savings in residential buildings: A pilot investigation in Shanghai, China. Intell. Build. Int. 2016, 11, 4–26. [Google Scholar] [CrossRef]
- Schultz, P.W.; Estrada, M.; Schmitt, J.; Sokoloski, R.; Silva-Send, N. Using in-home displays to provide smart meter feedback about household electricity consumption: A randomized control trial comparing kilowatts, cost, and social norms. Energy 2015, 90, 351–358. [Google Scholar] [CrossRef] [Green Version]
- Gercek, C.; Schram, W.; Lampropoulos, I.; van Sark, W.; Reinders, A. A Comparison of Households’ Energy Balance in Residential Smart Grid Pilots in the Netherlands. Appl. Sci. 2019, 9, 2993. [Google Scholar] [CrossRef] [Green Version]
- Obinna, U.; Joore, P.; Wauben, L.; Reinders, A. Comparison of two residential Smart Grid pilots in the Netherlands and in the USA, focusing on energy performance and user experiences. Appl. Energy 2017, 191, 264–275. [Google Scholar] [CrossRef]
- Ayón, X.; Gruber, J.K.; Hayes, B.P.; Usaola, J.; Prodanović, M. An optimal day-ahead load scheduling approach based on the flexibility of aggregate demands. Appl. Energy 2017, 198, 1–11. [Google Scholar] [CrossRef] [Green Version]
- Lu, R.; Hong, S.H. Incentive-based demand response for smart grid with reinforcement learning and deep neural network. Appl. Energy 2019, 236, 937–949. [Google Scholar] [CrossRef]
- Iria, J.; Soares, F.; Matos, M. Optimal supply and demand bidding strategy for an aggregator of small prosumers. Appl. Energy 2018, 213, 658–669. [Google Scholar] [CrossRef]
- Wei, T.; Kim, T.; Park, S.; Zhu, Q.; Tan, S.X.D.; Chang, N.; Ula, S.; Maasoumy, M. Battery management and application for energy-efficient buildings. In Proceedings of the 51st Annual Design Automation Conference, San Francisco, CA, USA, 1–4 June 2014; pp. 1–6. [Google Scholar]
- Issi, F.; Kaplan, O. The Determination of Load Profiles and Power Consumptions of Home Appliances. Energies 2018, 11, 607. [Google Scholar] [CrossRef] [Green Version]
- Vázquez-Canteli, J.R.; Nagy, Z. Reinforcement learning for demand response: A review of algorithms and modeling techniques. Appl. Energy 2019, 235, 1072–1089. [Google Scholar] [CrossRef]
- Fan, S.; He, G.; Jia, K.; Wang, Z. A novel distributed large-scale demand response scheme in high proportion renewable energy sources integration power systems. Appl. Sci. 2018, 8, 452. [Google Scholar] [CrossRef] [Green Version]
- Cutsem, O.V.; Dac, D.H.; Boudou, P.; Kayal, M. Cooperative energy management of a community of smart-buildings: A Blockchain approach. Int. J. Electr. Power Energy Syst. 2020, 117, 105643. [Google Scholar] [CrossRef]
- Rajasekhar, B.; Pindoriya, N.; Tushar, W.; Yuen, C. Collaborative Energy Management for a Residential Community: A Non-Cooperative and Evolutionary Approach. IEEE Trans. Emerg. Top. Comput. Intell. 2019, 3, 177–192. [Google Scholar] [CrossRef]
- Zehir, M.A.; Wevers, M.H.; Batman, A.; Bagriyanik, M.; Hurink, J.L.; Kucuk, U.; Soares, F.J.; Ozdemir, A. A novel incentive-based retail demand response program for collaborative participation of small customers. In Proceedings of the 2017 IEEE Manchester PowerTech, Manchester, UK, 18–22 June 2017; pp. 1–6. [Google Scholar]
- Shakouri, G.; Kazemi, A. Multi-objective cost-load optimization for demand-side management of a residential area in smart grids. Sustain. Cities Soc. 2017, 32, 171–180. [Google Scholar] [CrossRef]
- Sattarpour, T.; Nazarpour, D.; Golshannavaz, S. A multi-objective HEM strategy for smart home energy scheduling: A collaborative approach to support microgrid operation. Sustain. Cities Soc. 2018, 37, 26–33. [Google Scholar] [CrossRef]
- Yahia, Z.; Pradhan, A. Multi-objective optimization of household appliance scheduling problem considering consumer preference and peak load reduction. Sustain. Cities Soc. 2020, 55, 102058. [Google Scholar] [CrossRef]
- Pop, C.; Cioara, T.; Antal, M.; Anghel, I.; Salomie, I.; Bertoncini, M. Blockchain based decentralized management of demand response programs in smart energy grids. Sensors 2018, 18, 162. [Google Scholar] [CrossRef] [PubMed] [Green Version]
- Cao, Y.; Zhang, G.; Li, D.; Wang, L.; Li, Z. Online Energy Management and Heterogeneous Task Scheduling for Smart Communities with Residential Cogeneration and Renewable Energy. Energies 2018, 11, 2104. [Google Scholar] [CrossRef] [Green Version]
- Iliopoulos, N.; Esteban, M.; Kudo, S. Assessing the willingness of residential electricity consumers to adopt demand-side management and distributed energy resources: A case study on the Japanese market. Energy Policy 2020, 137, 111169. [Google Scholar] [CrossRef]
- Sharma, K.; Saini, L.M. Performance analysis of smart metering for smart grid: An overview. Renew. Sustain. Energy Rev. 2015, 49, 720–735. [Google Scholar] [CrossRef]
- Chui, K.T.; Lytras, M.D.; Visvizi, A. Energy sustainability in smart cities: Artificial intelligence, smart monitoring, and optimization of energy consumption. Energies 2018, 11, 2869. [Google Scholar] [CrossRef] [Green Version]
- Cruz, C.; Palomar, E.; Bravo, I.; Gardel, A. Towards Sustainable Energy-Efficient Communities Based on a Scheduling Algorithm. Sensors 2019, 19, 3973. [Google Scholar] [CrossRef] [PubMed] [Green Version]
- Kelly, J.; Knottenbelt, W. The UK-DALE dataset, domestic appliance-level electricity demand and whole-house demand from five UK homes. Sci. Data 2015, 2. [Google Scholar] [CrossRef] [Green Version]
- Dataport, P.S. Pecan Street Data. Available online: https://www.pecanstreet.org/dataport (accessed on 2 February 2020).
- Light, R. Mosquitto: Server and client implementation of the MQTT protocol. J. Open Source Softw. 2017, 2. [Google Scholar] [CrossRef]
- Kashyap, M.; Sharma, V.; Gupta, N. Taking MQTT and NodeMcu to IOT: Communication in Internet of Things. Procedia Comput. Sci. 2018, 132, 1611–1618. [Google Scholar] [CrossRef]
- CoAP. RFC 7252 Constrained Application Protocol. 2020. Available online: http://coap.technology (accessed on 11 November 2019).
- Halder, M.; Sheikh, M.N.; Rahman, M.; Rahman, M. Performance Analysis of CoAP, 6LoWPAN and RPL Routing Protocols of IoT Using COOJA Simulator. Int. J. Sci. Eng. Res. 2018, 9, 1671–1677. [Google Scholar]
- Larmo, A.; Ratilainen, A.; Saarinen, J. Impact of CoAP and MQTT on NB-IoT System Performance. Sensors 2018, 19, 7. [Google Scholar] [CrossRef] [PubMed] [Green Version]
- Dinculeană, D.; Cheng, X. Vulnerabilities and Limitations of MQTT Protocol Used between IoT Devices. Appl. Sci. 2019, 9, 848. [Google Scholar] [CrossRef] [Green Version]
- Iglesias-Urkia, M.; Orive, A.; Urbieta, A. Analysis of CoAP Implementations for Industrial Internet of Things: A Survey. Procedia Comput. Sci. 2017, 109, 188–195. [Google Scholar] [CrossRef]
- Kothmayr, T.; Schmitt, C.; Hu, W.; Bruenig, M.; Carle, G. DTLS based Security and Two-Way Authentication for the Internet of Things. Ad Hoc Netw. 2013, 11, 2710–2723. [Google Scholar] [CrossRef]
- Bilgin, B.; Gungor, V. Performance evaluations of ZigBee in different smart grid environments. Comput. Netw. 2012, 56, 2196–2205. [Google Scholar] [CrossRef]
- Mahmood, A.; Javaid, N.; Razzaq, S. A review of wireless communications for smart grid. Renew. Sustain. Energy Rev. 2015, 41, 248–260. [Google Scholar] [CrossRef]
- Saleem, Y.; Crespi, N.; Rehmani, M.H.; Copeland, R. Internet of things-aided smart grid: Technologies, architectures, applications, prototypes, and future research directions. IEEE Access 2019, 7, 62962–63003. [Google Scholar] [CrossRef]
- Yigit, M.; Gungor, V.C.; Tuna, G.; Rangoussi, M.; Fadel, E. Power line communication technologies for smart grid applications: A review of advances and challenges. Comput. Netw. 2014, 70, 366–383. [Google Scholar] [CrossRef]
- Han, J.; Park, W.; Lee, I.; Roh, H.; Kim, S. Home-to-home communications for smart community with Internet of Things. In Proceedings of the 2017 14th IEEE Annual Consumer Communications Networking Conference (CCNC), Las Vegas, NV, USA, 8–11 January 2017; pp. 720–723. [Google Scholar] [CrossRef]
- Kolter, J.; Johnson, M. REDD: A Public Data Set for Energy Disaggregation Research. Artif. Intell. 2011, 25, 59–62. [Google Scholar]
- Rescorla, E.; Modadugu, N. Datagram Transport Layer Security Version 1.2; RFC 6347; Internet Engineering Task Force (IETF): Fremont, CA, USA, 2012. [Google Scholar] [CrossRef]
- Martin, E.D.; Kargaard, J.; Sutherland, I. Raspberry Pi Malware: An Analysis of Cyberattacks Towards IoT Devices. In Proceedings of the 2019 10th International Conference on Dependable Systems, Services and Technologies (DESSERT), Leeds, UK, 5–7 June 2019; pp. 161–166. [Google Scholar]
Figure 1.
Energy-efficient communities’ main players and objectives.

Figure 2.
(a) Cooperative demand response framework for a smart community targeting renewables; (b) The residential building of a series of households containing a home controller device (C-diamond) that communicates via WiFi with the common aggregator (A-diamond).
Figure 2.
(a) Cooperative demand response framework for a smart community targeting renewables; (b) The residential building of a series of households containing a home controller device (C-diamond) that communicates via WiFi with the common aggregator (A-diamond).

Figure 3.
Protocol stack in our pilot’s device implementation.

Figure 4.
Message exchange among the system’s players.

Figure 5.
Message specification between app-home controller, home controller-aggregator, and controller-appliance.
Figure 5.
Message specification between app-home controller, home controller-aggregator, and controller-appliance.

Figure 6.
Local search on the 24 slot array of demand per appliance and their corresponding re-allocated array. Notation: .
Figure 6.
Local search on the 24 slot array of demand per appliance and their corresponding re-allocated array. Notation: .

Figure 7.
Testbed setting (a) and smart switches and the framework’s key devices (b).

Figure 8.
Aggregated vector for two consumers (loads drawn in two colors) prior to the scheduling (a,b,c) and as a result of the optimized scheduling with uniform supply (d,e,f) and uneven supply (g,h,i).
Figure 8.
Aggregated vector for two consumers (loads drawn in two colors) prior to the scheduling (a,b,c) and as a result of the optimized scheduling with uniform supply (d,e,f) and uneven supply (g,h,i).

Figure 9.
Total computational cost for two consumers in different settings regarding the number of appliances: comparison between Scenarios I and II on pilot deployment and computer simulation.
Figure 9.
Total computational cost for two consumers in different settings regarding the number of appliances: comparison between Scenarios I and II on pilot deployment and computer simulation.

Figure 10.
Consumer–aggregator UDP communication.

Figure 11.
CoAP/DTLS handshake (a) and capture of the communication (b) between consumer-aggregator. Application data are sent authenticated and encrypted with a fresh and unique session key on a single DTLS datagram over UDP/IP.
Figure 11.
CoAP/DTLS handshake (a) and capture of the communication (b) between consumer-aggregator. Application data are sent authenticated and encrypted with a fresh and unique session key on a single DTLS datagram over UDP/IP.
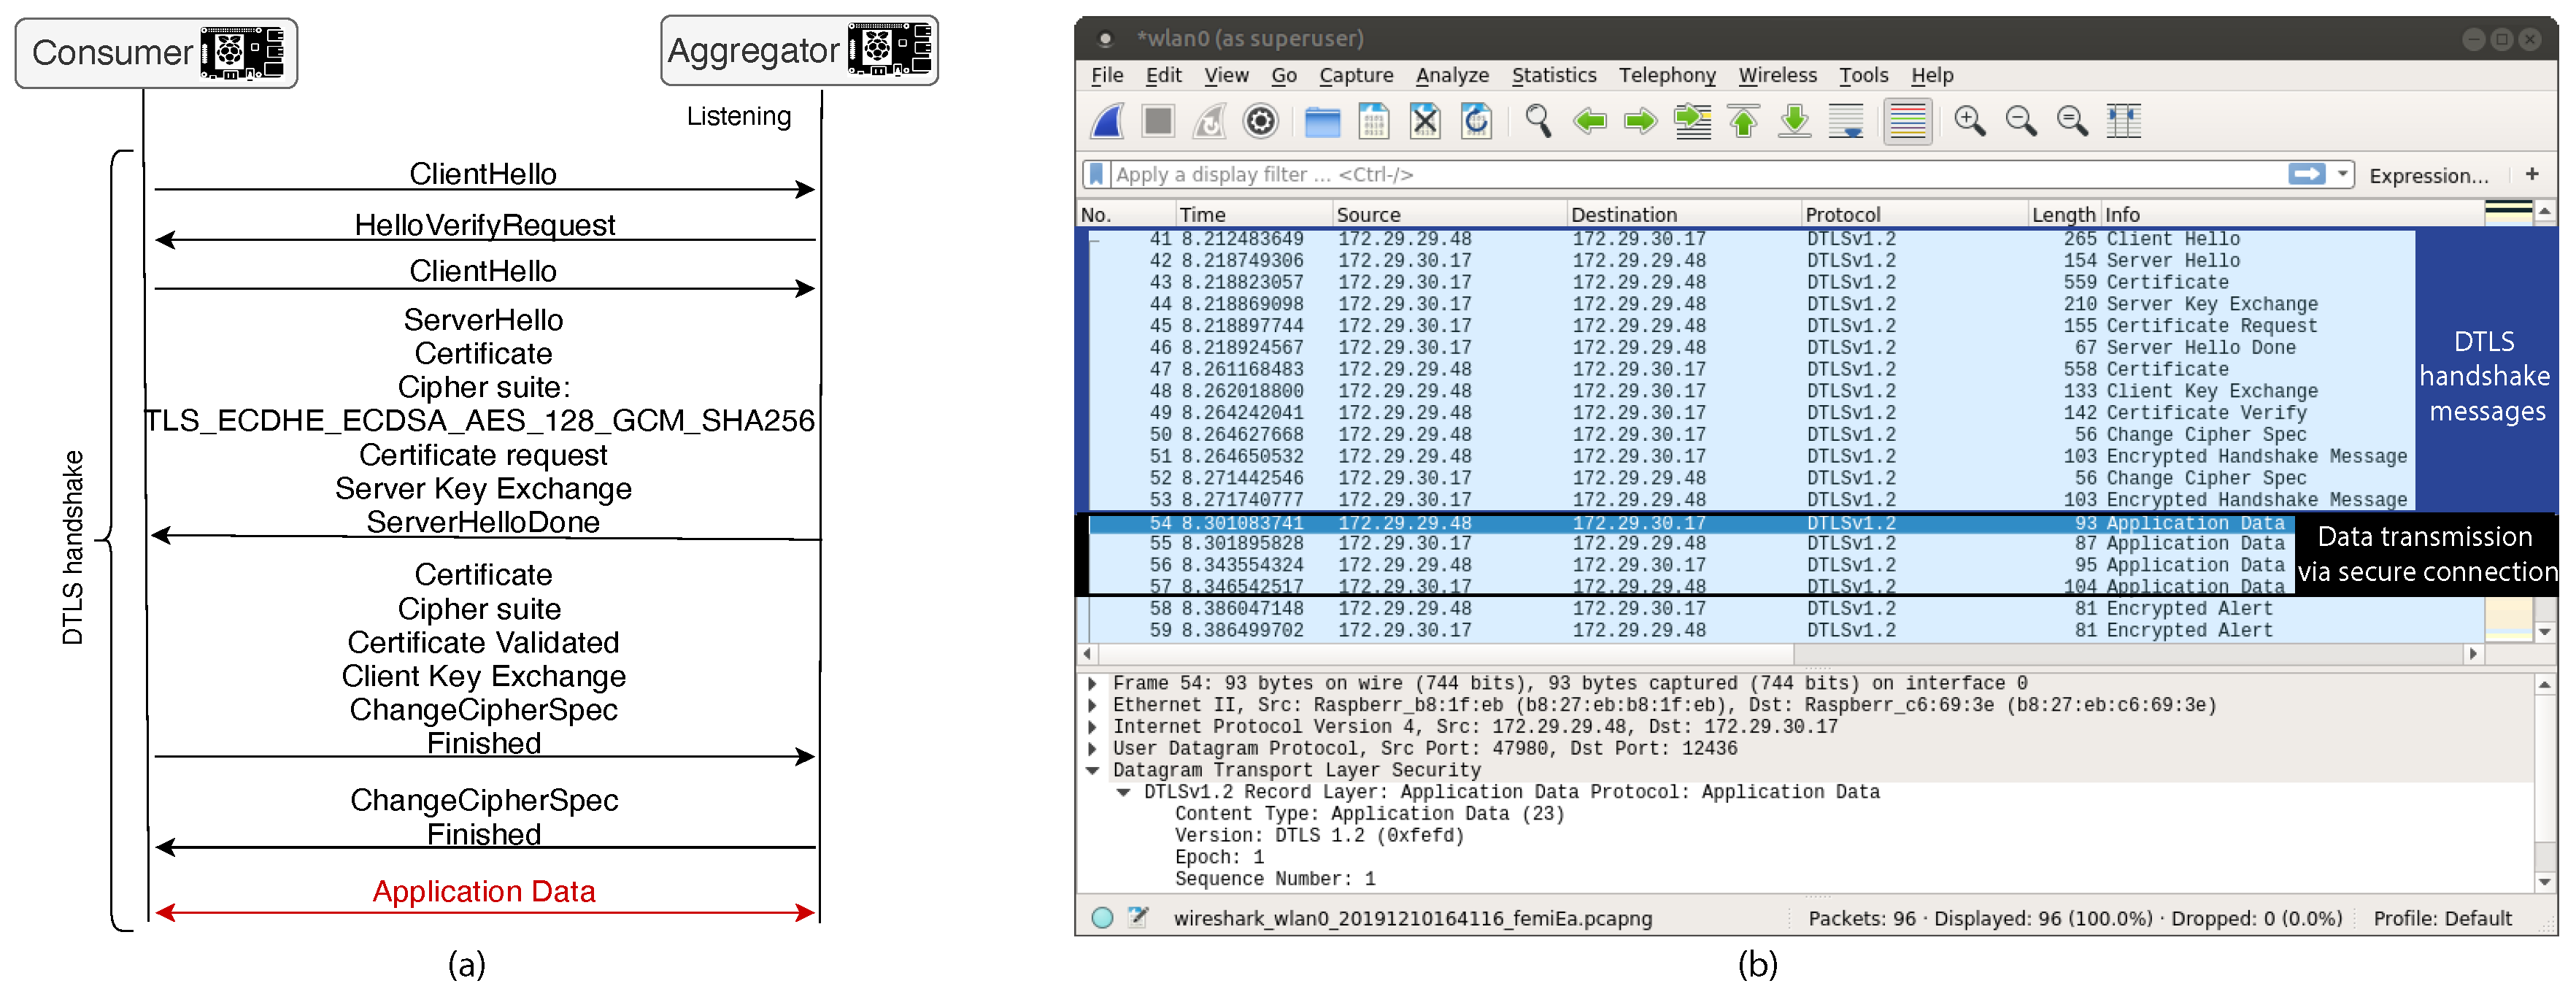
Figure 12.
MQTT handshake (a) and capture of the communication with QoS Level 2 (b), insecure, without TLS, between the consumer and aggregator. Application data fit in a single MQTT datagram, which was sent clear over TCP/IP.
Figure 12.
MQTT handshake (a) and capture of the communication with QoS Level 2 (b), insecure, without TLS, between the consumer and aggregator. Application data fit in a single MQTT datagram, which was sent clear over TCP/IP.

Figure 13.
Link latency of the consumer–aggregator communication with the tested protocols.


Table 1.
Common household appliance energy use.
| ID | Appliance | Average Annual Consumption (kWh) | Average Power ON Mode (W) | Average Standby Mode (W) | Annual ON Mode (h) | Annual Standby Mode (h) |
|---|---|---|---|---|---|---|
| Coffee machine | 21.5 | 313.4 | 2.9 | 184 | 655 | |
| Bread maker | 17.7 | 105.1 | 0.7 | 207 | 72 | |
| Refrigerator | 190 | 500 | 4.7 | 2400 | 141 | |
| Dishwasher | 220 | 700 | 3.7 | 480 | 168 | |
| Freezer | 327 | 335 | 1.7 | 2640 | 152 | |
| Microwave | 56 | 800 | 1.8 | 360 | 180 | |
| Oven | 60 | 900 | 1.9 | 280 | 800 | |
| Toaster | 80 | 1350 | 0.7 | 120 | 300 | |
| Lighting | 20 | 12 | 0.2 | 4800 | 1800 | |
| Blu-ray player | 5.5 | 15.3 | 0.8 | 81 | 228 | |
| CD player | 24.8 | 19.5 | 2.7 | 982 | 1804 | |
| Games console | 31.7 | 42.3 | 2.8 | 715 | 1742 | |
| HiFi | 75.1 | 11.2 | 3.2 | 575 | 2492 | |
| TV+DVD | 40.1 | 43.8 | 2.5 | 2158 | 937 | |
| Desktop | 119.4 | 67.2 | 5.7 | 3407 | 1649 | |
| Laptop | 21.3 | 32.3 | 1.6 | 554 | 832 |
Table 2.
Computational cost (an average) measured on different platforms.
| Model | CPU | RAM | Clock Frequency (GHz) | O.S | Execution Time 3 appliances (s) | ExecutionTime 32 appliances (s) | Execution Time 52 appliances (s) |
|---|---|---|---|---|---|---|---|
| Laptop | Dual core Intel i5 | 8 GB LPDDR3 | 2.3 | Mac OS 10.15 | 1.02 ± 0.17 | 2.56 ± 0.20 | 4.10 ± 0.31 |
| Raspberry Pi 4 | Quad Core Cortex A72 | 2GB LPDDR4 | 1.5 | Linux Ubuntu | 1.45 ± 0.01 | 11.85 ± 0.03 | 19.39 ± 0.02 |
| Raspberry Pi 3B+ | Quad Core Cortex A53 | 1 GB LPDDR2 | 1.4 | Linux Ubuntu | 2.70 ± 0.31 | 22.27 ± 0.04 | 36.66 ± 0.36 |
| Raspberry Pi 3B | Quad Core Cortex A53 | 1 GB LPDDR2 | 1.2 | Linux Raspbian | 3.13 ± 0.09 | 26.12 ± 0.05 | 42.59 ± 0.10 |
| Arduino Mega | ATmega2560 Microcontroller | Flash 256 KB | 0.016 | - | 1030 ± 6 | - | - |
Table 3.
Messages’ structure and size: Consumer on testbed comprised of 4 appliances. Headers and payload are depicted in Figure 5.
Table 3.
Messages’ structure and size: Consumer on testbed comprised of 4 appliances. Headers and payload are depicted in Figure 5.
| Message Structure | Size | Protocols (over WiFi) (ms) | |||
|---|---|---|---|---|---|
| UDP | CoAP/DTLS | MQTT/TLS | |||
| m1: | 48B= 8B/data ( data fields) | ||||
| appliance to be scheduled | |||||
| m1 appliances | 192B= 48B/appliance ( appls.) | 21±2 | 95±13 | 162±15 | |
| (kWh) | 192B= 8B/slot ( slots) | ||||
| (kWh) appls. | 768B= 192B/appliance ( appls.) | 25±3 | 109±21 | 175±20 | |
| (ON/OFF) | 192B= 8B/slot ( slots) | over ZigBee/Z-Wave: ≈20 | |||
| appliance to be scheduled | |||||
Table 4.
Resources needed for networking protocols on the consumer (left) and aggregator (right).
| Protocol | CPU (%) | RAM (%) | ROM (Bytes) | T (C) |
|---|---|---|---|---|
| UDP | 4.1/0.3 | 0.3/0.3 | @13K/@13K | 58.5/55.8 |
| MQTT QoS0 | 4.3/0.3 | 0.3/0.3 | @150K/@150K | 58.7/55.8 |
| MQTT QoS1 | 5/0.3 | 0.3/0.4 | @150K/@150K | 58.4/55.8 |
| MQTT QoS2 | 4.1/0.5 | 0.4/0.4 | @150K/@150K | 58.5/55.3 |
| MQTT TLS | 2.1/5.4 | 0.4/0.3 | @200K/@200K | 58.5/55.3 |
| CoAP DTLS | 2.2/7.6 | 0.4/0.3 | @74K/@58K | 58.4/55.8 |
© 2020 by the authors. Licensee MDPI, Basel, Switzerland. This article is an open access article distributed under the terms and conditions of the Creative Commons Attribution (CC BY) license (http://creativecommons.org/licenses/by/4.0/).
Share and Cite
MDPI and ACS Style
Cruz, C.; Palomar, E.; Bravo, I.; Gardel, A. Cooperative Demand Response Framework for a Smart Community Targeting Renewables: Testbed Implementation and Performance Evaluation. Energies 2020, 13, 2910. https://doi.org/10.3390/en13112910
AMA Style
Cruz C, Palomar E, Bravo I, Gardel A. Cooperative Demand Response Framework for a Smart Community Targeting Renewables: Testbed Implementation and Performance Evaluation. Energies. 2020; 13(11):2910. https://doi.org/10.3390/en13112910
Chicago/Turabian StyleCruz, Carlos, Esther Palomar, Ignacio Bravo, and Alfredo Gardel. 2020. "Cooperative Demand Response Framework for a Smart Community Targeting Renewables: Testbed Implementation and Performance Evaluation" Energies 13, no. 11: 2910. https://doi.org/10.3390/en13112910
Note that from the first issue of 2016, this journal uses article numbers instead of page numbers. See further details here.