Article

Life Cycle Assessment and Energy Balance of a Novel Polyhydroxyalkanoates Production Process with Mixed Microbial Cultures Fed on Pyrolytic Products of Wastewater Treatment Sludge

1
CIRSA (Interdepartmental Research Centre for Environmental Sciences), University of Bologna, via Sant’Alberto, 163, 48123 Ravenna, Italy
2
Department of Physics and Astronomy, University of Bologna, viale Berti Pichat, 6/2, 40127 Bologna, Italy
3
CIRI FRAME (Interdepartmental Centre for Industrial Research in Renewable Resources, Environment, Sea and Energy), University of Bologna, via Sant’Alberto, 163, 48123 Ravenna, Italy
4
Department of Chemistry “G. Ciamician”, University of Bologna, via Selmi, 2, 40126 Bologna, Italy
*
Author to whom correspondence should be addressed.
Energies 2020, 13(11), 2706; https://doi.org/10.3390/en13112706
Submission received: 8 April 2020 / Revised: 20 May 2020 / Accepted: 25 May 2020 / Published: 28 May 2020
(This article belongs to the Special Issue Life Cycle Assessment (LCA) of Environmental and Energy Systems)

Abstract

:
A “cradle-to-grave” life cycle assessment is performed to identify the environmental issues of polyhydroxyalkanoates (PHAs) produced through a hybrid thermochemical-biological process using anaerobically digested sewage sludge (ADSS) as feedstock. The assessment includes a measure of the energy performance of the process. The system boundary includes: (i) Sludge pyrolysis followed by volatile fatty acids (VFAs) production; (ii) PHAs-enriched biomass production using a mixed microbial culture (MMC); (iii) PHAs extraction with dimethyl carbonate; and iv) PHAs end-of-life. Three scenarios differing in the use of the syngas produced by both pyrolysis and biochar gasification, and two more scenarios differing only in the external energy sources were evaluated. Results show a trade-off between environmental impacts at global scale, such as climate change and resources depletion, and those having an effect at the local/regional scale, such as acidification, eutrophication, and toxicity. Process configurations based only on the sludge-to-PHAs route require an external energy supply, which determines the highest impacts with respect to climate change, resources depletion, and water depletion. On the contrary, process configurations also integrating the sludge-to-energy route for self-sustainment imply more onsite sludge processing and combustion; this results in the highest values of eutrophication, ecotoxicity, and human toxicity. There is not a categorical winner among the investigated configurations; however, the use of a selected mix of external renewable sources while using sludge to produce PHAs only seems the best compromise. The results are comparable to those of both other PHAs production processes found in the literature and various fossil-based and bio-based polymers, in terms of both non-biogenic GHG emissions and energy demand. Further process advancements and technology improvement in high impact stages are required to make this PHAs production process a competitive candidate for the production of biopolymers on a wide scale.

Graphical Abstract

1. Introduction

According to the European Commission [1], the transition to a more circular economy is an essential contribution to the efforts to develop a sustainable, low-carbon, resource-efficient, and competitive economy. In a circular economy, closed material cycles should be encouraged where possible [1]. Bio-based materials, i.e., those derived from renewable resources, such as wood, crops, or fibers, have various applications in a large variety of industries (e.g., construction, furniture, packaging, coatings, textiles, cardboard, chemicals, etc.) and energy uses (e.g., biofuels). Their characteristic of being made of organic carbon, which can be recycled and reused many times, in many ways, goes towards the principles of the waste hierarchy and, more generally, results in better overall environmental performances [1]. The bioeconomy, consequently, offers alternatives to fossil-based energy and products, and can make an important contribution to the circular economy. Moreover, bio-based materials can provide benefits connected to their renewability, biodegradability, or compostability. Nevertheless, the use of biological resources requires attention and a careful assessment through their life-cycle environmental impacts. Indeed, their use can also create competition for them and generate pressure on land use [2]. In this context, bioplastics are a very promising research area, usually indicated as a sustainable alternative to conventional fossil-based products. They have the advantage, over traditional plastics, of diminishing the use of non-renewable resources and also decreasing the environmental impact related to fossil resources’ consumption [3,4].
Polyhydroxyalkanoates (PHAs) are polymers belonging to a group of polyesters that are generated by some bacteria as carbon and energy intracellular reserve granules. Currently, more than 90 bacterial species that produce PHAs and about 150 diverse monomers of PHAs have been recognized [5]. Their accumulation is usually observed when one nutrient (e.g., nitrogen, phosphorus, and oxygen) is present in the fermentation broth in a limiting concentration, while, at the same time, there is an available excess source of carbon. Most bacterial strains, such as Cupriavidus necator, accumulate PHAs as secondary products under nutrient-limiting conditions. However, some bacterial strains, such as recombinant Escherichia coli and Alcaligenes latus, synthesize PHAs as a primary metabolite during microbial growth [6]. Generally, PHAs are produced by pure microbial cultures grown on renewable feedstocks (i.e., sugar or oils) under sterile conditions, but recently, several authors have investigated the exploitation of residues and waste as growing substrates [7,8,9]. Commonly, PHAs are considered eco-friendly because they are produced from renewable natural resources instead of petrochemicals, and because they biodegrade without producing harmful or toxic by-products and leaving no worrisome waste [10]. Anyway, in order to conclude if biopolymers are environmentally advantageous over petrol-based plastics, it is necessary to analyze their entire life cycle. Moreover, to make PHAs really competitive, first of all they need to equal their petrochemical counterparts both in terms of quality and economic performances [11]. Sustainable PHAs production is multifaceted and several criticisms need to be tackled in the process in order to make the manufacture of PHAs on an industrial scale convenient both environmentally and economically. For this purpose, cheaper microbial cultures and reutilization of waste streams as growing substrates appear among the main points for large-scale industrial production [12,13,14].
Among the many residues and wastes tested as growth substrates [9], agro-industrial and municipal effluents and sewage sludge have received considerable attention in recent years. Combinations of food waste and sewage sludge [15,16], industry and municipal primary sludge [17], municipal secondary sludge [18], and sewage sludge after hydrothermal carbonization and acidogenic microbial fermentation [14,19] are examples of the substrates investigated in order to obtain volatile fatty acids (VFAs) suitable as a carbon source for PHAs producing mixed microbial cultures (MMCs). At the same time, agro-industrial wastewater and sludge have also attracted great interest. A plethora of agro-industrial effluents have been tested as substrate for PHAs production: Sugarcane molasses, paper mill effluent, dairy effluent [20], distillery effluents [21], rice winery wastewater [22], and yeast industry wastewater [23]. Authors often agree in concluding that the reutilization of wastewater and sludge as a carbon substrate not only abates the cost of PHAs production [20,21] but also provides for a significant reduction of the sludge disposal cost [19], constituting a sustainable waste management [15,18] and significantly decreasing the environmental impact of PHAs [17].
The European Bioplastics association [3] supports life cycle assessment (LCA) in order to validate the eco-sustainability of bioplastics. LCA encompasses the energy and material flows within the system boundary and calculates the relevant impacts generated by each unit process. The energetic and environmental sustainability of PHAs production has usually been evaluated by means of LCA. The first LCA studies were focused on PHAs production based on carbon sources from dedicated cultures, mainly glucose [24], in particular from corn [25,26,27,28] and corn grain integrated by corn stover [29], but also soybean oil [30] and sucrose from sugar cane [31,32] as an alternative to glucose. PHAs from a genetically modified corn have also been analyzed [33]. Later, the focus shifted to evaluation of the eco-performances of PHAs produced from alternatives to dedicated carbon sources, such as fermentable sugars from lignocellulosic biomass [31], industrial wastewater [12,34], biomethane [35], municipal solid waste [36], potato [37], switchgrass [38], etc. In the last few years, the increasing attention given to wastewater and sludge as a PHAs-accumulating bacteria growth substrate has pushed many LCA studies in that direction. Heimersson and co-authors [39], Fernández-Dacosta and co-authors [40], and Morgan-Sagastume and co-authors [41] investigated the environmental performances of wastewater treatment plants (WWTPs) with integrated PHAs production. Dietrich and co-authors [42] analyzed the sustainability of PHAs production in integrated lignocellulose biorefineries. Vega and co-authors [43] examined the eco-sustainability of a biorefinery treating a mixture of cow manure and grape marc. Very recently, a review on the link between sustainability and industrial waste streams as feedstock for the production of PHAs has been published [44]; many different industrial streams have been taken into consideration, including activated sludge and industrial aqueous streams. The authors agree that the consideration of waste stream exploitation as a bacteria growth substrate is an interesting contribution towards a circular bioeconomy [44], economic competitiveness against fossil-based products [34,42], and eco-sustainability [43,45]. However, there is also a general agreement on the need for further investigations in order to improve the PHAs production process [40,44,46,47], and to deeply explore the environmental performances [41], thus avoiding possible burden shifting [43] and widening the analysis to include disregarded impacts like water use, land use, and eutrophication [39]. The reviews of Narodoslawsky and co-authors [48] and Cristóbal and co-authors [49] show a great variability among the LCA results obtained by the different authors due to technological differences but also different choices in the LCA applications. In any case, the power of LCA as tool to address eco-sustainability is reasserted.
This study aims to exploit LCA to assess the energy and environmental burdens of a hybrid thermochemical-biological process [50] that couples pyrolysis and anaerobic-aerobic fermentations to convert industrial sludge into PHAs. Specifically, the system valorizes anaerobically digested sewage sludge (ADSS) coming from wastewater treatment plants of agri-food industries for the production of PHAs via VFAs. Five different scenarios for the use of thermochemical process products were compared.

2. Materials and Methods

2.1. PHAs Production at the Lab Scale

The initial steps of the PHAs production process were tested at the laboratory scale by the Chemistry Lab of CIRI FRAME of the University of Bologna, Ravenna Campus; then, a hypothesis of process upscaling at the industrial scale was carried out.
The process for PHAs production involving MMCs consists of several phases (Figure 1) that can be summarized into three main steps: (1) Biomass feedstock pre-treatment through pyrolysis, followed by anaerobic digestion of organic carbon to produce mixtures of volatile fatty acids (VFAs); (2) PHAs-enriched microbial biomass production; and (3) PHAs extraction using organic solvents. A detailed explanation of each step is provided below.

2.1.1. Pyrolysis and Anaerobic Digestion (PyAD)

The pyrolytic pre-treatment was performed in order to improve the ADSS fermentability, which can generally be low due to the high content of recalcitrant compounds and complex poorly degradable inorganic matter [51]. Pyrolysis of biomass is a thermochemical decomposition converting biomass into energy and materials and occurring in the absence of oxygen or under an inert gas flow. Pyrolysis provides three products: A liquid fraction (bio-oil), a solid carbonaceous material (biochar), and a gaseous fraction (syngas) [52]. The bio-oil and the syngas can be used as the substrate to feed the anaerobic fermenter to produce VFAs [51]. Besides, the syngas can also be converted into energy in a combined heat and power (CHP) unit [53]. The biochar fraction can be used either as a carbon storage for long-term sequestration, or as a soil amendment bringing it back to the soil, or to produce energy through combustion [54].
Pyrolysis tests were carried out on ADSS, using a fixed bed tubular quartz reactor placed into a refractory furnace, and were performed at 500 °C for 30 min. The pyrolizer was connected downstream to two cold traps (ice bath) for trapping the condensable vapors (liquid fraction). The bio-oil obtained was a dark-brown biphasic liquid characterized by a low viscous aqueous phase and a tarry dark-brown one (organic phase). The two phases were separated by centrifuge. Bio-oil and biochar were collected, and the yields determined by weight difference (see Table 1).
Subsequently, the anaerobic digestion tests of pyrolysis bio-oil to produce VFAs were carried out following the procedure by Torri and co-authors [55]. Sludge generated by agro-industrial wastewater treatment itself was used as inoculum after sterilization at 120 °C and 2 bar for 60 min; this step should eliminate the methanogenic bacteria while preserving the sporogenic ones. This has the effect of avoiding the production of biogas or, in other terms, maximizing the yield of VFAs. Indeed, the production of VFAs is an anaerobic process involving hydrolysis and acidogenesis, known as acidogenic fermentation. During hydrolysis, the complex organic polymers present in ADSS are subdivided into simpler organic monomers due to the effect of enzymes excreted by the hydrolytic microorganisms [15]. Subsequently, acidogenic bacteria ferment these monomers into VFAs, mainly as acetic, propionic, and butyric acids. Both processes involve a wide range of obligate and optional anaerobes, such as Bacteriocides, Clostridia, Bifidobacteria, Streptococci, and Enterobacteriaceae [56]. A 100-mL syringe reactor was used, filled with 20 mL of bacterial inoculum and an aliquot of 200 mg of chemical oxygen demand equivalent (CODeq) of bio-oil added to feed the bacterial inoculum. The syringe was closed and stored at 42 °C. The reactor was analyzed daily in terms of the chemical oxygen demand (COD) and VFAs content. Biogas production was assessed on the basis of the COD content in the liquid phase, assuming that its decrease was equal to the biogas produced (namely CH4 and H2).
As for the VFAs extraction, reference was made to the experimental data obtained by Torri and co-authors [57], where the innovative methodology of pertraction making use of new liquid membranes (LMs) based on lipophilic amines and biodiesel was proposed for this purpose. The VFAs flux rate obtained with the best performing liquid membrane based on trioctylamine (TOA) at 10 wt% (TOA10-B) demonstrates the feasibility of a closed loop for a selective conversion of VFAs extracted from anaerobic fermentation systems into PHAs-enriched microbial biomass.

2.1.2. PHAs-Enriched Biomass Production

VFAs were converted into PHAs using two aerobic batch reactors in sequence. The physical separation allows process optimization, as it has been shown that different conditions are required at each stage [58,59]. In the first reactor, mixed cultures are subjected to “feast and famine” conditions: High availability and shortage of the substrate are alternated in order to select microbial populations capable of incorporating the VFAs with greater efficiency. The microbial sludge retention time value was set to ensure that all carbon was consumed for cell growth and maintenance. In the latter, the selected microorganisms were fed exclusively with the VFAs produced in the acidogenic fermentation with the aim of promoting the accumulation of PHAs [14,60].

2.1.3. PHAs Extraction

The applied extraction method is based on the solubilization of PHAs with dimethyl carbonate (DMC). This process can be applied either directly on concentrated microbial sludge or on dry biomass, allowing a very high polymer recovery and an excellent purity. The direct extraction from microbial sludge applied in this case study required a biomass to solvent ratio of 2.5% weight to volume ratio. This concentration was obtained by centrifuging and concentrating the microbial culture after the accumulation phase. The sludge underwent extraction with DMC for 4 h at 90 °C. Subsequently, the DMC phase, containing the extracted PHAs, and the biomass sludge were centrifuged and separated, and then the extracted polymer was recovered after filtering and evaporating the solvent. The polymer recovery was very high, around 96% [47].

2.2. PHAs Production at the Industrial Scale

The above described lab-scale pyrolytic system was scaled-up to treat 2500 t dry matter (DM) sludge/year at 3.8 wt% DM received from an average-sized WWTP. To obtain the mass and energy balance, a mixed approach was adopted considering data from laboratory experiments, assumptions, and vendors’ data sheets for the equipment. Rigorous calculations for the mass, enthalpy, and COD balances were performed at the pyrolysis stage to ensure comparability between scenarios, given the composition heterogeneity of pyrolysis (bio-oil, syngas, biochar) and gasification products (syngas, ash). Table 1 summarizes the main parameters determined by the tests carried out at CIRI FRAME and used for the industrial scale-up modeling of the process.

2.2.1. Pyrolysis and Anaerobic Digestion (PyAD)

The initial process step was sewage sludge dewatering, first by centrifugation up to 25% DM then by thermal drying up to 85% DM. The dryer was assumed to recover the latent heat by condensing the evaporated water, which was then recirculated into the process water system. As explained, the pyrolytic pre-treatment of ADSS enhances the soluble, and thus bioavailable, COD of ADSS itself, facilitating the conversion yield of organic matter into VFAs during the anaerobic acidogenic fermentation. The thermal energy required for pyrolysis was assumed to be 1.28 MJ per kg of ADSS at 85% DM. VFAs were produced with different yields from the pyrolysis syngas, bio-oil and water phases, and also from syngas obtained through biochar gasification (see Table 1 and Section 2.3.1). As for this technology, a dataset representing an average indirectly heated atmospheric fixed-bed gasifier followed by a low-temperature wet gas treatment was selected. Energy self-production of the plant was modelled by a syngas-driven CHP plant dataset representing an average combustion situation without further flue gas treatment.
In the anaerobic acidogenic fermenter (AAF), the syngas and bio-oil were converted into VFAs with yields equal to 80% and 33% on the COD basis, respectively, and a hydraulic residence time of 7 days. No methane was produced as a result of the sterilization process applied on the inoculum to inhibit methanogenic bacteria.
The energy required by the AAF consists of the thermal energy necessary to heat up inlet streams and to keep the AAF at 40 °C, and of the electricity needed for pumping the inlet/outlet flows and for the mixing of the AAF volume. The heat necessary for increasing the temperature of the inlet flow from the environment temperature was calculated on the basis of the specific sensible heat of the water phase. The outlet stream from the AAF was separated into a biological sludge stream and a water phase by a centrifuge consuming 7 MJ per kg of sludge at 3% DM. The biological sludge was recirculated at the initial drying stage, while VFAs were concentrated by the aforementioned pertraction system, which required a centrifugal pump power of 344 J per kg of treated liquid.

2.2.2. PHAs-Enriched Biomass Production

The sequencing batch reactor (SBR) is an aerobic reactor where microbial biomass is produced using VFAs as carbon source and PHAs start to accumulate in microbial cells. Biomass is subsequently transferred to another aerobic batch reactor (accumulation reactor, AR) where MMCs convert VFAs into PHAs with a 50% yield on COD basis. PHAs accumulate in microbial cells up to 60 wt%. Air sparging and liquid mixing are needed in both SBR and AR. The oxygen required for microbial biomass growth was modelled assuming a stoichiometric uptake by microorganisms. A first stage of microbial biomass dewatering was carried out by filtration, in order to reach a 13% DM content. A further dewatering stage was performed by a second thermal dryer to increase the DM to 20% before PHAs extraction. Additionally, in this dryer, the evaporated water was condensed to supply the process water system, but no heat recovery was considered in this case.

2.2.3. PHAs Extraction

The model includes the extraction of PHAs from the MMC by means of the solubilization with DMC as explained in Section 2.1.3. The PHAs recovery rate was set to 96%. The extraction processes were composed by a series of equipment units: Centrifuges, batch reaction vessels, heaters and pumps.

2.2.4. PHAs End-of-Life

The “end-of-life” phase was modelled based on data provided by COREPLA [61]. In Italy, in 2016, 2.2 million tons of post-consumer plastics waste ended up in the waste stream. A share of 85% was recovered, both through material recycling (43%) and energy recovery (42%), while the remaining 15% still went to landfill. Since a supply chain for the material recovery of bioplastics has not yet been implemented, neither at the Italian nor at European level, and since the amount of bioplastics recovered with the organic fraction of municipal solid waste for composting is still very small, it was assumed that all the recovered bioplastic undergoes energy recovery.

2.3. Energy and LCA Analysis

An energy analysis of the system was performed by means of the energy metrics described in Section 2.3.4.
An attributional LCA modelling was adopted following the ISO 14040:2006 and ISO 14044:2006 [62,63]. This approach was chosen because it is the most applied and best established.

2.3.1. Scenarios

Three different scenarios were conceived to model the use of syngas produced by both ADSS pyrolysis and biochar gasification: (1) Pyrolysis syngas and biochar syngas to AAF for VFAs production (scenario A—AllSyn2VFA); (2) pyrolysis syngas to AAF for VFAs production, biochar syngas to energy production (scenario B—CharSyn2E); and (3) both pyrolysis syngas and biochar syngas to energy production up to complete fulfilment of the electricity and thermal energy request of the plant, the exceeding part to AAF for VFAs production (scenario C—MostSyn2E).
The electricity and thermal energy external demand were set to null by an optimization algorithm able to adjust the energy fraction produced by the plant CHP and boiler. The algorithm ensures alternatively the electric self-sustainment of the plant (scenario B) and both the electric and thermal self-sustainment of the plant (scenario C) as primary objective.
In order to assess the impact of the external energy sources choice, three scenarios were modelled on the basis of scenario A, which is the one using only external energy sources.
In the first one, named A1—ConvE, electricity is supplied by the Italian grid mix and thermal energy by the combustion of natural gas. In scenario A2—RE/Pv+Bg, electricity is provided by photovoltaic systems and thermal energy by the combustion of biogas from anaerobic digestion of energy crops, such as the so-called waxy maize. In the A3—RE/Mix+SB scenario, electricity is supplied by a mix of renewable sources and thermal energy by the combustion of solid biomass. The renewable electricity mix was determined on the basis of the 2030 outlook contained in the Integrated National Plan for Energy and Climate [64]. The plan predicts that renewable sources will provide for 55% of the electricity consumption in 2030, but in A3—RE/Mix+SB, we envisage that renewable sources will provide for 100% of the consumption mix of PHAs production plant while maintaining the same mutual relationship (Table 2).

2.3.2. Functional Unit and System Boundary

The functional unit (FU) was defined as 1 kg of biopolymer ready for the product’s manufacturing.
The system boundary was from “cradle-to-grave”: It was assumed that the bioplastic item is landfilled or incinerated. In detail, the system boundary includes (Figure 2): Sewage sludge pyrolysis, VFAs production through anaerobic digestion, PHAs-enriched biomass production using a MMC, PHAs extraction with DMC, and bioplastic items end-of-life. The analysis was carried out considering four main stages, called: “Pyrolysis and anaerobic digestion” (PyAD), “PHAs-enriched biomass production”, “PHAs extraction”, and “PHAs end-of-life” (PHAs EoL). The system boundary does not include product manufacturing and the additives used in polymer resins to achieve desirable material properties since these phases are the same for all scenarios; this choice is consistent with previous comparative LCA studies of biopolymers and conventional polymers [38,65,66,67]. Moreover, we assumed that the collection and transport of waste to various treatment plants are not relevant [68], and that even these phases are identical in all scenarios; therefore, they were not included in the system boundary. Finally, sewage sludge coming from the agro-industrial sector entering the process was considered as entering the system without any associated impact, according to the ‘zero-burden-boundary’ hypothesis.
The end-of-life (EoL) phase for plastic items at the European level envisages different types of treatment: Mechanical material recycling, organic carbon recycling (i.e., composting and anaerobic digestion), energy recovery, and landfilling [69,70]. Only energy recovery and landfilling for bioplastics was considered because the separated collection and recycling of bioplastic waste is scarcely implemented at the European level and in Italy, in agreement with information reported by COREPLA, the Italian national consortium for collection, recycling, and recovery of plastic packaging, as mentioned in Section 2.2.4.
Model decisions regarding the treatment of waste, and co- and by-products, are a potentially important contributor to the differences among LCA studies. System expansion, where applicable, is the baseline method for handling co- and by-products, consistent with ISO 14044 [63]. In the PHAs production model, different fates are foreseen for waste and by-products. Biological sludge from the AAF and from the PHAs extraction phase is recycled to the initial drying stage: This waste biomass was assumed to have the same composition as the inlet ADSS because the ash content concentrates in biochar; in other terms, ash exit the system and does not accumulate after every cycle. Process water is internally reused, while wastewater is sent to a WWTP and the sewage sludge produced is treated as other biosolids and used in agriculture. As regards pyrolysis co-products, bio-oil and water phases are sent to the AAF to produce VFAs, while biochar is gasified to produce biochar syngas. The latter, together with pyrolysis syngas, is alternatively sent to the AAF to produce VFAs or to energy production through CHP and a boiler in order to satisfy the energy request of the plant, depending on the scenario.

2.3.3. Inventory Data

The study was based on laboratory and pilot-scale data collection in accordance with the current level of maturity of the technology: An operational commercial-scale facility has not yet been implemented. Primary data were used for foreground processes, which took place at CIRI FRAME laboratories, and LCA databases were used for background processes, while estimates based on commercial and literature data were used for other processes, such as the biochar gasification, and to scale-up the whole PHAs production system.
LCA was performed using GaBi ts 8.7 software. The LCA databases used for background data were GaBi Professional Database [71] and Ecoinvent Database version 2 [72].
In Table 3, the life cycle inventory data of the main flows referred to the FU for the scenarios are presented.
As it is possible to observe in Table 3, data for the analyzed scenarios differ only in the pyrolysis and anaerobic digestion phase.
As regards the energy recovered through the incineration process in the EoL phase, a dataset for the combustion of bio-based polypropylene (bio-PP) with a net calorific value (NCV) of 43.5 MJ/kg in a waste incineration plant was considered [71]. It was assumed that this is also the PHAs’ NCV, on the basis of the physical properties and chemical structure being similar to bio-PP. To be consistent, this value was also assumed for the calculation of energy indicators.

2.3.4. Energy Balance and Energy Performance Metrics

Besides the mass balance, the energy balance was also calculated as it constitutes part of the inventory for impact assessment. Every energy figure, including primary energy (PE), is provided on an NCV basis and electricity is equally provided as NCV equivalent.
In Table 4, the energy balance for the three analyzed scenarios of the PHAs production system referring to the FU is presented. The end-of-life phase is excluded.
As in Table 3, also in Table 4, data of the three A-based scenarios are reported in a single column since they differ only in the external energy source used, and not in energy figures.
Several energy indicators, such as returns and ratios, are derived from the energy balance and adopted to better investigate the effects of the main factors affecting the results: The amount of ADSS used as feedstock, the energy recovery by end-of-life, and the renewable energy ratio.
Two indicators on energy return (ER) are defined:
  • ERPHAs, overall (Equation (1)) expresses the energy contained in PHAs as a rate of the total energy invested in their production; the total energy invested is defined as the sum of the energy contained in input sewage sludge and the primary energy of heat and electricity sources; and all factors are measured in terms of their NCV:
    ER PHAs ,   overall = energy   in   PHAs total   energy   invested = E PHAs PE   fossil + PE   renewable   for   H + E + E sludge ,   for   H + E + E sludge , for   PHAs .
  • ERPHAs, EoL (Equation (2)) is a similar indicator to ERPHAs, overall but includes a term representing the energy recovered from PHAs EoL; thus, it expresses the energy return based on the net energy required for PHAs production considering also the end-of-life phase:
    ER PHAs, EoL = energy in PHAs total energy invested energy recovered from EoL =   E PHAs PE  fossil + PE  renewable for H + E + E sludge ,  for H + E + E sludge ,  for PHAs E EoL .
Two other indicators named renewable energy ratio (RER) are adopted to determine the rate of renewable energy used:
  • RERfor H+E (Equation (3)) describes the renewable quota of energy used as heat and electricity only, thus excluding the fraction of sewage sludge transformed into PHAs:
    RER for H + E   = external renewable energy + energy in sludge for heat and electricity total energy invested energy in sludge for PHAs  = PE  renewable for H + E + E sludge ,  for H + E PE  fossil + PE  renewable for H + E + E sludge ,  for H + E .
  • RERoverall (Equation (4)) describes the renewable quota of energy used in the PHAs production process as heat, electricity, and material, thus including the fraction of sewage sludge transformed into PHAs; in fact, the denominator is the total energy invested:
    RER overall = external renewable energy + energy in sludge total energy invested = PE  renewable for H + E + E sludge ,  for H + E + E sludge ,  for PHAs PE  fossil + PE  renewable for H + E + E sludge ,  for H + E + E sludge ,  for PHAs .
The last energy indicator adopted is the PHAs-to-fossil-energy ratio (Equation (5)), i.e., the energy in PHAs per unit of primary energy from fossil sources invested, as an indicator of the fossil energy use efficiency:
FER PHAs = E PHAs PE fossil .

2.3.5. Life Cycle Impact Assessment

In the life cycle impact assessment (LCIA) phase, environmental burdens were assessed using the flows and data referred to the FU modelled in the inventory phase.
The ILCD/PEF Recommendations v1.09 method [73,74] was used; this method considers the environmental impact under 16 impact categories, listed below: Acidification midpoint (AP); climate change midpoint, excluded biogenic carbon (GWPexc.); climate change midpoint, included biogenic carbon (GWPinc.); ecotoxicity freshwater midpoint (FE); eutrophication freshwater midpoint (EuF); eutrophication marine midpoint (EuM); eutrophication terrestrial midpoint (EuT); human toxicity midpoint, cancer effects (HTc); human toxicity midpoint, non-cancer effects (HTnc); ionizing radiation midpoint, human health (IR); land use midpoint (LU); ozone depletion midpoint (OD); particulate matter/respiratory inorganics midpoint (PM); photochemical ozone formation midpoint (POF); resource depletion water midpoint (WD); and resource depletion mineral, fossils, and renewables midpoint (RD).
The impacts due to the energy demand of the process were specifically taken into consideration through the category “primary energy from renewable and non-renewable resources” (PED, R+NR), which is not part of the aforementioned method.
Moreover, the optional phases of normalization and weighting were applied, in order to identify the most relevant impact categories in determining the overall impact of the process. The normalization factors and the weight vector used in this analysis were those proposed by PEFCR guidance [75].
The environmental performances in terms of the primary energy demand and climate change obtained for PHAs within this study were compared with those of two polymers of fossil origin, i.e., polyethylene terephthalate (PET) and polypropylene (PP), and two biobased polymers, i.e., bio-polypropylene (bio-PP) and polylactic acid (PLA). The environmental performances of these four polymers were also obtained by modeling their production and end-of-life phases through GaBi software and the related databases [71].

3. Results and Discussion

3.1. Energy Performance Indicators Results

In Table 5, the energy indicators results for the five analyzed scenarios of PHAs production system referring to the FU are presented.
Considering the five scenarios from an energy perspective, several factors affect the energy balance. Such factors are (a) the amount of sewage sludge used for onsite energy production besides the PHAs production, (b) the energy recovery from PHAs EoL, and (c) the renewable energy ratio. Energy indicators are used to describe and explain the impact of factors’ variation.
As previously mentioned (see Section 2.3.3), it is assumed that the energy contained in PHAs is 43.5 MJ/kg, while the energy contained in ADSS is 0.45 MJ/kg.
A key indicator is the total energy invested, this being the sum of ADSS input (energy) and PE—external supply. The latter includes the contribution of both fossil-based energy and renewable sources, such as biogas and photovoltaic, depending on the scenario. The scenario with the lowest total energy invested to produce 1 kg of PHAs is A1—ConvE, because of the lowest amount of ADSS input required by the process. As an alternative to fossil sources, scenarios A2 and A3 were considered to evaluate the use of renewable energy (heat and electricity) to fuel the process. Despite the same ADSS input value of scenario A1, both in scenarioA2 and in scenario A3, the amount of total energy invested is higher because of the higher value of PE—external supply. Such a rise depends on the renewable component of the indicator (PE—external supply, renewable), whose increase more than compensates for the simultaneous decrease of the non-renewable component (PE—external supply, fossil).
In contrast to the A-based scenarios, where the entire amount of sewage sludge is used to produce PHAs, scenarios B and C are designed to use a fraction of pyrolytic products to produce onsite the energy to fulfil either the internal demand for electricity only (scenario B) or the internal demand for both electricity and heat (scenario C). For this reason, an increasing amount of ADSS is needed to produce 1 kg of PHAs in scenarios B and C: 2.17 and 3.38 times the mass flow of scenarios A, respectively. The total energy invested per kg of PHAs ranges from 222.6 MJ (scenario A1) to 329.2 MJ (scenario C), i.e., a growth of 48% of total energy invested is needed if the energy production is sourced onsite by the ADSS instead of the external energy supply. Such a rise depends on the ADSS input (energy) increase, and in particular on the renewable energy in sewage sludge used for H+E, whose increase more than compensates for the simultaneous decrease of the PE — external supply. This is partly explained by the difference in the efficiency between the CHP and boiler used to produce energy onsite, and the external power plants. Moreover, the sludge-to-energy process comprises several steps, each one characterized by energy costs and losses. In more detail, sewage sludge must be centrifuged and dried to be first pyrolyzed, the resulting biochar is gasified, and then biochar syngas and pyrolysis syngas are combusted together in the CHP and boiler.
To better highlight the differences among scenarios, we did not use the energy return on energy invested (EROEI), which is specifically adopted for energy systems and fuels, but a similar indicator, the energy return (ER) defined in Equations (1) and (2). This was used to evaluate the overall efficiency of the entire PHAs life cycle, including the end-of-life stage (Equation (2)).
Energy return indicators show that PHAs contain about one eighth up to a fifth of all the inputs used for its production, both energy and materials, all of them on an energy basis. If energy recovery from the EoL phase is also taken into account, such figures increase. ERPHAs, overall ranges from 12.7% to 19.5% and ERPHAs, EoL from 13.8% to 22.2%. Comparing ERPHAs, overall and ERPHAs, EoL, the latter is higher in the range between 1.2 and 2.9 percentage points due to the energy recovery by PHAs EoL. If a life-cycle perspective is assumed, EoL contributes to a reduction of the total energy invested to produce PHAs; it was calculated that 66% of the NCV contained in PHAs is recovered at the PHAs EoL stage by incineration of PHAs and the combustion of biogas from PHAs degradation in landfill. Moreover, the contribution of the EoL energy recovery can completely offset the external supply of PE, such as in scenario C, where the external PE is even lower than the energy recovery by EoL. For both these energy return indicators, it is found that the lower the ADSS amount used for energy, the greater the return (A1 > B > C).
From a process perspective, the amount of energy used per FU is an indicator of the production efficiency, but it is not enough to address the viability and impacts of the process. For this purpose, other factors, such as the renewability of energy sources, must be taken into account. The renewable energy used is expressed as the renewable energy ratio considering the sole energy used for process heat and electricity (RERfor H+E) or including every energy input (i.e., heat, electricity, sewage sludge NCV, PE) in the PHAs production (RERoverall). The onsite production of energy from ADSS enhances the renewable energy ratio (RERfor H+E) from 19% in scenario A1 up to 63% in scenario B and 93% in scenario C. Results comparable with the latter are achieved in scenarios A2 (91%) and A3 (89%), where the entire heat and electricity supply comes from external and different renewable sources. The overall renewable energy ratio (RERoverall) takes into account also the NCV of the sewage sludge transformed into PHAs. Compared to the RERfor H+E results, RERoverall shows higher values, especially for scenario A1, due to the sewage sludge NCV, which almost equals the fossil PE. For all the other scenarios, RERoverall is just slightly higher than RERfor H+E. Scenario C is the one with the highest RER and with the lowest ER (excluding scenario A2) for the same reason: The use of sewage sludge to produce onsite renewable heat and electricity.

3.2. LCIA Results

The overall LCIA results for the five scenarios are reported in Table 6.
Detailed results for the five scenarios are shown in Figure 3, where the relative contribution of each LCA phase—pyrolysis and anaerobic digestion (PyAD), PHAs-enriched biomass production, PHAs extraction, polymer end-of-life (PHAs EoL)—to each midpoint impact category score are reported and compared.

3.2.1. Scenarios’ Performance Comparison

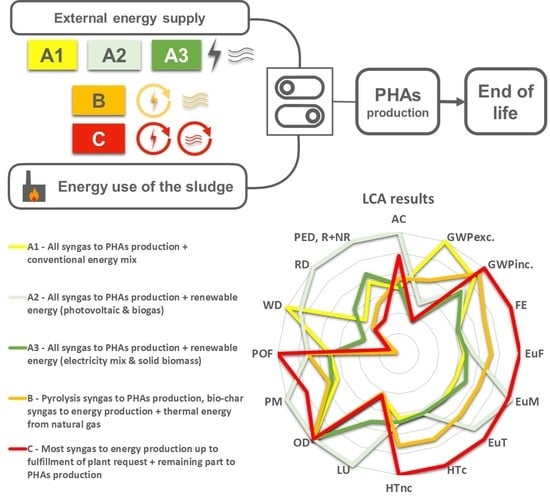
Table 6 shows the total impact scores of the 5 analyzed scenarios over the 17 chosen impact categories. A clear pattern emerges from the data when considering the number of impact categories in which each scenario shows better results than the others or, in other words, when all 17 impact categories are considered equivalent. From this point of view, scenario A1—ConvE performs better than the other ones but only slightly better than scenario A3—RE/Mix+SB. In more detail, scenario A1 scores best in six categories (AC, EuF, EuM, POF, PM, HTnc), and in four more categories, it is first on an equal footing (EuT, FE, HTc, and OD). Scenario A3 shows the best results in two categories (GWPinc. and IR), and in five more categories, it is first on an equal footing (EuT, FE, GWPexc., HTc, and OD), four of them with scenario A1, and is the second best in six categories (AC, EuF, EuM, POF, PM, HTnc, the latest on an equal footing). Moreover, A1 outperforms scenario A3 in nine categories, including PED, R+NR, and RD, while scenario A3 outperforms scenario A1 in four categories, including GWPexc. and GWPinc. Scenario B—CharSyn2E has medium performances, showing the best results in two categories (LU and WD); in another one, it is first on an equal footing with all the other scenarios (OD), and it never shows the worst results. Scenario A2—RE/Pv+Bg shows the worst results in six categories (AC, EuM, LU, PM, RD, PED, R+NR) and the best in three categories (FE, HTc, and OD), all of them on an equal footing with other scenarios. Scenario C—MostSyn2E shows the worst performances in seven categories (GWPinc., EuF, EuT, FE, HTc, HTnc, POF) but also the best in the other four, even if in two of them (GWPexc. and OD) on an equal footing. It is worth noting that three of the impact categories where it shows the best results are GWPexc., PED, R+NR, and RD, which is the main impacts—often the only ones—considered when comparing the environmental performances of plastics and/or bioplastics. These categories can be considered on a global scale, since the impact measured by the midpoint indicator, e.g., the global warming potential, has an effect on a global scale. On the other hand, it is possible to state that scenario C generally shows higher values than the A-based scenarios in the impact categories AC, EuF, EuM, EuT, FE, HTc, HTnc, PM, and POF. These categories can be considered on the local and regional scale, since the impact measured by the midpoint indicator, e.g., the acidifying or eutrophicating potentials, has an effect on a local or regional scale. Therefore, the results exclude that scenarios A1 and A3 are superior to scenario 3 when considering only a small number of impact categories, or when their relative importance is also taken into account. In other words, the results cannot establish in a straightforward way whether one scenario prevails over the others, as the ranking depends on the method adopted to establish it. An insight into the reasons and origins of this trade-off is given in the following Section 3.2.2, after analyzing in detail the impacts in relevant categories.
The only category equally impacted in all five scenarios is ozone depletion (2.3 × 10⁻⁸ kg CFC-11 eq.). This finding can be easily explained since the impact derives almost completely from the PHAs extraction process that is the same for each scenario. In particular, the impact is attributable to the emission into the atmosphere of organic halogenates, mainly bromochlorodifluoromethane (Halon 1211), deriving from the methanol production process that is the base-chemical of DMC synthesis.
The differences among the results of the five scenarios are high for many impact categories, even one order of magnitude. Generally, differences are higher than ±50%; apart from the OD category, climate change included biogenic carbon is the one showing the lowest percent differences.

3.2.2. Detailed Analysis of Relevant Impact Categories Results

As explained in Section 2.3.5, results were also calculated using the Environmental Footprint 2.0 method in order to determine relevant impact categories, i.e., those cumulatively accounting for 80% of the total impact score. Applying the normalization and weighting factors proposed by PEFCR guidance [75], the identified categories are (in decreasing order): GWP, WD, RD, EuF, POF, and respiratory inorganics.
Considering this, the analysis of the relative contribution of the processes was focused on the following impact categories: GWPexc., EuF, WD, POF, PM (as proxy for “respiratory inorganics”), and RD. The PED, R+NR impact category is also discussed. Figure 3 shows the relative contributions of PyAD, PHAs-enriched biomass production, PHAs extraction, and PHAs EoL phases.
Differences among the five scenarios for the primary energy demand from renewable and non-renewable resources are high. The energy recovered in the EoL phase is the same for every scenario, while energy required in PHAs production varies widely (see Table 4) as a function of both the energy source and the input feedstock, which increases from scenarios A to scenario B, and from scenario B to scenario C. In fact, a greater quantity of processed ADSS is progressively used, until energy independence is reached in scenario C. It must be remembered that in the LCA analysis, the input ADSS is considered as “zero-burden”, i.e., without any associated environmental impact, in accordance with what is generally applied in life cycle analyses of waste. This implies that the PED, R+NR value of ADSS is zero. On the contrary, external sources supplying energy in A-based scenarios and in scenario B have positive PED, R+NR values, i.e., they have associated environmental impacts. For this reason, the PED, R+NR decreases as the processed ADSS increases. The results for A-based scenarios clearly show that the PED, R+NR values for external renewable sources are not lower than those of fossil sources; quite obviously, their high value mainly derives from the renewable part of the indicator, while that of the fossil sources mainly derives from the non-renewable part. This is in accordance also with the findings from the analysis of energy performance indicators (see Section 3.1).
In scenarios A1, A2, A3, and B, the life cycle phase causing the greatest impacts in terms of PED, R+NR is PyAD, and in particular the pertraction system, due to its high energy consumption. In scenario C, the phase responsible for the greatest impacts is PHAs extraction, due to the background process of DMC production, an energy-intensive process. Thanks to the energy recovery from the bioplastic products, the EoL phase leads to environmental credits. These credits, together with the energy self-sufficiency of the process, lead to the negative PED, R+NR value for scenario C.
Differences among the five scenarios for the climate change, excluded biogenic carbon category, are high, in some cases even more than one order of magnitude. The contributions to climate change scores are mainly due to PyAD and PHAs-enriched biomass production in scenario A1; to PyAD and PHAs EoL in scenarios A2, B, and C; and to PHAs extraction and PHAs EoL in scenario A3. Relevant flows analysis indicates that the carbon dioxide emissions due to thermal energy and electricity production processes are key contributors in every scenario. Generally, the lower the non-renewable energy use, the better the results for GWPexc. In scenarios A3 and C, i.e., the two best performing scenarios, carbon dioxide savings are due to credits for energy production in the PHAs EoL phase. These credits are subtracted from the emissions due to the other life cycle phases, resulting in an overall environmental benefit for this impact category.
Differences among the five scenarios for eutrophication of freshwater are less than one order of magnitude. EuF is mainly related to PyAD in every scenario. In particular, it is related to the phosphorous emissions to freshwater deriving from WWTP and related sludge agricultural spreading, and to phosphate emissions to freshwater from biochar gasification ash disposal. Coherently, the impact increases as the amount of input ADSS to be processed increases.
As regards water depletion, scenarios are grouped into three clusters: The highest impact values are observed for A1 and A2, and the lowest ones for B and C, while A3 shows intermediate values. The relevant processes related to water depletion are different for the various scenarios. In scenario A1, this impact is roughly equally distributed among the different processes and PHAs EoL leads to a water saving of about 30%. In scenario A2, the contribution of PHAs extraction and PHAs-enriched biomass production decreases, while that of PyAD increases, as well as the percentage saving due to EoL. In scenario A3, the contribution of PyAD and PHAs-enriched biomass production decreases substantially, while that of PHAs extraction increases slightly; however, credits obtained from PHAs EoL lead to an overall environmental benefit. In scenarios B and C, WD is an “avoided impact” too, and for more than 50%, thanks to PHAs EoL. These savings are due to credits for energy production through plastics incineration, while the impacts in the other life cycle stages in every scenario are always due to electricity consumption from the grid mix.
Resources depletion shows a very similar pattern to that of water depletion for scenario A1, where the non-renewable elements and energy resource consumption for energy production have a high impact. The impact grows further in scenarios A3 and A2, in particular for the PyAD and PHAs-enriched biomass production phases, even if in these scenarios are due to the consumption of renewable energy sources. PyAD in scenario B and both PyAD and PHAs-enriched biomass production in scenario C show negative scores. This is due to credits obtained for the use in agriculture of WWTP sludge deriving from process water treatment, which implies an avoided consumption of phosphate ore for chemical fertilizer production. In scenarios B and C, the negative score is also due to the avoided consumption of non-renewable elements and energy resources for energy production. There are other impacts coming from non-renewable elements and resource consumption for methanol production in the PHAs extraction phase in all scenarios.
As mentioned above, two other relevant impact categories are POF and respiratory inorganics. Differences among the five scenarios for photochemical ozone formation are less than one order of magnitude and the results show a pattern similar to the eutrophication of freshwater. Impacts are mainly related to PyAD, in particular to nitrogen oxide emissions from syngas CHP and the boiler used for electricity and thermal energy production in scenarios B and C, and from biogas combustion in scenario A2. Coherently, the impact increases as the amount of syngas and biogas used to produce energy increases. As a proxy for respiratory inorganics, not present among the ILCD-recommended impact categories, it is possible to analyze the impact category of particulate matter. Additionally, for this category, the differences among the five scenarios are less than one order of magnitude, and the impact score is primarily due to PyAD, in particular to PM2.5, i.e. PM with a diameter of 2.5 μm or less, and nitrogen oxides emissions from syngas CHP and the boiler used for electricity and thermal energy production in scenarios B and C, and from thermal energy production through biogas combustion in scenario A2. In this case, biogas combustion causes a greater impact than syngas combustion.
Summarizing the contributions analysis, it is possible to claim that PyAD is generally the most relevant phase for each scenario and each relevant impact category, and that when there are exceptions, they are related to the avoided impacts obtained by PHAs EoL. The environmental impacts of PyAD in all scenarios are essentially due to the energy production processes, both from fossil and renewable sources, and also from the syngas CHP and boiler when present. Among the processes with the highest energy needs is the pertraction system used to transfer VFAs from dilute streams of anaerobic digestion into a VFAs-rich stream for PHAs production. The temperature difference between mesophilic anaerobic digestion with sporogenic bacteria and PHAs production with MMC results in a high thermal energy demand in the pertraction system because of the cooling of large volumes of liquid from AAF, which must be heated again to a mesophilic temperature before being recirculated back to AAF. As demonstrated by comparing the different scenarios, and in particular the A-based ones, the replacement of fossil energy sources with renewable energy sources does not allow ipso facto for a reduction of the environmental impacts due to this process in all the analyzed impact categories, but there is a trade-off between global and local impacts.
Generally, renewable energy sources cause lower fossil carbon emissions and a lower use of fossil primary energy and fossil resources, that is, lower impact values in global-scale categories; however, their total primary energy and their resource use is higher when renewable energies and resources are taken into account, but this is not the case when organic waste, such as ADSS, which is considered “impact free”, i.e., without any associated environmental impact, is used as an energy source. On the other hand, renewable energy production and particularly the production and combustion of biomass shows higher scores in regional- and local-scale impact categories; this is mainly due to the fact that biomass production requires vast agricultural areas and intensive cultivation methods, including the use of chemical fertilizers, and that biomass combustion is often less efficient than fossil fuel combustion, generating emissions and waste with high acidifying and eutrophicating potential, and with toxic effects.
However, it is possible to note that the A3—RE/Mix+SB scenario generally has good performances both on global impacts, such as climate change, thanks to the use of renewable resources, and on local ones, such as the water depletion, particulate matter emission, and eutrophication categories. The latter is thanks to the fact that the combustion processes of solid biomass (consisting mainly of by-products) have lower impacts compared to the combustion of biogas produced from ad hoc grown biomass (A2—RE/Pv+Bg), and that the renewable electricity mix has lower impacts than the electricity mix used in the “conventional energy” scenario (A1—ConvE).
The modelled end-of-life phase leads to environmental credits being obtained. In fact, electricity and thermal energy is produced from both PHAs’ direct combustion in waste-to-energy plants and the combustion of recovered biogas generated by PHAs’ degradation in landfills. Thanks to this energy production, an equivalent amount of energy production from non-renewable resources, with greater environmental impact, is avoided.
An undeniable advantage of PHAs is their biodegradability, which at the moment is not fully considered and evaluated within the LCA methodology. While methodological research in this field shall go on, in the near future, a different end-of-life for these polymers is foreseeable as their diffusion increases, that is, their collection together with organic waste, followed by the recovery of the carbon content through composting or anaerobic digestion. At that stage, it will be appropriate and interesting to assess which end-of-life of the polymer will bring the greatest benefits.

3.2.3. Comparison with PHAs Literature and Other Polymers’ Results

In terms of environmental performance, in general, bio-based products tend to compare poorly against their respective conventional counterparts on impact categories, such as eutrophication, an impact typically caused by fertilizers during biomass cultivation [76,77]. Mixed results have been reported for other categories, including acidification and tropospheric ozone formation. Claims of environmental benefits for bioproducts often rely on reduced greenhouse gas (GHG) emissions and non-renewable energy use. In any case, the wide ranges of objectives, scopes, methodological choices, and results of LCA studies on bio-based products makes it difficult not only to infer a general trend on their environmental impacts but also to suggest a widely applicable way to reduce their impacts [76]. However, as regards PHAs production specifically, and as it is shown in the following comparison with the literature, the choice of feedstock and the use of residues and co-products for energy production can reduce the environmental impacts of this process [12,31,33,34,36,40,41].
In Figure 4, the values of non-biogenic GHGs emissions per kilogram of PHAs obtained by various authors are compared; data are in chronological order and the whole range of results found in each paper, including this study, is represented when available. Figure 4 shows also the values for four other polymers with which the PHAs are compared with, two of them are fossil-based (PET and PP) and two bio-based (bio-PP and PLA).
Generally, values range from 0.5 to 5 kg of CO2-equivalent per kilogram of PHAs. The results of the present study fall within this range. However, great variability exists among the studies. A potential impact up to about 25 kg CO2-equivalent per kg of PHAs was assessed by Pietrini and coauthors [32] and an avoided impact of up to about 6 kg CO2-equivalent per kg of PHAs was evaluated by Rostkowski and coauthors [35]. Higher values were reported by Pietrini and coauthors [32], Kendall [36], and Posen and coauthors [38] and they correspond to sugar cane- and corn-derived polyhydroxybutyrate (PHB). Lower values (i.e., below 0.5 kg CO2-equivalent emitted per kilogram of biopolymer) were reported by studies that account for carbon uptake during biomass growth, thereby considering carbon storage in the bio-based polymer [26,27,28,30] or when the only carbon source is a waste [12,41]. Negative impacts were reported when the energy source [33] or also when waste streams from PHAs production are used for energy recovery [35].
In Figure 5, the fossil energy requirement for PHAs production reported by various authors is compared; data are in chronological order and the whole range of results found in each paper, including this study, are represented when available. Figure 5 shows also the values for four other polymers with which the PHAs are compared; two of them are fossil-based (PET and PP) and two bio-based (bio-PP and PLA).
Data range from 320 to −12 MJ per kilogram of PHAs, with median values spanning between 20 to 80 MJ per kilogram of biopolymer. The present work shows values ranging from about 80 to −10 MJ per kg of PHAs, depending on the considered scenarios. The highest values were reported by Pietrini and coauthors [32] and Sakamoto [37], where carbon sources are from dedicated crops and the whole life cycle of PHB-based end products is considered. The lowest values were reported in studies where the use of organic residues as fuel to generate electricity and steam is assumed [26,29].
As regards the comparison of PHAs from ADSS with other polymers, first of all, it can be noted that the bio-based polymers tend to have both lower non-biogenic GHGs emissions and lower fossil energy demand values than the fossil-based polymers, as expected. For both indicators, the PHAs’ range of values overlaps the range of other polymers’ values, being wider. PHAs’ average value is only slightly higher than that of bio-PP and PLA, and falls within the range of fossil-based PET and PP.
In summary, the performances of PHAs produced from sewage sludge of the agro-industry analyzed in this study are of the same order of magnitude as those of other PHAs production processes found in the literature, in terms of both non-biotic GHG emissions and energy demand. Moreover, their performances also overlap with those of other fossil-based and bio-based polymers. This is a good omen, considering that there is still room for improvement for this process and that no primary data is available at the industrial scale yet.

4. Conclusions

From the analysis of the energy indicators, it was possible to observe that the use of ADSS for onsite energy production (scenario C—MostSyn2E) results in an increase of the overall renewable energy ratio (95%), while decreasing the PE (−85%), the fossil energy used (−84%), and the dependency from the external supply, despite a lower energy return and a higher total energy invested. On the other hand, the use of a mix of external sources of renewable energy, such as in scenario A3—RE/Mix+SB, can allow for a higher energy return and a lower total renewable energy invested, while keeping both the renewable energy ratio and fossil energy efficiency use at high levels. PHAs EoL can further enhance the energy return by allowing for a recovery of up to 66% of PHAs energy.
From the LCA analysis, it was possible to observe that differences among the five scenarios for PED, R+NR, GWPexc., WD, and RD are high. Smaller differences, less than one order of magnitude, were observed for EuF, PM, and POF. The only category equally impacted in all five scenarios was OD. It is possible to conclude that scenario C—MostSyn2E is the best in climate change, primary energy demand from renewable and non-renewable resources, and resources depletion categories, while scenario A1—ConvE prevails on acidification, eutrophication, and generally in categories related to local and regional impacts. The results highlight a trade-off between local/regional impacts and global ones. It cannot be established in a straightforward way whether one scenario prevails over the others, as the ranking depends on the method adopted to establish it. However, also from the LCA perspective, the use of a mix of renewable sources can help find a balance between opposite scenarios, and contribute to significantly lowering the global impacts while keeping local ones at low levels.
PyAD is generally the life cycle phase showing the highest impacts, essentially due to the high energy demand and the related combustion processes; on the other hand, PHAs EoL usually generates avoided impacts. The innovative pertraction system has high thermal energy needs, due to the unavoidable small temperature gap, but multiplied by very large volumes, between VFAs-producing anaerobic acidogenic fermentation and PHAs-producing aerobic reactors with MMC.
Anyway, the PHAs produced from sewage sludge analyzed in this study already show environmental performances comparable to those of both fossil-based and bio-based polymers, in terms of both non-biotic GHG emissions and energy demand. New data at the industrial scale and the improvement of technology, besides the use of renewable energy sources, will make this process a competitive candidate for the production of biopolymers on a wide scale, also considering the vast availability of low-value sustainable feedstock.

Author Contributions

Conceptualization, D.M., P.G. and S.R.; Data curation, L.V., S.M., C.T. and C.S.; Formal analysis, L.V., S.M. and C.T.; Funding acquisition, D.M., P.G. and S.R.; Investigation, L.V., S.M., C.T. and C.S.; Methodology, L.V., S.M., D.M. and S.R.; Project administration, P.G. and S.R.; Resources, L.V., P.G., C.T., C.S. and S.R.; Supervision, S.R.; Validation, D.M., P.G. and S.R.; Visualization, L.V.; Writing—original draft, L.V., S.M. and S.R.; Writing—review & editing, L.V., S.M., D.M., P.G., C.T., C.S. and S.R. All authors have read and agreed to the published version of the manuscript.

Funding

This research was funded by both Regione Emilia-Romagna through European Regional Development Fund, grant number PG/2015/735284 (“VALSOVIT” project), and EIT Climate-KIC through both Pathfinder program (“BioGrapPa” project) and Accelerator program (“B-PLAS” project).

Acknowledgments

The authors wish to thank Alberto Novi of thinkstep Ltd. and Filippo Baioli of CIRSA—University of Bologna for their support and their advice in modelling with GaBi software, and also the company Caviro Extra Ltd. for supplying the sludge samples for the experiments.

Conflicts of Interest

The authors declare no conflict of interest. The funders had no role in the design of the study; in the collection, analyses, or interpretation of data; in the writing of the manuscript, or in the decision to publish the results.

Abbreviations

AAFAnaerobic acidogenic fermenter
ADAnaerobic digestion
ADSSAnaerobically digested sewage sludge
APAcidification midpoint
ARAccumulation reactor
BgBiogas
Bio-PPBio-polypropylene
CHPCombined heat and power
CODChemical oxygen demand
CODeqChemical oxygen demand equivalent
DMDry matter
DMCDimethyl carbonate
EEoL Energy recovered after PHAs end-of-life treatment, as net calorific value
EPHAsEnergy contained in PHAs, as net calorific value
Esludge Energy contained in sludge, as net calorific value
Esludge, for H+EEnergy contained in the sludge fraction used to produce heat and electricity, as net calorific value
Esludge, for PHAsEnergy contained in the sludge fraction transformed into PHAs, as net calorific value
EoLEnd-of-life
EREnergy return
ERPHAs, EoLEnergy return as the rate of the net energy required (invested minus recovered) for PHAs production contained in PHAs
ERPHAs, overall Energy return as the rate of the total energy invested in PHAs production contained in PHAs
EROEIEnergy return on energy invested
EuFEutrophication freshwater midpoint
EuMEutrophication marine midpoint
EuTEutrophication terrestrial midpoint
FEEcotoxicity freshwater midpoint
FERPHAsFossil energy ratio as the energy contained in PHAs per unit of primary energy from fossil resources invested
FUFunctional unit
GHGGreenhouse gas
GWPexc.Climate change midpoint, excluded biogenic carbon
GWPinc.Climate change midpoint, included biogenic carbon
H+EHeat and electricity production
HBHydroxybutyrate
HHHydroxyhexanoate
HTcHuman toxicity midpoint, cancer effects
HTncHuman toxicity midpoint, non-cancer effects
HVHydroxyvalerate
IRIonizing radiation midpoint, human health
LCALife cycle assessment
LULand use midpoint
MixElectricity grid mix
MMCMixed microbial culture
NCVNet calorific value
ODOzone depletion midpoint
PEPrimary energy
PEfossilPrimary energy from fossil sources (heat, electricity, other inputs)
PErenewable for H+EPrimary energy from renewable sources externally supplied for heat and electricity
PED, R+NRPrimary energy demand from renewable and non-renewable resources
PETPolyethylene terephthalate
PHAsPolyhydroxyalkanoates
PHBPolyhydroxybutyrate
PLAPolylactic acid
PMParticulate matter / Respiratory inorganics midpoint
PM2.5Particulate matter with a diameter of 2.5 μm or less
POFPhotochemical ozone formation midpoint
PPPolypropylene
PvPhotovoltaic
PyADPyrolysis followed by anaerobic digestion
RDResource depletion mineral, fossils and renewables
RERenewable energy
RERRenewable energy ratio
RERfor H+ERenewable energy ratio as the renewable quota of energy used only for heat and electricity production
RERoverallRenewable energy ratio as the renewable quota of total energy invested in PHAs production
SBSolid biomass
SBRSequencing batch reactor
TOATrioctylamine
TOA10-BBiodiesel-based liquid membrane with 10% in weight of trioctylamine
VFAsVolatile fatty acids
WDResource depletion water midpoint
wtWeight
WWTPWastewater treatment plant

References

  1. EC (European Commission). Communication from the Commission to the European Parliament, the Council, the European Economic and Social Committee and the Committee of the Regions; Closing the loop—An EU action plan for the Circular Economy. COM (2015) 614 final; EC: Brussels, Belgium, 2015. [Google Scholar]
  2. Almendro-Candel, M.B.; Gómez Lucas, I.; Navarro-Pedreño, J.; Zorpas, A.A. Physical Properties of Soils Affected by the Use of Agricultural Waste. In Agricultural Waste and Residues, 1st ed.; Aladjadjiyan, A., Ed.; IntechOpen: London, UK, 2018; Available online: https://www.intechopen.com/books/agricultural-waste-and-residues/physical-properties-of-soils-affected-by-the-use-of-agricultural-waste (accessed on 7 April 2020). [CrossRef] [Green Version]
  3. European Bioplastics. Sound LCA as a Basis for Policy Formulation. 2019. Available online: https://docs.european-bioplastics.org/publications/pp/EUBP_PP_LCA_as_a_basis_for_policy_formulation.pdf (accessed on 7 April 2020).
  4. World Economic Forum; Ellen MacArthur Foundation and McKinsey & Company. The New Plastics Economy—Rethinking the Future of Plastics. Available online: https://www.newplasticseconomy.org/assets/doc/EllenMacArthurFoundation_TheNewPlasticsEconomy_Pages.pdf (accessed on 7 April 2020).
  5. Rodriguez-Perez, S.; Serrano, A.; Pantión, A.A.; Alonso-Fariñas, B. Challenges of scaling-up PHA production from waste streams. A review. J. Environ. Manag. 2018, 205, 215–230. [Google Scholar] [CrossRef] [Green Version]
  6. Serafim, L.S.; Lemos, P.C.; Albuquerque, M.G.E.; Reis, M.A.M. Strategies for PHA production by mixed cultures and renewable waste materials. Appl. Microbiol. Biotechnol. 2008, 81, 615–628. [Google Scholar] [CrossRef]
  7. Eshtaya, M.K.; Rahman, N.A.; Hassan, M.A. Bioconversion of restaurant waste into Polyhydroxybutyrate (PHB) by recombinant E. coli through anaerobic digestion. Int. J. Environ. Waste Manag. 2013, 11, 27–37. [Google Scholar] [CrossRef]
  8. Bugnicourt, E.; Cinelli, P.; Lazzeri, A.; Alvarez, V. Polyhydroxyalkanoate (PHA): Review of synthesis, characteristics, processing and potential applications in packaging. Express Polym. Lett. 2014, 8, 791–808. [Google Scholar] [CrossRef] [Green Version]
  9. Nielsen, C.; Rahman, A.; Rehman, A.U.; Walsh, M.K.; Mille, C.D. Food waste conversion to microbial polyhydroxyalkanoates. Microb. Biotechnol. 2017, 10, 1338–1352. [Google Scholar] [CrossRef] [PubMed]
  10. CSU (California State University Chico Research Institute). Performance Evaluation of Environmentally Degradable Plastic Packaging and Disposable Food Service Ware—Final Report; The California Integrated Waste Management Board: California, CA, USA, 2007; pp. 1–40. [Google Scholar]
  11. Koller, M. Advances in polyhydroxyalkanoate (PHA) production. Bioengineering 2017, 4, 88. [Google Scholar] [CrossRef] [Green Version]
  12. Gurieff, N.; Lant, P. Comparative life cycle assessment and financial analysis of mixed culture polyhydroxyalkanoates production. Bioresour. Technol. 2007, 98, 3393–3403. [Google Scholar] [CrossRef] [PubMed]
  13. Koller, M.; Maršálek, L.; de Miranda Sousa Dias, M.; Braunegg, G. Producing microbial polyhydroxyalkanoate (PHA) biopolyesters in a sustainable manner. New Biotechnol. 2017, 37, 24–38. [Google Scholar] [CrossRef]
  14. Samorì, C.; Kiwan, A.; Torri, C.; Conti, R.; Galletti, P.; Tagliavini, E. Polyhydroxyalkanoates and Crotonic Acid from Anaerobically Digested Sewage Sludge. ACS Sustain. Chem. Eng. 2019, 7, 10266–10273. [Google Scholar] [CrossRef]
  15. Valentino, F.; Moretto, G.; Lorini, L.; Bolzonella, D.; Pavan, P.; Majone, M. Pilot-Scale Polyhydroxyalkanoate Production from Combined Treatment of Organic Fraction of Municipal Solid Waste and Sewage Sludge. Ind. Eng. Chem. Res. 2019, 58, 12149–12158. [Google Scholar] [CrossRef]
  16. Battista, F.; Frison, N.; Pavan, P.; Cavinato, C.; Gottardo, M.; Fatone, F.; Eusebi, A.L.; Majone, M.; Zeppilli, M.; Valentino, F. Food wastes and sewage sludge as feedstock for an urban biorefinery producing biofuels and added-value bioproducts. Chem. Technol. Biotechnol. 2020, 95, 328–338. [Google Scholar] [CrossRef]
  17. Werker, A.; Bengtsson, S.; Korving, L.; Hjort, M.; Anterrieu, S. Consistent production of high quality PHA using activated sludge harvested from full scale municipal wastewater treatment—PHARIO. Water Sci. Technol. 2018, 78, 2256–2269. [Google Scholar] [CrossRef] [PubMed]
  18. Kumar, M.; Ghosh, P.; Khosla, K.; Thakur, I.S. Recovery of polyhydroxyalkanoates from municipal secondary wastewater sludge. Bioresour. Technol. 2018, 255, 111–115. [Google Scholar] [CrossRef]
  19. Torri, C.; Weme, T.D.O.; Samorì, C.; Kiwan, A.; Brilman, D.W.F. Renewable alkenes from the hydrothermal treatment of polyhydroxyalkanoates-containing sludge. Environ. Sci. Technol. 2017, 51, 12683–12691. [Google Scholar] [CrossRef]
  20. Rathika, R.; Janaki, V.; Shanthi, K.; Kamala-Kannan, S. Bioconversion of agro-industrial effluents for polyhydroxyalkanoates production using Bacillus subtilis RS1. Int. J. Environ. Sci. Technol. 2019, 16, 5725–5734. [Google Scholar] [CrossRef]
  21. Anjali, M.; Sukumar, C.; Kanakalakshmi, A.; Shanthi, K. Enhancement of growth and production of polyhydroxyalkanoates by Bacillus subtilis from agro-industrial waste as carbon substrates. Compos. Interfaces 2014, 21, 111–119. [Google Scholar] [CrossRef]
  22. Fang, F.; Xu, R.Z.; Huang, Y.Q.; Wang, S.N.; Zhang, L.L.; Dong, J.Y.; Xie, W.M.; Chen, X.; Cao, J.S. Production of polyhydroxyalkanoates and enrichment of associated microbes in bioreactors fed with rice winery wastewater at various organic loading rates. Bioresour. Technol. 2019, 292, 121978. [Google Scholar] [CrossRef]
  23. Bhalerao, A.; Banerjee, R.; Nogueira, R. Continuous cultivation strategy for yeast industrial wastewater-based polyhydroxyalkanoate production. J. Biosci. Bioeng. 2019, 129, 595–602. [Google Scholar] [CrossRef]
  24. Gerngross, T.U. Can biotechnology move us toward a sustainable society? Nat. Biotechnol. 1999, 17, 541–544. [Google Scholar] [CrossRef]
  25. Harding, K.G.; Dennis, J.S.; von Blottnitz, H.; Harrison, S.T.L. Environmental analysis of plastic production processes: Comparing petroleum-based polypropylene and polyethylene with biologically-based poly-b-hydroxybutyric acid using life cycle analysis. J. Biotechnol. 2007, 130, 57–66. [Google Scholar] [CrossRef] [PubMed]
  26. Kim, S.; Dale, B.E. Energy and greenhouse gas profiles of polyhydroxybutyrates derived from corn grain: A life cycle perspective. Environ. Sci. Technol. 2008, 42, 7690–7695. [Google Scholar] [CrossRef]
  27. Yu, J.; Chen, L.X.L. The greenhouse gas emissions and fossil energy requirement of bioplastics from cradle to gate of a biomass refinery. Environ. Sci. Technol. 2008, 42, 6961–6966. [Google Scholar] [CrossRef]
  28. Khoo, H.H.; Tan, R.B.H.; Chang, K.W.L. Environmental impacts of conventional plastic and bio-based carrier bags. Int. J. Life Cycle Assess. 2010, 15, 284–293. [Google Scholar] [CrossRef]
  29. Kim, S.; Dale, B.E. Life cycle assessment study of biopolymers (polyhydroxyalkanoates)-derived from no-tilled corn. Int. J. Life Cycle Assess. 2005, 10, 200–210. [Google Scholar] [CrossRef]
  30. Akiyama, M.; Tsuge, T.; Doi, Y. Environmental life cycle comparison of polyhydroxyalkanoates produced from renewable carbon resources by bacterial fermentation. Polym. Degrad. Stabil. 2003, 80, 183–194. [Google Scholar] [CrossRef]
  31. Hermann, B.G.; Blok, K.; Patel, M.K. Producing bio-based bulk chemicals using industrial biotechnology saves energy and combats climate change. Environ. Sci. Technol. 2007, 41, 7915–7921. [Google Scholar] [CrossRef] [Green Version]
  32. Pietrini, M.; Roes, L.; Patel, M.K.; Chiellini, E. Comparative life cycle studies on poly(3-hydroxybutyrate)-based composites as potential replacement for conventional petrochemical plastics. Biomacromolecules 2007, 8, 2210–2218. [Google Scholar] [CrossRef] [Green Version]
  33. Kurdikar, D.; Paster, M.; Gruys, K.J.; Fournet, L.; Gerngross, T.U.; Slater, S.C.; Coulon, R. Greenhouse gas profile of a plastic derived from a genetically modified plant. J. Ind. Ecol. 2001, 4, 107–122. [Google Scholar] [CrossRef]
  34. Fernández-Dacosta, C.; Posada, J.A.; Ramirez, A. Techno-economic and carbon footprint assessment of methyl crotonate and methyl acrylate production from wastewater-based polyhydroxybutyrate (PHB). J. Clean. Prod. 2016, 137, 942–952. [Google Scholar] [CrossRef]
  35. Rostkowski, K.H.; Criddle, C.S.; Lepech, M.D. Cradle-to-gate life cycle assessment for a cradle-to-cradle cycle: Biogas-to-bioplastic (and back). Environ. Sci. Technol. 2012, 46, 9822–9829. [Google Scholar] [CrossRef]
  36. Kendall, A. A life cycle assessment of biopolymer production from material recovery facility residuals. Resour. Conserv. Recy. 2012, 61, 69–74. [Google Scholar] [CrossRef]
  37. Sakamoto, Y. Life Cycle Assessment of Biodegradable Plastics. J. Shanghai Jiaotong Univ. 2012, 17, 327–329. [Google Scholar] [CrossRef]
  38. Posen, I.D.; Jaramillo, P.; Griffin, W.M. Uncertainty in the Life Cycle Greenhouse Gas Emissions from U.S. Production of Three Biobased Polymer Families. Environ. Sci. Technol. 2016, 50, 2846–2858. [Google Scholar] [CrossRef]
  39. Heimersson, S.; Morgan-Sagastume, F.; Peters, G.M.; Werker, A.; Svanström, M. Methodological issues in life cycle assessment of mixed-culture polyhydroxyalkanoate production utilising waste as feedstock. New Biotechnol. 2014, 31, 383–393. [Google Scholar] [CrossRef] [PubMed]
  40. Fernández-Dacosta, C.; Posada, J.A.; Kleerebezem, R.; Cuellar, M.C.; Ramirez, A. Microbial community-based polyhydroxyalkanoates (PHAs) production from wastewater: Techno-economic analysis and ex-ante environmental assessment. Bioresour. Technol. 2015, 185, 368–377. [Google Scholar] [CrossRef]
  41. Morgan-Sagastume, F.; Heimersson, S.; Laera, G.; Werker, A.; Svanström, M. Techno-environmental assessment of integrating polyhydroxyalkanoate (PHA) production with services of municipal wastewater treatment. J. Clean. Prod. 2016, 137, 1368–1381. [Google Scholar] [CrossRef]
  42. Dietrich, K.; Dumont, M.J.; Del Rio, L.F.; Orsat, V. Producing PHAs in the bioeconomy—Towards a sustainable bioplastic. Sustain. Prod. Consum. 2017, 9, 58–70. [Google Scholar] [CrossRef]
  43. Vega, G.C.; Sohn, J.; Bruun, S.; Olsen, S.I.; Birkved, M. Maximizing environmental impact savings potential through innovative biorefinery alternatives: An application of the TM-LCA framework for regional scale impact assessment. Sustainability 2019, 11, 3836. [Google Scholar] [CrossRef] [Green Version]
  44. Yadav, B.; Pandey, A.; Kumar, L.R.; Tyagi, R.D. Bioconversion of waste (water)/residues to bioplastics- A circular bioeconomy approach. Bioresour. Technol. 2020, 298, 122584. [Google Scholar] [CrossRef]
  45. Kookos, I.K.; Koutinas, A.; Vlysidis, A. Life cycle assessment of bioprocessing schemes for poly(3-hydroxybutyrate) production using soybean oil and sucrose as carbon sources. Resour. Conserv. Recy. 2019, 141, 317–328. [Google Scholar] [CrossRef]
  46. Lopez-Arenas, T.; González-Contreras, M.; Anaya-Reza, O.; Sales-Cruza, M. Analysis of the fermentation strategy and its impact on the economicsof the production process of PHB (polyhydroxybutyrate). Comput. Chem. Eng. 2017, 107, 140–150. [Google Scholar] [CrossRef]
  47. Righi, S.; Baioli, F.; Samorì, C.; Galletti, P.; Tagliavini, E.; Stramigioli, C.; Tugnoli, A.; Fantke, P. A life cycle assessment of poly-hydroxybutyrate extraction from microbial biomass using dimethyl carbonate. J. Clean. Prod. 2017, 168, 692–707. [Google Scholar] [CrossRef] [Green Version]
  48. Narodoslawsky, M.; Shazad, K.; Kollmann, R.; Schnitzer, H. LCA of PHA Production—Identifying the Ecological Potential of Bio-plastic. Chem. Biochem. Eng. Q. 2015, 29, 299–305. [Google Scholar] [CrossRef]
  49. Cristóbal, J.; Matos, C.T.; Aurambout, J.-P.; Manfredi, S.; Kavalov, B. Environmental sustainability assessment of bioeconomy value chains. Biomass Bioenergy 2016, 89, 159–171. [Google Scholar] [CrossRef]
  50. Moita, R.; Lemos, P.C. Biopolymers production from mixed cultures and pyrolysis by-products. J. Biotechnol. 2012, 157, 578–583. [Google Scholar] [CrossRef] [PubMed]
  51. Fabbri, D.; Torri, C. Linking pyrolysis and anaerobic digestion (Py-AD) for the conversion of lignocellulosic biomass. Curr. Opin. Biotech. 2016, 38, 167–173. [Google Scholar] [CrossRef]
  52. Bridgwater, A.V. Review of fast pyrolysis of biomass and product upgrading. Biomass Bioenergy 2012, 38, 68–94. [Google Scholar] [CrossRef]
  53. Hagos, F.Y.; Aziz, A.R.A.; Sulaiman, S.A. Trends of Syngas as a Fuel in Internal Combustion Engines. Adv. Mech. Eng. 2014, 6, 1–10. [Google Scholar] [CrossRef]
  54. Lehmann, J.; Joseph, S. Biochar for environmental management: An introduction. In Biochar for Environmental Management; Lehmann, J., Joseph, S., Eds.; Earthscan: Sterling, VA, USA, 2015; pp. 33–46. [Google Scholar]
  55. Torri, C.; Cordiani, H.; Samorì, C.; Favaro, L.; Fabbri, D. Fast procedure for the analysis of polyhydroxyalkanoates in bacterial cells by off-line pyrolysis/gas-chromatography with flame ionization detector. J. Chromatogr. 2014, 1359, 230–236. [Google Scholar] [CrossRef]
  56. Weiland, P. Biogas production: Current state and perspectives. Appl. Microbiol. Biotechnol. 2010, 85, 849–860. [Google Scholar] [CrossRef] [PubMed]
  57. Torri, C.; Samorì, C.; Ajao, V.; Baraldi, S.; Galletti, P.; Tagliavini, E. Pertraction of volatile fatty acids through biodiesel-based liquid membranes. Chem. Eng. J. 2019, 366, 254–263. [Google Scholar] [CrossRef]
  58. Dionisi, D.; Majone, M.; Tandoi, V.; Beccari, M. Sequencing batch reactor: Influence of periodic operation on performance of activated sludges in biological wastewater treatment. Ind. Eng. Chem. Res. 2001, 40, 5110–5119. [Google Scholar] [CrossRef]
  59. Dionisi, D.; Majone, M.; Vallini, G.; Di Gregorio, S.; Beccari, M. Effect of the applied organic load rate on biodegradable polymer production by mixed microbial cultures in a sequencing batch reactor. Biotechnol. Bioeng. 2006, 93, 76–88. [Google Scholar] [CrossRef] [PubMed]
  60. Bengtsson, S.; Werker, A.; Christensson, M.; Welander, T. Production of polyhydroxyalkanoates by activated sludge treating a paper mill wastewater. Bioresour. Technol. 2008, 99, 509–516. [Google Scholar] [CrossRef] [PubMed]
  61. COREPLA. Relazione Sulla Gestione. 2016. Available online: http://www.corepla.it/documenti/621248cb-892c-4351-bef3-4e55f4559919/03+Relazione+sulla+gestione+2016.pdf (accessed on 7 April 2020).
  62. ISO (International Organization for Standardization). ISO 14040: Environmental Management—Life Cycle Assessment—Principles and Framework; ISO: Geneve, Switzerland, 2006. [Google Scholar]
  63. ISO (International Organization for Standardization). ISO 14044: Environmental Management—Life Cycle Assessment—Requirements and Guidelines; ISO: Geneve, Switzerland, 2006. [Google Scholar]
  64. Ministero dello Sviluppo Economico (MISE), Ministero dell’Ambiente e della Tutela del Territorio e del Mare (MATTM), Ministero delle Infrastrutture e dei Trasporti (MIT). Integrated National Energy and Climate Plan. Available online: https://www.mise.gov.it/images/stories/documenti/it_final_necp_main_en.pdf (accessed on 7 April 2020).
  65. Franklin Associates. Life Cycle Inventory of Five Products Produced from Polylactide (PLA) and Petroleum-Based Resins; Athena Institute International: Kansas, KS, USA, 2006. [Google Scholar]
  66. Álvarez-Chávez, C.R.; Edwards, S.; Moure-Eraso, R.; Geiser, K. Sustainability of bio-based plastics: General comparative analysis and recommendations for improvement. J. Clean. Prod. 2012, 23, 47–56. [Google Scholar] [CrossRef]
  67. Hottle, T.A.; Bilec, M.M.; Landis, A.E. Sustainability assessments of bio-based polymers. Polym. Degrad. Stab. 2013, 98, 1898–1907. [Google Scholar] [CrossRef]
  68. Salhofer, S.; Schneider, F.; Obersteiner, G. The ecological relevance of transport in waste disposal systems in Western Europe. Waste Manag. 2007, 27, S47–S57. [Google Scholar] [CrossRef]
  69. PlasticsEurope. Plastics—the Facts 2015. An Analysis of European Plastics Production, Demand and Waste Data. Available online: http://www.plasticseurope.org/documents/document/20151216062602-plastics_the_facts_2015_final_30pages_14122015.pdf (accessed on 7 April 2020).
  70. European Bioplastics. Bioplastics—Furthering Efficient Waste Management. 2017. Available online: https://docs.european-bioplastics.org/publications/fs/EUBP_FS_End-of-life.pdf (accessed on 7 April 2020).
  71. Thinkstep. GaBi Professional Database. 2017. Available online: http://www.gabi-software.com/support/gabi/gabi-database-2020-lci-documentation/professional-database-2020 (accessed on 7 April 2020).
  72. Frischknecht, R.; Jungbluth, N.; Althaus, H.-J.; Doka, G.; Heck, T.; Hellweg, S.; Hischier, R.; Nemecek, T.; Rebitzer, G.; Spielmann, M.; et al. Overview and Methodology. Data v2.0. Ecoinvent Report No. 1; Swiss Centre for Life Cycle Inventories: Dübendorf, Switzerland, 2007. [Google Scholar]
  73. EC-JRC (European Commission Joint Research Centre). International Reference Life Cycle Data System (ILCD) Handbook. Recommendations for Life Cycle Impact Assessment in the European Context, 1st ed.; European Commission, Joint Research Centre: Ispra, Italy, 2011. [Google Scholar]
  74. EC-JRC (European Commission Joint Research Centre). Characterisation Factors of the ILCD Recommended Life Cycle Impact Assessment Methods. Database and Supporting Information, 1st ed.; European Commission, Joint Research Centre, Institute for Environment and Sustainability: Ispra, Italy, 2012. [Google Scholar]
  75. EC-JRC (European Commission Joint Research Centre). PEFCR Guidance document—Guidance for the development of Product Environmental Footprint Category Rules (PEFCRs), version 6.3; EC-JRC: Ispra, Italy, December 2017. [Google Scholar]
  76. Weiss, M.; Haufe, J.; Carus, M.; Brandao, M.; Bringezu, S.; Hermann, B.; Patel, M.K. A Review of the Environmental Impacts of Biobased Materials. J. Ind. Ecol. 2012, 16, S169–S181. [Google Scholar] [CrossRef]
  77. Righi, S.; Bandini, V.; Marazza, D.; Baioli, F.; Torri, C.; Contin, A. Life Cycle Assessment of high ligno-cellulosic biomass pyrolysis coupled with anaerobic digestion. Bioresour. Technol. 2016, 212, 245–253. [Google Scholar] [CrossRef]
Figure 1. Process for PHAs production involving mixed microbial cultures.
Energies 13 02706 g001
Figure 2. System boundary. The colored dotted lines delimit the four life cycle phases considered in the analysis, with the same color code used in the results graphs. The feedstock and the main product and co-products are indicated in the oval boxes, the processes in the rectangular boxes, and the flows in italics.
Energies 13 02706 g002
Figure 3. Relative contribution of LCA phases to midpoint impact categories scores for each of the five analyzed scenarios (A1, A2, A3, B, C).
Energies 13 02706 g003
Figure 4. Greenhouse gases emissions reported in previous PHAs production studies compared to those of PHAs production investigated in this study and those calculated for other polymers. The symbol “*” before reference number indicates that the system boundaries are “cradle-to-grave”, otherwise they are “cradle-to-gate”. The whole range of results of each study are represented when available.
Energies 13 02706 g004
Figure 5. Non-renewable energy demand reported in previous PHAs production studies compared to that of PHAs production investigated in this study and that calculated for other polymers. The symbol “*” before reference number indicates that the system boundaries are “cradle-to-grave”, otherwise they are “cradle-to-gate”. The whole range of results of each study are represented when available.
Energies 13 02706 g005
Table 1. Main parameters used for the industrial scale-up modeling of the process and related values. A reference is provided for already published data; otherwise, data are unpublished. HB: hydroxybutyrate; HV: hydroxyvalerate; HH: hydroxyhexanoate.
Process StepParameterUnitValueReference
Pyrolysisyield of syngas from ADSSg COD/g COD0.31-
yield of oil from ADSSg COD/g COD0.22-
yield of biochar from ADSSg COD/g COD0.47-
Biochar gasificationyield of syngas from biocharg COD/g COD0.70-
Anaerobic acidogenic fermenteryield of VFAs from oilg COD/g COD0.33-
yield of VFAs from syngasg COD/g COD0.80-
residence timedays7-
organic loadg COD/L/day7-
Pertraction systemVFAs concentration after pertractiong COD/L6.9estimate based on [57]
Sequencing Batch Reactor (SBR)VFAs to SBR% of total VFAs35-
residence timehours24-
Accumulation Reactor (AR)VFAs to AR% of total VFAs65-
residence timehours6-
yield of PHAs from VFAsg COD/g COD0.5estimate based on [14]
PHAs concentration in microbial cellsg/g0.6estimate based on [14]
HB:HV:HH ratio 88:11:1[14]
PHAs extraction systembiomass to DMC ratiokg/L0.025[47]
recovered DMC%97[47]
recovered polymer%96[47]
Table 2. Renewable electricity mix composition for scenario A3—RE/Mix+SB.
Electric Energy SourceUnitValue
Photovoltaic%39.92
Hydroelectric%26.92
Wind%22.66
Geothermal%3.88
Biogas%3.69
Solid biomass%1.87
Waste%1.07
Table 3. Life cycle inventory data of the main flows, referred to the functional unit (1 kg of PHAs produced). I = input, O = output.
Process StepFlowInput/OutputUnitScenarios
A 1BC
Biomass inletADSS from WWTPIkg203.60440.89688.64
Feedstock centrifugesludgeIkg209.97448.04695.22
wastewaterOkg176.36378.16588.06
Feedstock dryerdried sludge (85% DM)Okg10.3321.1632.17
Pyrolysispyrolysis waterOkg2.024.156.31
pyrolysis bio-oilOkg0.681.402.12
pyrolysis biocharOkg5.0610.3715.76
pyrolysis syngasOkg2.565.257.98
Biochar gasificationashOkg3.387.2811.33
biochar syngasOkg4.888.9912.89
Energy productionpyrolysis syngas to energy productionIkg0.000.003.54
biochar syngas to energy productionIkg0.008.9912.89
electricity from syngasOMJ0.0023.7129.21
thermal energy from syngasOMJ0.0031.2895.69
External energy supply 2electricity supplyIMJ18.530.000.00
thermal energy supplyIMJ51.3342.010.00
Anaerobic acidogenic fermentersyngas to VFAsIkg7.445.254.44
VFAsOkg4.494.494.49
AAF sludge centrifugeconcentrated biological sludge (25% DM) recycledOkg1.522.062.23
concentrated biological sludge (25% DM) to agricultural spreadingOkg0.420.160.27
Pertraction systemVFAs solutionOkg700.37700.37700.37
Water supplytap waterIkg0.000.000.00
recycled waterIkg695.88695.88695.88
Sequencing Batch Reactor (SBR)VFAs solution to SBRIkg243.86243.86243.86
biomass solution to AROkg240.53240.53240.53
Accumulation Reactor (AR)VFAs solution to ARIkg456.51456.51456.51
PHAs-enriched biomass solutionOkg68.3368.3368.33
PHAs extraction systemPHAs-enriched biomass driedIkg8.338.338.33
DMCIkg0.190.190.19
PHAsOkg1.001.001.00
waste biomass sludge recycledOkg7.487.487.48
PHAs End-of-LifePHAs to incinerationIkg0.850.850.85
PHAs to landfillIkg0.150.150.15
electricityOMJ5.725.725.72
steamOMJ10.1010.1010.10
1 Data for the three A-based scenarios are reported in a single column since they differ only in the external energy source used, and not in flow figures. 2 Various energy sources, depending on scenario.
Table 4. Energy balance of the PHAs production system, referring to the functional unit (1 kg of PHAs produced).
Energy Demand/SupplySystem Stage and Energy TypeUnitScenarios
A 1BC
Energy demandVFA production
 electricityMJ8.4913.6719.18
 thermal energyMJ36.1458.1180.50
PHAs-enriched biomass production
 electricityMJ6.096.086.08
 thermal energyMJ15.2015.1915.19
PHAs extraction
 electricityMJ3.953.953.95
 thermal energyMJ0.000.000.00
PHAs production system (total)
 electricityMJ18.5323.7129.21
 thermal energyMJ51.3373.3095.69
Energy supplyOnsite production
 electricity from CHPMJ0.0023.7129.21
 thermal energy from CHP & boilerMJ0.0031.2895.69
External production 2
 electricityMJ18.530.000.00
 thermal energyMJ51.3342.010.00
1 Data for the three A-based scenarios are reported in a single column since they differ only in the external energy source used, and not in figures. 2 Various energy sources, depending on the scenario.
Table 5. Energy indicators results referring to the functional unit (1 kg of PHAs produced). All energy indicators are measured in terms of net calorific value.
Energy IndicatorUnitScenarios
A1A2A3BC
PHAs output (energy)MJ43.543.543.543.543.5
ADSS input (mass)kg203.6203.6203.6440.9688.6
ADSS input (energy)MJ91.691.691.6198.4309.9
Renewable energy in sewage sludge transformed into PHAsMJ91.691.691.691.3103.0
Renewable energy in sewage sludge used for H+EMJ0.00.00.0107.1206.9
PE – external supplyMJ130.9250.5154.666.419.3
PE – external supply, fossilMJ106.223.517.164.316.5
PE – external supply, renewableMJ24.7227.0137.52.12.8
Total energy investedMJ222.5342.1246.2264.8329.2
Total renewable energy supplyMJ116.3318.6229.1200.5312.7
Energy recovered by PHAs EoLMJ−28.7−28.7−28.7−28.7−28.7
Rate of energy in PHAs recovered by EoL%66.066.066.066.066.0
ERPHAs, overall%19.512.717.616.413.2
ERPHAs, EoL%22.413.920.018.414.5
RERfor H+E%18.990.688.862.992.7
RERoverall%52.393.193.075.795.0
FERPHAs-0.411.852.530.682.63
Table 6. Life cycle impact assessment results for the five analyzed scenarios (A1, A2, A3, B, C).
Impact CategoryAbbrev.UnitScenarios
A1A2A3BC
Primary energy demand from ren. and non ren. resources (as NCV)PED, R+NRMJ1.0 × 1022.2 × 1021.3 × 1023.8 × 101−9.3 × 100
Acidification midpointACmole of H+ eq.6.1 × 10−31.9 × 10−26.8 × 10−38.3 × 10−31.4 × 10−2
Climate change midpoint, excluded biogenic carbonGWPexc.kg CO2 eq.5.2 × 1008.7 × 10−1−3.0 × 10−12.5 × 100−3.0 × 10⁻¹
Climate change midpoint, included biogenic carbonGWPinc.kg CO2 eq.2.0 × 1011.6 × 1011.4 × 1012.2 × 1012.4 × 101
Ecotoxicity freshwater midpointFECTUe5.7 × 1015.7 × 1015.7 × 1011.2 × 1021.9 × 102
Eutrophication freshwater midpointEuFkg P eq.8.0 × 10−41.1 × 10−38.5 × 10−41.7 × 10−32.6 × 10−3
Eutrophication marine midpointEuMkg N eq.2.8 × 10−31.0 × 10−24.1 × 10−35.8 × 10−39.8 × 10−3
Eutrophication terrestrial midpointEuTmole of N eq.2.4 × 10−26.8 × 10−22.4 × 10−24.8 × 10−28.2 × 10−2
Human toxicity midpoint, cancer effectsHTcCTUh1.1 × 10−61.1 × 10−61.1 × 10−62.3 × 10−63.5 × 10−6
Human toxicity midpoint, non-cancer effectsHTncCTUh1.5 × 10−61.8 × 10−61.8 × 10−63.2 × 10−65.0 × 10−6
Ionizing radiation midpoint, human healthIRkBq U235 eq.2.4 × 10−2−2.3 × 10⁻¹−2.6 × 10⁻¹−2.5 × 10⁻¹−2.2 × 10⁻¹
Land use midpointLUkg C deficit eq.2.3 × 1004.2 × 1011.7 × 1011.4 × 1002.2 × 100
Ozone depletion midpointODkg CFC-11 eq.2.3 × 10−82.3 × 10−82.3 × 10−82.3 × 10−82.3 × 10−8
Particulate matter/Respiratory inorganics midpointPMkg PM2.5 eq.2.5 × 10−47.7 × 10−43.1 × 10−43.3 × 10−45.7 × 10−4
Photochemical ozone formation midpoint, human healthPOFkg NMVOC7.4 × 10−31.3 × 10−27.5 × 10−31.3 × 10−22.1 × 10−2
Resource depletion water, midpointWDm³ eq.5.3 × 10−24.4 × 10⁻²−2.1 × 10⁻³−2.5 × 10⁻²−2.0 × 10⁻²
Resource depletion, mineral, fossils and renewables, midpointRDkg Sb eq.3.2 × 10−63.6 × 10−51.0 × 10−5−1.6 × 10⁻⁶−3.1 × 10⁻⁶

