Spatial Pattern of a Comprehensive fE Index for Provincial Carbon Emissions in China


1
Key Laboratory of Land Surface Pattern and Simulation, Institute of Geographical Sciences and Natural Resources Research, Chinese Academy of Sciences, Beijing 100101, China
2
University of Chinese Academy of Sciences, Beijing 100049, China
3
Council for Scientific and Industrial Research-Institute of Industrial Research, P.O. Box, Legon-Accra LG 576, Ghana
4
Research Institute of China National Offshore Oil Corporation, Beijing 100027, China
*
Author to whom correspondence should be addressed.
Energies 2020, 13(10), 2604; https://doi.org/10.3390/en13102604
Submission received: 24 March 2020
/
Revised: 18 May 2020
/
Accepted: 19 May 2020
/
Published: 20 May 2020
Abstract
:China has committed to ambitious targets to reduce its carbon emissions in the next decades, in order to combat climate change and improve the environment. The realization of the targets depends on the fair and effective mitigation plans of all provinces. However, with varying ecological and environmental conditions and social-economic development, it is a critical issue to quantify the provinces’ efforts equally. This paper proposed a comprehensive fE index in coordinating ecology, equity and economy, by accounting for carbon emissions and sinks to characterize provincial carbon emission status in China, from 2000 to 2017, which shows a spatial pattern of “boundary high, central low”. The provinces with higher fE value (>1.5) in boundary areas can be seen as “relative equality” provinces with good ecology circulation, equity and economic efficiency. The provinces with lower fE value (<0.7) in central areas around Bohai Bay are regarded as “severe inequality” provinces, and are identified as the hot-spot provinces, which have emitted more CO2 than their equity share by occupying the carbon emission space of other provinces in recent decades. These results could provide a reference for a provincial guide for carbon reduction and sustainable development of the low-carbon economy.
1. Introduction
Anthropogenic carbon emission since the industrial revolution has led to severe consequences for the environment and society [1]. Many scientists and policymakers have recognized that the essential environmental issues result from burning fossil fuels, leading to not only climate change, but also environmental issues, like land and water pollution, ecosystem problems, etc. [2,3]. Carbon emission has caught global attention, and thus it is essential to reduce it to acceptable levels in order to eliminate the harmful effects on the environment [4]. In 2015, the Paris agreement was reached, which was committed to “holding the increase in the global average temperature to well below 2 °C above pre-industrial levels and pursuing efforts to limit the temperature increase to 1.5 °C above pre-industrial levels.” It set out to improve and replace the Tokyo Protocol by abandoning the “top-down” international distributions, and encouraged the formulation of a “bottom-up” system through formulating the Nationally Determined Contributions (NDCs) [5].
China, as the largest carbon emitter in the world [6,7], has also committed a series of stringent carbon mitigation policies aiming “to reduce carbon emissions intensity by 40–45% by 2020 from the 2005 level, to peak CO2 emissions no later than 2030”, as stated in China’s NDC [8]. However, considering the current state of economic development and the critical period of industrialization in China, carbon emission seems set to continue rising before 2030 [9,10,11]. On the other hand, China also has global warming problems and suffers from many environmental and ecological issues, like soil desertification, sandstorm and haze. Therefore, China is facing enormous pressure and challenges in carbon emission reduction, and requires the joint efforts of all the provinces [12,13]. The sum of carbon reduction targets of all provinces must meet the national target, but it remains challenging to scientifically allocate reduction tasks and equally distribute the limited emission space. One of the critical difficulties is how to quantify the equality of provinces’ efforts in mitigation and adaptation, considering their vast differences in natural, economic and social conditions [14,15]. To that end, a comprehensive index, capable of considering ecologic and economic conditions with equity, is required.
Currently, there are multiple indicators used to evaluate past carbon emissions and future projections. Some simple indexes are the total carbon emissions [16], the per capita carbon emissions [17,18], and the carbon emissions intensity (CEI) [19,20]. For example, Xu et al. (2019) analyzed the spatial pattern of carbon emissions with absolute quantity in the Pearl River Delta [16], while Dong et al. (2019) analyzed national and regional levels of CEI in China. However, these spatial differences just embody the emission efficiency differences, which are mainly driven by energy intensity [19]. Moreover, many studies used the CEI index to analyze the spatial patterns and factors that influence carbon emissions across and within countries [21,22], and even used it to allocate future carbon reduction targets [23]. These indexes are straightforward, and mainly consider the spatial pattern of quantities of carbon emissions. These models lack the exploration of the equity or inequity of emissions in different locations, and thus fail to provide equitable insights into specific mitigation policies [24].
Later, some researchers quantified the inequality in carbon emissions by revising the income inequality indexes, such as the Atkinson index [25], the Gini coefficient, the Theil index and the Lorentz curve [26,27,28]. For instance, Chen et al. (2019) assessed inequalities related to industrial carbon emissions per capita in the Pearl River Delta with the Theil index [29]. Groot (2010) extended the Gini coefficient, to measure the inequality of per capita historical or projected business-as-usual emissions across countries [30]. Zimm and Nakicenovic (2019) employed the Gini coefficient to evaluate the inequality implication of the NDCs [31]. Although these indicators could better reveal the extent of carbon emissions inequality, most of them dealt with the equity of carbon emissions only from one aspect, which was often economic or demographic, but ignored the impact of carbon sinks—both ecosystem carbon sinks and technological carbon sinks of Carbon Capture and Storage (CCS) [32,33,34]— in which cases the emissions from the regions with high carbon sink capacity would be overestimated by ignoring their offset [35]. Thus, it is not fair enough for these regions to only consider their absolute carbon emissions regardless of their different ecological conditions.
Considering the challenges outlined regarding the already discussed indicators, Lu et al. (2012) proposed an evaluation matrix, with ecological support index (ESI) and economic contribution index (ECI), to characterize the spatial pattern of carbon emissions while inferring ecological aspects [36]. However, the matrix only divided the carbon emissions into four different groups, and was unable to quantitatively compare the differences within the groups [13]. Besides, the evaluation matrix described the spatial pattern of carbon emission from both ecological and economic aspects, but it ignored the effect of population and area, which is also an important equality appeal for developing countries regarding emission allocation. Especially for China, there are significant differences in carbon emissions in the provinces of the country due to the influences of resource endowment, population distribution and economic development. If the carbon reductions are evenly allocated, it will not be conducive to the development of China’s overall economy. Thus, a comprehensive index is urgently needed to assess spatial pattern of carbon emissions in terms of ecology, equity and economy, which will provide a guide to allocating carbon emission tasks and taking respective reduction actions in different provinces.
This paper aims to provide a new perspective on the analysis of the spatial pattern of carbon emissions in China, coordinating the aspects of ecology, equity, and economy by accounting for carbon sinks. To that end, a comprehensive fE index was constructed, incorporating an ecological support index (ESI), an economic contribution index (ECI), and an equitable distribution index (EDI), and was used to analyze the spatial pattern in provincial carbon emissions from 2000 to 2017. Finally, the hot-spot provinces of carbon emissions were identified based on the fE ranks.
2. Materials and Methods
2.1. Calculation Method for CO2 Emission and Sinks
Following the Intergovernmental Panel on Climate Change guidelines (IPCC, 2006), energy activities (including energy consumption and industrial production process) are the main sources of CO2 emission, accounting for 91.3% of the total CO2 emissions [1]. In this paper, CO2 emissions from energy consumption and industrial production are summed as the total emissions. CO2 emissions from energy consumption are calculated by integrating emissions from all types of fuels:
where, Eenergy denotes the CO2 emissions from the various fuels and is quoted in thousand tons; i means the energy types, such as raw coal, coke, crude oil, gasoline, kerosene, diesel oil, fuel oil, and natural gas; Ei denotes the consumption of energy type i; Fi denotes CO2 emission factors in energy types i; and 44/12 is the conversion coefficient from C to CO2.
Within the industrial production processes, CO2 emissions from cement production account for 70.2% of the total emission in China [37], which is roughly considered as the emission from industrial production. In the IPCC 2006 guidance, CO2 emissions from cement production process are calculated by clinker and default emission factors. Due to lack of detailed data concerning China’s provincial clinker production, this study adopted 83% of cement production as the clinker production to calculate the CO2 emissions of the cement production process [38].
in which Ecem denotes the CO2 emissions from the cement production process, and its unit is thousand tons; Pclinker denotes the clinker production; Pc denotes the cement output; and Fc denotes default clinker emission factor, which is 0.52 t CO2/t clinker in the IPCC 2006 guidance [39].
In terms of carbon sinks accounting, considering the role of CCS technology in carbon emissions reduction, the carbon sink calculation in this paper mainly includes two parts: ecological carbon sink and CCS technology carbon sink. The ecological carbon sink is calculated by the amount of CO2 absorbed by the photosynthesis of forests, grasslands and cropland, while the CCS carbon sink is calculated through the annual storage stock of each project. The formulae are shown in Equations (3) and (4), respectively.
where Eeco denotes the amount of CO2 absorbed by different land types, and its units is thousand tons; j means the land use type, such as forest land, grassland, and cropland; Sj denotes the area of land use type j; Cj represents the carbon absorption factor of every land use type j; ECCS denotes the amount of CO2 storage by CCS technology, with the unit as thousand tons; k means the CCS project in a province; and Vk represents the capture and storage capacity of CCS project k in a year.
Net CO2 emissions, which present the balance of carbon budget in a region [40], are calculated as CO2 emissions (including CO2 emission from energy consumption and industrial processes) minus CO2 sinks (ecosystem carbon sinks and CCS technology sinks):
where Y denotes net CO2 emissions and is quoted in thousand tons. The net CO2 emissions were used to calculate the fE index for 30 provinces. Notably, zero net CO2 emission represents carbon neutrality.
2.2. Construction for the fE Index
As discussed in the introduction of this paper, it is not fair to study the spatial pattern of provincial carbon emissions only from the perspective of economy or demography. There are different environmental bearing capacities in different regions due to the influence of resource endowment, population distribution and economic development levels. Supposing that a region has higher carbon emissions, but it also has much greater carbon sink capacity, either ecological carbon sink or CCS sink, which would reduce carbon dioxide from the atmosphere. It is therefore difficult to say that regions with high carbon emissions are unequal. If one region’s carbon emissions can develop in harmony with the environment, we can say that its carbon emission is within its ecological carrying capacity, and this is a so-called a good ecosystem cycle. To that end, we attempt to construct a comprehensive index that can include regional ecology, equity and economy. For example, the regional ecological carrying capacity can be represented by the ecological carrying index, which is defined as the ratio of its carbon sink capacity to its carbon emission. Meanwhile, the economic contribution index (ECI) is defined as the ratio of its economic contribution rate to its carbon emission, and the formula of ESI and ECI are as follows:
where Ai and A are the regional and national carbon sink values respectively, in MtCO2; Yi and Y are the regional and national net CO2 emissions, respectively, in MtCO2. Gi and G are the regional and national GDP, respectively; CNY 108.
Therefore, inspired by the ecological support index (ESI) and economic contribution index (ECI) proposed in the evaluation matrix, the equitable distribution index (EDI) was proposed by taking the impact of a population and regional area on carbon emissions into account as
where Pi and P are the regional and national populations, respectively, in millions; Si and S are the regional and national areas, respectively, in km2; and Yi and Y are the regional and national net CO2 emissions, respectively, in MtCO2.
Then, combining all three indexes of ESI, ECI, and EDI, a comprehensive indicator was constructed as shown in Equation (7).
where fE is a comprehensive index, which represents regional ecology (ESI), equity (EDI), and economy (ECI); ω1, ω2 and ω3 are the weighting factors and ω1 + ω2 + ω3 = 1. The Delphi method was employed in this paper, based on the relative importance of two of the three indicators. In accordance with the principle of the analytic hierarchy process, the synergistic weight factors to ecology, equity, and economy are assigned as 0.4, 0.2, and 0.4, respectively.
2.3. Construction of Evaluation Matrix
2.4. Data Sources
In order to calculate the index in China’s 30 provinces between 2000 and 2017, three types of data were collected to represent provincial carbon emissions, carbon sink, and socio-economics.
Concerning carbon emissions, there are no official statistics accessible on provincial carbon emissions in China. Therefore, carbon emissions were calculated from fossil energy consumption of the 30 provinces from the China Energy Statistics Yearbooks [41]. To improve data accuracy, eight types of final energy consumption (ton) were used (such as raw coal, coke, crude oil, gasoline, kerosene, diesel oil, fuel oil, and natural gas). Carbon emission factors (tons CO2/ton of fuel) were obtained from the 2006 IPCC Guidelines for National Greenhouse Gas Inventories, which listed emission factors for each energy (IPCC, 2006). The data of cement output (ton) in each province were obtained from the China Cement Yearbooks [42].
In terms of carbon sink data, land use and CCS data for each province were collected. The land usage data, including forest land, grassland, and cropland, were from the China Statistical Yearbooks [43], while the carbon absorption factor was from the Food and Agriculture Organization (FAO), with its unit as ton CO2/ha [44]. The capture capacity of CCS in each project in China from 2000 to 2017 was obtained from the Global Status of CCS, with units in million tons per year [45]. Since the Global Status of CCS report mainly presented large-scale global integration projects in different countries, the data of small-scale CCS projects were obtained from China’s Carbon Capture and Storage technology reports [46,47].
Besides the carbon emissions data, some socioeconomic data were collected as well. The annual population and the gross domestic product (GDP) data of 30 provinces (excluding Tibet, Hong Kong, Macao and Taiwan for lack of data) were derived from the China Statistical Yearbook [40]. To eliminate the impacts of inflation, the GDP was converted into the 2010 fixed price.
In addition, to interpolate the fE index with the Gini coefficient on a national scale, the national Gini coefficients, annual population, GDP and other socioeconomic data from 2000 to 2017 were derived from the World Bank [48]. Again, the GDP was converted into 2010 fixed price. Ecosystem carbon sink data in different countries, including forest land, grassland and cropland, were derived from the world FAO [44]. The annual CCS data was obtained from the global carbon capture institute [45].
3. Results
3.1. Carbon Emissions and Sinks
The total carbon emissions and carbon sink capacity of each province, from 2000 to 2017, were calculated based on Equations (1) to (4), and results are listed in Table A1, and plotted in Figure 1 and Figure 2, respectively.
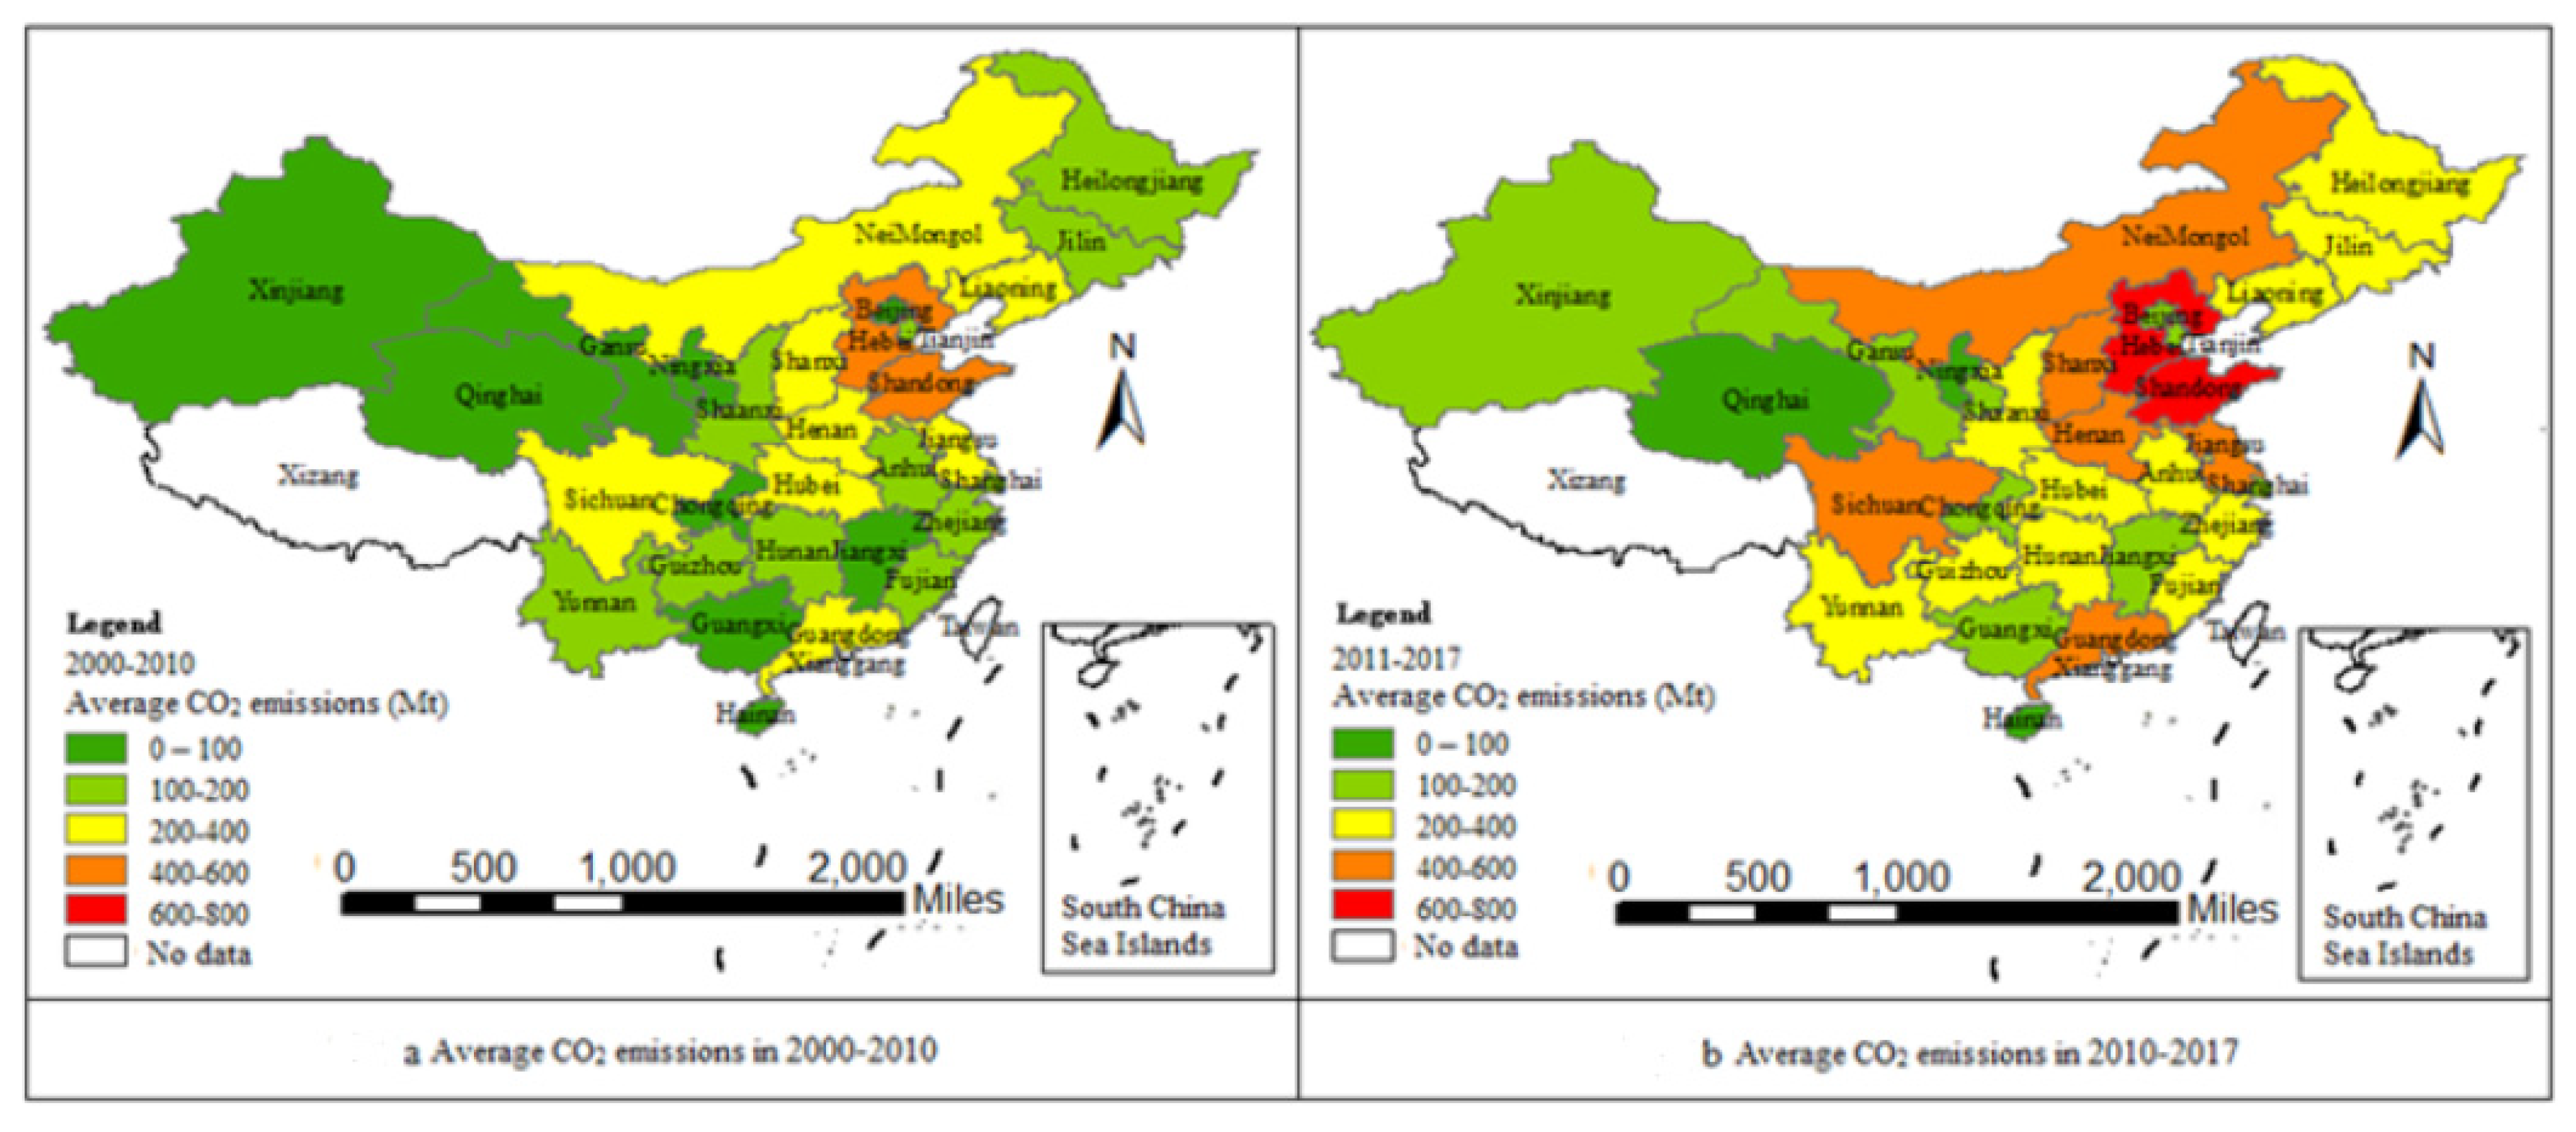
The carbon emissions have gradually increased, and nearly two thirds of provinces had emitted more than 200 Mt from 2000 to 2010, and 2011 to 2017(see Figure 1a,b). These high emitter provinces are mainly located in the eastern and central regions, which is the main area of China’s industrial development.
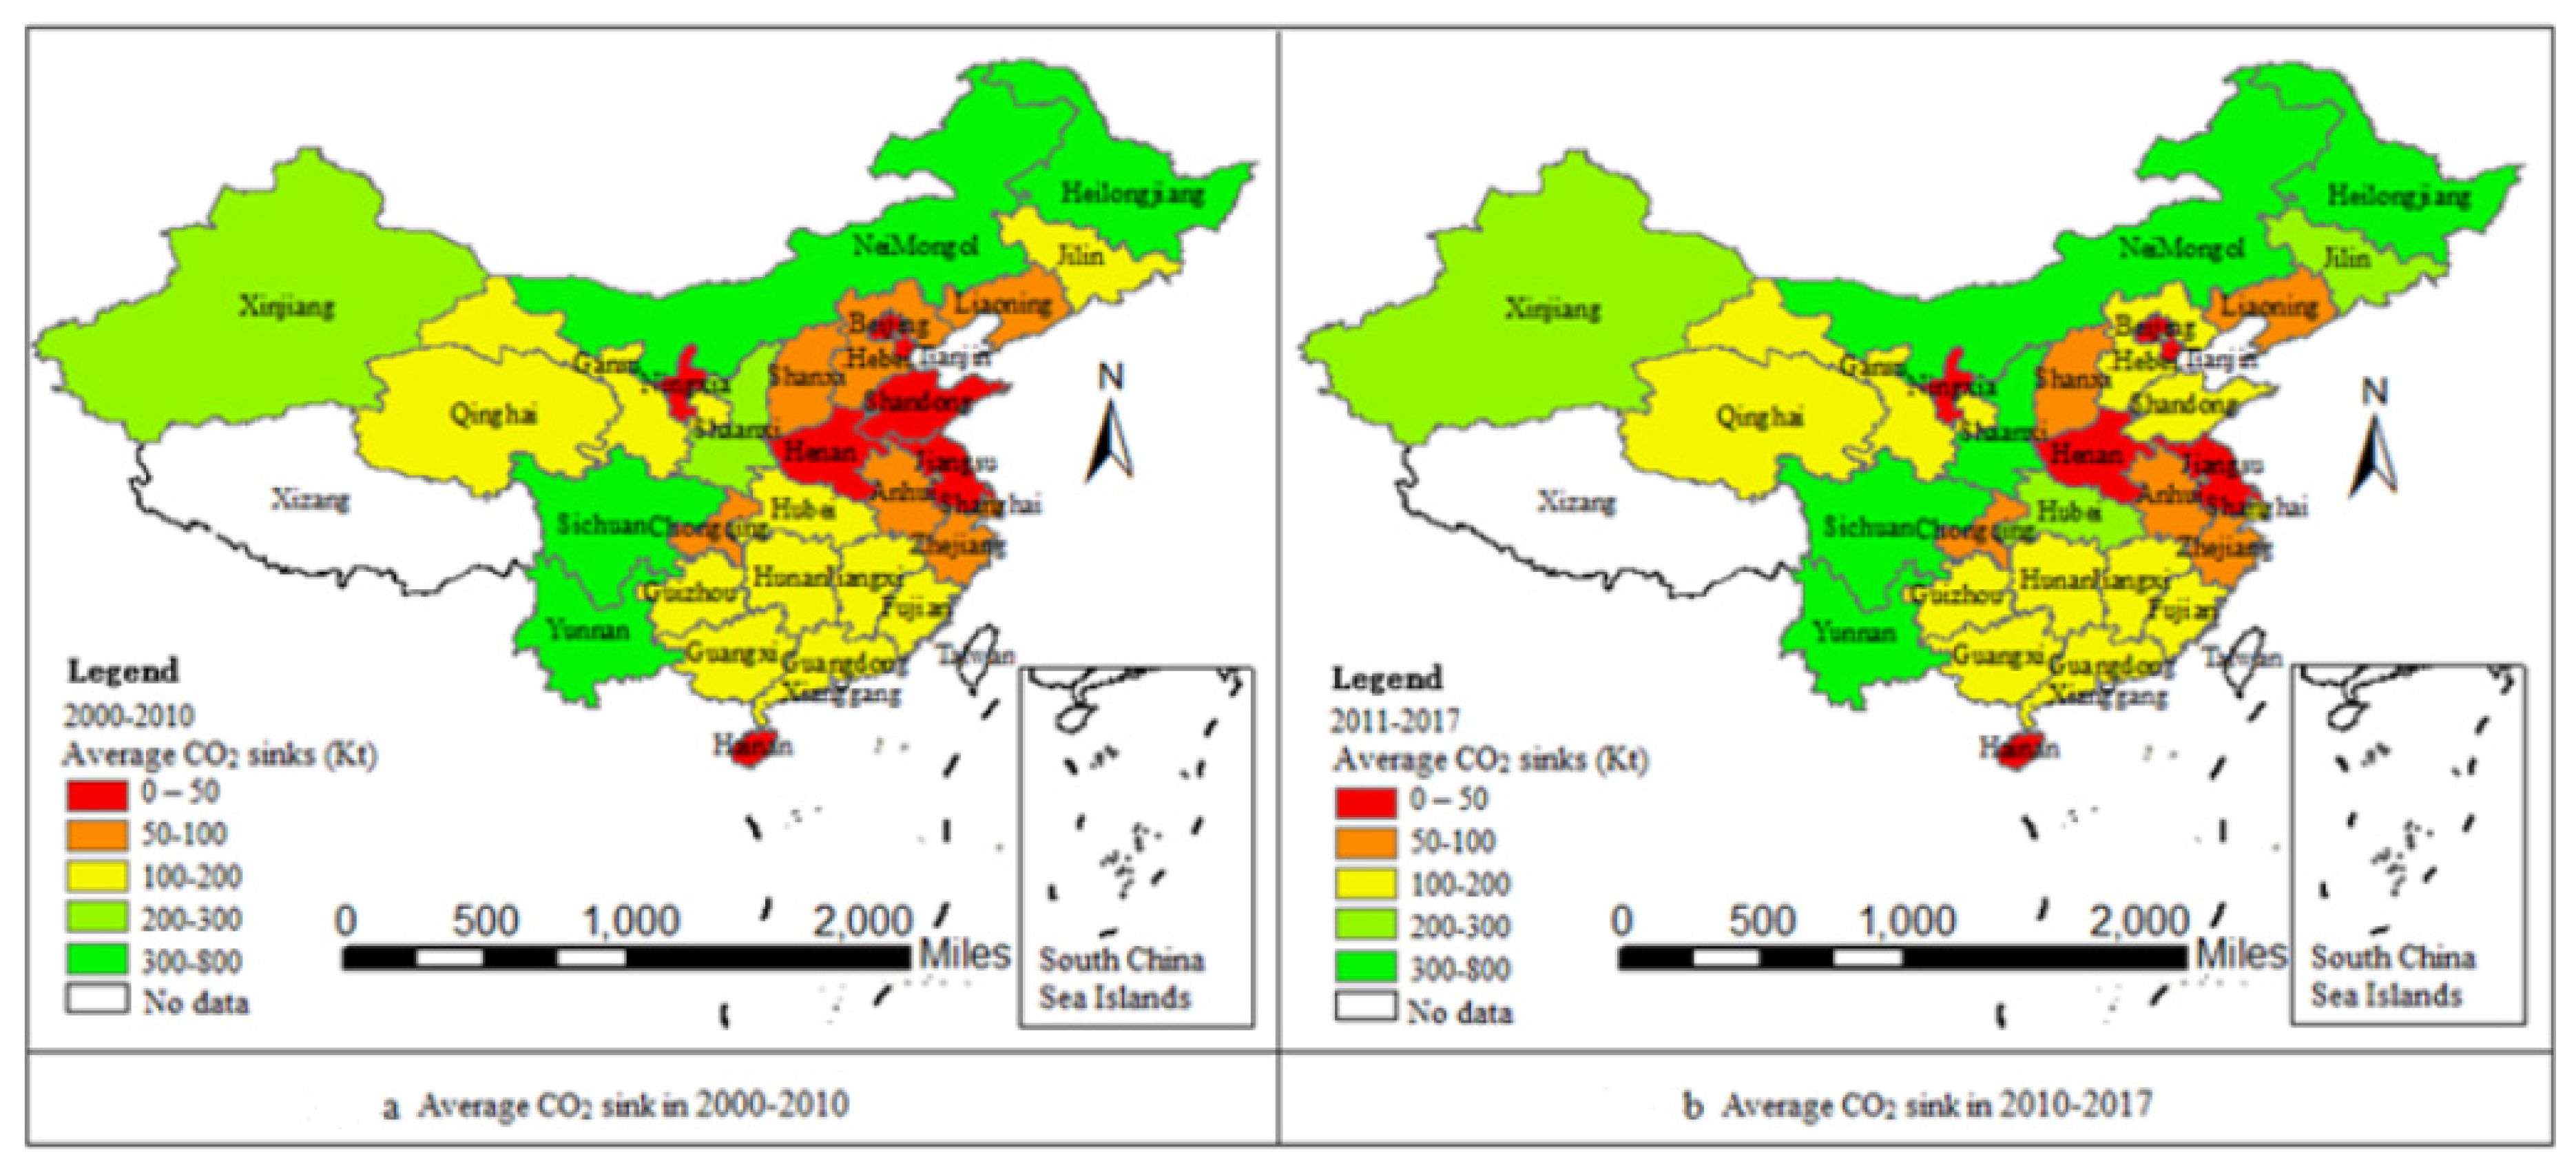
The carbon sink capacities remained basically unchanged during the last decades, except for Heilongjiang, Shaanxi, Shandong, Jilin, Hubei, and Hebei provinces (see Figure 2a,b). The carbon sink capacity increase observed in Heilongjiang and Jilin is mainly attributed to the six major afforestation projects launched by the Chinese government in the past 20 years, while the increase observed in Shaanxi, Shandong, Hubei, and Hebei provinces is largely due to the development of CCS projects.
The growth of carbon emissions in China’s provinces far exceeds that of carbon sinks, and significant spatial inconsistency is observed between carbon emissions and sink regions. It suggests adopting differentiated mitigation policies according to the different emission and sink conditions of each province.
3.2. Interpretation of the fE Index
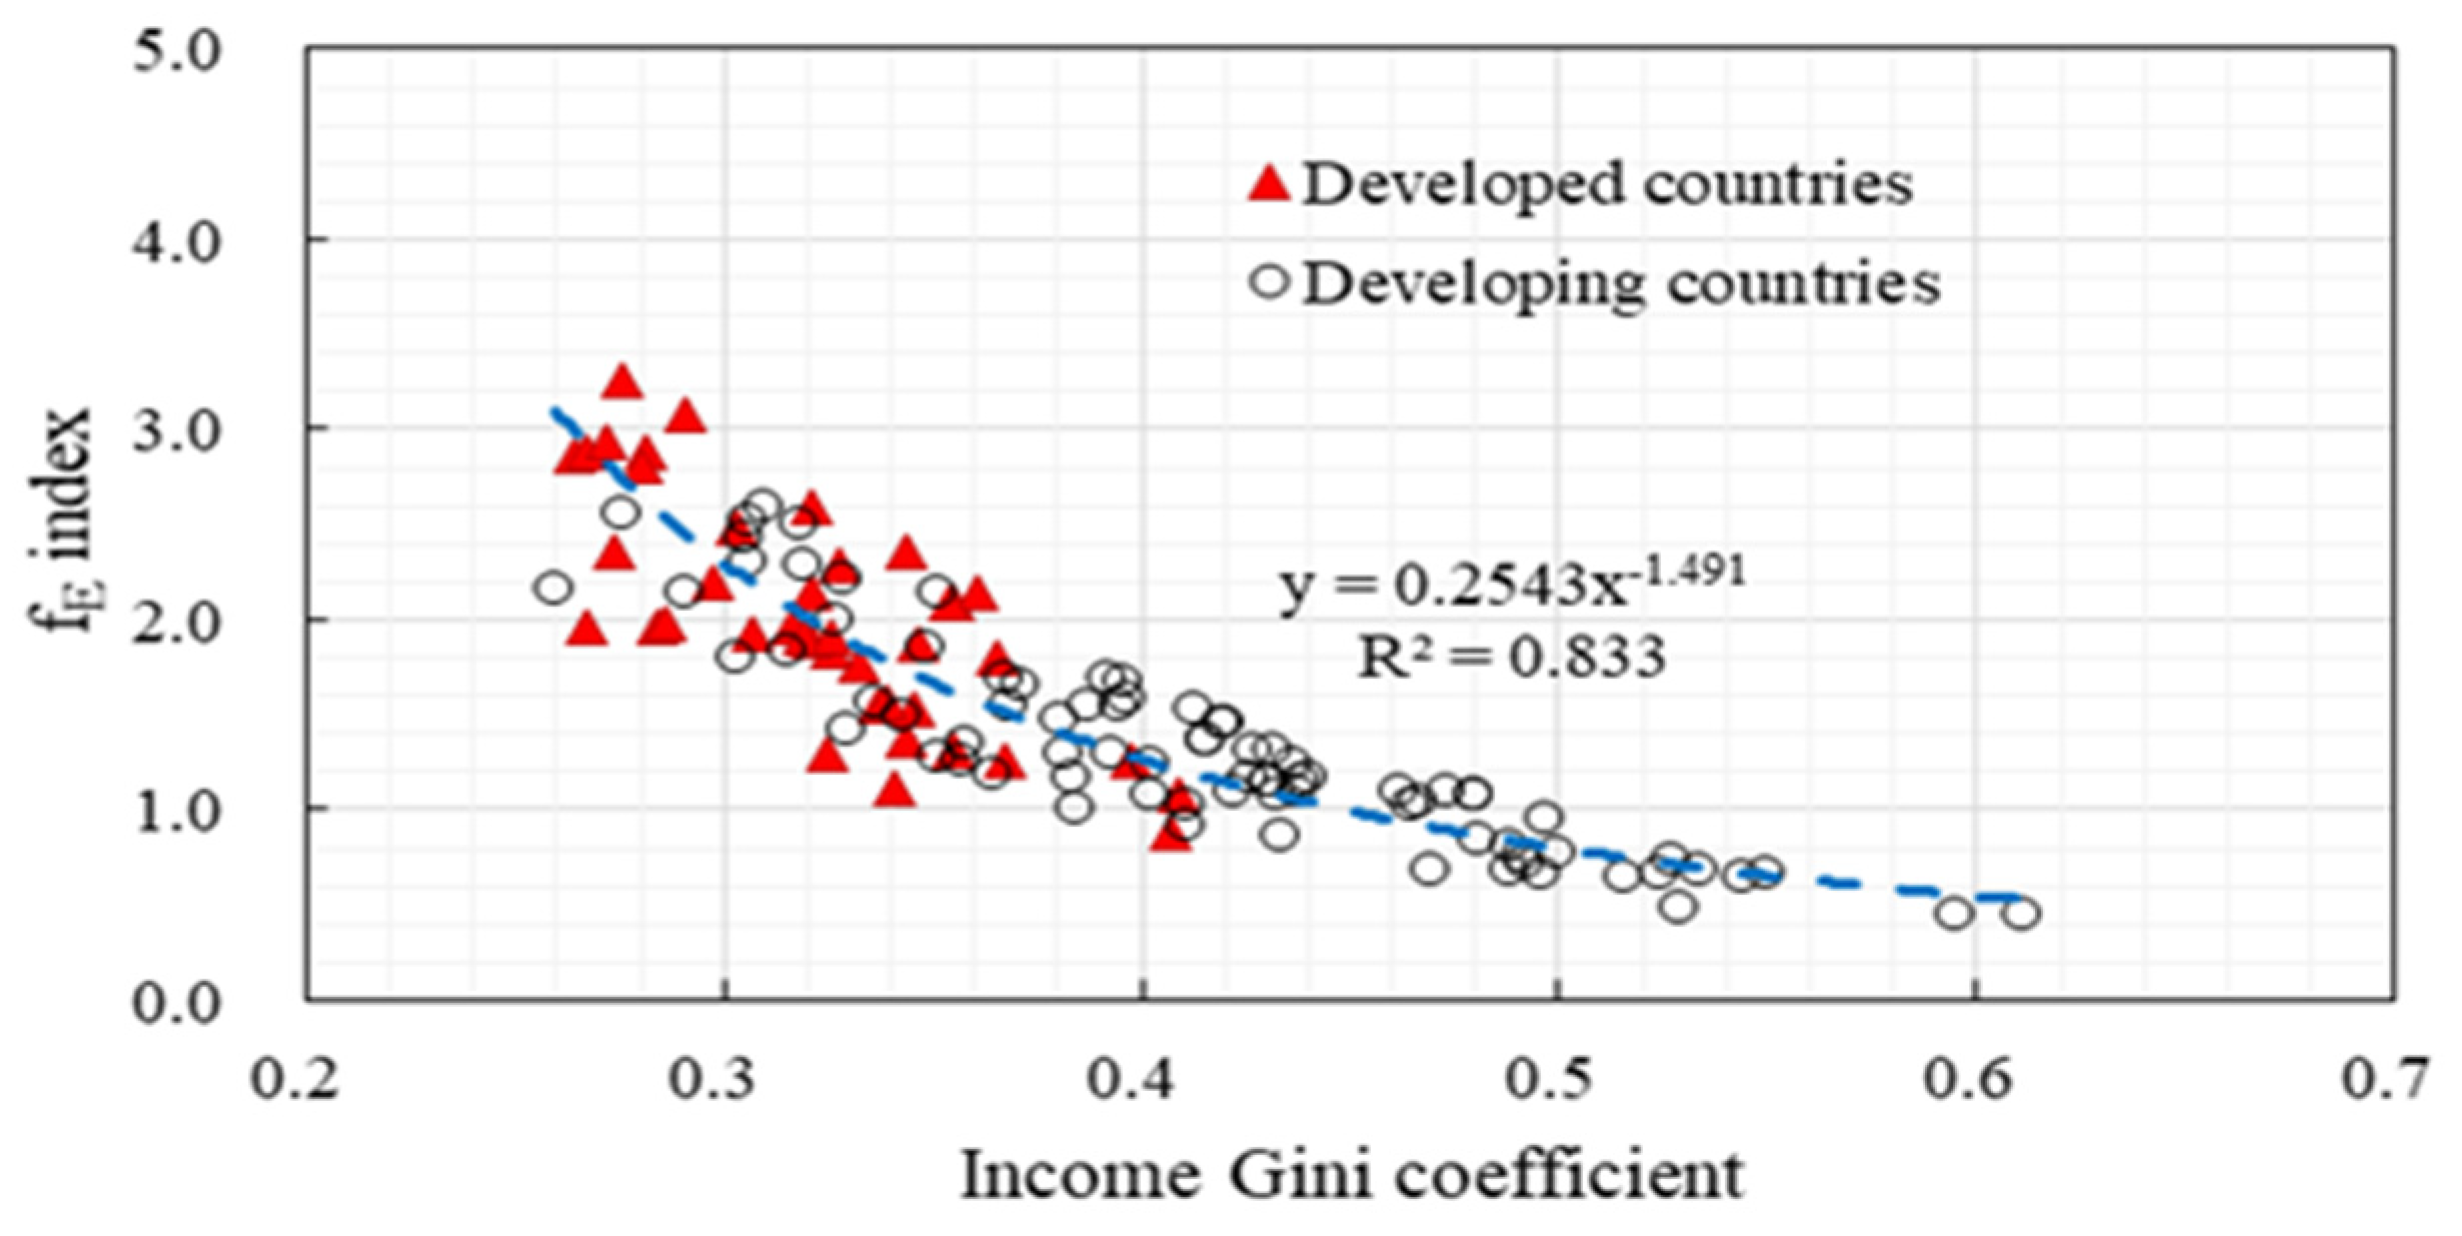
Before analyzing the spatial pattern of carbon emissions, the fE index needs to be interpreted. This paper here considers the relationship between the fE index and the Gini coefficients, in order to provide probable equality interpretations of the fE index. In a statistical method, the curve of the Gini coefficient (adopted from the World Bank) versus the fE index at the national level was plotted (the related data are shown in Appendix A Table A2). As shown in Figure 3, a negative nonlinear correlation was observed between the Gini coefficient and fE index, which is similar to the result of Hailemariam et al. (2019) [49], where the carbon emissions were shown to be negatively related to the income Gini coefficients. The higher fE index values correspond to the lower Gini coefficients, showing higher equality. Besides, it was found that the fE values of developed countries were higher and relatively concentrated (more than 1.0), with their Gini coefficients less than 0.4, while they were more scattered for developing countries. As a widely-used inequality indicator, a Gini coefficient equaling 0.3–0.4 is considered as the criteria of inequality. When the Gini coefficient is less than 0.3, it is considered as relative equality (>0.2) or absolute equality (<0.2); otherwise, it is relative inequality (0.4–0.5) or severe inequality (>0.5). By fitting the nonlinear regression of the fE index on the Gini coefficients, corresponding equity interpretations of different fE indexes are derived and listed in Table 2.
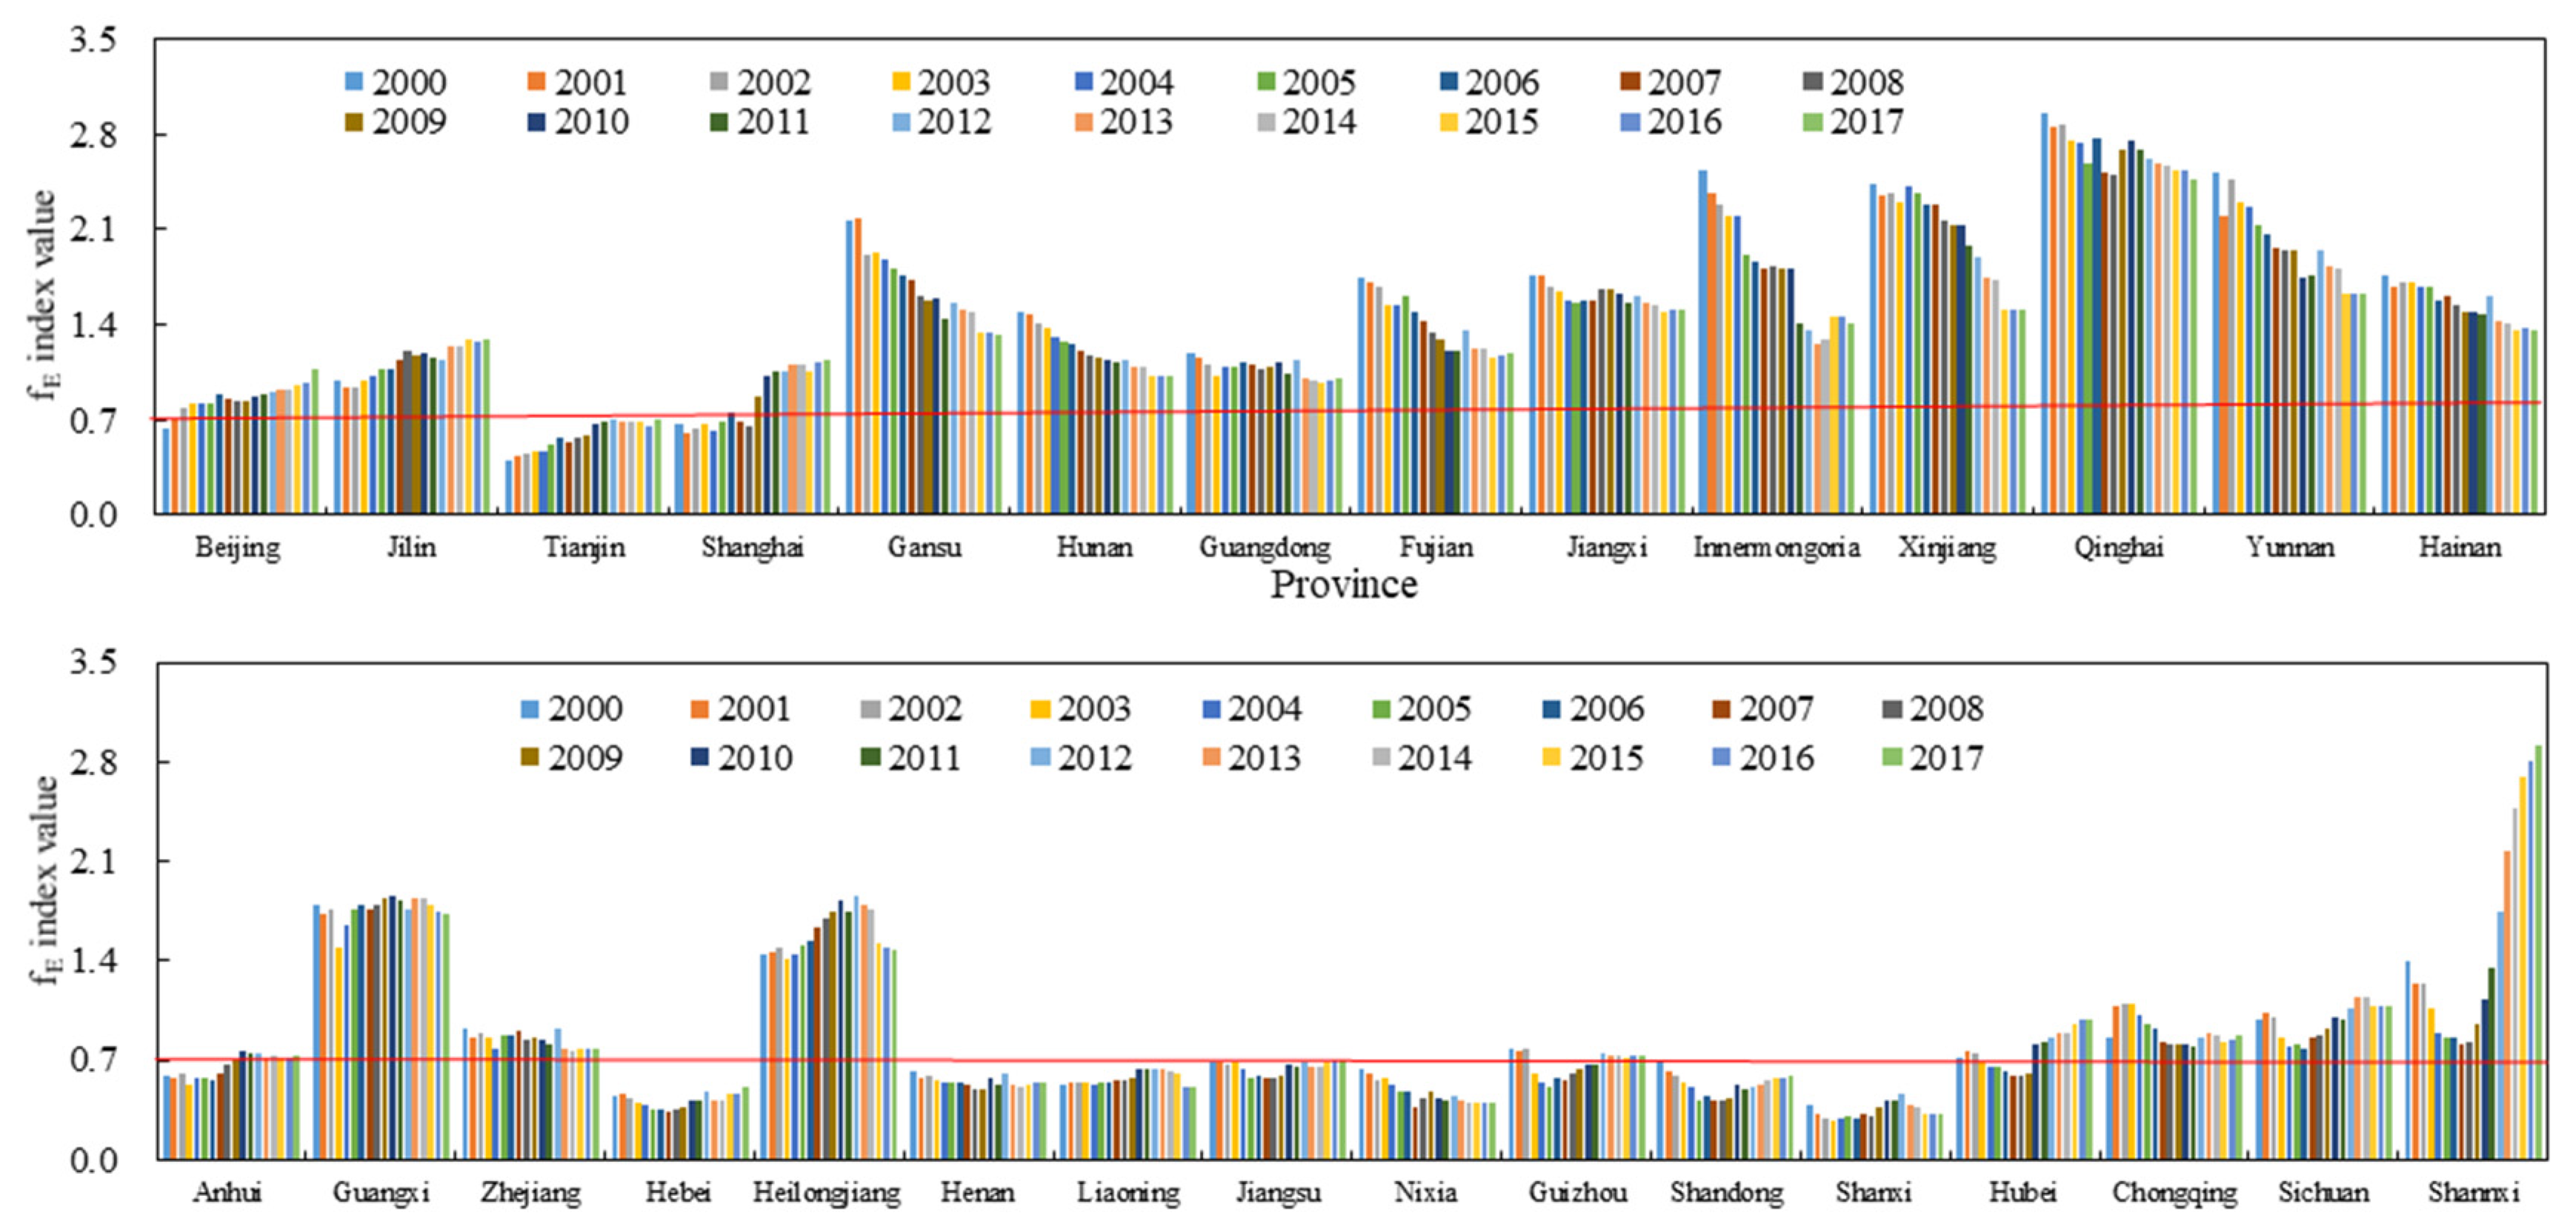
3.3. Spatial Patterns of the fE Index
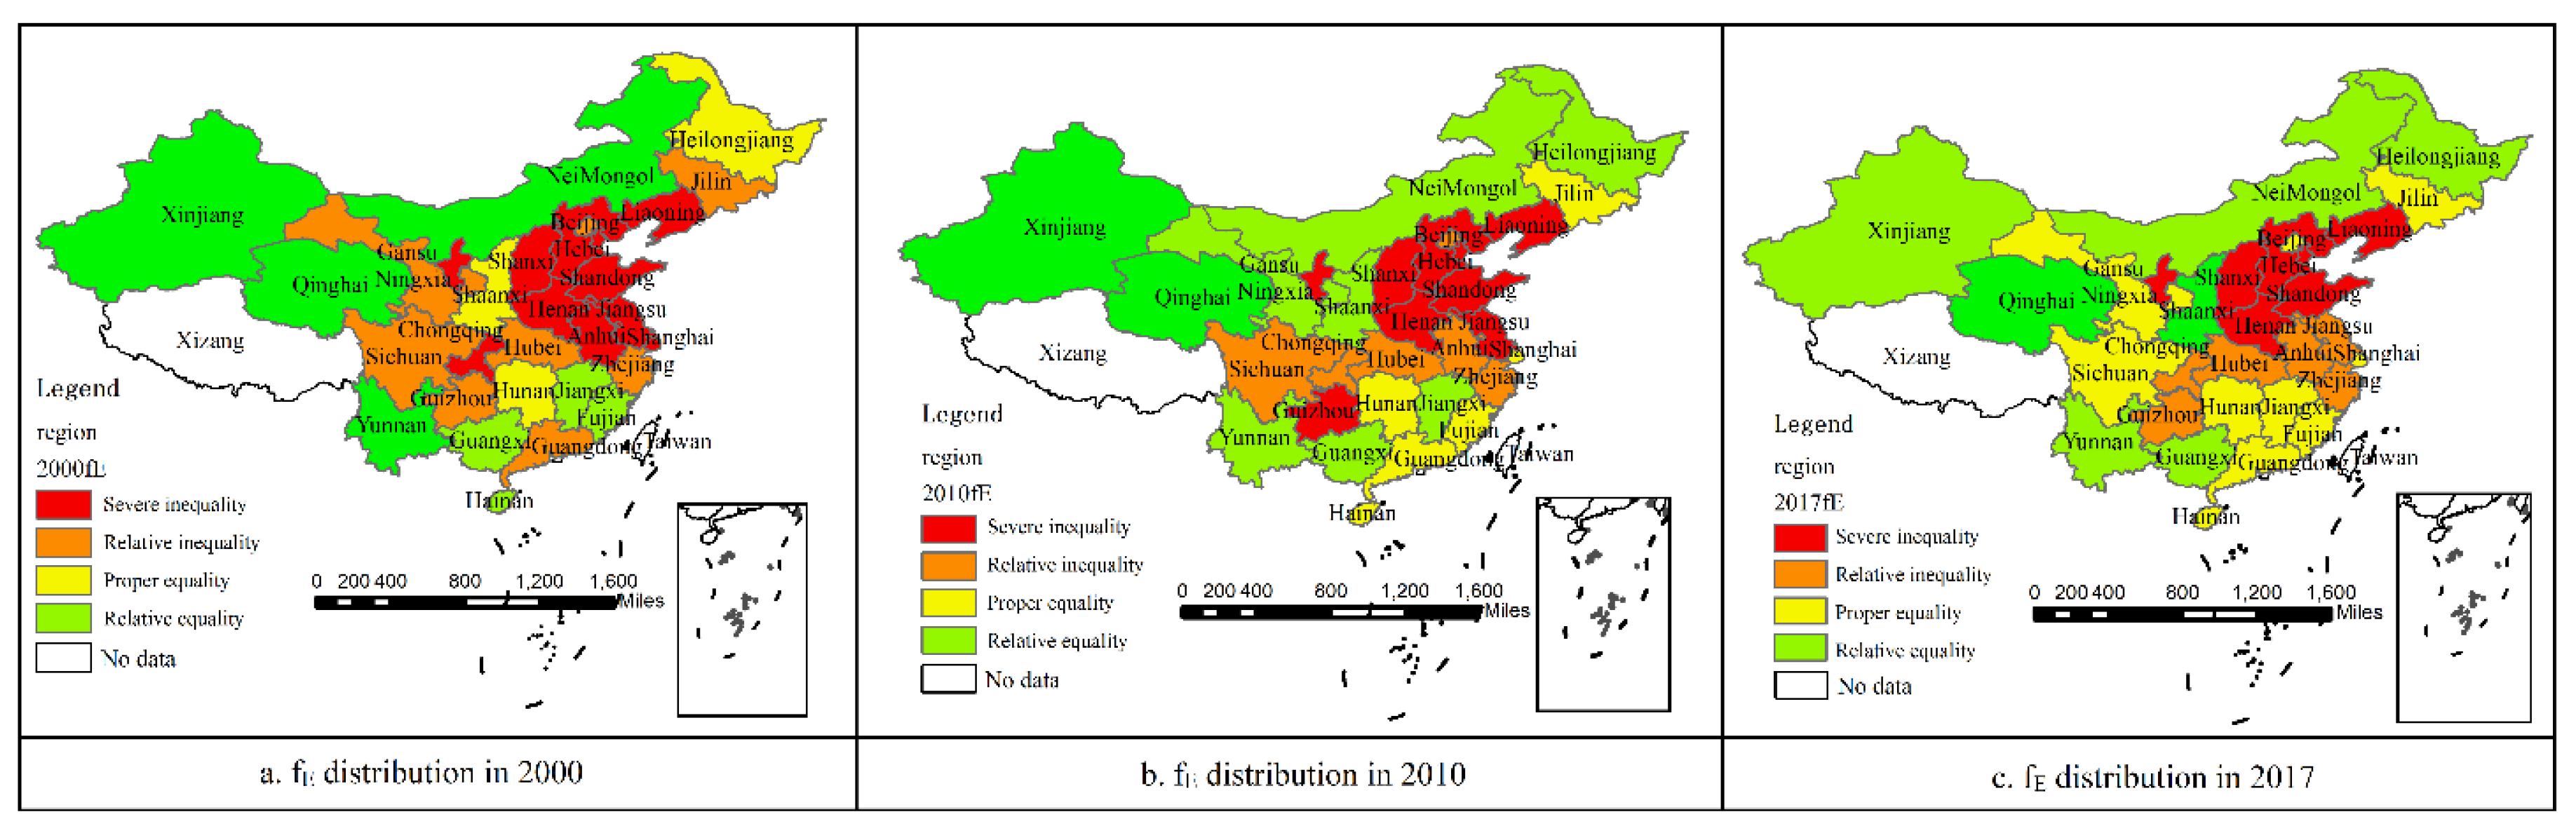
According to Equation (9), the fE indexes of 30 provinces from 2000 to 2017 were calculated and plotted in Figure 4. In general, the fE index showed a spatial pattern of “boundary high and central low “. The boundary provinces, such as Heilongjiang in the northeast, Inner Mongolia in the North, Xinjiang and Qinghai in the West, and Yunnan and Guangxi in the South, had a higher fE value (>1.5), which could be considered as “relative equality”. It indicates that the carbon emissions in these provinces are in the state of a good ecosystem cycle, fair carbon emissions, and high economic efficiency. The fE values of Gansu, Fujian, and Hainan were between 1.0 and 1.5, and those of Anhui, Hubei, Chongqing, and Guizhou were between 0.7 and 1.0, which are relatively low fE values and rank between “proper equality” and “relative inequality”, respectively. If these provinces do not take positive measures, they will inevitably occupy the emission space of other provinces in the future. Meanwhile, the provinces around the Bohai Bay (such as Shanxi, Liaoning, Hebei, Henan, Tianjin, Shandong and Ningxia) had lower fE values (<0.7). This is generally because almost all these province’s economy increases are extensive (excessive resource consumption, severe environment destruction and higher carbon emissions), resulting in “severe inequality”. Thus, they are regarded as hot-spot provinces of carbon emissions in China. For their economic development in the future, stricter policies and measures should be taken to “limit and mitigate” the carbon emissions induced by these regions’ rapid economic development. Otherwise, because of the limitation and irreplaceability of carbon emissions space, there will gradually develop a bottleneck of further development in these regions.
The temporal changes of the fE index are plotted in Figure 5; the threshold of severe inequality fE = 0.7 is plotted as well. Analyzing 17 years of data, the fE values of Heilongjiang, Jilin, Beijing, Tianjin, Shaanxi, Sichuan and Shanghai can be seen to have increased, which might be attributed to the six major afforestation projects launched by the Chinese government in the past 20 years. Examples of these afforestation projects include “The protection forest in upper section of the Yangtze River (1978–2000)”, “Three-north shelter forest program”(1978–2050), “National desertification control project”(1991–2000), “The natural forest protection project” (1998–2008), “The returning farmland to forest project” (since 2003), and “The wildlife protection and nature reserve construction project” (2001–2050). All of them have extensively increased carbon sink capacity in these regions. Besides, the fE values in Beijing and Shanghai rank from “Severe inequality” in 2000 (fE -Beijing = 0.67, fE -Shanghai = 0.69) to “proper equality” in 2017 (fE -Beijing = 1.08, fE -Shanghai = 1.14), which is mainly attributed to the influence of China’s low-carbon economic policy on carbon emissions, employing technological innovation, institutional innovation, industrial transformation, and new energy developments like wind, water, solar and other sources of clean energy.
On the other hand, the fE values of Gansu, Hunan, Fujian, Hainan, and Jiangxi gradually decreased. This is mainly because these provinces still use traditional economic development models (i.e., economic increment from scale effect, excessive resource consumption, etc.), accompanied by a slow adjustment of industrial structures and insufficient technical innovation. Although these provinces are under “proper equality”, if following the current decreasing trend, the fE values of these provinces will reduce below 1.0, and even into a state of “relative inequality”. This will inevitably infringe on the interests of other regions in the near future, and bring negative effects upon economic development and the ecological environment.
The fE values of Hubei, Shandong, Jiangsu, Inner Mongolia, and Chongqing decreased from 2000 to 2010, and gradually increased from 2010 to 2017. The reasons for the increase in fE index may be both progressive emission reduction policies and the development of green and low-carbon technologies. Especially, CCS projects carried out in these provinces have greatly improved their carbon sinks (see Figure 2b). For example, the carbon sink capacity of Shandong increased from 59.9 Kt (fE = 0.44) in 2010 to 119.9 Kt (fE = 0.59) in 2017, and that of Jiangsu also increased from 5.78 Kt (fE = 0.53) in 2010 to 13.7 Kt (fE = 0.69) in 2017. Although their current carbon emissions still fall into the “severe inequality” category, it is reasonable to believe that, with the support of CCS, these provinces will be on track for rapid low-carbon economic developments, bringing about a state of “relative equality” in the future.
3.4. Spatial Patterns Using Other Indicators
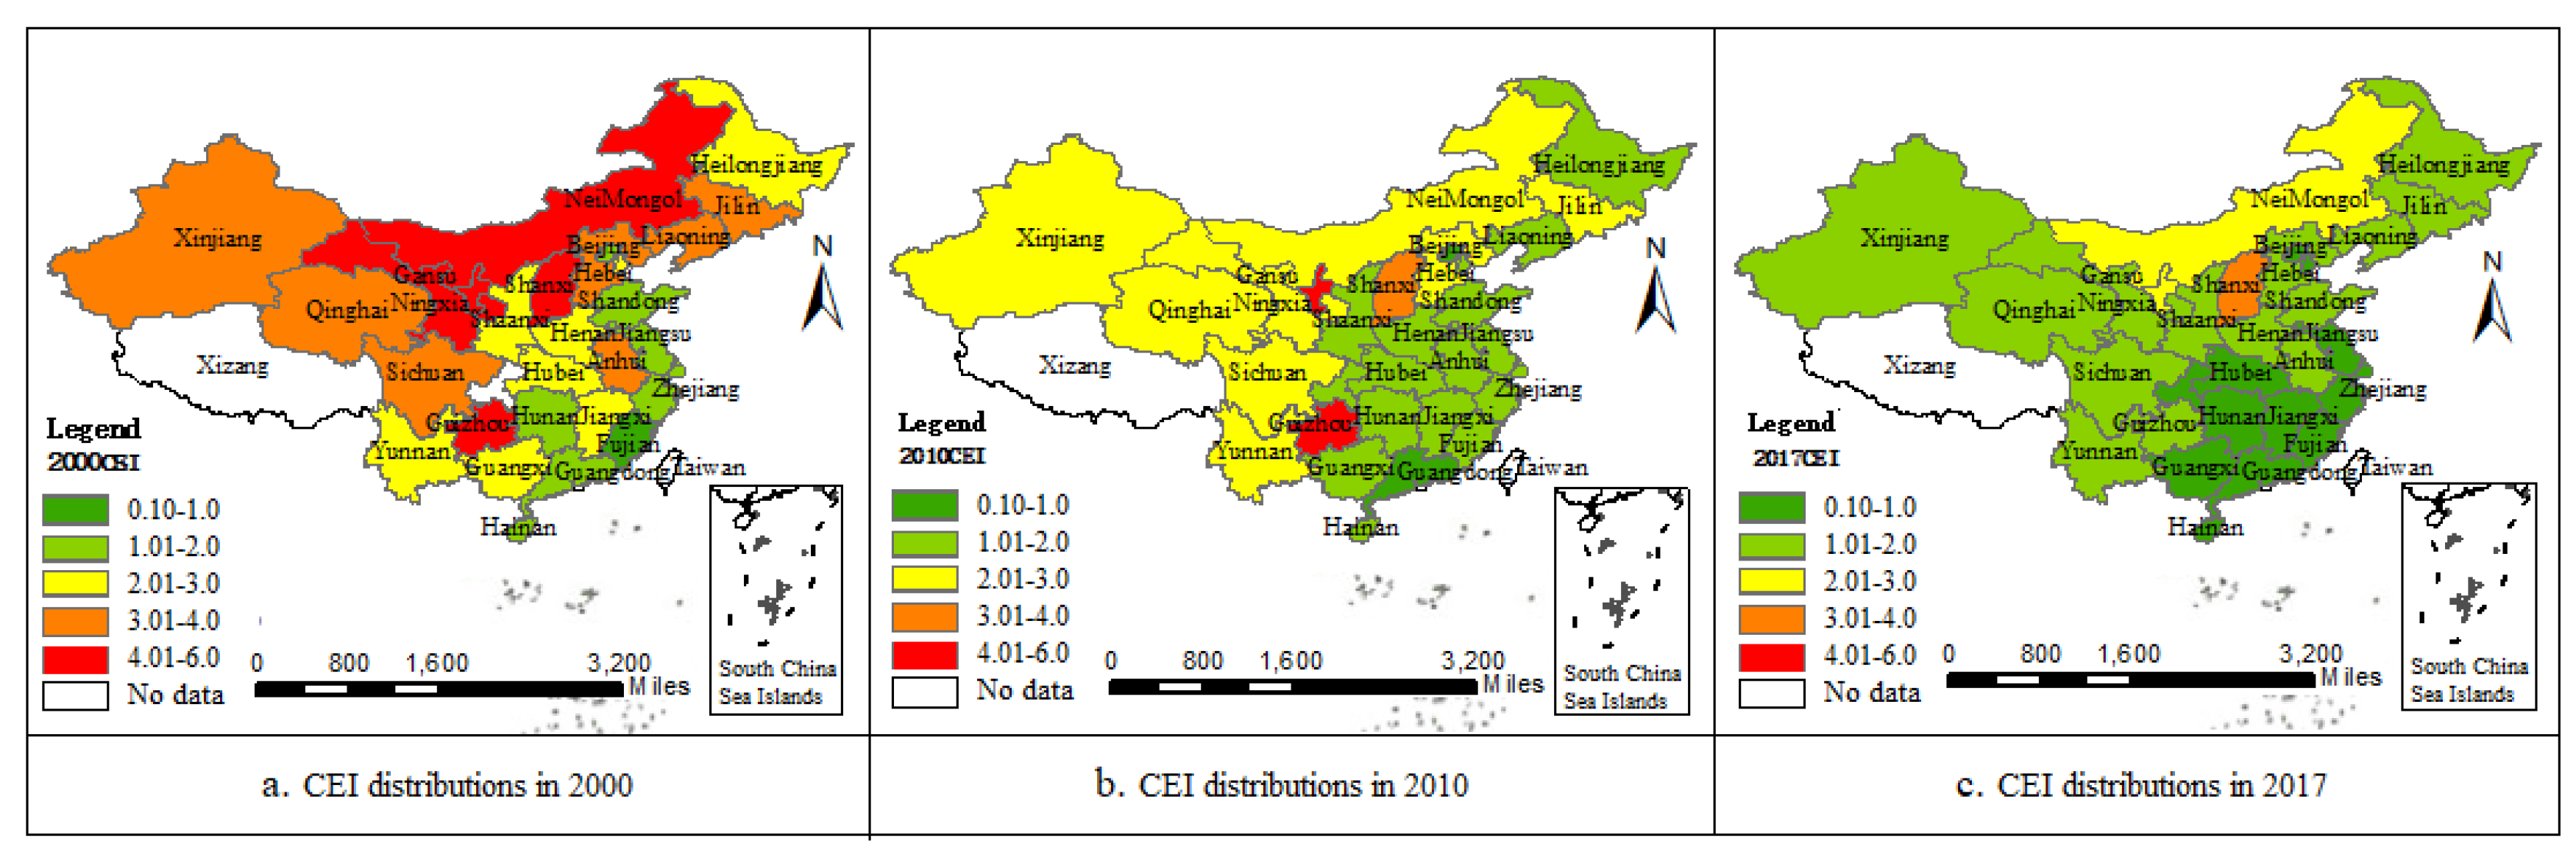
The spatial pattern of CEIs, calculated by the amount of CO2 emissions per unit of GDP produced in 2000, 2010 and 2017, are shown in Figure 6a–c, respectively. In general, a significant decreasing trend of CEI in each province from 2000 to 2017 was observed. This, however, differs from the trend of the fE index. Spatially, the CEI gradually increased from southeast to the northwest. The CEIs in provinces of Fujian, Guangdong, Guangxi, Hainan, Shanghai and Zhejiang Provinces were lower, while those of Shanxi, Guizhou, Qinghai, Ningxia, Hebei, Shannxi, Gansu, Xinjiang and Inner Mongolia Provinces were higher in 2010. However, this is just a comparative description of the spatial pattern of absolute quantity, as the CEI only considers the relationship between CO2 emissions and GDP in each province. If the rate of GDP grows faster than carbon emissions, CEI will fall. While this keeps with the current situation of China’s economic development, it ignores the effect of other factors (e.g., carbon sinks) on the differences of carbon emissions. Thus, it is difficult to provide detailed insights into specific mitigation policies apart from the economic perspective.
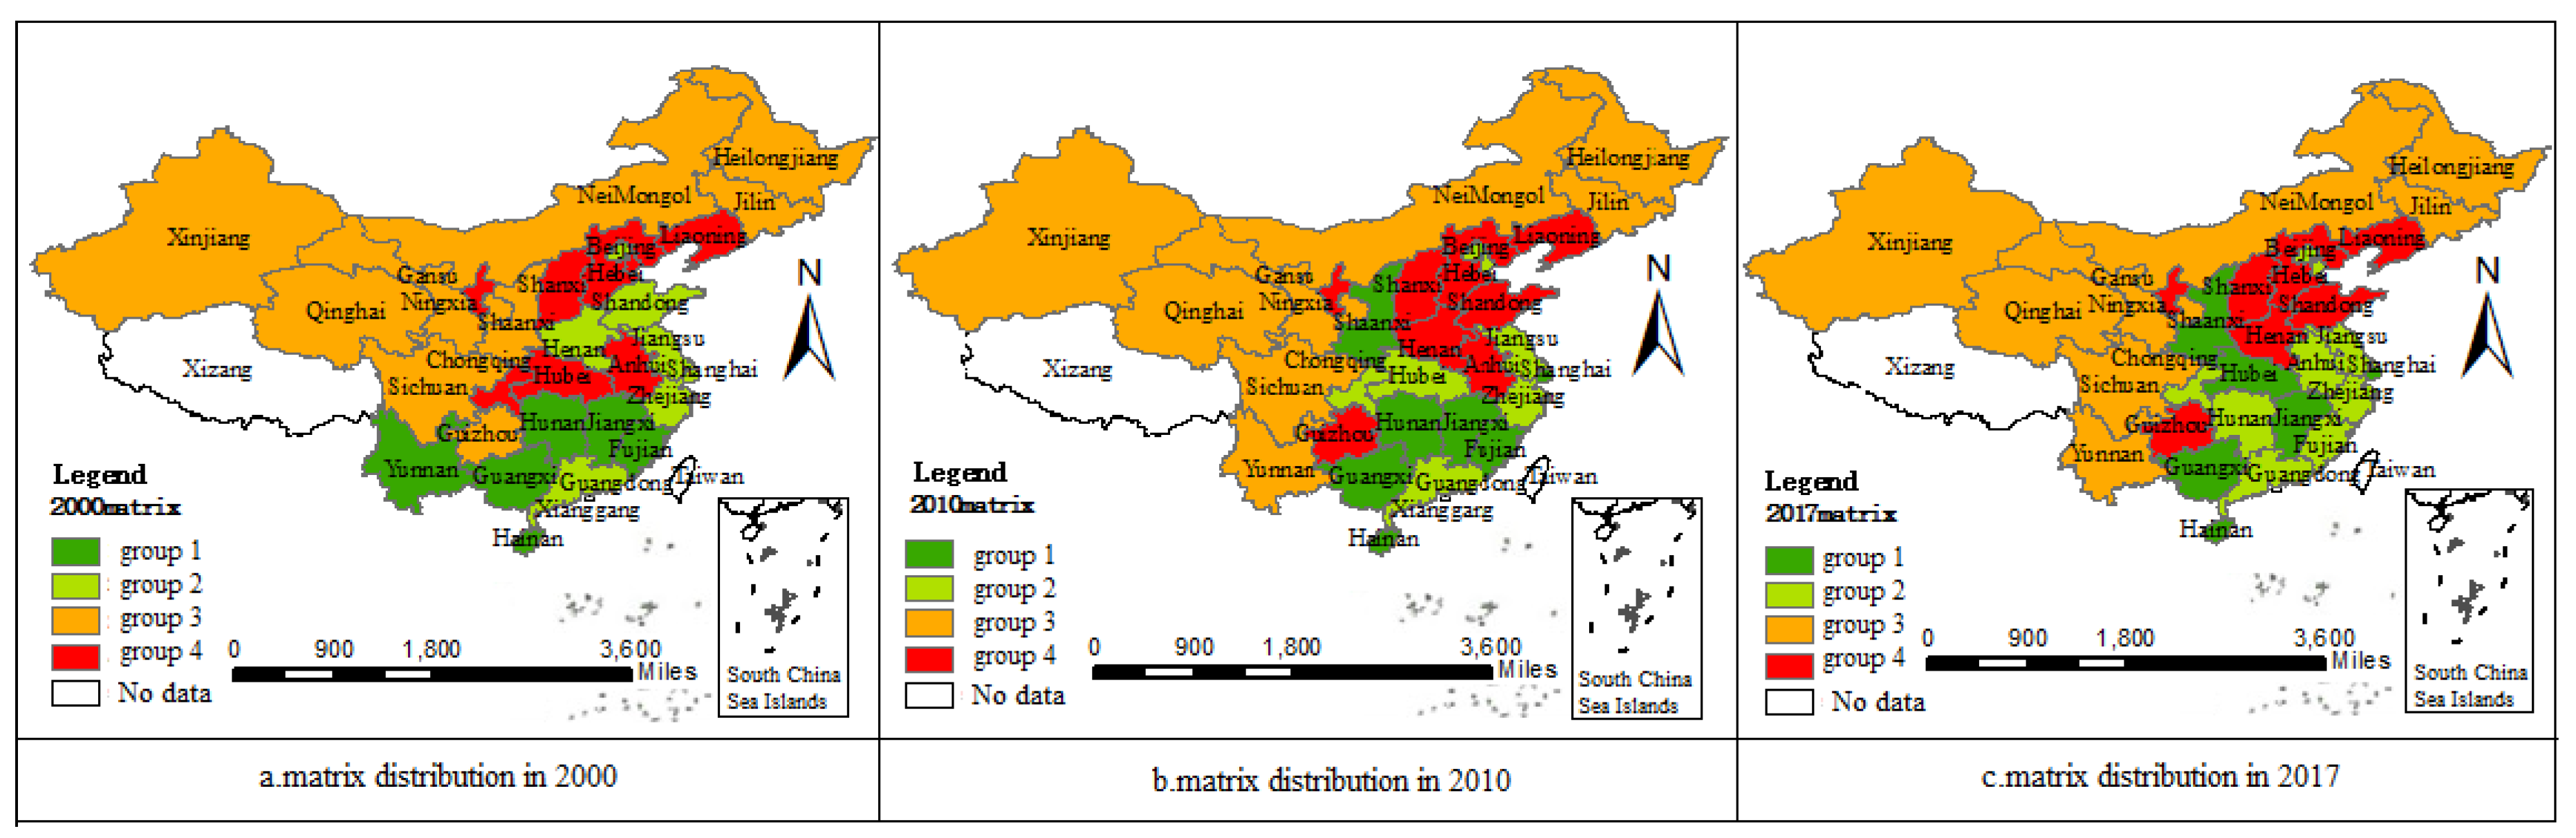
When we turn to the matrix method, the spatial patterns of carbon emissions are described via their economy and ecology. The spatial pattern of matrices in 2000, 2010 and 2017 are shown in Figure 7a–c, respectively. It can be seen that the spatial distribution of matrices overall also shows imbalances between the provinces of the Southeast and the Northwest. Unlike the fE index, the evaluation matrix only divides China’s 30 provinces into four groups by ESI and ECI. For instance, the provinces of Guangxi, Hainan, Jiangxi, Shaanxi and Shanghai are in Group 1, with higher economic development and higher carbon sink capacity. Although these provinces all rank in “equality” using the fE index, the equality conditions are different. The provinces of Guangxi and Shaanxi rank “relative equality”, and the remaining provinces are recognized as “proper equality”. In this respect, the fE index could help to analyze the spatial pattern of carbon emissions in more detail. Besides, when referring to the equity of carbon emissions, the matrix method also exposes its limitations, in that it evaluates the spatial pattern of carbon emissions only from the perspective of economy and ecology. As a result, it fails to provide an equity assessment, which is important for assigning the task of carbon reduction between regions.
4. Discussion
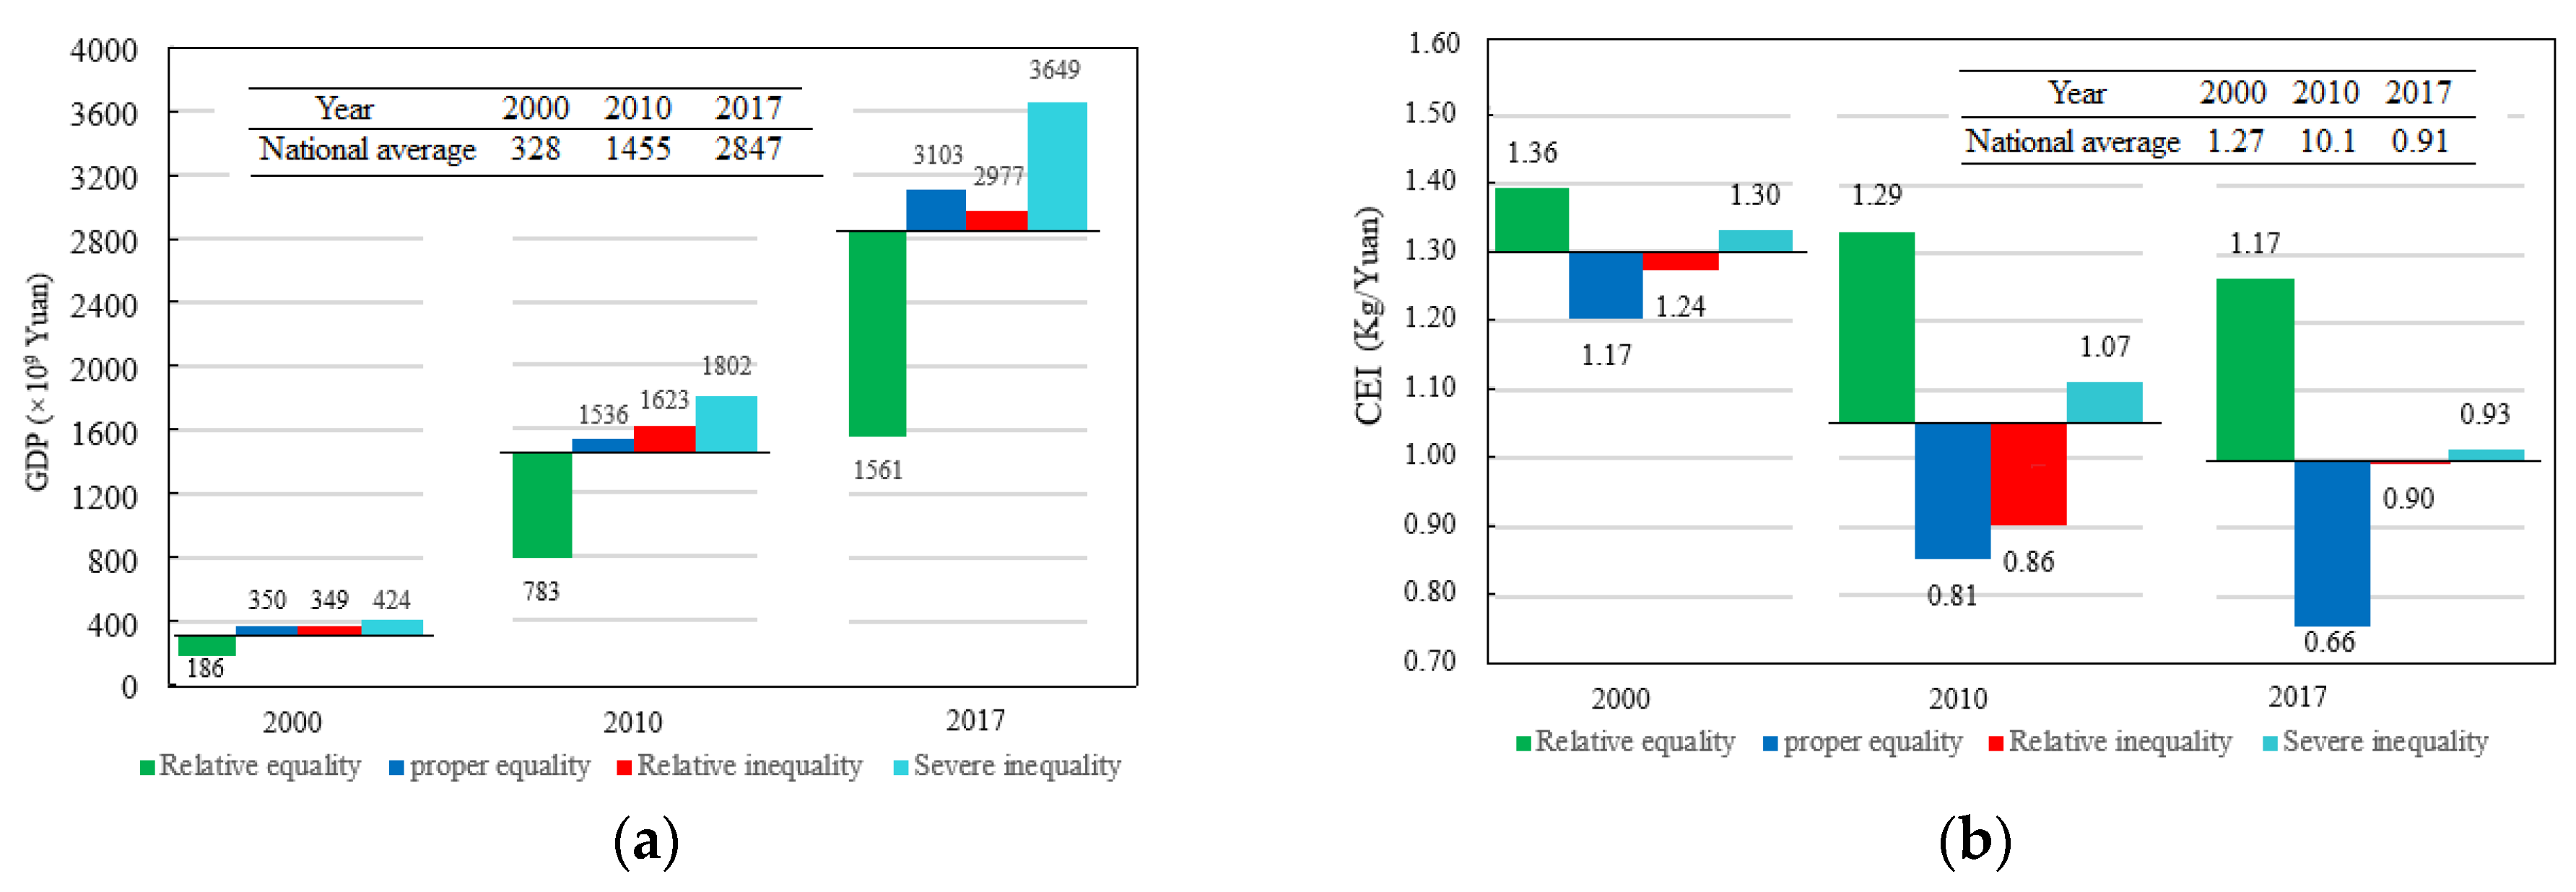
As mentioned in previous sections, the provinces can be divided into five levels based on the fE index: “absolute equality”, “relative equality”, “proper equality”, “relative inequality” and “severe inequality”. Without any region satisfying “absolute equality”, China’s 30 provinces fell into the remaining four levels. The averaged GDP and CEI of different years were shown in Figure 8a,b, to discover the further insights of the fE index.
For the provinces of “relative equality”, like Heilongjiang, Inner Mongolia, Xinjiang, Qinghai, Yunnan and Guangxi (fE > 1.5), their having high CEI and being located in the third group of the evaluation matrix required them to limit their carbon emissions immediately from the perspective of economic development. However, their GDP is lower than the average (Figure 8a), and their CEI is far above average (Figure 8b). Limiting carbon emissions only from economic development would certainly exacerbate the differences (i.e., income gap and CEI gap) among provinces, which is inconsistent with China’s current development goal of “developing economy and eliminating poverty” [21]. By the fE index, though, these provinces are evaluated as displaying “relative equality”, and will be able to relax emissions reduction policies appropriately to realize sustainable economic and social development.
Those provinces of “proper equality” (e.g., Beijing, Fujian, Gansu, Guangdong, Hainan, Hunan, Jilin, Shanghai and Sichuan) and “relative equality” (e.g., Anhui, Chongqing, Guizhou, Zhejiang and Hubei) have a medium GDP but lower CEI (see Figure 8a,b). Although these provinces are currently in proper low-carbon economic development, the fE index remains between equity and inequity due to higher population density and low ecological carbon sink capacity. In the future, more attention should be given to harmony between humans and the environment. This should include steps such as improving people’s awareness of environment protection, guiding the public’s consumption choices and lifestyle, as well as encouraging people to adopt lifestyles that are geared towards low carbon.
Finally, the hot-spot provinces around Bohai Bay, like Shandong, Shanxi, Henan and Hebei, display a higher GDP (see Figure 8a) and have nearly the national average CEI (see Figure 8b). These are traditional industry- and energy-intense regions. In terms of emission reduction, these provinces should pay more attention to industrial transformation and upgrading, optimizing production technology, and improving energy efficiency. In addition, replacing fossil energy with clean energy is also an effective measure to reduce carbon emissions. Meanwhile, wind and nuclear energy have achieved good application results in coastal provinces [50]. Of course, industrial transformation and energy replacement will be a long and arduous process, which needs to be planned by the sources of policy formulating.
Compared with the influence of emissions reduction on economic development, improving carbon sink capacity had less impact. China’s forest fraction coverage increased from 16.55% in 2000 to 21.93% in 2017 [51], but the ecological carbon sink capacities in these hot-spot provinces were far below average (see Figure 2). Fortunately, CCS technology is regarded as a very promising reduction technology in coordinating economic development with environmental protection. Some scholars predict that China has great CO2 storage potential, which is estimated to be over 1841 Gt in theory, and CO2 capture capacity was 0.623–0.753 Mtpa up to 2017 [52]. With the joint efforts and support of policy and finance, CCS will make a great contribution to the development of a low-carbon economy for China and the world in the future.
As mentioned above, the fE index describes the spatial pattern of carbon emissions with more aspects, and thus will provide a reference for the government to formulate targeted emission reduction strategies in different provinces. For example, differentiated measures and actions should be taken in different provinces according to their fE index. The lower the fE value, the stronger these measures and actions are expected to be. It is urgent for hot-spot provinces to proceed with compulsory industrial transformation, and even increase carbon taxes to urge improvement in energy efficiency and eliminate backward output capacity. Furthermore, for the “relative equality” provinces, it is necessary to guide them to improve production equipment, expand production scale and stimulate economic development. Thus, with the help of the fE index, China’s carbon reduction will be guided in an ecological, equitable and efficient direction.
5. Conclusions
Based on the accounting of fossil energy carbon sources, and ecosystem and CCS carbon sinks, this paper proposes a new-built fE index to describe the spatial pattern of carbon emissions in China’s provinces from 2000 to 2017.The conclusions are as follows:
- (1)
- The growth of carbon emissions in China’s provinces far exceeds that of carbon sinks during 2000 to 2017, which shows a significant spatial inconsistency. High carbon emission can be attributed to rapid industrial development within the province’s geographical area. Provinces with high carbon sink capacities are the result of various afforestation and CCS projects.
- (2)
- The fE index of China shows a spatial pattern of “boundary high, central low”. The boundary provinces present a higher fE index (>1.5) and rank as “relative equality”. The fE values in sub-central provinces are between “proper equality” and “relative inequality”. The central provinces around the Bohai Bay rank as “severe inequality”, with a lower fE index (<0.7), and these are hot-spot provinces of carbon emissions. Stricter policies should be taken to limit their carbon emissions induced by rapid economic development.
- (3)
- The fE indexes in most of China’s provinces have increased during the past 17 years. Specifically, Beijing and Shanghai rank from “severe inequality” to “proper equality”, which indicates that the carbon emissions in these areas are moving in a low-carbon, ecologically favorable and high- efficiency direction. This is due to China’s low-carbon economy policy.
- (4)
- The fE index, established under the framework of ecology, equity and economy, is able to characterize the spatial pattern of carbon emission in China from a new perspective and reasonably describe provincial carbon emission trends, which could provide references for the task of allocating carbon emissions in China’s regional economic development and the implementation of low-carbon economic policy.
However, there are still some limitations in this study. The spatial patterns of carbon emissions are analyzed from 2000 to 2017, which is a relatively short period and not conducive to the long-term cyclic development of the whole ecosystem. In a future study, we would extend the fE index to more countries and a more prolonged period, to explore the trends of spatial patterns in carbon emissions. In addition, the data sources from cement, rough Word Bank indexes and IPCC 2006 may have certain limitations. Therefore, in the future, more emission sources should be evaluated and the corresponding method upgraded to acquire the emission data accurately.
Author Contributions
L.S. designed this research and wrote this paper; H.C. and Q.G. provided professional guidance; C.D.A. and X.H. collected all the data and revised this paper. All authors have read and agreed to the published version of the manuscript.
Funding
This work was supported by the National Key Research and Development Program of China (Grant Number: 2017YFA0605303), the National Natural Science Foundation of China (41877454), China Postdoctoral Science Foundation (Grant Number: 2019M650824), and the Youth Innovation Promotion Association of CAS (No.2019053).
Acknowledgments
We would thank four anonymous reviewers and the editor for their valuable feedback.
Conflicts of Interest
The authors declare no conflict of interest.
Appendix A

Table A1.
The net CO2 emissions in Chinese Provinces (Mt).
| Net CO2 Emissions/Mt | ||||||||||||||||||
|---|---|---|---|---|---|---|---|---|---|---|---|---|---|---|---|---|---|---|
| Province | 2000 | 2001 | 2002 | 2003 | 2004 | 2005 | 2006 | 2007 | 2008 | 2009 | 2010 | 2011 | 2012 | 2013 | 2014 | 2015 | 2016 | 2017 |
| Anhui | 120 | 133 | 139 | 158 | 158 | 166 | 188 | 207 | 210 | 216 | 222 | 232 | 243 | 258 | 271 | 279 | 282 | 287 |
| Beijing | 71 | 73 | 73 | 77 | 89 | 93 | 101 | 107 | 109 | 116 | 124 | 125 | 128 | 130 | 136 | 134 | 135 | 138 |
| Chongqing | 42 | 43 | 46 | 48 | 55 | 67 | 74 | 84 | 89 | 98 | 115 | 130 | 139 | 140 | 147 | 146 | 147 | 150 |
| Fujian | 58 | 59 | 70 | 86 | 99 | 126 | 140 | 141 | 143 | 161 | 181 | 186 | 192 | 199 | 209 | 218 | 220 | 224 |
| Gansu | 55 | 57 | 60 | 69 | 79 | 84 | 89 | 98 | 100 | 102 | 105 | 107 | 109 | 111 | 116 | 122 | 123 | 125 |
| Guangdong | 199 | 209 | 232 | 262 | 292 | 334 | 372 | 403 | 409 | 428 | 447 | 476 | 506 | 510 | 536 | 560 | 565 | 574 |
| Guangxi | 58 | 59 | 61 | 71 | 89 | 103 | 112 | 129 | 131 | 129 | 127 | 132 | 138 | 142 | 149 | 151 | 152 | 155 |
| Guizhou | 85 | 88 | 91 | 116 | 133 | 151 | 175 | 177 | 180 | 201 | 225 | 231 | 236 | 237 | 249 | 250 | 252 | 257 |
| Hainan | 10 | 11 | 15 | 19 | 22 | 19 | 22 | 24 | 24 | 25 | 26 | 27 | 29 | 31 | 32 | 32 | 33 | 33 |
| Hebei | 238 | 251 | 284 | 329 | 373 | 455 | 486 | 516 | 524 | 559 | 596 | 606 | 615 | 621 | 652 | 671 | 678 | 689 |
| Heilongjiang | 118 | 114 | 113 | 124 | 133 | 147 | 164 | 173 | 176 | 189 | 203 | 211 | 219 | 219 | 230 | 246 | 248 | 252 |
| Henan | 175 | 192 | 202 | 221 | 289 | 320 | 393 | 437 | 444 | 452 | 461 | 479 | 497 | 504 | 530 | 536 | 542 | 550 |
| Hubei | 137 | 137 | 148 | 167 | 183 | 202 | 227 | 249 | 253 | 261 | 270 | 278 | 287 | 304 | 319 | 322 | 326 | 331 |
| Hunan | 80 | 94 | 101 | 114 | 138 | 191 | 213 | 234 | 238 | 245 | 253 | 264 | 276 | 294 | 309 | 327 | 330 | 335 |
| Jiangsu | 198 | 203 | 221 | 252 | 310 | 395 | 437 | 470 | 477 | 503 | 529 | 538 | 546 | 563 | 591 | 594 | 600 | 610 |
| Jiangxi | 53 | 58 | 63 | 77 | 91 | 103 | 111 | 121 | 123 | 128 | 133 | 139 | 145 | 150 | 157 | 159 | 160 | 163 |
| Jilin | 81 | 87 | 90 | 101 | 111 | 139 | 155 | 167 | 170 | 178 | 187 | 196 | 205 | 206 | 212 | 215 | 217 | 221 |
| Liaoning | 194 | 192 | 196 | 216 | 223 | 272 | 302 | 332 | 337 | 347 | 358 | 367 | 377 | 397 | 417 | 407 | 412 | 418 |
| Innermongoria | 102 | 112 | 122 | 146 | 204 | 242 | 291 | 335 | 340 | 335 | 329 | 377 | 432 | 459 | 467 | 473 | 478 | 485 |
| Nixia | 18 | 21 | 25 | 38 | 50 | 55 | 63 | 67 | 68 | 72 | 77 | 81 | 85 | 87 | 92 | 93 | 94 | 96 |
| Shannxi | 12 | 14 | 16 | 18 | 19 | 21 | 25 | 27 | 27 | 29 | 30 | 31 | 33 | 36 | 37 | 39 | 39 | 40 |
| Qinghai | 61 | 71 | 79 | 89 | 110 | 126 | 137 | 151 | 153 | 158 | 162 | 174 | 187 | 201 | 211 | 214 | 216 | 220 |
| Shandong | 200 | 240 | 269 | 329 | 407 | 562 | 614 | 668 | 678 | 706 | 735 | 757 | 779 | 786 | 792 | 796 | 804 | 817 |
| Shanghai | 106 | 111 | 115 | 125 | 139 | 152 | 158 | 177 | 180 | 182 | 184 | 186 | 189 | 194 | 203 | 205 | 207 | 210 |
| Shanxi | 154 | 191 | 227 | 255 | 264 | 271 | 301 | 326 | 331 | 346 | 362 | 372 | 383 | 406 | 426 | 476 | 481 | 488 |
| Sichuan | 188 | 188 | 211 | 242 | 266 | 279 | 310 | 283 | 287 | 357 | 442 | 459 | 477 | 425 | 447 | 455 | 459 | 467 |
| Tianjin | 188 | 188 | 211 | 242 | 80 | 85 | 92 | 100 | 102 | 106 | 110 | 124 | 140 | 143 | 150 | 151 | 153 | 155 |
| Xinjiang | 57 | 58 | 62 | 64 | 89 | 96 | 107 | 121 | 123 | 123 | 123 | 142 | 162 | 176 | 185 | 193 | 195 | 198 |
| Yunnan | 59 | 67 | 77 | 95 | 93 | 143 | 161 | 174 | 177 | 185 | 194 | 194 | 194 | 206 | 216 | 224 | 226 | 230 |
| Zhejiang | 133 | 133 | 133 | 133 | 133 | 133 | 133 | 133 | 133 | 133 | 343 | 343 | 343 | 343 | 343 | 404 | 343 | 414 |
Table A2.
The fE index and income Gini coefficients in different countries.
| Developed Countries | Developing Countries | |||||||
|---|---|---|---|---|---|---|---|---|
| Country | Gini Coefficient | fE Index | Country | Gini Coefficient | fE Index | Country | Gini Coefficient | fE Index |
| Australia | 0.34 | 2.36 | Angola | 0.47 | 1.10 | Morocco | 0.40 | 1.08 |
| Austria | 0.30 | 2.49 | Albania | 0.30 | 1.80 | Moldova | 0.33 | 1.42 |
| Belgium | 0.28 | 1.97 | Argentina | 0.47 | 1.05 | Madagascar | 0.43 | 1.16 |
| Bulgaria | 0.35 | 1.31 | Armenia | 0.32 | 2.29 | Mexico | 0.50 | 0.67 |
| Bosnia | 0.33 | 1.29 | Benin | 0.43 | 1.08 | Myanmar | 0.38 | 1.47 |
| Belarus | 0.28 | 2.87 | Burkina Faso | 0.39 | 1.55 | Montenegro | 0.31 | 2.59 |
| Canada | 0.34 | 1.54 | Bangladesh | 0.33 | 2.21 | Mongolia | 0.34 | 1.57 |
| Switzerland | 0.33 | 2.29 | Bhutan | 0.39 | 1.29 | Mozambique | 0.49 | 0.68 |
| Czech | 0.26 | 2.86 | Botswana | 0.60 | 0.44 | Mauritania | 0.37 | 1.55 |
| Germany | 0.31 | 1.93 | Chile | 0.49 | 0.72 | Mauritius | 0.37 | 1.65 |
| Denmark | 0.27 | 2.88 | China | 0.41 | 1.54 | Malawi | 0.43 | 1.31 |
| Spain | 0.35 | 1.53 | Cote d’Ivoire | 0.42 | 1.46 | Malaysia | 0.44 | 1.18 |
| Estonia | 0.33 | 1.76 | Cameroon | 0.44 | 1.14 | Namibia | 0.61 | 0.35 |
| Finland | 0.28 | 3.25 | Congo | 0.48 | 0.84 | Nigeria | 0.42 | 1.36 |
| France | 0.32 | 2.15 | Colombia | 0.54 | 0.64 | Nicaragua | 0.48 | 1.08 |
| Greece | 0.35 | 1.87 | Costa Rica | 0.49 | 0.75 | Nepal | 0.38 | 1.18 |
| Croatia | 0.32 | 2.60 | Dominican | 0.49 | 0.81 | Pakistan | 0.32 | 1.84 |
| Hungary | 0.30 | 2.19 | Algeria | 0.28 | 2.86 | Panama | 0.53 | 0.68 |
| Ireland | 0.33 | 1.84 | Ecuador | 0.50 | 0.77 | Peru | 0.48 | 1.09 |
| Iceland | 0.28 | 2.82 | Egypt | 0.31 | 2.52 | Philippines | 0.46 | 1.03 |
| Italy | 0.34 | 1.36 | Gabon | 0.42 | 1.09 | Zimbabwe | 0.43 | 1.32 |
| Japan | 0.32 | 1.89 | Georgia | 0.38 | 1.29 | Paraguay | 0.52 | 0.64 |
| Lithuania | 0.36 | 2.09 | Ghana | 0.43 | 1.16 | Senegal | 0.40 | 1.25 |
| Luxembourg | 0.32 | 1.96 | Guinea | 0.39 | 1.55 | El Salvador | 0.46 | 1.10 |
| Latvia | 0.36 | 2.14 | Guatemala | 0.52 | 0.67 | Serbia | 0.40 | 1.68 |
| Netherlands | 0.29 | 1.98 | Honduras | 0.55 | 0.67 | Syrian Arab | 0.36 | 1.35 |
| Norway | 0.27 | 2.93 | Haiti | 0.41 | 0.92 | Chad | 0.42 | 1.37 |
| Poland | 0.34 | 1.57 | Indonesia | 0.35 | 2.13 | Togo | 0.44 | 1.10 |
| Portugal | 0.37 | 1.25 | India | 0.35 | 1.28 | Thailand | 0.40 | 1.58 |
| Romania | 0.37 | 1.80 | Iran | 0.41 | 1.03 | Tajikistan | 0.33 | 2.00 |
| Russian | 0.40 | 1.26 | Iraq | 0.29 | 2.95 | Tunisia | 0.37 | 1.69 |
| Sudan | 0.35 | 2.09 | Jamaica | 0.47 | 0.69 | Tanzania | 0.38 | 1.00 |
| Slovak | 0.27 | 1.96 | Jordan | 0.34 | 1.50 | Uganda | 0.43 | 0.87 |
| Sweden | 0.27 | 2.36 | Kazakhstan | 0.31 | 2.42 | Uruguay | 0.43 | 1.16 |
| USA | 0.41 | 0.89 | Kenya | 0.44 | 1.25 | Venezuela | 0.50 | 0.95 |
| Britain | 0.34 | 1.12 | Kyrgyz | 0.31 | 2.30 | Vietnam | 0.36 | 1.19 |
| Korea. | 0.32 | 1.92 | Lao PDR | 0.35 | 1.85 | Yemen | 0.36 | 1.26 |
| Cyprus | 0.33 | 1.90 | Lebanon | 0.32 | 2.50 | Zambia | 0.53 | 0.73 |
| Israel | 0.41 | 1.07 | Sri Lanka | 0.39 | 1.69 | Papua New Guinea | 0.42 | 1.46 |
| Malta | 0.29 | 3.07 | Lesotho | 0.53 | 0.48 | |||
References
- International Panel on Climate Change (IPCC). Climate Change 2014: Synthesis Report. Contribution of Working Groups I, II and III to the Fifth Assessment Report of the Intergovernmental Panel on Climate Change; International Panel on Climate Change (IPCC): Geneva, Switzerland, 2014. [Google Scholar]
- Tollefson, J. US Government Report Says that Climate Change Is Real—And Humans Are to Blame. Nature. 2017. Available online: https://www.scientificamerican.com/article/u-s-government-report-says-climate-change (accessed on 1 February 2020).
- Cornell, J.D.; Quintas-Soriano, C.; Running, K.; Castro, A.J. Examining concern about climate change and local environmental changes from an ecosystem service perspective in the Western U.S. Environ. Sci. Policy 2019, 101, 221–231. [Google Scholar] [CrossRef]
- Harrison, P.; Dunford, R.; Holman, I.; Rounsevell, M.D.A. Climate change impact modelling needs to include cross-sectoral interactions. Nat. Clim. Chang. 2016, 6, 885–890. [Google Scholar] [CrossRef] [Green Version]
- Pauw, W.P.; Klein, R.J.T.; Mbeva, K.; Dzebo, A.; Cassanmagnago, D.; Rudloff, A. Beyond headline mitigation numbers: We need more transparent and comparable ndcs to achieve the paris agreement on climate change. Clim. Chang. 2018, 147, 23–29. [Google Scholar] [CrossRef] [Green Version]
- Oak Ridge National Laboratory (ORNL). National CO2 Emissions from Fossil-Fuel Burning, Cement Manufacture, and Gas Flaring. Carbon Dioxide Information Analysis Center, Oak Ridge National Laboratory, U.S. Department of Energy. 2017. Available online: https://www.energy.gov/orem/cleanup-sites/oak-ridge-national-laboratory (accessed on 1 February 2020).
- Shuai, C.; Chen, X.; Wu, Y.; Tan, Y.; Zhang, Y.; Shen, L. Identifying the key impact factors of carbon emission in china: Results from a largely expanded pool of potential impact factors. J. Clean. Prod. 2018, 175, 612–623. [Google Scholar] [CrossRef]
- National Development Reform Commission (NDRC). Enhanced Actions on Climate Change. 2015. Available online: http://www4.unfccc.int/ndcregistry/PublishedDocuments/China%20First/China%27s%20First%20NDC%20Submission.pdf (accessed on 1 February 2020).
- Wang, H.; Lu, X.; Deng, Y.; Sun, Y.G.; Nielsen, C.P.; Liu, Y.; Zhu, G.; Bu, M.L.; Bi, J.; McElroy, M.B. China’s CO2 peak before 2030 implied from characteristics and growth of cities. Nat. Sustain. 2019, 2, 748–754. [Google Scholar] [CrossRef]
- Fang, K.; Tang, Y.Q.; Zhang, Q.F.; Song, J.N.; Wen, Q.; Sun, H.P.; Ji, C.Y.; Xu, A.Q. Will China peak its energy-related carbon emissions by 2030? Lessons from 30 Chinese provinces. Appl. Energy 2019, 255, 113852. [Google Scholar] [CrossRef]
- Jiang, J.; Ye, B.; Liu, J. Research on the peak of CO2 emissions in the developing world: Current progress and future prospect. Appl. Energy 2019, 235, 186–203. [Google Scholar] [CrossRef]
- Shen, L.; Wu, Y.; Lou, Y.; Zeng, D.; Shuai, C.; Song, X. What drives the carbon emission in the Chinese cities?—A case of pilot low carbon city of Beijing. J. Clean. Prod. 2018, 174, 343–354. [Google Scholar] [CrossRef]
- Wang, Q.; Gao, Z.; Ning, J. Model-based assessment of the pattern differences and the equity of national carbon emissions in China during 2000–2010. J. Clean. Prod. 2015, 103, 696–704. [Google Scholar] [CrossRef]
- Ye, F.; Fang, X.L.; Li, L.X.; Li, Y.N.; Chang, T. Allocation of carbon dioxide emission quotas based on the energy-economy-environment perspective: Evidence from Guangdong Province. Sci. Total Environ. 2019, 669, 657–667. [Google Scholar] [CrossRef]
- Yu, A.; Lin, X.R.; Zhang, Y.T.; Jiang, X.; Peng, L.H. Analysis of driving factors and allocation of carbon emission allowance in China. Sci. Total Environ. 2019, 673, 74–82. [Google Scholar] [CrossRef] [PubMed]
- Xu, Q.; Dong, Y.X.; Yang, R.; Zhang, H.; Wang, C.J.; Du, Z.W. Temporal and spatial differences in carbon emissions in the Pearl River Delta based on multi-resolution emission inventory modeling. J. Clean. Prod. 2019, 214, 615–622. [Google Scholar] [CrossRef]
- Apergis, N.; Payne, J.E. Per capita carbon dioxide emissions across us states by sector and fossil fuel source: Evidence from club convergence tests. Energy Econ. 2017, 63, 365–372. [Google Scholar] [CrossRef]
- Lin, B.Q.; Ge, J.M. Carbon sinks and output of China’s forestry sector: An ecological economic development perspective. Sci. Total Environ. 2019, 655, 1169–1180. [Google Scholar] [CrossRef] [PubMed]
- Dong, F.; Li, J.Y.; Zhang, S.N.; Wang, Y.; Sun, Z.Y. Sensitivity analysis and spatial-temporal heterogeneity of CO2 emission intensity: Evidence from China. Resour. Conser. Recyc. 2019, 150, 104398. [Google Scholar] [CrossRef]
- Zhao, X.; Burnett, J.W.; Fletcher, J.J. Spatial analysis of china province-level CO2 emission intensity. Renew. Sustain. Energy Rev. 2014, 33, 1–10. [Google Scholar] [CrossRef] [Green Version]
- Zhang, X.; Han, J.; Zhao, H.; Deng, S.; Xiao, H.; Peng, H. Evaluating the interplays among economic growth and energy consumption and CO2 emission of china during 1990–2007. Renew. Sustain. Energy Rev. 2012, 16, 65–72. [Google Scholar] [CrossRef]
- Cui, C.; Shan, Y.; Liu, J.; Yu, X.; Wang, H.T.; Wang, Z. CO2 emissions and their spatial patterns of Xinjiang cities in China. Appl. Energy 2019, 252, 1–12. [Google Scholar] [CrossRef]
- Yi, B.W.; Xu, J.H.; Fan, Y. Determining factors and diverse scenarios of CO2 emissions intensity reduction to achieve the 40–45% target by 2020 in China—A historical and prospective analysis for the period 2005–2020. J. Clean. Prod. 2016, 122, 87–101. [Google Scholar] [CrossRef]
- Zhu, Z.S.; Liao, H.; Cao, H.S.; Wang, L.; Wei, Y.M.; Yan, J. The differences of carbon intensity reduction rate across 89 countries in recent three decades. Appl. Energy 2014, 113, 808–815. [Google Scholar] [CrossRef]
- Hedenus, F.; Azar, C. Estimates of trends in global income and resource inequalities. Ecol. Econ. 2005, 55, 351–364. [Google Scholar] [CrossRef]
- Jorgenson, A.; Schor, J.; Huang, X. Income inequality and carbon emissions in the United States: A state-level analysis, 1997–2012. Ecol. Econ. 2017, 134, 40–48. [Google Scholar] [CrossRef]
- Dong, C.; Dong, X.C.; Jiang, Q.Z.; Dong, K.Y.; Liu, G.X. What is the probability of achieving the carbon dioxide emission targets of the Paris Agreement? Evidence from the top ten emitters. Sci. Total Environ. 2018, 622–623, 1294–1303. [Google Scholar] [CrossRef]
- Duro, A.J. The international distribution of energy intensities: Some synthetic results. Energy Pol. 2015, 83, 257–266. [Google Scholar] [CrossRef] [Green Version]
- Chen, L.; Xu, L.Y.; Yang, Z.F. Inequality of industrial carbon emissions of the urban agglomeration and its peripheral cities: A case in the Pearl River Delta, China. Renew. Sustain. Energy Rev. 2019, 109, 438–447. [Google Scholar] [CrossRef]
- Groot, L. Carbon Lorenz curves. Resour. Energy Econ. 2010, 32, 45–64. [Google Scholar] [CrossRef]
- Zimm, C.; Nakicenovic, N. What are the implications of the Paris Agreement for inequality? Clim. Policy 2019. [Google Scholar] [CrossRef]
- Li, H.; Jiang, H.D.; Yang, B.; Liao, H. An analysis of research hotspots and modeling techniques on carbon capture and storage. Sci. Total Environ. 2019, 687, 687–701. [Google Scholar] [CrossRef]
- Anil, G. Chapter 1-Climate Change and Kyoto Protocol: An Overview. In Handbook of Environmental and Sustainable Finance; SJVN Limited: Shimla, India, 2016; pp. 3–23. [Google Scholar] [CrossRef]
- International Energy Agency (IEA). Energy Technology Perspectives 2012; OECD/IEA: Paris, France, 2012; Available online: https://webstore.iea.org/energy-technology-perspectives-2012 (accessed on 1 February 2020).
- Björkegre, A.; Grimmond, C. Net carbon dioxide emissions from central London. Urban Clim. 2017, 23, 131–158. [Google Scholar]
- Lu, J.; Huang, X.; Liang, D. Spatio-temporal Scale Analysis on the Equality of Energy Consumption Carbon Emission Distribution in China. J. Nat. Resour. 2012, 27, 2006–2017. [Google Scholar]
- National Development Reform Commission (NDRC). The People’s Republic of China National Communication Climate Change; China Planning Press: Beijing, China, 2016. Available online: https://unfccc.int/sites/default/files/resource/chnbur1.pdf (accessed on 1 February 2020).
- Ali, M.; Saidur, R.; Hossain, M. A review on emission analysis in cement industries. Renew. Sustain. Energy Rev. 2011, 15, 2252–2261. [Google Scholar] [CrossRef]
- International Panel on Climate Change (IPCC). 2006 IPCC Guidelines for National Greenhouse Cas Inventories. Prepared by the National Greenhouse Gas Inventories Program Eggleston H S. IGES. Japan. Available online: https://www.ipcc.ch/report/2006-ipcc-guidelines-for-national-greenhouse-gas-inventories/ (accessed on 1 February 2020).
- Walsh, B.; Ciais, P.; Janssens, I.A.; Penuelas, J.; Riahi, K.; Rydzak, F.; Vuuren, D.P.; Obersteiner, M. Pathways for balancing CO2 emissions and sinks. Nat. Commun. 2017, 8, 1–12. [Google Scholar] [CrossRef] [PubMed] [Green Version]
- National Bureau of Statistics (NBS). 2001–2018a. China Energy Statistical Yearbook 2000–2018; China Statistical Publishing House. Available online: http://tongji.cnki.net/kns55/Navi/HomePage.aspx?Id=N2010080088&name=YCXME (accessed on 5 January 2020).
- National Bureau of Statistics (NBS). 2001–2018b. China Cement Statistical Yearbook 2000–2018; China Statistical Publishing House. Available online: http://tongji.cnki.net/kns55/navi/HomePage.aspx?id=N2012070092&name=YZZSN (accessed on 5 January 2020).
- National Bureau of Statistics (NBS). 2001–2018c. China Statistical Yearbook 2000–2018; China Statistical Publishing House. Available online: http://tongji.cnki.net/Kns55/brief/result.aspx (accessed on 5 January 2020).
- Food and Agriculture Organization (FAO). The Land Use Data. 2000–2017. Available online: http://www.fao.org/faostat/en/#data/GF (accessed on 1 February 2020).
- Global CCS Institute. The Global Status of CCS (2010–2018). Available online: https://www.globalccsinstitute.com/resources/publications-reports-research/ (accessed on 1 February 2020).
- Asian Development Bank (ADB). Roadmap Carbon Capture Storage Demonstration and Deployment in the People’s Republic of China. 2015. Available online: http://hub.globalccsinstitute.com/sites/default/files/publications/196843/global-status-ccs-2015-summary.pdf (accessed on 1 February 2020).
- The Administrative Center for China’s Agenda 21 (ACCA 21). Roadmap for Carbon Capture, Utilization and Storage Technology in China; The Administrative Center for China’s Agenda 21 (ACCA 21): Beijing, China, 2019. Available online: https://wenku.baidu.com/view/a06af534f111f18583d05ad2.html?pn=50 (accessed on 1 February 2020).
- The World Bank. World Bank National Accounts Data 2000–2014. 2018. Available online: https://data.worldbank.org/ (accessed on 3 February 2020).
- Hailemariam, A.; Dzhumashev, R.; Shahbaz, M. Carbon emissions, income inequality and economic development. Empir. Econ. 2019. [Google Scholar] [CrossRef]
- Geng, Y.; Tian, M.; Zhu, Q.; Zhang, J.; Peng, C. Quantification of provincial-level carbon emissions from energy consumption in China. Renew. Sustain. Energy Rev. 2011, 15, 3658–3668. [Google Scholar] [CrossRef]
- Tang, X.; Zhao, X.; Bai, Y.; Tang, Z.; Wang, W.; Zhao, Y.; Wan, H.; Xie, Z.; Shi, X.; Wu, B.; et al. Carbon pools in China’s terrestrial ecosystems: New estimates based on an intensive field survey. Proc. Natl. Acad. Sci. USA 2018, 115, 4021–4026. [Google Scholar] [CrossRef] [Green Version]
- Sun, L.L.; Dou, H.E.; Li, Z.P.; Hu, Y.L.; Hao, X.N. Assessment of CO2 storage potential and Carbon Capture, Utilization and Storage prospect in China. J. Energy Inst. 2018, 91, 970–977. [Google Scholar] [CrossRef]
Figure 1.
Spatial pattern of provincial CO2 emissions (Mt) during (a) 2000–2010 and (b) 2010–2017.

Figure 2.
A spatial pattern of provincial CO2 sink capacities (Kt) during (a) 2000–2010 and (b) 2010–2017.
Figure 2.
A spatial pattern of provincial CO2 sink capacities (Kt) during (a) 2000–2010 and (b) 2010–2017.

Figure 3.
fE index vs. income Gini coefficients, based on the data from World bank.

Figure 4.
fE distribution of China’s Provinces in 2000, 2010 and 2017.

Figure 5.
fE values of China’s carbon emissions from 2000 to 2017.

Figure 6.
Spatial pattern of CEI in 2000, 2010 and 2017.

Figure 7.
Spatial pattern of evaluation matrix in 2000, 2010 and 2017.

Figure 8.
Comparison of regional to national (a). GDP and (b). CEI.

Table 1.
Evaluation matrix of carbon emissions.
| Evaluation Indicators | ESI > 1 | ESI < 1 |
|---|---|---|
| ECI > 1 | Group 1: high carbon sink and efficient low-carbon economy | Group 2: high economic development but low ecological support |
| ECI < 1 | Group 3: high carbon sink but low economy efficiency | Group 4: low carbon sink and low economy efficiency |
Table 2.
Equity interpretation.
| Equity Interpretation | Income Gini Coefficient | fE Index |
|---|---|---|
| Absolute equality | <0.2 | >4.0 |
| Relative equality | 0.2–0.3 | 1.5–4.0 |
| Proper equality | 0.3–0.4 | 1.0–1.5 |
| Relative inequality | 0.4–0.5 | 0.7–1.0 |
| Severe inequality | >0.5 | <0.7 |
© 2020 by the authors. Licensee MDPI, Basel, Switzerland. This article is an open access article distributed under the terms and conditions of the Creative Commons Attribution (CC BY) license (http://creativecommons.org/licenses/by/4.0/).
Share and Cite
MDPI and ACS Style
Sun, L.; Cui, H.; Ge, Q.; Adenutsi, C.D.; Hao, X. Spatial Pattern of a Comprehensive fE Index for Provincial Carbon Emissions in China. Energies 2020, 13, 2604. https://doi.org/10.3390/en13102604
AMA Style
Sun L, Cui H, Ge Q, Adenutsi CD, Hao X. Spatial Pattern of a Comprehensive fE Index for Provincial Carbon Emissions in China. Energies. 2020; 13(10):2604. https://doi.org/10.3390/en13102604
Chicago/Turabian StyleSun, Lili, Huijuan Cui, Quansheng Ge, Caspar Daniel Adenutsi, and Xining Hao. 2020. "Spatial Pattern of a Comprehensive fE Index for Provincial Carbon Emissions in China" Energies 13, no. 10: 2604. https://doi.org/10.3390/en13102604
Note that from the first issue of 2016, this journal uses article numbers instead of page numbers. See further details here.