Article

Effects of Thickened Excess Sludge Pre-Treatment Using Hydrodynamic Cavitation for Anaerobic Digestion

by
Agnieszka Garlicka
1,*,
Monika Zubrowska-Sudol
1,
Katarzyna Umiejewska
1,
Otton Roubinek
2,
Jacek Palige
2 and
Andrzej Chmielewski
2
1
Department of Water Supply and Wastewater Treatment, Faculty of Building Services, Hydro and Environmental Engineering, Warsaw University of Technology, 20 Nowowiejska St., 00-653 Warsaw, Poland
2
Institute of Nuclear Chemistry and Technology, 16 Dorodna St., 03-195 Warsaw, Poland
*
Author to whom correspondence should be addressed.
Energies 2020, 13(10), 2483; https://doi.org/10.3390/en13102483
Submission received: 17 April 2020 / Revised: 8 May 2020 / Accepted: 12 May 2020 / Published: 14 May 2020
(This article belongs to the Section A: Sustainable Energy)

Abstract

:
The main purpose of this study was the assessment of the possibility of increasing the production of biogas through the pre-treatment of thickened excess sludge (TES) by means of the hydrodynamic cavitation (HC) conducted at different levels of energy density (EL) i.e., 70, 140 and 210 kJ/L. The experiments were performed on a pilot scale, and a mixture of thickened primary sludge (TPS) and TES was used as digester feed. The results documented that an important parameter determining the possibility of obtaining an enhanced methane production is the value of energy input in the HC process. This parameter determines the changes occurring in sludge as a result of disintegration (i.e., sludge floc deagglomeration, lysis of cells, re-flocculation process and the related release of compounds susceptible to biodegradation from sludge flocs). The maximum increase in methane yield (MY) of 152% was obtained for EL = 140 kJ/L. In this case, HC mainly caused sludge floc deagglomeration. An increase in MY was also recorded when TES was subject to the disintegration process at EL = 210 kJ/L. However, it was 4.3 times lower than that observed for EL = 140 kJ/L. Pre-treatment of TES at EL = 70 kJ/L did not contribute to an increase in methane production.

1. Introduction

The amount of generated sewage sludge constitutes only approximately 1%–3% of the volume of produced wastewater. Nonetheless, it can be a potential threat to the environment in the case of its improper management, because it contains, among others, heavy metals and pathogenic organisms. Sludge, currently classified as waste, is becoming an increasingly serious problem, among others, due to the ban on the landfill of particular waste fractions, including municipal sewage sludge (MSS), containing more than 8% dry mass (TS), and with combustion heat exceeding 6 MJ/kg TS, binding from 1 January 2016 [1]. Due to the constant increase in the amount of municipal sewage sludge generated in Polish wastewater treatment plants (WWTP), the management of MSS has become one of the basic challenges of WWTP, and one of the major environmental and logistic issues in the country. In 2017, in Polish municipal wastewater treatment plants, 584.5 thousand tons of dry mass of sewage sludge was generated, a value 2.8% higher in comparison to 2016, and 2.9% higher than in 2015 Environment, 2018 [2]. On the other hand, sewage sludge can have practical importance, because it contains organic substances and nutrients, and is one of renewable energy sources, which is in accordance with the latest trends of the circular economy. The Polish National Waste Management Plan 2022 (PNWMP) [3] presents the following hierarchy of management of municipal sewage sludge: the prevention of its production, preparation for its reuse, recycling, other recovery methods, neutralisation. One of the processes of preparation of sludge for reuse mentioned in PNWMP 2022 is the disintegration process.
The disintegration process involves the destruction of the structure of activated sludge as a result of the introduction of additional energy, consequently leading to the release of compounds forming the matter of sludge flocs, including dissolved organic compounds, to the sludge liquid phase Zielewicz [4]. In practice, it particularly applied to the intensification of the process of anaerobic digestion. The process of disintegration of a part of the stream of excess sludge fed to anaerobic digesters can result in the higher production of biogas, and a lower concentration of organic dry mass in digested sludge, improving its susceptibility to the dewatering processes [5,6]. Many methods of disintegration of sewage sludge exist, differing in the origin of the energy input to the system i.e., mechanical, physical, chemical, biological and hybrid. The choice of the method of sludge disintegration is determined on the one hand by its efficiency, and on the other hand by the related investment and maintenance costs. Among the mechanical disintegration methods, hydrodynamic cavitation (HC) is considered a more energy-efficient solution, in comparison to the extensively applied ultrasound method [5]. A drop in static pressure, below the critical pressure in the liquid, causes the HC. During the HC process, a number of phenomena occur, which increase the temperature of the disintegrated sludge and generate large amounts of heat into the surroundings [7].
The positive effects of the application of HC as a pre-treatment method preceding the anaerobic digestion process were reported by several research teams [5,6,8,9]. Jung et al. [8] obtained the maximum MY of 187.62 ml CH4/g COD added, i.e., a value almost three times higher than that for a sample not subject to pre-treatment. Patil et al. [9] showed a 144% increase in MY. A 12.7% increase in MY and biogas production was obtained by Lee et al. [5] and Petkovšek et al. [6], respectively. Similar observations for other disintegration methods have been made by many groups of researchers. For example, Peng et al. [10] reported a 147.7% increase in MY for microwave irradiation (20 MJ/kgTS), compared to the control reactor (no pre-treatment). Lippert et al. [11] reported a maximum 11.7% increase in MY (in comparison to the control sample) by subjecting sewage sludge from the Traunstein WWTP to ultrasound treatment (specific energy (ES) equal 200 kJ/kgTS). It is worth emphasising that sludge disintegration at ES of 600 kJ/kgTS did not provide the expected results, and even a decrease in MY by 2% was observed, in comparison to the sample not subject to ultrasound treatment. Houtmeyers et al. [12] recorded a 27% increase in biogas production applying the same disintegration method. Positive effects have also been observed after applying the hybrid treatment. For example, Liu et al. [13] treating WAS with free ammonia with heat (135.4 mg FA/L and 70 °C) obtained a 25.2% increase in biochemical methane potential in comparison to the sample not subject to pre-treatment. Li et al. [14] applying the hybrid treatment (calcium peroxide 0.1 g CaO2/g VSS with ultrasonic 1 W/ml, 10 min) to waste activated sludge obtained an increase in MY up to 211.9 LCH4/kg VSS, constituting a value higher by 35.7%, in comparison to the control sample.
Facilitation of the anaerobic digestion process through the application of different methods of sludge disintegration does not only remain in the phase of research. Such solutions are already applied in practice. Currently, approximately a dozen WWTP that apply sludge disintegration before anaerobic digesters exist in Poland. Data from the treatment plants show, however, that the application of (hydrodynamic and ultrasonic) disintegration does not always provide the expected result of intensification of the anaerobic digestion process [15]. Publications by Zielewicz [15,16] present a discussion on the differences in study results concerning the process of ultrasonic disintegration obtained at lab-scale, in comparison to operating practice. The presented results referred to excess sludge from nine different municipal wastewater treatment plants in Poland with population equivalent (PE) > 50,000. Based on the results, the author determined that the susceptibility of sludge to the disintegration process can be extremely varied, due to the different physico-chemical characteristics of the analyzed sludge. The author obtained an evident impact of disintegration on the intensification of the anaerobic digestion process, only in three out of nine analyzed samples, and recorded a considerable 40% increase in the generated biogas only in one case. This led to the conclusion that, before the introduction of the disintegration process in a particular WWTP, detailed pre-conceptual design research should be conducted, in order to confirm the suitability of the selected technological solution, and to avoid the high costs of purchase of such an installation. The author mentions several causes of failure to obtain the same effects of the disintegration process in operating practice as in laboratory research, particularly: lower values of energy introduced to the system; different constructions of disintegrators (not the entire amount of sludge entering the disintegrator is subject to the process); only 20%–40% of excess sludge being subject to disintegration (usually 100% at the lab-scale); an excessively long time of storage of sludge in anaerobic digesters; and variable structure of sludge (related both to biological wastewater treatment and to the process of sludge thickening).
Considering the literature reports, which, on one hand, document the possibility of increasing the efficiency of the anaerobic digestion process through the application of excess sludge disintegration, and, on the other hand, show that the assumed effect is not always obtained, it is appropriate to conduct further research in this area. It is worth noting that, relatively few of the literature reports refer to HC as a method of pre-treatment of sludge directed to digester. Those that do exist have been conducted mainly on a laboratory scale for waste activated sludge. In this study, the topic of HC was also addressed, but the experiment was carried out on a pilot scale, and a mixture of thickened primary sludge (TPS) and thickened excess sludge (TES) was used as digester feed (the same mixing ratio of TPS and TES as in WWTP from which sludge originated). The aim of the study was to assess the possibility of increasing biogas production by introducing TES pre-treatment by HC conducted at different levels of energy density (EL) (defined as the amount of energy related to one liter of disintegrated sludge) of 70, 140 and 210 kJ/L. The studies presented in this paper were carried out in a device (inducing cavitation in the disintegrated medium), which has so far been used to release soluble organic compounds from sludge flocs to intensify the nutrient removal from wastewater [17]. In this study, the device was used to enhance the anaerobic digestion process.

2. Materials and Methods

2.1. Characteristics of the Substrate

The following substrates were used in the experiments: TPS, TES and digested sludge (DS) (used as inoculum) from a municipal WWTP (PE = 1 580 000) (Table 1). At the treatment plant, the anaerobic digestion process is conducted at hydraulic retention time (HRT) in a range of 22–26 days, and at a temperature of 36 °C.

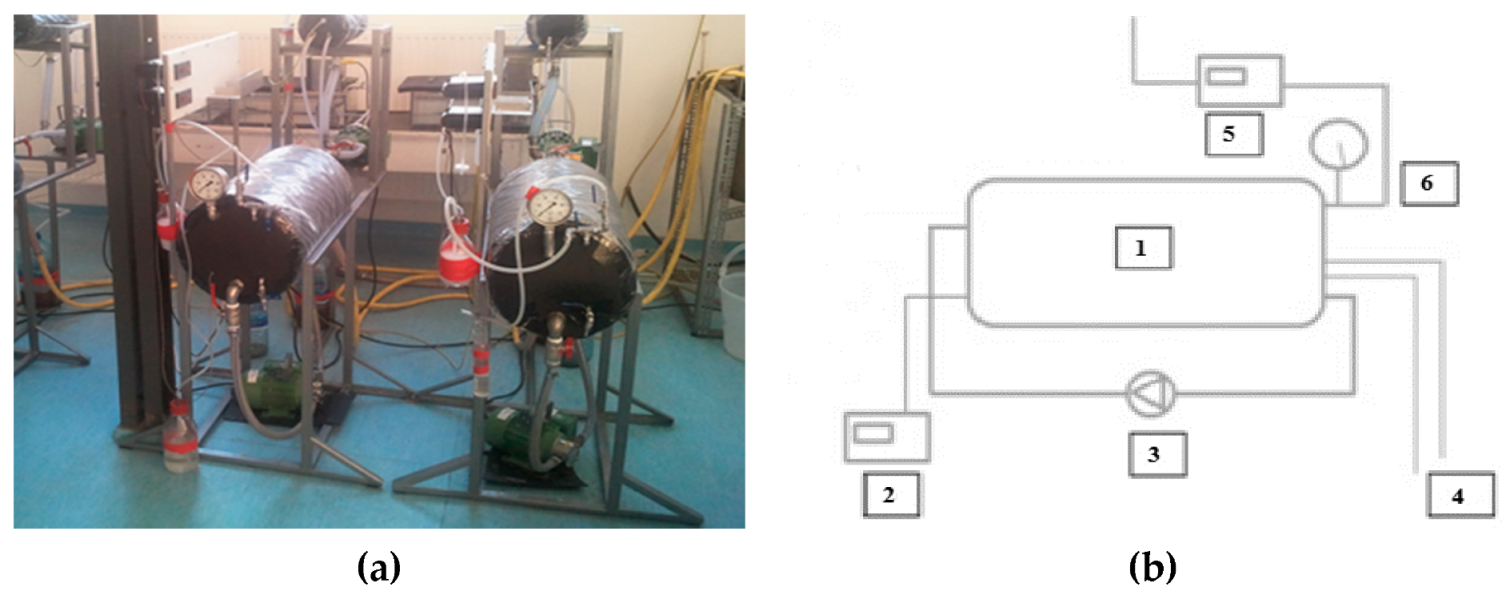
2.2. Disintegration Apparatus

The HC process was carried out in a laboratory device equipped with a multi-use rotor driven by a motor with a power of P = 2.2 kW, motor speed: n = 2800 rpm (patent No. 214335). More details are presented in work Zubrowska-Sudol and Walczak [18]. A 10 L sample of TES was used for each disintegration process, and the process was carried out at a selected energy density (EL = 70, 140, 210 kJ/L), expressed in kJ per 1 liter of disintegrated sludge. The amount of energy used in the disintegration process was controlled by an electricity meter (energy density [kJ/L] was converted into the amount of electricity [kWh], which enabled the precise collection of a sample from the device after reaching the assumed energy consumption). The amount of energy was also defined as specific energy (ES), expressed in kJ per 1 kilogram of total solids of disintegrated TES.

2.3. Experimental Setup

The experiment consisted of three series (S1, S2 and S3). The individual series differed in the level of EL, at which the HC process of TES: S1-EL = 70 kJ/L, S2-EL = 140 kJ/L and S3-EL = 210 kJ/L was conducted. In each series, the anaerobic digestion process was performed in two parallel digesters, with a total volume of 44 L each, and working volume of 29 L, as shown in Figure 1. In order to maintain the same conditions as at the WWTP, sewage sludge was mixed in the same mass ratio (50% TES and 50% TPS). As mentioned above, the inoculum was digested sludge sampled from the mesophilic anaerobic digester. It constituted 20% of the working volume of the reactor. The constant parameters for both digesters were: working volume = 29 L, temperature = 36 °C, and pH in the range of 7.1–7.5. Sodium bicarbonate and hydrochloric acid were used for pH adjustment. A mixture of digested sludge constituting the inoculum, concentrated TPS and a disintegrated TES was introduced into the first anaerobic digester (AD1). The second digester (AD2) was a reference point for the first, and its substrate differed only in that the TES was not subject to the disintegration process. The digesters for each series are described in the following abbreviations:
AD1-S1—anaerobic digester with pre-treated TES at EL = 70 kJ/L-series 1;
AD2-S1—anaerobic digester without a pre-treated-series 1;
AD1-S2—anaerobic digester with pre-treated TES at EL = 140 kJ/L-series 2;
AD2-S2—anaerobic digester without a pre-treated-series 2;
AD1-S3—anaerobic digester with pre-treated TES at EL = 210 kJ/L-series 3;
AD2-S3—anaerobic digester without a pre-treated-series 3.
Owing to this methodical approach, it was possible to check whether the process of disintegration of TES before its introduction into the anaerobic digester allows for a greater production of biogas. In order to compare the results obtained in all series (S1, S2 and S3), a relative values of parameters characterizing the effectiveness of the anaerobic digestion process i.e., percentage increase in methane yield (MY) and biogas yield (BY) and percent increase in biogas/methane accumulation, were used.
The scope of the experiment included:
  • Soluble chemical oxygen demand (SCOD), volatile fatty acids (VFA), ammonium nitrogen (N-NH4+), pH, alkalinity concentrations in the filtrate (the liquid phase) before and after disintegration, as well as in digestate samples;
  • Total solids (TS) and volatile solids (VS) concentrations in sludge before and after disintegration, as well as in digestate samples;
  • Sludge disintegration degree (DDCOD) according to Nickel and Neis [19];
  • Total activity degree of aerobic microorganisms (ADOUR) according to Zubrowska-Sudol and Walczak [18]; the determination of the index aimed at the verification whether deactivation of microorganisms present in TES occurs at a given energy density.
The sludge was centrifuged for 30 min with a speed of 15,000 rpm (centrifuge MPW–350), and then filtered through 0.45 mm filters, to obtain the liquid phase in each sample. All chemical analyses were carried out in duplicates according to APHA Standard Methods [20]. The quantity and the composition of biogas were measured daily. Measurements of biogas were performed by means of a MGCI meter by Ritter, and measurements of biogas components were performed by means of a gas analyzer GA 5000 by Geotech.

3. Results and Discussion

3.1. Impact of Energy Density Input on TES Characteristic

During the disintegration process, soluble organic materials are released from the activated sludge flocs, which can be used for methane production in the process of anaerobic digestion [21]. Table 2 presents the analyses of the changes in the characteristics of the liquid phase of the sludge. A significant increase in SCOD concentrations was observed in samples of TES disintegrated at EL = 140 and 210 kJ/L. For TES disintegrated at an energy density of 140 and 210 kJ/L in reference to the non-disintegrated sample, SCOD concentration increased 15 and 22 times, respectively. It can be concluded that the disintegration carried out at those energy density levels increased the accessibility of substrates contained in the sludge for bacteria responsible for the anaerobic digestion process. When the disintegration process was performed at EL = 70 kJ/L, the SCOD concentrations enhanced barely 3-fold. In samples after the disintegration process in reference to the sample before the process, an increase in VFA concentration was also observed, suggesting the occurrence of the acidification process. An increase in the energy density of the process of HC was accompanied by an increase in VFA concentration. The maximum 55-fold increase in VFA concentration was recorded for EL = 210 kJ/L. The analyses of changes in pH suggest that in reference to the non-disintegrated sample, a surge in EL was accompanied by an increasing reduction of pH values in samples after the disintegration process, which probably resulted from an increase in VFA concentration in the samples. The above observations also confirm changes in the disintegration degree (DDCOD), an index describing the efficiency of the disintegration process. With an increase in EL, the disintegration degree increased (Table 2). Disintegration at increasingly higher energy density also caused deactivation of microorganisms present in activated sludge flocs; at EL = 210 kJ/L, it was approximately 90. The observation suggests the occurrence of lysis of cells.

3.2. Impact of Hydrodynamic Cavitation on the Anaerobic Digestion Process

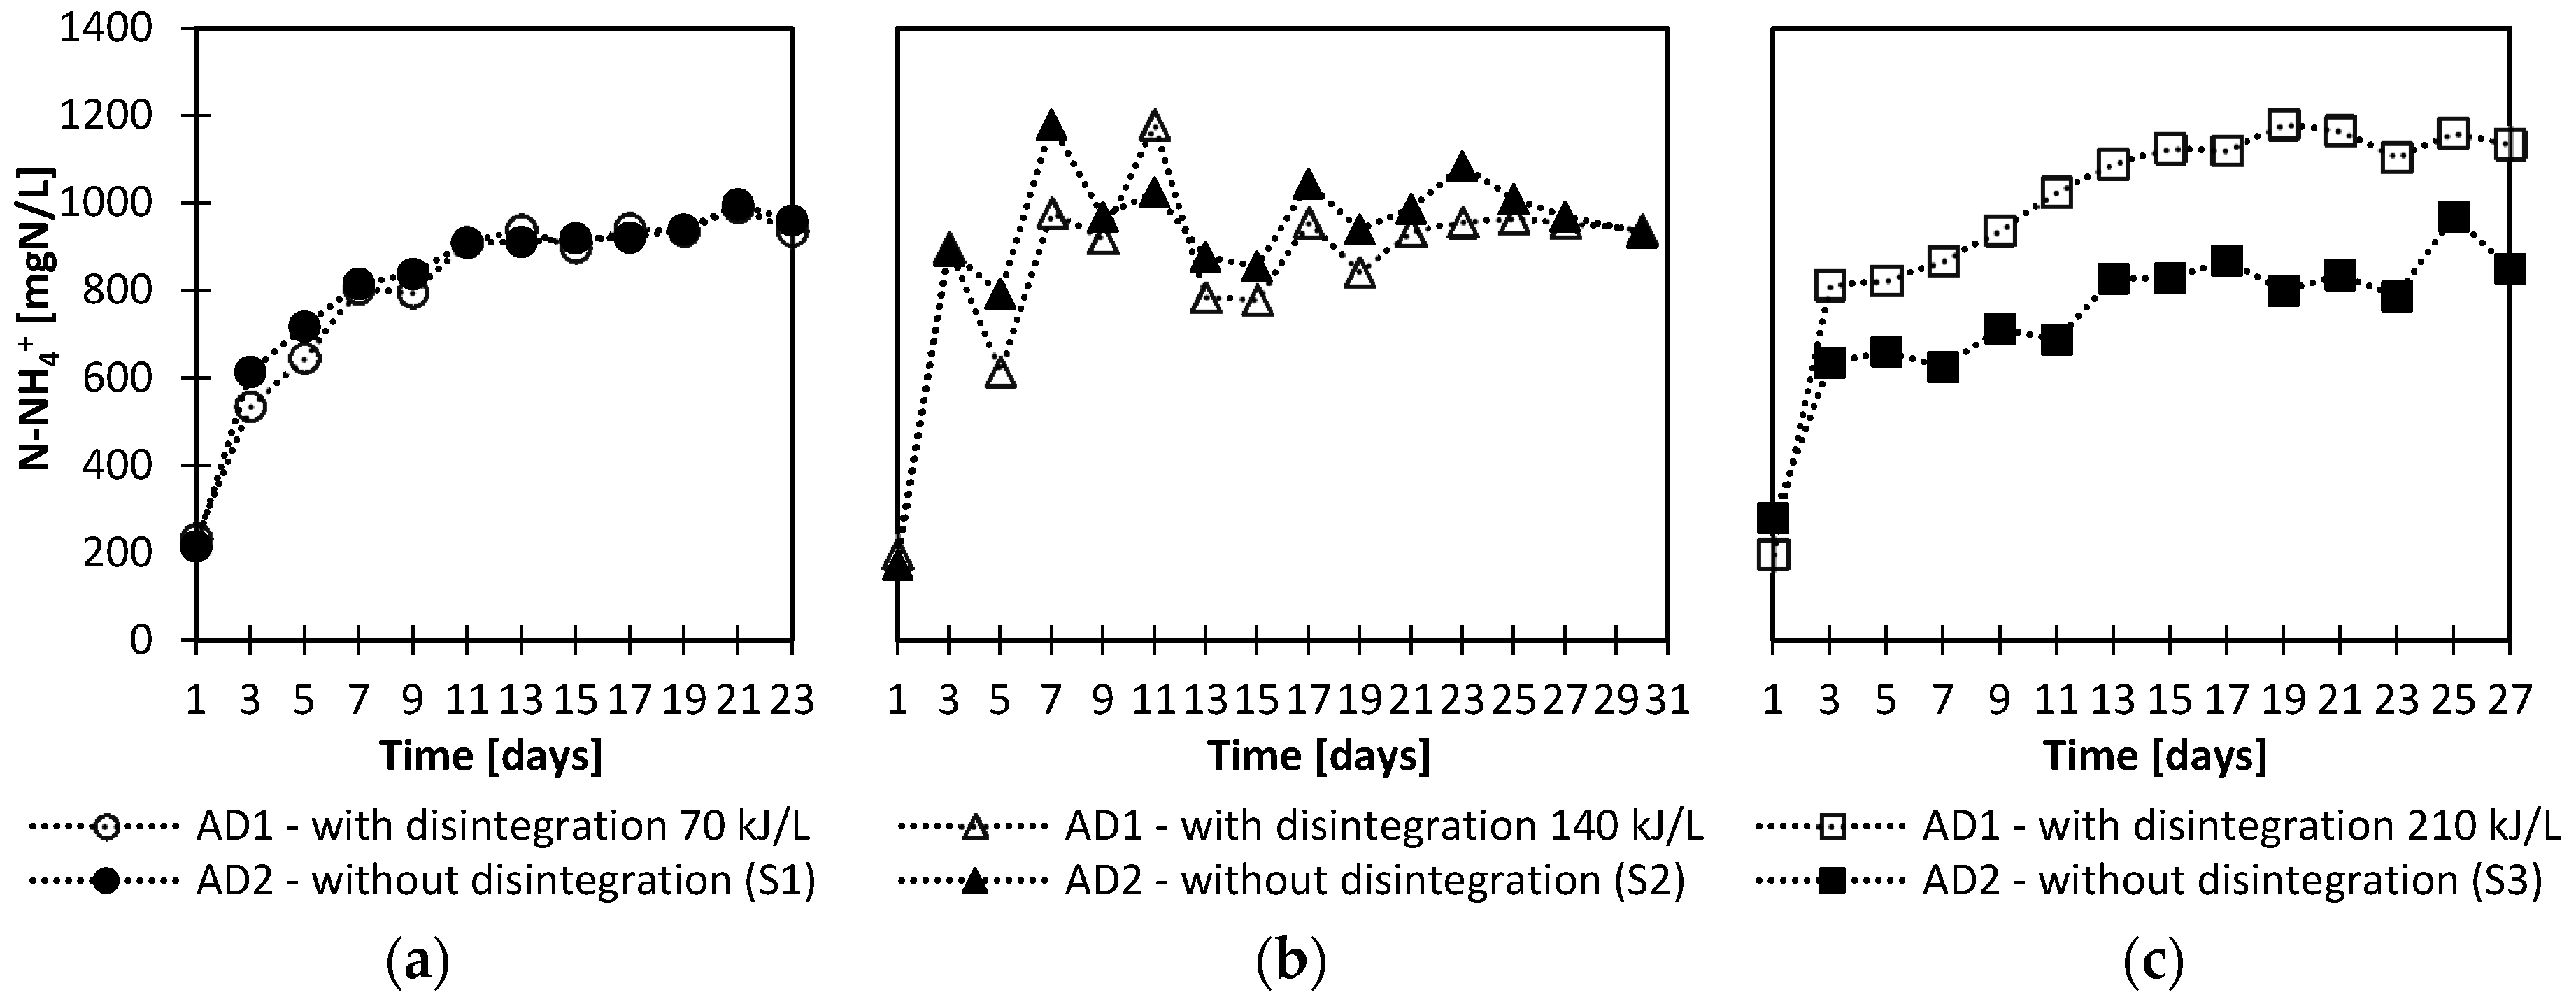
3.2.1. Changes in the Characteristics of the Liquid Phase of Sludge during the Anaerobic Digestion Process

Anaerobic digestion is a microbiological process in which complex organic substances are transformed into biogas. VFA are important intermediate compounds during the anaerobic digestion process, although their increased concentration may inhibit or even completely prevent the anaerobic digestion process. A concentration of VFA in a range from 7000 to 10,500 mg/L is considered inhibiting [22]. Therefore, changes in the indicator in the sludge liquid phase were controlled during the anaerobic digestion process (Figure 2a–c).
In the case of the first series (S1), the VFA concentration in both anaerobic digesters (AD1-S1 with introduced mixture of sludge with TES subject to HC at EL = 70 kJ/L, and AD2-S1 with introduced mixture of sludge with non-disintegrated sludge) remained below the concentration determined as inhibiting for the anaerobic digestion process (Figure 2a). The analysis of changes in the concentration of the index during the process of 23-day anaerobic digestion shows a gradual decrease in VFA concentration from 6504 to 222 mg/L and from 5210 to 255 mg/L, respectively, for AD1-S1 from the third day of the process and for AD2-S1 from the fifth day of the process (Figure 2a). The situation was different in the case of the two remaining series (S2 (Figure 2b) and S3 (Figure 2c)). It may have resulted from the fact that each series was conducted with the application of a different batch of sewage sludge (TES, TPS and DS). The analysis of the course of points in Figure 2b shows a considerable increase in the VFA concentration in the anaerobic digester with an introduced mixture of non-disintegrated sludge (AD2-S2). The VFA concentration in the reactor increased from 1490 to even 9880 mg/L, a value recorded on the 21st day of the process (Figure 2b). Until the end of the observation, VFA concentration varied in a narrow range, adopting a 7.3% lower value on the last (30th) day of the observation (Figure 2b). The observations suggest that the recorded high concentration of VFA may be inhibiting to the anaerobic digestion process, and therefore reduce the amount of produced biogas. In anaerobic digester AD1-S2 (Figure 2b) with an introduced mixture with disintegrated sludge at EL = 140 kJ/L, a gradual increase in the concentration of VFA from 1526 to 8356 mg/L was only observed until the ninth day of the anaerobic digestion process. For the subsequent 10 days, the concentration of VFA gradually decreased, adopting a value of 2908 mg/L on the 19th day. Analogically, as in AD2-S2 (Figure 2b), until the end of observation, the concentration of VFA varied in a narrow range, adopting a value 15% lower than that recorded on the 19th day on the 30th day. In the case of AD2-S3 (Figure 2c), throughout the anaerobic digestion process, the VFA concentration did not exceed the concentration value considered as inhibiting to the anaerobic digestion process. The maximum VFA concentration was recorded on the ninth day of the process, equal to 4798 mg/L. In the case of AD1-S3 (Figure 2c), the VFA concentration was maintained at a relatively high level throughout the observation. Moreover, between the fifth and 11th day of the anaerobic digestion process, it exceeded 7000 mg/L.
The ratio of VFA concentration to alkalinity (A) (VFA/A) is also important for the anaerobic digestion process. Changes in the parameter during the anaerobic digestion process in all the conducted series are presented in Table 3. According to Luste and Luostarinen [23] and Montusiewicz [24], the value of the parameter should be in a range of 0.2–0.6. Another group of scientists report that the VFA/A ratio up to a value of 0.3 ensures balance between acidifying and methane bacteria, without disturbing the course of the anaerobic digestion process Bień and Wystalska [25]. The analysis of changes in the VFA/A ratio obtained in our own research shows that only few values exceed the value of VFA/A = 0.6. In all the conducted series, such values occurred between the third and 11th day of the anaerobic digestion process, and varied from 0.7 to 0.9. It should be noted that in the case of S2 and S3, no values of the VFA/A ratio above 0.6 were registered in the anaerobic digester without disintegration. In AD2-S2, however, from the 11th day of the anaerobic digestion process, values of the VFA/A ratio were higher than 0.3. The situation was similar in AD1-S3, where from the third to 25th day of the process values of the VFA/A ratio above 0.3 were observed, and between the fifth and 9th day, above 0.6.
Ammonium nitrogen (N-NH4+) concentration is another indicator the changes of which considerably affect the curse of the anaerobic digestion process. Changes in the N-NH4+ for all the analyzed series are presented in Figure 3a–c. The analysis of the source of points in Figure 3a–c shows that the most intensive (from 2.9- to 5.1-fold) increase in the concentration of N-NH4+ in each of the conducted series was observed between the first and the third day of the anaerobic digestion process. During the period, N-NH4+concentration increased from approximately 200 mg/L to even 892 mg/L. On the subsequent days of the anaerobic digestion process, N-NH4+ concentration gradually increased, adopting maximum values of 997 mg/L (AD2-S1; Figure 3a); 1180 mg/L (AD1 and AD2 -S2; Figure 3b) and 1180 mg/L (AD1-S3; Figure 3c), respectively. According to Appels et al. [22], the concentration of N-NH4+ below 2500 mg/L has no negative effect on the anaerobic digestion process. In all the conducted series, the concentration of N-NH4+ did not exceed 1180 mg/L. Therefore, it can be considered as a factor that does not inhibit the course of the anaerobic digestion process.

3.2.2. Impact of Hydrodynamic Cavitation on Biogas and Methane Accumulation

Changes in the curves of biogas accumulation and the percentage of the content of methane in biogas obtained in all the performed series are presented in Figure 4a–c. Figure 4a shows the accumulation of biogas and percentage of methane in biogas obtained in S1. The obtained accumulation was comparable in both digesters (AD1-S1 and AD2-S2), and after 23 days it was approximately 350 L. The percentage of methane content was also at a very similar level, and from the ninth day of the process it stayed in the range from 60% to 80%. No significant increase in methane production could result from too low EL, at which the HC process was carried out.
Significant differences in the operation of digesters with or without disintegration were recorded when the disintegration process was performed at the EL of 140 kJ/L (Figure 4b) and 210 kJ/L (Figure 4c). The results analysis of S2 shows that the accumulation of biogas in AD1-S2 was 168 L, which represented a value 39% higher in comparison to AD2-S2, where the accumulation of biogas was only 121 L. The percentage of the content of methane in AD1 was also higher than in AD2. A considerable difference in the content of methane was observed from the beginning of the anaerobic digestion process. For the anaerobic digester without disintegration (AD2-S2), the percentage of the content of methane never reached 60%. For the digester with disintegration (AD1-S2), from the 14th day of the process, it was in the range from 60% to 80%. It should be noted that, from the 11th day of the anaerobic digestion process, the percentage of the content of methane was two times higher in AD1-S2 than in AD2-S2, which suggests inhibition of the anaerobic digestion process in AD2-S2. The inhibition of the anaerobic digestion process could have been determined by the recorded high concentration of VFA of approximately 8000 mg/L on the 11th day, maintained at a high level (approximately 10,000 mg/L), until the end of the observation (Figure 2b). Moreover, in AD2-S2, from the 11th day, a high (above 0.3) value of the VFA/A ratio was observed, which also could have disturbed the course of the anaerobic digestion process (Table 3). Another possible explanation for a greater production of biogas obtained in AD1-S2, in comparison to control anaerobic digester, seems to be an increase in the susceptibility of substrate to the anaerobic digestion process due to the disintegration process. Performing the HC process caused a change in the structure of TES, increasing the accessibility of organic compounds contained in the sludge for methanogenic bacteria, and therefore resulting in a greater amount of generated biogas in the anaerobic digestion process. From the 22nd day of the observation, in both digesters, stabilization of the process was observed, as suggested by evident flattening of the accumulation curves. The percentage of the content of methane was also maintained at a constant level of approximately 70% and 50%, respectively, for AD1-S2 and AD2-S2.
In the case of S3, the accumulation of biogas in the anaerobic digester with introduced TES with disintegrated sludge (AD1-S3) was 52% higher in comparison to the control digester (AD2-S3). A considerable difference in the operation of the digesters was observed from the beginning of the experiment. The observations suggest that HC at EL = 210 kJ/L resulted in an increase in the accessibility of organic compounds (dissolved organic compounds were released from activated sludge flocs, and the structure of the solid phase of TES changed) for methanogenic bacteria, which permitted obtaining the highest efficiency of biogas production. In spite of the considerable difference between the digester fed with disintegrated sludge and control digester in the amount of produced biogas, the percent content of methane was at a similar level. From the 10th day until the end of the anaerobic digestion process, the percent content of methane in biogas in both digesters varied from 60% to 80%.
It is also worth emphasizing that HC at EL = 210 kJ/L most probably enabled the release of intracellular compounds from activated sludge flocs, and at EL = 140 kJ/L, they were primarily extracellular compounds. Such a hypothesis is supported by the values of the ADOUR presented in Table 2. When energy density of HC reached 210 kJ/L, a rapid 89% decrease in the activity of aerobic microorganisms was observed (ADOUR = (−89%)), suggesting very high deactivation of microorganisms inhabiting activated sludge flocs. Such considerable deactivation of microorganisms probably resulted from damage to cells resulting from disintegration, which suggests that a part of the released organic substances originated from the intracellular structures. In the case of the disintegration process at EL= 140 kJ/L, the degree of deactivation of microorganisms present in TES was only 4%, which suggests that the released organic compounds primarily originated from extracellular structures.

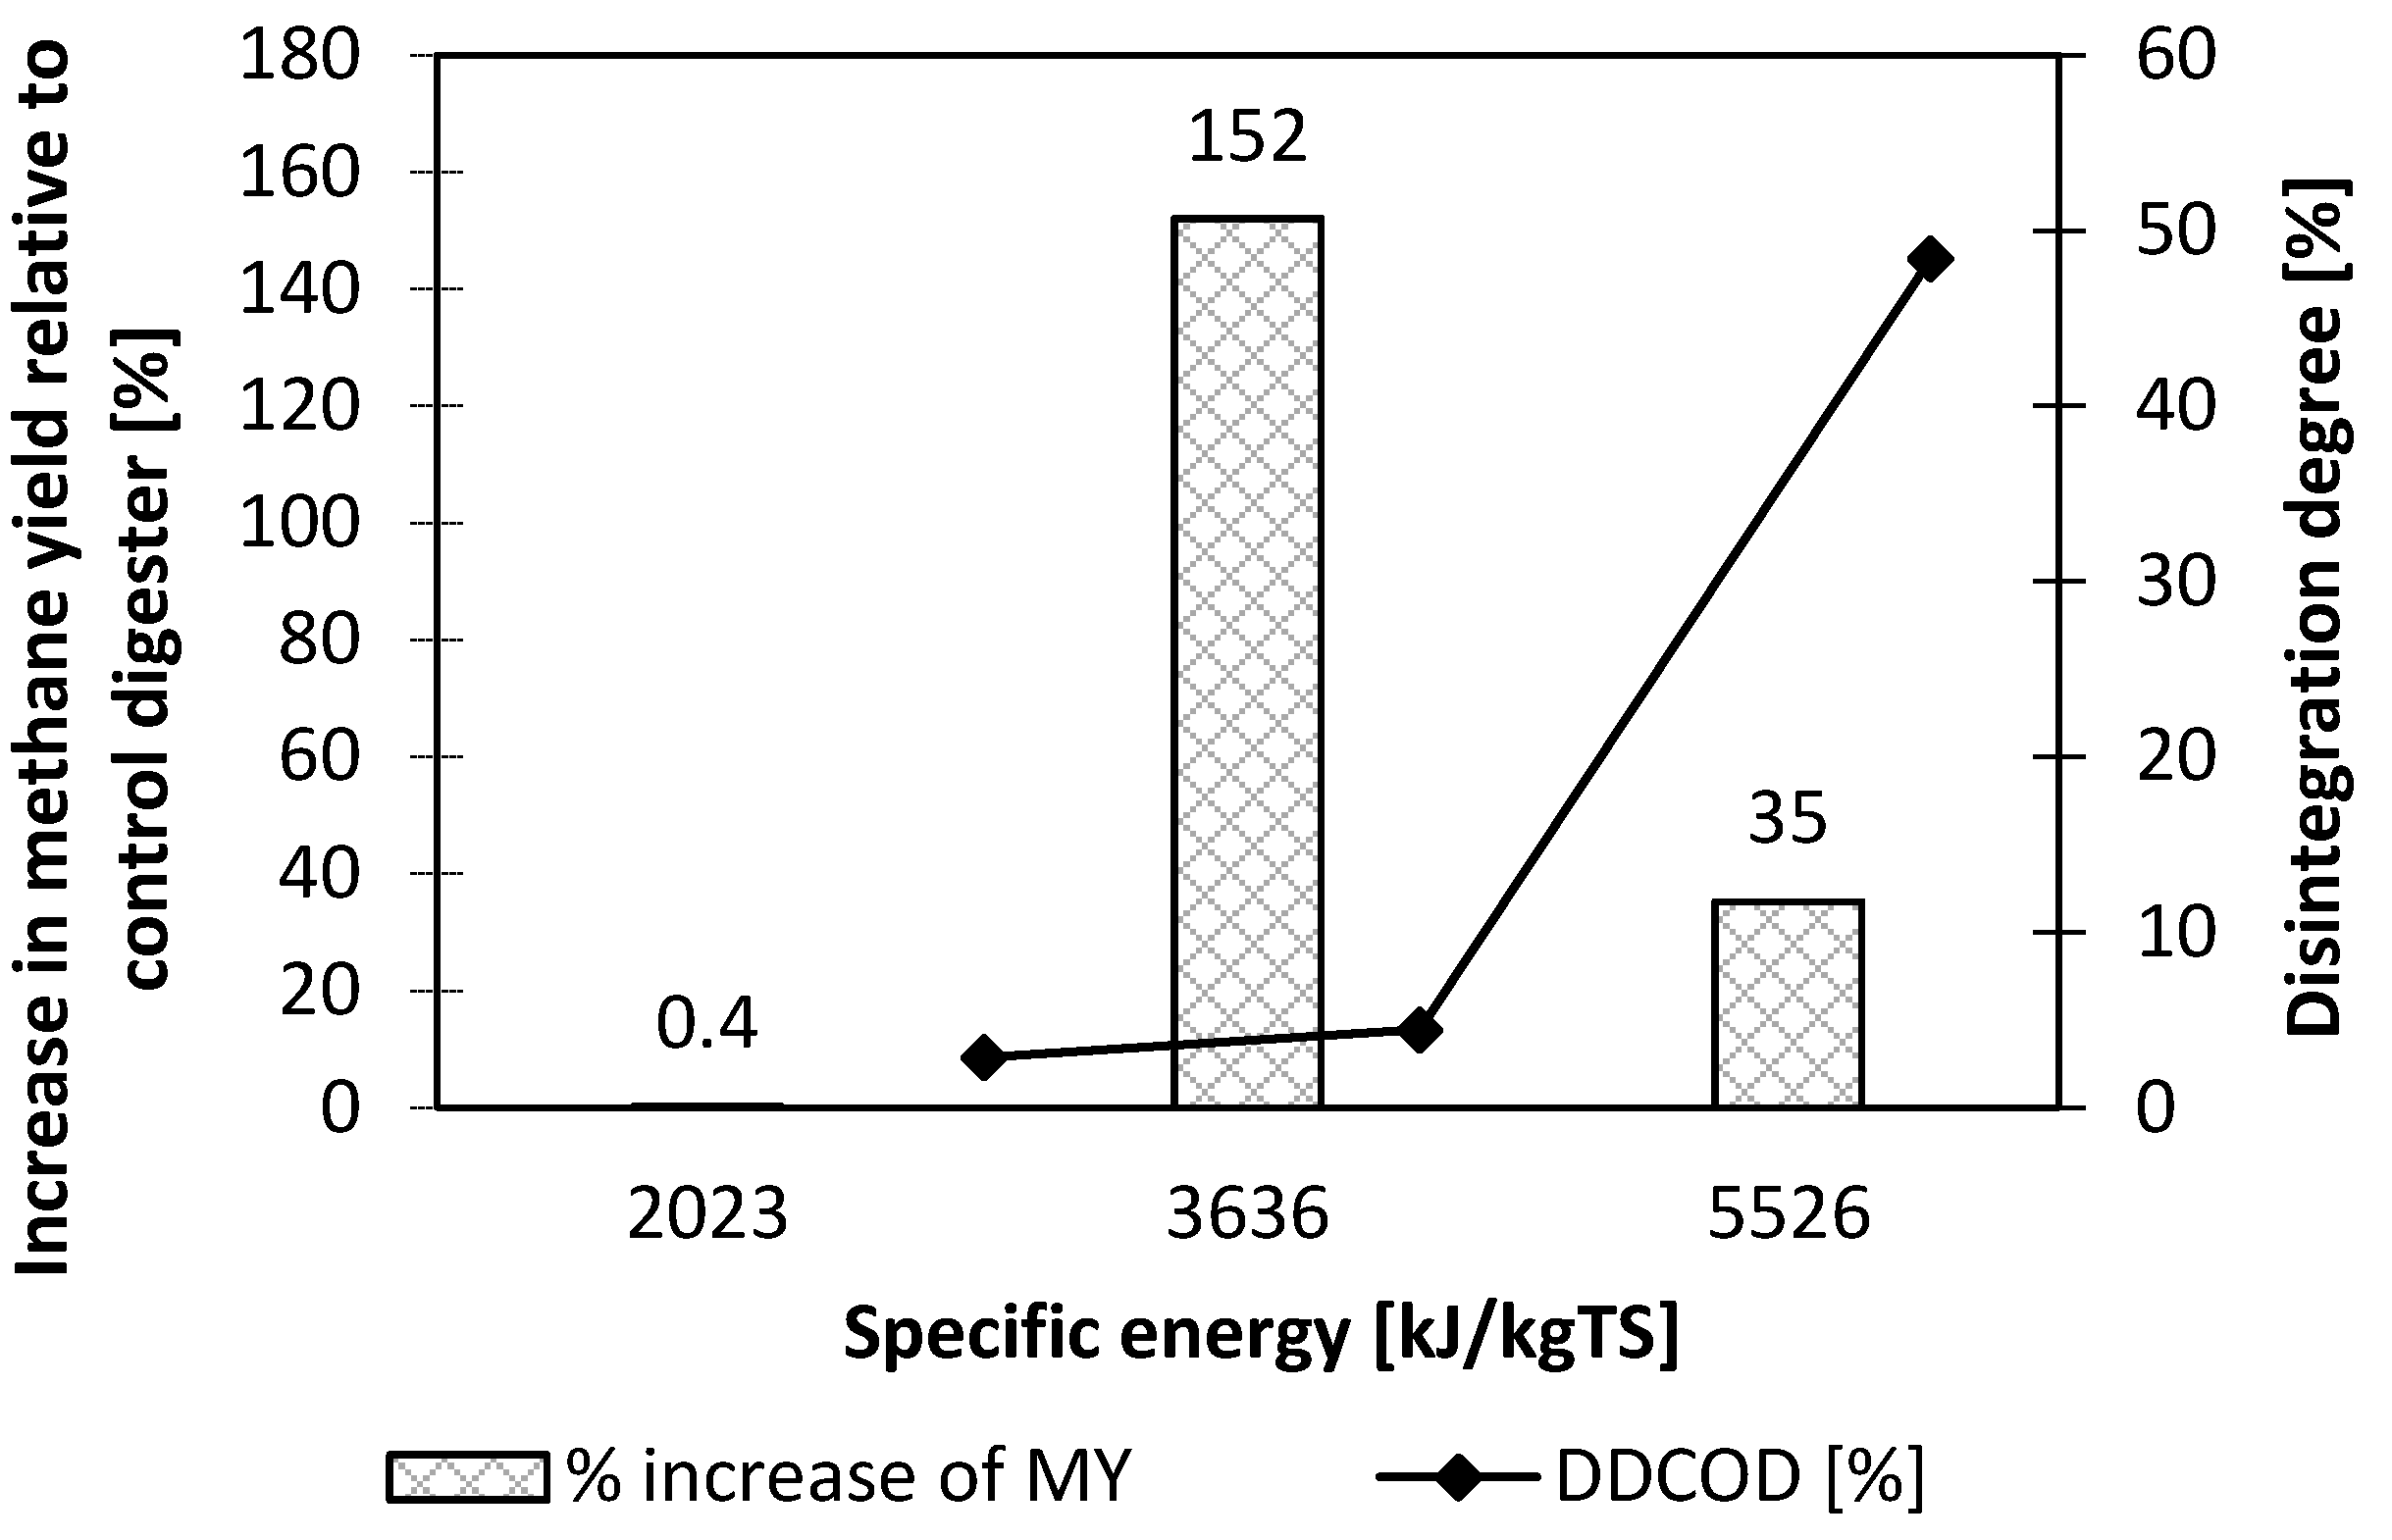
3.2.3. Impact of Hydrodynamic Cavitation on Biogas and Methane Yield

The basic indicators for the assessment of the efficiency of the anaerobic digestion process is biogas yield (BY) and methane yield (MY). Values of the BY and MY obtained in all the performed series are presented in Table 4. The analysis of BY values for all the performed series showed that in the case of series 1, for both digesters (AD1-S1 and AD2-S1), very similar values of BY were obtained (the percentage difference was only 2.0%). However, in the case of S2 and S3, BY values obtained in AD1 (TES subject to the HC process) were as much as 37% and 53% higher, respectively, in contrast to AD2. For example, Lizama et al. [26] subjecting waste activated sludge to ultrasounds obtained a 31% increase in BY. It should be emphasized, however, that the increase was obtained for ES = 35,000 kJ/kgTS, which constituted a value 9.6 times higher than the value of the parameter for series 2 in this study.
The analysis of MY values shows that in series 1, analogically as for BY, for both digesters, the value of this indicator was very similar, and the percentage difference was only 0.4%. In the case of S2 and S3 in AD1, the values of MY were significantly higher (152% and 35%) than in AD2 (which was a reference point), which is also a trend analogical to that observed for BY. An increase in MY recorded in series 2, however, was considerably higher than the increase in BY for the series. It resulted from an increase in the contribution of methane in the produced biogas, mentioned in Section 3.2.2. (AD1-S2). Referring the percent increase in MY to the value of ES and DDCOD (Figure 5, Table 4) shows no linear correlation between the indicators, which seems to be an interesting finding considering the fact that an increase in energy input in the disintegration process was accompanied by an increase in the content of organic compounds expressed by SCOD and VFA in TES, i.e., methanogenic bacteria had potentially more available substrate for the production of methane (Table 2). Similar observations were reported by another group of scientists who recorded an increase in MY for low (200 kJ/kgTS) and high (ES = 2000 kJ/kgTS) values of specific energy in their research without recording an increase in MY for intermediate values of the indicator [27]. According to the data presented in Table 4 and in Figure 5, the maximum increase in MY was obtained when TES was subject to pre-treatment at 140 kJ/L (corresponding to ES = 3636 kJ/kgTS). At such parameters of the disintegration process, a relatively low disintegration degree was recorded (4.5%), and only an inconsiderable deactivation of microorganisms inhabiting activated sludge flocs was observed, which could already suggest that disintegration mainly caused sludge floc deagglomeration, and the release of organic compounds constituting building material of extracellular substances to the sludge liquid. The changes that occurred in TES, increased the biological accessibility of organic matter for methanogenic bacteria, which allowed to obtain a high increase in MY, were equal to as much as 152%. Significant improvement in MY due to various pre-treatment methods has been reported by several researchers [10,28,29]. For example, Peng et al. [10] analyzing the effect of combined treatment of excess sewage sludge (treatment conditions were a microwave energy input of 20 MJ/kgTS and sodium citrate concentration of 0.11 g/gTS), recorded a 147.7% increase in MY. The recorded increase, however, was obtained at a considerably higher (5.5-fold) value of Es in comparison to that in this study. Data presented in Table 4 and in Figure 5 also show that an increase in EL for the disintegration process to 210kJ/L (corresponding to ES = 5526 kJ/kgTS) did not cause a higher percentage increase in MY, in comparison to that obtained for energy density of 140 kJ/L. It is also worth emphasizing that, in series 3, a considerable (11-fold) increase in the value of DDCOD was recorded, in comparison to the value of the indicator recorded in S2, which suggested that the HC process allowed for the release of a considerably higher amount of organic matter from activated sludge flocs. This was not reflected in the percentage increase in MY; however, that was equal to only 35% for this series (S3). This could have been caused by the phenomenon described by Zeynali et al. [29], involving a slowing down of the reaction’s kinetics, and a decrease in the efficiency of methane production, caused by the augmentation of larger particles and a gradual increase in mean particle diameters. By applying ultrasonic treatment to fruit and vegetable waste, the authors obtained the maximum 80% increase in MY for ES = 2380 kJ/kgTS, and by increasing specific energy to 3560 kJ/kgTS, they recorded a 63% lower increase in the indicator. According to Lippert et al. [11], a similar phenomenon occurs in disintegrated excess sludge. As a result of the release of intercellular substances fulfilling the function of biopolymeric flocculants from sludge flocs, the biological accessibility of organic matter contained in the sludge decreases, consequently reducing the production of methane. The percentage increase in methane production recorded in series 3 (by 35%) can be compared to results obtained by Gil et al. [30] and Zhen et al. [31]. The cited authors obtained a 20% increase in the value of MY, in comparison to a control sample, by applying microwave pre-treatment and combined electrical-alkali pre-treatment (electrical voltage = 5 V and pH = 9.2), respectively.
The last aspect worth highlighting is the net energy value, which takes into account the energy expenditure on pre-treatment, which in this case was HC carried out at different levels of EL i.e., 70, 140 and 210 kJ/L, and the amount of energy obtained from the additionally produced methane. For this purpose, an energy balance was made, which is presented in Table 5 (the calculations refer solely S2 and S3, for which an increase in methane production was obtained). The analysis of the data shows that the energy input for pre-treatment exceeded the amount of energy additionally produced from methane. No positive net energy gain was recorded neither for HC at EL of 140 kJ/L, nor at 210 kJ/L (Table 5). However, it should be noted that the net energy gain depends not only on the percentage increase in methane produced by TES pre-treatment, but also on its absolute value. For S2, where HC was carried out at EL = 140 kJ/L, the absolute value of methane produced was significantly lower than in S1 (AD1-S1 = 200 L; AD2-S1 = 198 L) and S3 (AD1-S3 = 174 L; AD2-S3 = 130 L) and was 103 and 39 L for AD1-S2 and AD2-S2, respectively, most likely due to the inhibition of anaerobic digestion process caused by high VFA concentrations (which is discussed in Section 3.2.1). Assuming that the absolute value of methane produced in S2 would be the same as in S1 or S3, a 67% and 102% increase in methane production would allow a positive energy balance (the percentage increase in methane production recorded in S2 was 164%). In order to confirm the possibility of obtaining a positive energy balance, further research will be carried out. In this research the working of the system will simulate the actual operation of the digester in the WWTP (i.e., the dosing and removal of sludge will take place every day of anerobic digestion process). Taking into account the results obtained in this experiment, the HC process will be conducted at EL = 140 kJ/L.

4. Conclusions

The outcomes of this study proved that an important parameter determining the possibility of obtaining an increase in methane production in the anaerobic digestion process is the value of energy input in the HC process (defined as EL or ES). This parameter determines changes occurring in sludge as a result of disintegration (i.e., sludge floc deagglomeration, lysis of cells, re-flocculation process, and the related release of compounds susceptible to biodegradation from sludge flocs).
The maximum increase in MY of 152% was obtained for EL = 140 kJ/L (corresponding to ES = 3636 kJ/kgTS). In this case, HC mainly caused sludge floc deagglomeration.
An increase in MY was also recorded when TES was subject to the HC process at EL = 210 kJ/L (Es = 5526 kJ/kgTS). It was 4.3 times lower than that observed for EL = 140 kJ/L, however. This was highly probably caused by the process of re-flocculation of disintegrated sludge particles (resulting in the lower biological accessibility of organic matter contained in sludge).
Pre-treatment of TES at EL = 70 kJ/L (Es = 2023 kJ/kgTS) did not contribute to methane production enhancement. The amount of produced biogas/methane in the samples with and without pre-treatment was comparable in such a case.
In summary, for the purpose of increasing biogas production, it would be justified to apply pre-treatment of TES before digestors, namely the HC process at the EL = 140 kJ/L. When considering the application of the process in the technical scale, it is also worth taking into consideration additional benefits, namely: (i) an increase in the susceptibility of sludge to dewatering; (ii) a reduction of the costs of management of sludge due to increased VS reduction; (iii) a reduction of mixing energy consumption, as a result of lower viscosity of sludge hydrodynamic cavitation.

Author Contributions

Conceptualization, A.G. and M.Z.-S.; Methodology, A.G., M.Z.-S., O.R., J.P.; Validation, A.G., M.Z.-S., K.U., O.R.; Formal Analysis, A.G. and O.R.; Investigation, A.G., K.U., O.R.; Resources, M.Z.-S. and A.C.; Writing–Original Draft Preparation, A.G.; Writing–Review&Editing, M.Z-S. and K.U.; Visualization, A.G.; Supervision, M.Z.-S. and A.G.; Project Administration, M.Z.-S. and J.P.; Funding Acquisition, M.Z.-S. and A.C. All authors have read and agreed to the published version of the manuscript.

Funding

The research was co-financed from the resources of the Municipal Water Supply and Sewerage Company in Warsaw JSC.

Conflicts of Interest

The authors declare no conflict of interest.

References

  1. Journal of Laws of the Republic of Poland. Regulation of the Minister of Economy of 16 July 2015 on Allowing Waste to be Stored on Landfills; item 1277; Journal of Laws of the Republic of Poland: Warszawa, Poland, 2015. Available online: http://prawo.sejm.gov.pl/isap.nsf/DocDetails.xsp?id=WDU20150001277 (accessed on 13 May 2020). (In Polish)
  2. Central Statistical Office of Poland. Environment 2018, Statistical Information and Elaborations; Central Statistical Office of Poland: Warszawa, Poland, 2018. Available online: https://stat.gov.pl/obszary-tematyczne/srodowiskoenergia/srodowisko/ochrona-srodowiska-2018,1,19.html (accessed on 13 May 2020). (In Polish)
  3. Polish National Waste Management Plan 2022. Polish Monitor, item 784; 11 August 2015. Available online: http://prawo.sejm.gov.pl/isap.nsf/DocDetails.xsp?id=WDU20150001277 (accessed on 13 May 2020). (In Polish)
  4. Zielewicz, E. Dezintegracja ultradźwiękowa i hybrydowa osadu nadmiernego; Termiczna mineralizacja osadu ściekowego. In Proceedings of the V Konferencja naukowo-techniczna, Nowogród k. Łomży, Poland, 3–5 September 2008; Seidel-Przywecki: Warszawa, Poland, 2008. (In Polish). [Google Scholar]
  5. Lee, I.; Han, J.I. The effects of waste-activated sludge pretreatment using hydrodynamic cavitation for methane production. Ultrason. Sonochem. 2013, 20, 1450–1455. [Google Scholar] [CrossRef]
  6. Petkovšek, M.; Mlakar, M.; Levstek, M.; Stražar, M.; Širok, B.; Dular, M. A novel rotation generator of hydrodynamic cavitation for waste activated sludge disintegration. Ultrason. Sonochem. 2015, 26, 408–414. [Google Scholar] [CrossRef]
  7. Zhao, H.; Zhang, P.; Zhang, G.; Cheng, R. Enhancement of ultrasonic disintegration of sewage sludge by aeration. J. Environ. Sci. 2016, 42, 163–167. [Google Scholar] [CrossRef]
  8. Jung, K.W.; Hwang, M.J.; Yun, Y.M.; Cha, M.J.; Ahn, K.H. Development of a novel electric field-assisted modified hydrodynamic cavitation system for disintegration of waste activated sludge. Ultrason. Sonochem. 2014, 21, 1635–1640. [Google Scholar] [CrossRef]
  9. Patil, P.N.; Gogate, P.R.; Csoka, L.; Dregelyi-Kiss, A.; Horvath, M. Intensification of biogas production using pretreatment based on hydrodynamic cavitation. Ultrason. Sonochem. 2016, 30, 79–86. [Google Scholar] [CrossRef]
  10. Peng, L.; Appels, L.; Su, H. Combining microwave irradiation with sodium citrate addition improves the pre-treatment on anaerobic digestion of excess sewage sludge. J. Environ. Manag. 2018, 213, 271–278. [Google Scholar] [CrossRef]
  11. Lippert, T.; Bandelin, J.; Musch, A.; Drewes, J.E.; Koch, K. Energy-positive sewage sludge pre-treatment with a novel ultrasonic flatbed reactor at low energy input. Bioresour. Technol. 2018, 264, 298–305. [Google Scholar] [CrossRef]
  12. Houtmeyers, S.; Degrève, J.; Willems, K.; Dewil, R.; Appels, L. Comparing the influence of low power ultrasonic and microwave pre-treatments on the solubilisation and semi-continuous anaerobic digestion of waste activated sludge. Bioresour. Technol. 2014, 171, 44–49. [Google Scholar] [CrossRef]
  13. Liu, X.; Xu, Q.; Wang, D.; Zhao, J.; Wu, Y.; Liu, Y.; Yang, Q. Improved methane production from waste activated sludge by combining free ammonia with heat pretreatment: Performance, mechanisms and applications. Bioresour. Technol. 2018, 268, 230–236. [Google Scholar] [CrossRef]
  14. Li, X.; Liu, Y.; Xu, Q.; Liu, X.; Huang, X.; Yang, J.; Yang, Q. Enhanced methane production from waste activated sludge by combining calcium peroxide with ultrasonic: Performance, mechanism, and implication. Bioresour. Technol. 2019, 279, 108–116. [Google Scholar] [CrossRef]
  15. Zielewicz, E. Disintegration of sludge in the context of biogas growth. Gaz Woda i Technika Sanitarna 2016, 90, 69–75. (In Polish) [Google Scholar] [CrossRef]
  16. Zielewicz, E. Disintegration of excess sludge to support the methane fermentation process-theory and practice. Gaz Woda i Technika Sanitarna 2014, 4, 138–143. (In Polish) [Google Scholar]
  17. Zubrowska-Sudol, M.; Walczak, J. Enhancing combined biological nitrogen and phosphorus removal from wastewater by applying mechanically disintegrated excess sludge. Water Res. 2015, 76, 10–18. [Google Scholar] [CrossRef]
  18. Zubrowska-Sudol, M.; Walczak, J. Effects of mechanical disintegration of activated sludge on the activity of nitrifying and denitrifying bacteria and phosphorus accumulating organisms. Water Res. 2014, 61, 200–209. [Google Scholar] [CrossRef]
  19. Nickle, K.; Neis, U. Ultrasonic disintegration of biosolids for improved biodegradation. Ultrason. Sonochem. 2007, 14, 450–455. [Google Scholar] [CrossRef]
  20. Standard Methods for the Examination of Water and Wastewater; American Public Health Association/American Water Works Association/Water Environment Federation: Washington DC, USA, 1998.
  21. Wang, F.; Wang, Y.; Ji, M. Mechanisms and kinetics models for ultrasonic waste activated sludge disintegration. J. Hazard. Mater. 2005, 123, 145–150. [Google Scholar] [CrossRef]
  22. Appels, L.; Baeyens, J.; Degrève, J.; Dewil, R. Principles and potential of the anaerobic digestion of waste-activated sludge. Prog. Energy Combust. Sci. 2008, 34, 755–781. [Google Scholar] [CrossRef]
  23. Luste, S.; Luostarinen, S. Anaerobic co–digestion of meat–processing by–products and sewage sludge–effect of higienization and organic loading rate. Bioresour. Technol. 2010, 101, 2657–2664. [Google Scholar] [CrossRef]
  24. Montusiewicz, A. Współfermentacja Osadów ściekowych i Wybranych kosubstratów Jako Metoda Efektywnej Biometanizacji; Monografie Komitetu Inżynierii Środowiska PAN: Lublin, Poland, 2012; Volume 98. (In Polish) [Google Scholar]
  25. Bień, J.; Wystalska, K. Osady ściekowe. Teoria i praktyka; Wydawnictwo Politechniki Częstochowskiej: Częstochowa, Poland, 2011. (In Polish) [Google Scholar]
  26. Lizama, A.C.; Figueiras, C.C.; Herrera, R.R.; Pedreguera, A.Z.; Espinoza, J.E.R. Effects of ultrasonic pretreatment on the solubilization and kinetic study of biogas production from anaerobic digestion of waste activated sludge. Int. Biodeterior. Biodegrad. 2017, 123, 1–9. [Google Scholar] [CrossRef]
  27. Koch, K.; Lippert, T.; Drewes, J.E. The role of inoculum’s origin on the methane yield of different substrates in biochemical methane potential (BMP) tests. Bioresour. Technol. 2017, 243, 457–463. [Google Scholar] [CrossRef]
  28. Rani, R.U.; Kumar, S.A.; Kaliappan, S.; Yeom, I.; Banu, J.R. Impacts of microwave pretreatments on the semi-continuous anaerobic digestion of dairy waste activated sludge. Waste Manag. 2013, 33, 1119–1127. [Google Scholar] [CrossRef]
  29. Zeynali, R.; Khojastehpour, M.; Ebrahiminik, M. Effect of ultrasonic pre-treatment on biogas yield and specific energy in anaerobic digestion of fruit and vegetable wholesale market wastes. Sustain. Environ. Res. 2017, 27, 259–264. [Google Scholar] [CrossRef]
  30. Gil, A.; Siles, J.A.; Martín, M.A.; Chica, A.F.; Estévez-Pastor, F.S.; Toro-Baptista, E. Effect of microwave pretreatment on semi-continuous anaerobic digestion of sewage sludge. Renew. Energy 2018, 115, 917–925. [Google Scholar] [CrossRef]
  31. Zhen, G.; Lu, X.; Li, Y.Y.; Zhao, Y. Combined electrical-alkali pretreatment to increase the anaerobic hydrolysis rate of waste activated sludge during anaerobic digestion. Appl. Energy 2014, 128, 93–102. [Google Scholar] [CrossRef]
Figure 1. (a) Anaerobic digesters used in the experiment. (b) Diagram of setup of an anaerobic digester (Legend: 1—digester; 2—temperature gauge; 3—pump; 4—inflow and outflow of liquid from the thermostat; 5—gas gauge; 6—manometer).
Energies 13 02483 g001
Figure 2. Changes in the concentration of volatile fatty acids (VFA) during the anaerobic digestion process. (a) Series 1 (b) Series 2 (c) Series 3.
Energies 13 02483 g002
Figure 3. Changes in the concentration of N-NH4+ during the anaerobic digestion process. (a) Series 1, (b) Series 2, (c) Series 3.
Energies 13 02483 g003
Figure 4. Biogas accumulation and percentage of methane in biogas. (a) Series 1, (b) Series 2, (c) Series 3.
Energies 13 02483 g004
Figure 5. Percentage increase in methane yield in relation to specific energy and disintegration degree.
Energies 13 02483 g005
Table 1. Characteristics of investigated sludge types and operational parameters of anaerobic digesters.
IndicatorsUnitTPS 2TES 3DS 4
Total solids 1[g/L]50.4–64.434.6–39.726.5–28.9
Volatile solids 1[g/L]41.0–50.924.3–29.816.5–19.1
SCOD 1[mg/L]3420–3925117–261288–421
VFA 1[mg/L]1215–242226–3136–55
HRT 1[d]--22–26
Digester temperature [°C]--36
1 minimum and maximum value; 2. TPS—thickened primary sludge; 3. TES—thickened excess sludge; 4. DS—digested sludge.
Table 2. Changes in the characteristics of thickened excess sludge (TES) depending on the energy density used in the disintegration process.
IndicatorsUnitSeries 1Series 2Series 3
Raw TES 1Dez.70 kJ/L 2Raw TES1Dez.140 kJ/L 3Raw TES 1Dez.210 kJ/L 4
SCOD[mg/L]15545511717552615810
VFA[mg/L]2810331282261418
pH[-]7.77.68.88.08.36.8
DDCOD[%]-1.4-4.5-48
ADOUR[%]-10-−4.0-−89
1 Raw TES–TES before disintegration; 2 Dez.70 kJ/L-TES after disintegration conducted at energy density equal 70 kJ/L; 3 Dez.140 kJ/L-TES after disintegration conducted at energy density equal 140 kJ/L; 4 Dez.210 kJ/L-TES after disintegration conducted at energy density equal 210 kJ/L.
Table 3. Changes in the VFA concentration to alkalinity (A) (VFA/A) ratio during the anaerobic digestion process.
SeriesTime of Anaerobic Digestion Process [days]
1357911131517192123252730
S1 1AD10.50.90.70.50.50.40.30.20.20.10.10.0---
AD20.50.50.70.60.50.40.20.20.10.10.10.0---
S2 1AD10.20.30.60.70.80.70.60.50.30.30.20.20.20.20.2
AD20.10.20.30.30.30.40.50.50.60.60.60.50.50.50.5
S3 1AD10.10.40.70.80.80.60.60.50.50.50.50.50.40.3 -
AD20.10.30.50.60.50.40.40.20.20.10.10.10.00.0-
1 the grey scale depends on the VFA/A ratio: < 0.3 colorless; 0.3 < 0.6 light grey; 0.6 < dark grey.
Table 4. Changes in biogas yield and methane yield.
IndicatorsUnitAD1-S1AD2-S1AD1-S2AD2-S2AD1-S3AD2-S3
EL = 70 kJ/L-EL = 140 kJ/L-EL = 210 kJ/L-
biogas yield[L/gVSfed]0.4770.4680.1940.1420.4390.287
increase of BY relative to control digester[%]2.03753
methane yield [L/gVSfed]0.2730.2720.1260.0500.2180.161
increase of MY relative to control digester[%]0.415235
Table 5. Energy balance.
ParametersUnitAD1-S2AD1-S3
EL = 140 kJ/LEL = 210 kJ/L
Increase in methane production[m3]0.0630.044
Energy content of extra methane1[KWh]0.2530.176
Energy applied[KWh]0.5290.758
Net energy production[KWh]−0.276−0.582
1 Energy content of extra methane calculated by assuming: methane calorific value = 36 MJ/m3 and electrical efficiency of engine = 40%.

