Determination of Electricity Demand by Personal Light Electric Vehicles (PLEVs): An Example of e-Motor Scooters in the Context of Large City Management in Poland


Abstract
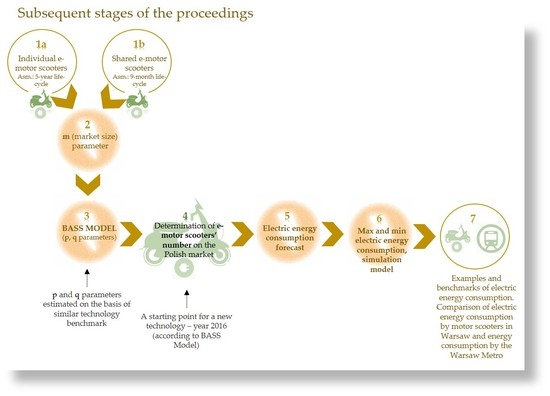
:
1. Introduction
2. Materials and Methods
2.1. State of Art
2.2. Choice of Bass Diffusion Model
- a deterministic model—in the form of differential equations: the Hudson model, where the increase in the number of innovation users is proportional to the current number of opponents; the Mansfield model, based on the dynamics underlying the epidemic theories; the Davies model, taking into account differences between the profitability of individual companies in the innovation process; or the Bass model, taking into consideration innovators and imitators;
- a stochastic model—based on the probability theory, where most often particular states are defined (supporter and opponent of a given innovation);
- a wave model—with innovation spreading in time and space.
3. Results
3.1. Estimation of Bass Model Parameters
3.2. Electricity Consumption
4. Discussion
5. Conclusions
Author Contributions
Funding
Conflicts of Interest
Appendix A
Appendix B
Appendix C

| Coefficient | Estimate | Standard Error | t-Statistic | p-Value |
|---|---|---|---|---|
| p | 0.0000470316 | 9.46859 × 10⁻⁶ | 4.96712 | 0.000423984 |
| q | 0.333405 | 0.0267948 | 12.4429 | 8.00797 × 10⁻⁸ |
Appendix D
| Source | p Monthly | q Monthly | p Yearly | q Yearly |
|---|---|---|---|---|
| [49] Shoemaker (original) | 0.00776 | 0.0391 | 0.09312 1 | 0.4692 1 |
| [48]. Massiani and Gohs | 0.000677 2 | 0.0386 2 | 0.008124 | 0.4632 |
| [80] Wolken et al. | 0.000677 2 | 0.0386 2 | 0.008124 | 0.4632 |
| [44] Redondo and Cagigas | 0.000583 2 | 0.0325 2 | 0.007 2 | 0.39 |
References
- UN Habitat, 2019. Available online: http://open.unhabitat.org/ (accessed on 14 July 2019).
- IEA. World Energy Outlook 2010; International Energy Agency: Paris, France, 2010. [Google Scholar]
- PricewaterhouseCoopers Report. The Sharing Economy: How is it Affecting You and Your Business? 2014. Available online: https://pwc.blogs.com/files/sharing-economy-final_0814.pdf (accessed on 20 August 2019).
- Light Electric Vehicle Association (LEVA). Available online: http://extraenergy.org/main.php?language=es&category=information&subcateg=99&id=2285 (accessed on 16 August 2019).
- Raport Transport Sharing w Polsce, 2019. Available online: https://www.dataart.com.pl/media/2827504/transportsharing-2019.pdf (accessed on 17 August 2019).
- Allegrini, J.; Orehounig, K.; Mavromatidis, G.; Ruesch, F.; Dorer, V.; Evins, R. A review of modelling approaches and tools for the simulation of district-scale energy systems. Renew. Sustain. Energy Rev. 2015, 52, 1391–1404. [Google Scholar] [CrossRef]
- Bunn, D.W.; Gianfreda, A.; Kermer, S. A Trading-Based Evaluation of Density Forecasts in a Real-Time Electricity Market. Energies 2018, 11, 2658. [Google Scholar] [CrossRef] [Green Version]
- Manfren, M.; Caputo, P.; Costa, G. Paradigm shift in urban energy systems through distributed generation. Appl. Energy 2011, 88, 1032–1048. [Google Scholar] [CrossRef]
- Uniejewski, B.; Marcjasz, G.; Weron, R. On the importance of the long-term seasonal component in day-ahead electricity price forecasting. Part II—Probabilistic forecasting. Energy Econ. 2019, 79, 171–182. [Google Scholar] [CrossRef] [Green Version]
- Hardt, C.; Bogenberger, K. Usability of eScooters in Urban Environments—A Pilot Study. In Proceedings of the Conference: 28th IEEE Intelligent Vehicles Symposium (IV), Redondo Beach, CA, USA, 11–14 June 2017; pp. 1650–1657. [Google Scholar]
- Nocerino, R.; Colorni, A.; Lia, F.; Luè, A. E-Bikes and E-Scooters for Smart Logistics: Environmental and Economic Sustainability in Pro-E-Bike Italian Pilots. In Transportation Research Procedia, Proceedings of the Conference: 6th Transport Research Arena (TRA), Warsaw, Poland, 18–21 April 2016; Elsevier: Amsterdam, The Netherlands, 2016; pp. 2362–2371. [Google Scholar]
- Seebauer, S. Why early adopters engage in interpersonal diffusion of technological innovations: An empirical study on electric bicycles and electric scooters. Transp. Res. Part A Policy Pr. 2015, 78, 146–160. [Google Scholar] [CrossRef]
- Xu, J.; Shang, S.; Yu, G.; Qi, H.; Wang, Y.; Xu, S. Are electric self-balancing scooters safe in vehicle crash accidents? Accid. Anal. Prev. 2016, 87, 102–116. [Google Scholar] [CrossRef] [PubMed]
- Chi, C.-F.; Chen, P.-L.; Saleh, W.; Tsai, S.-H.; Pai, C.-W. Helmet non-use by users of bikeshare programs, electric bicycles, racing bicycles, and personal bicycles: An observational study in Taipei. Int. J. Sustain. Transp. 2019, 13, 93–99. [Google Scholar] [CrossRef]
- Santucci, M.; Pieve, M.; Pierini, M. Electric L-Category Vehicles for Smart Urban Mobility. In Transportation Research Procedia, Proceedings of the Conference: 6th Transport Research Arena (TRA), Warsaw, Poland, 18–21 April 2016; Elsevier: Amsterdam, The Netherlands, 2016; Volume 14, pp. 3651–3660. [Google Scholar]
- Salmeron-Manzano, E.; Manzano-Agugliaro, F. The electric bicycle: Worldwide research trends. Energies 2018, 11, 1894. [Google Scholar] [CrossRef] [Green Version]
- Bosetti, V.; Longden, T. Light duty vehicle transportation and global climate policy: The importance of electric drive vehicles. Energy Policy 2013, 58, 209–219. [Google Scholar] [CrossRef] [Green Version]
- Morales Betancourt, R.; Galvis, B.; Rincón-Riveros, J.M.; Rodriguez-Valencia, A.; Sarmiento, O.L. Personal exposure to air pollutants in a Bus Rapid Transit System: Impact of fleet age and emission standard. Atmos. Environ. 2019, 202, 117–127. [Google Scholar] [CrossRef]
- Canizes, B.; Soares, J.; Costa, A.; Pinto, T.; Lezama, F.; Novais, P.; Vale, Z. Electric Vehicles’ User Charging Behaviour Simulator for a Smart City. Energies 2019, 12, 1470. [Google Scholar] [CrossRef] [Green Version]
- Aymen, F.; Mahmoudi, C. A Novel Energy Optimization Approach for Electrical Vehicles in a Smart City. Energies 2019, 12, 929. [Google Scholar] [CrossRef] [Green Version]
- Zhang, Y.; Aliya, B.; Zhou, Y.; You, I.; Zhang, X.; Pau, G.; Collotta, M. Shortest feasible paths with partial charging for battery-powered electric vehicles in smart cities. Pervasive Mob. Comput. 2018, 50, 82–93. [Google Scholar] [CrossRef]
- Wang, Y.; Ding, W.; Huang, L.; Wei, Z.; Liu, H.; Stankovic, J.A. Toward Urban Electric Taxi Systems in Smart Cities: The Battery Swapping Challenge. IEEE Trans. Veh. Technol. 2018, 67, 1946–1960. [Google Scholar] [CrossRef]
- Shuai, W.; Maille, P.; Pelov, A. Charging Electric Vehicles in the Smart City: A Survey of Economy-Driven Approaches. IEEE Trans. Intell. Transp. Syst. 2016, 17, 2089–2106. [Google Scholar] [CrossRef] [Green Version]
- Navarro, C.; Roca-Riu, M.; Furio, S.; Estrada, M. Designing New Models for Energy Efficiency in Urban Freight Transport for Smart Cities and Its Application to the Spanish Case. In Transportation Research Procedia, Proceedings of the 9th International Conference on City Logistics, Tenerife, Spain, 17–19 June 2015; Elsevier: Amsterdam, The Netherlands, 2016; Volume 12, pp. 314–324. [Google Scholar]
- Chebbi, O.; Nouri, N. Reducing Energy Consumption in Smart Cities: A Scatter Search Based Approach. In Proceedings of the 2016 Genetic and Evolutionary Computation Conference (Gecco’16 Companion), Denver, CO, USA, 20–24 July 2016; pp. 1459–1460. [Google Scholar]
- Hwang, J. Sustainable transport strategy for promoting zero-emission electric scooters in Taiwan. Renew. Sustain. Energy Rev. 2010, 14, 1390–1399. [Google Scholar] [CrossRef]
- Hwang, J.; Chang, W. Life-cycle analysis of greenhouse gas emission and energy efficiency of hydrogen fuel cell scooters. Int. J. Hydrogen Energy 2010, 35, 11947–11956. [Google Scholar] [CrossRef]
- Bishop, J.; Doucette, R.; Robinson, D.; Mills, B.; McCulloch, M. Investigating the technical, economic and environmental performance of electric vehicles in the real-world: A case study using electric scooters. J. Power Sources 2011, 196, 10094–10104. [Google Scholar] [CrossRef]
- Walker, P.; Roser, H. Energy consumption and cost analysis of hybrid electric powertrain configurations for two wheelers. Appl. Energy 2015, 146, 279–287. [Google Scholar] [CrossRef]
- OECD/Eurostat. Oslo Manual 2018: Guidelines for Collecting, Reporting and Using Data on Innovation. In The Measurement of Scientific, Technological and Innovation Activities, 4th ed.; OECD Publishing: Paris, France, 2018. [Google Scholar]
- Lieswyn, J.; Fowler, M.; Koorey, G.; Wilke, A.; Crimp, S. Regulations and safety for electric bicycles and other low-powered vehicles. NZ Transp. Agency Res. Rep. 2017, 621, 182. [Google Scholar]
- Dumaresq S (Segway Inc.). Segway Expands Launch of Its One s1—A Single Wheel, Electric, Self-Balancing Wonder—With Brick and Mortar Retail Rollout. News Release. 2017. Available online: https://www.businesswire.com/news/home/20161205005148/en/Segway-Expands-Launch-S1---Single-Wheel (accessed on 24 August 2019).
- Kot, S.M.; Karska, A.; Zając, K. Matematyczne Modele Procesów Dyfuzji Innowacji; Wydawnictwo Naukowe PWN: Warsaw, Poland, 1993; pp. 96–111. [Google Scholar]
- Meade, N.; Islam, T. Modelling and forecasting the diffusion of innovation—A 25 year review. Int. J. Forecast. 2006, 22, 539–541. [Google Scholar] [CrossRef]
- Bass, F. A new product growth model for consumer durables. Manag. Sci. 1969, 15, 215–227. [Google Scholar] [CrossRef]
- Bauckhage, C.; Kersting, K. Strong Regularities in Growth and Decline of Popularity of Social Media Services. arXiv 2014, 11, 44. [Google Scholar]
- Rogers, E.M. Diffusion of Innovations, 3rd ed.; Free Press of Glencoe: New York, NY, USA, 1983. [Google Scholar]
- Hollister, S.; Holland, P.; Serrels, M.; Little, M. The Electric Scooter War Continues. Here’s How They Work (FAQ). 31 May 2018. Available online: https://www.cnet.com/news/electric-scooters-bikes-dockless-ride-share-bird-lime-jump-spin-scoot/ (accessed on 24 August 2019).
- Population Division. Annual Estimates of the Resident Population for Incorporated Places of 50,000 or More; U.S. Census Bureau: Suitland, MD, USA, 2018.
- World Population Review, Population of All Cities in Poland 2019. Available online: http://worldpopulationreview.com/countries/poland-population/cities/ (accessed on 24 August 2019).
- Białek, J. Wieliczka. Elektryczne Hulajnogi są już w Mieście. Za Chwilę Pojawią się Także Skutery, 2019, September 8. Available online: https://dziennikpolski24.pl/wieliczka-elektryczne-hulajnogi-sa-juz-w-miescie-za-chwile-pojawia-sie-takze-skutery/ar/c1-14360509 (accessed on 24 August 2019).
- Demographic Yearbook of Poland 2017; Central Statistics Office of Poland (GUS): Warsaw, Poland, 2018.
- Area and Population in the Territorial Profile in 2018; Central Statistics Office of Poland (GUS): Warsaw, Poland, 2018.
- Redondo, A.N.; Cagigas, A.P. Sales Forecast of Electric Vehicles. J. Eng. Arch. 2015, 3, 79–88. [Google Scholar] [CrossRef] [Green Version]
- Wong, D.H.; Yap, K.B.; Turner, B.; Rexha, N. Predicting the Diffusion Pattern of Internet-Based Communication Applications Using Bass Model Parameter Estimates for Email. J. Internet Bus. 2011, 9, 38–41. [Google Scholar]
- Wright, M.; Upritchard, C.; Lewis, T. A Validation of the Bass New Product Diffusion Model in New Zealand. Mark. Bull. 1997, 8, 28–29. [Google Scholar]
- Turk, T.; Trkman, P. Bass Model Estimates for Broadband Diffusion in European Countries. Technol. Forecast. Soc. Chang. 2011, 79, 85–96. [Google Scholar] [CrossRef]
- Massiani, J.; Gohs, A. The choice of Bass model coefficients to forecast diffusion for innovative products: An empirical investigation for new automotive technologies. Res. Transp. Econ. 2015, 50, 17–28. [Google Scholar] [CrossRef] [Green Version]
- Shoemaker, M.H. A Bass Diffusion Model Analysis: Understanding Alternative Fuel Vehicle Sales 2012. CMC Sr. Theses 2012, 399. Available online: http://scholarship.claremont.edu/cmc_theses/399 (accessed on 24 August 2019).
- Kijek, A.; Kijek, T. Modelling of innovation diffusion. Oper. Res. Decis. 2010, 3–4, 53–68. [Google Scholar]
- Sultan, F.; Farley, J.U.; Lehmann, D.R. A meta-analysis of diffusion models. J. Mark. Res. 1990, 27, 70–77. [Google Scholar] [CrossRef]
- Jagodziński, J.; Ostrowski, D. Uzasadnienie potrzeby badań nad innowacyjnością w logistyce z wykorzystaniem modeli dyfuzyjnych. Zesz. Nauk. Wyższej Szkoły Bank. We Wrocławiu 2013, 37, 103–122. [Google Scholar]
- Van den Bulte, C. Want to know how diffusion speed varies across countries and products? Try using a Bass model, Technical Report, PDMA VISIONS Making It Work. Glob. NPD 2002, 26, 12–15. [Google Scholar]
- AF Fleet (Electricity) Total Number Alternative Fuels Passenger Cars; European Alternative Fuels Observatory: Brussel, Belgium, 2019.
- Na Progu Przełomu, Report, Współdzielona Mobilność w Polsce 2019. Available online: http://mobilne-miasto.org/wp-content/uploads/2019/07/Raport_Shared_Mobility_2019_PL_maly.pdf (accessed on 24 August 2019).
- Hollingsworth, J.; Copeland, B.; Johnson, J.X. Are e-scooters polluters? The environmental impacts of shared dockless electric scooters. Environ. Res. Lett. 2019, 14, 1–10. [Google Scholar] [CrossRef]
- Confederation of the European Bicycle Industry (CONEBI). European Bicycle Market, 2015 Statistics, Industry&Market Profile, 2016 ed.; CONEBI: Brussel, Belgium, 2016. [Google Scholar]
- Confederation of the European Bicycle Industry (CONEBI). European Bicycle Market, 2016 Statistics, Industry&Market Profile, 2017 ed.; CONEBI: Brussel, Belgium, 2017. [Google Scholar]
- Elektroroller Technische Forschung und Informationsdienste. Available online: http://www.elektroroller-aktuell.com/electric-scooter-cost.html (accessed on 20 August 2019).
- Metro Warszawskie Kupuje Energię na 2018 r. Available online: https://www.transport-publiczny.pl/wiadomosci/metro-warszawskie-kupuje-energie-na-2018-r-56010.html (accessed on 20 August 2019).
- Nowa Miejska Mobilność. Co Oznacza Dla Ubezpieczeń? Available online: https://piu.org.pl/wp-content/uploads/2019/05/PIU-nowa-miejska-mobilnosc.pdf (accessed on 24 August 2019).
- Mediolan Zapłaci Tym, Którzy Przesiądą Się Na Rower. Available online: http://www.miasto2077.pl/mediolan-zaplaci-ktorzy-przesiada-sie-na-rower/ (accessed on 29 August 2019).
- Wykonanie kompleksowych badań ruchu we Wrocławiu i otoczeniu—KBR 2018 raport z realizacji etapu V. Pomiary liczby pasażerów w pojazdach komunikacji zbiorowej. Available online: http://bip.um.wroc.pl/artykul/565/37499/kompleksowe-badania-ruchu-we-wroclawiu-i-otoczeniu-kbr-2018 (accessed on 11 August 2019).
- Kompleksowe Badania Ruchu We Wrocławiu i Otoczeniu 2018. Biuro Zrównoważonej Mobilności. Departament Infrastruktury i Transportu. Available online: http://bip.um.wroc.pl/artykul/565/37499/kompleksowe-badania-ruchu-we-wroclawiu-i-otoczeniu-kbr-2018 (accessed on 12 August 2019).
- Hardt, C.; Bogenberger, K. Usage of e-scooters in Urban Environments. Transp. Res. Procedia 2019, 37, 155–162. [Google Scholar] [CrossRef]
- Hwang, J. Promotional policy for renewable energy development in Taiwan. Renew. Sustain. Energy Rev. 2010, 14, 1079–1087. [Google Scholar] [CrossRef]
- Hsieh, P.Y.; Yu, T.Y.; Wu, K.C.; Chang, L.F.W. Influences and uncertainty of battery-swapping electric scooters on energy system in Taiwan. Energy Procedia 2018, 153, 95–100. [Google Scholar] [CrossRef]
- ENTSO-E Releases Its Vision on Market Design and System Operation towards 2030. Available online: https://www.entsoe.eu/ (accessed on 17 December 2019).
- Energetyka Odchodzi od Węgla. Available online: https://cleanerenergy.pl/2019/08/07/energetyka-odchodzi-od-wegla/ (accessed on 17 December 2019).
- Moore, G.A. Marketing and Selling Disruptive Products to Mainstream Customers. In Crossing the Chasm, 3rd ed.; Harper Collins Publishers: New York, NY, USA, 2014. [Google Scholar]
- Statt, N. Report One Month with a Bird Rental Scooter: Far Worse Than A Bike. Bird’s Monthly Program Sticks You with a Less Capable, More Annoying Scooter. The Verge. Available online: https://www.theverge.com/2019/7/31/20747817/bird-electric-scooter-monthly-rental-san-francisco-bike-app-review (accessed on 31 July 2019).
- Badeau, A.; Carman, C.; Newman, M.; Steenblik, J.; Carlson, M.; Madsen, T. Emergency department visit for electric scooter-related injuries after introduction of an urban rental program. Am. J. Emerg. Med. 2019, 37, 1531–1533. [Google Scholar] [CrossRef]
- Mayhew, L.; Bergin, C. Impact of e-scooter injuries on Emergency Department imaging. J. Med. Imaging Radiat. Oncol. 2019, 63, 461–466. [Google Scholar] [CrossRef] [Green Version]
- Sikka, N.; Vila, C.; Stratton, M.; Ghassemi, M.; Pourmand, A. Sharing the sidewalk: A case of E-scooter related pedestrian injury. Am. J. Emerg. Med. 2019, 37, e5–e1807. [Google Scholar] [CrossRef]
- Sopjani, S.; Janhager Stier, J.; Ritzén, S.; Hesselgren, M.; Georen, P. Involving users and users roles in the transition to sustainable moblity sytems: The case of light electric vehicle sharing in Sweden. Transp. Res. Part D Transp. Environ. 2019, 71, 207–222. [Google Scholar] [CrossRef]
- Aizpuru, M.; Farley, K.X.; Rojas, J.C.; Crawford, R.S.; Moore, T.J., Jr.; Wagner, E.R. Motorized scooters injuries in the area of scooter-shares: A review of the national electronic surveillance system. Am. J. Emerg. Med. 2019, 37, 1133–1138. [Google Scholar] [CrossRef] [PubMed]
- Pula, K.; Shinkle, D. Electric Scooters: Coming Soon to a Street, or Sidewalk, Near You; State Legislatures: Chicago, IL, USA, 2019; Volume 45, p. 2. [Google Scholar]
- Kodeks Drogowy—Prawo o Ruchu Drogowym 2019. Available online: https://prawooruchudrogowym.pl/ (accessed on 4 October 2019).
- Sokele, M.; Moutinho, L. Bass Model with Explanatory Parameters. In Innovative Research Methodologies in Management; Springer: Cham, Switzerland, 2018; pp. 145–164. [Google Scholar]
- Wolken, A.; Smith, M.; Kaye-Blake, W.; Curry, K.; Dickson, M.; Drummond, C.; Thomas, A. Driving change: Technology diffusion in the transport sector. NZ Transp. Agency Res. Rep. 2018, 647, 130. [Google Scholar]
- Gibson, W.H.; Megaw, E.D.; Young, M.S.; Lowe, E. A taxonomy of human communication errors and application to railway track maintenance. In Cognition Technology and Work; Springer: London, UK, 2005. [Google Scholar]


| Name | Population | Estimated Number of e-Scooters | Name | Population | Estimated Number of e-Scooters |
|---|---|---|---|---|---|
| Warsaw | 1,764,615 | 4400 | Elblag | 120,895 | 300 |
| Krakow | 767,348 | 1900 | Plock | 120,787 | 300 |
| Łodz | 690,422 | 1700 | Walbrzych | 113,621 | 250 |
| Wroclaw | 638,586 | 1550 | Wlocławek | 111,752 | 250 |
| Poznan | 538,633 | 1300 | Tarnow | 109,650 | 250 |
| Gdansk | 464,254 | 1150 | Chorzow | 109,021 | 250 |
| Szczecin | 403,883 | 1000 | Koszalin | 107,670 | 250 |
| Bydgoszcz | 352,313 | 850 | Kalisz | 101,625 | 250 |
| Lublin | 339,850 | 800 | Legnica | 100,324 | 250 |
| Bialystok | 297,288 | 700 | Grudziadz | 95,629 | 200 |
| Katowice | 296,262 | 700 | Jaworzno | 92,090 | 200 |
| Gdynia | 246,306 | 600 | Slupsk | 91,465 | 200 |
| Czestochowa | 224,376 | 550 | Jastrzebie-Zdroj | 89,590 | 200 |
| Radom | 214,566 | 500 | Nowy Sacz | 84,041 | 200 |
| Sosnowiec | 204,013 | 500 | Jelenia Gora | 80,072 | 200 |
| Torun | 202,562 | 500 | Siedlce | 77,653 | 150 |
| Kielce | 196,804 | 450 | Konin | 74,834 | 150 |
| Rzeszow | 189,662 | 450 | Myslowice | 74,647 | 150 |
| Gliwice | 181,309 | 450 | Piotrkow Trybunalski | 74,312 | 150 |
| Zabrze | 174,349 | 400 | Suwalki | 69,554 | 150 |
| Olsztyn | 173,070 | 400 | Siemianowice Slaskie | 67,523 | 150 |
| Bielsko-Biala | 171,505 | 400 | Zamosc | 64,354 | 150 |
| Bytom | 168,394 | 400 | Leszno | 64,197 | 150 |
| Zielona Gora | 139,819 | 300 | Chelm | 63,333 | 150 |
| Rybnik | 139,129 | 300 | Lomza | 63,092 | 150 |
| Ruda Slaska | 138,578 | 300 | Zory | 62,243 | 150 |
| Tychy | 128,211 | 300 | Przemysl | 61,808 | 150 |
| Opole | 128,140 | 300 | Biala Podlaska | 57,545 | 100 |
| Gorzow Wielkopolski | 124,295 | 300 | Piekary Sląskie | 55,652 | 100 |
| Dąbrowa Gornicza | 121,121 | 300 | Ostrołeka | 52,215 | 100 |
| Swietochlowice | 50,385 | 100 | |||
| Total: | 29,500 |
© 2020 by the authors. Licensee MDPI, Basel, Switzerland. This article is an open access article distributed under the terms and conditions of the Creative Commons Attribution (CC BY) license (http://creativecommons.org/licenses/by/4.0/).
Share and Cite
Brdulak, A.; Chaberek, G.; Jagodziński, J. Determination of Electricity Demand by Personal Light Electric Vehicles (PLEVs): An Example of e-Motor Scooters in the Context of Large City Management in Poland. Energies 2020, 13, 194. https://doi.org/10.3390/en13010194
Brdulak A, Chaberek G, Jagodziński J. Determination of Electricity Demand by Personal Light Electric Vehicles (PLEVs): An Example of e-Motor Scooters in the Context of Large City Management in Poland. Energies. 2020; 13(1):194. https://doi.org/10.3390/en13010194
Chicago/Turabian StyleBrdulak, Anna, Grażyna Chaberek, and Jacek Jagodziński. 2020. "Determination of Electricity Demand by Personal Light Electric Vehicles (PLEVs): An Example of e-Motor Scooters in the Context of Large City Management in Poland" Energies 13, no. 1: 194. https://doi.org/10.3390/en13010194