Potable Reuse of Coalbed Methane-Produced Waters in Developing Country Contexts—Could the Benefits Outweigh the Costs to Facilitate Coal Transitions?


Department of Engineering Systems and Environment, University of Virginia, Charlottesville, VA 22904, USA
*
Author to whom correspondence should be addressed.
Energies 2020, 13(1), 154; https://doi.org/10.3390/en13010154
Submission received: 20 November 2019
/
Revised: 21 December 2019
/
Accepted: 23 December 2019
/
Published: 28 December 2019
(This article belongs to the Special Issue Life Cycle Assessment and Related Systems-Thinking Approaches for Sustainability of Energy and Water Infrastructures)
Abstract
:Development of coalbed methane (CBM) projects is critical to the achievement of climate change goals because it will help facilitate coal-to-gas transitions in Asia-Pacific countries with low conventional gas reserves. However, growth in CBM in these regions will necessitate strategic, sustainable approaches to produced water management. We posit that it may be possible to deliver synergistic water, energy, and health benefits by reusing CBM-produced waters as potable water supply in water-stressed coal-bearing regions. The goal of this study is to probabilistically evaluate life cycle costs and benefits of using reverse osmosis to treat CBM-produced water in the Damodar Valley coalfields in eastern India. Two treatment configurations are assessed, namely, centralized, and decentralized (i.e., in-home). We find that both configurations offer good cost-effectiveness based on two separately computed metrics to account for the value of health improvement benefits (i.e., disability-adjusted life years (DALYs) averted or monetized health benefits). We also observe that centralized systems are more cost-effective than decentralized, because they reduce capital cost and use-phase energy consumption per unit-volume treated. Average estimated values for the cost–benefit ratio are <0.5 and 1.0 for centralized and decentralized, respectively. Normalizing by anticipated health benefits, cost-effectiveness metrics are <$30/DALY for the centralized system versus <$200/DALY for the decentralized system. These results are highly sensitive to the value of statistical life and baseline water access. A related analysis taking into account both CBM-produced waters and mine waters revealed that deployment of reverse osmosis (RO) could provide drinking to approximately 3.5 million people over 20 years in the Damodar Valley region. These results have interesting implications not only for the study region but also for other CBM-producing countries experiencing chronic severe water stress.

1. Introduction
The Intergovernmental Panel on Climate Change (IPCC) and others have noted that some energy technologies useful for achieving the 1.5 °C end-of-century climate target will have unprecedentedly high water footprints [1]. Accordingly, it is of the utmost importance to reduce tradeoffs between water and energy systems as a way to facilitate long-term decarbonization. Harmonizing water, energy, and climate change goals is also necessary for achievement of the United Nations (UN) sustainable development goals [2]. One particularly important challenge pertains to management of produced waters from unconventional energy sources such as coalbed methane (CBM) [3]. Such waters are moderately-to-severely brackish, and they require appropriate management to minimize risks to groundwater and surface water supplies that are used as drinking water supply or to support natural ecosystems.
Moving beyond management, it is of interest to examine how rapidly advancing desalination technologies could be leveraged to make beneficial reuse of CBM and other produced waters. Several applications are of interest in this vein, including irrigation or agriculture and reinjection into oil or gas operations to enhance fuel recovery (i.e., water flooding). However, many regions with abundant CBM energy resources also experience chronic, severe water stress and lack an adequate potable water supply. It is therefore of interest to examine whether the produced waters can be treated using some appropriate desalination technology and then used as drinking water. This approach formed the basis for a recent study by Meng et al. [4], in which geospatial analysis was used to evaluate the “produced-to-potable concept”. In that study, it was concluded that treatment of produced waters from conventional and unconventional formations via reverse osmosis (RO) could deliver drinking water for one million California residents per year.
CBM is experiencing dramatic growth among the developing countries of Asia-Pacific, most notably China, India, and Indonesia [5]. This growth is expected to accelerate over the coming decades. These same countries also experience widespread chronic water stress and significant levels of waterborne diseases. Based on this confluence of circumstances, and other factors, we have posited that reuse of treated CBM-produced waters as potable drinking water supply in coal-bearing regions of select developing countries could have dramatically positive benefits. We previously outlined relevant features of systems where the proposed approach could work [6]. Several especially notable factors include: appropriate geochemical characteristics of the produced waters (e.g., moderately brackish composition of Na-HCO3 type, low organic content); high social acceptance for RO; existing water distribution infrastructure; and socialized government, in which a single unified entity controls both energy assets and public health services. These countries are also interested in enhancing energy security by reducing their dependence on imported natural gas, which gives them good motivation to make use of CBM as a means of ultimately transitioning away from coal. It is of interest to weigh the costs and benefits associated with treatment of CBM-produced waters to produce potable water for locations in which all of these circumstances exist.
Particularly, the Damodar Valley in eastern India is an important region to be studied, because this location has an extremely low water supply, and was previously demonstrated that expanded water access in this region would deliver substantive societal benefits [7,8]. We evaluated two possible system configurations corresponding to centralized and decentralized treatment for RO-based treatment of CBM-produced waters, as discussed below.
Centralized systems make use of a single, large RO treatment facility located relatively nearby to the CBM installation. It is envisioned that the centralized treatment facility would operate similarly to large-scale desalination facilities in the Middle East and various developed countries. As discussed previously, such systems offer low capital cost per unit volume. Moreover, produced waters may exhibit considerable variation in total dissolved solids (TDS) and other properties, and centralized systems exhibit larger tunability to adjust to such changes. Finally, a centralized system would involve a brine treatment unit near the RO plant itself to facilitate large-scale remediation making salt recovery easier. Examples of such systems are presented in prior literature [9,10].
Alternatively, the decentralized (or in-home) system would make use of point-of-use treatment, in which untreated water is delivered to individual households, where it is then treated and consumed. Decentralized systems can be more expensive (in terms of cost per unit volume treated); however, they offer several unique advantages for use in developing countries, including reduced risk of water recontamination after treatment during transport and increased system redundancy [11]. Accordingly, they have been uniquely popular in developing country contexts where recontamination risk may be high. It is also noteworthy that in-home RO usage has grown dramatically in Asia-Pacific at almost 10% annually over the past decade and this trend is expected to continue over the coming decades [12]. Such systems would entail collection of brines from individual households and their transmission to a brine treatment unit. Examples of such systems may be found in [6,11].
The objective of this study was to validate the hypothesis that RO-based treatment of CBM-produced waters could constitute an economically, environmentally, and socially sustainable means of providing potable drinking water in severely water-stressed coal-bearing regions exhibiting a confluence of socio-technical factors. We compared the centralized and decentralized configurations for RO-treatment of CBM-produced waters based on several kinds of cost–benefit metrics. The results of this analysis offer several generalizable conclusions about how energy, water, and climate objectives could be harmonized.
2. Methodology
2.1. Overview
A life cycle costing framework was constructed to evaluate the costs and benefits associated with RO-based treatment of CBM-produced waters in the Damodar Valley. This framework accounted for treatment via RO and collection and management of the resulting RO brine wastes via combined wind-aided intensified evaporation and membrane crystallization (WAIV-MCr). Two system configurations were evaluated, namely, centralized and decentralized (in-home). These configurations are depicted in Figure 1. For both configurations, it was assumed that a piped distribution network already exists, such that construction of the distribution network was excluded from the analysis. Sewage treatment for the wastewater produced by the individual homes was also excluded.
The functional unit (FU) was 3.29 × 10⁷ m3 of raw CBM-produced water. This corresponds to the approximate volume of produced water generated at a typical Damadar wellfield over its lifetime. This value was computed based on ongoing observations of gas and water production in the Raniganj coalfield and its assumed design life. Relevant technical details associated with selection of this FU are laid out in Section 2.2. Both system configurations, centralized and decentralized, were scaled to deliver the same FU, to facilitate comparison with each other and relevant benchmarks.
Life cycle costs and benefits for the proposed systems were computed in units of US$. Four kinds of economic costs were evaluated: (1) capital investments or initial costs for RO equipment; (2) energy and other operation and maintenance (O&M) costs for RO treatment; (3) water storage costs; and (4) O&M costs for the WAIV-MCr treatment of the post-RO brine residuals. Four kinds of anticipated sustainability benefits were also evaluated: (1) reduction in mortality associated with waterborne diarrheal illness; (2) reduction in treatment costs for non-fatal cases of waterborne diarrheal illnesses; (3) avoidance of disposal costs for CBM-produced waters; and (4) recovery of valuable materials from RO concentrates. These benefits were monetized using approaches based on existing literature. Section 2.3 and Section 2.4 provide additional information about calculation of life cycle costs and benefits, respectively.
Finally, the life cycle costing models were built in spreadsheet format using the Crystal Ball add-in for Microsoft Excel. This software automates Monte Carlo simulation, whereby distributions of inputs are sampled repeatedly to generate distributions of selected outputs. For this study, each Monte Carlo simulation comprised 100,000 trials.
2.2. Functional Unit (FU) Calculations
Total gas production for the East Raniganj coalfield was 4.2 Mm3 per day as of 2017–2018 [13]. This installation is close to the project’s midlife, having been in operation since 2013 with an expected design life of 20 years. This design life is consistent with typical industry practice in India and internationally [14,15].
Gas and water production are highly variable in a CBM reservoir, with very high water and low gas production early, and vice-versa later on [16]. Therefore, to simplify the analysis, we assumed an average water–gas ratio of 1.1 L/m3 over the entire project lifetime of 20 years. This estimate was obtained from reservoir data for several operational CBM projects in the same region [14,17]. Based on these parameters, the FU was 3.29 × 10⁷ m3 of raw CBM-produced water.
2.3. Estimating Life Cycle Costs
Table 1 summarizes the relevant parameters for estimation of these costs. The subsequent paragraphs provide additional information about how these parameters were used to compute various costs.
RO capital costs for the centralized system were estimated based on Akgul et al. [18]. From these data, it was evident that the size of a RO facility strongly influences the levelized capital cost per unit volume of raw water treated up to capacities of 2000 m3/day. Centralized RO facilities with capacities greater than this threshold exhibit relatively flat levelized capital costs per m3 [18] (Figure S1). Since it is more cost-effective to operate larger capacity centralized RO facilities, and the quantities of CBM-produced waters corresponding to the FU are much larger than can be accommodated in a single facility (maximum capacity = 10,000 m3), it was assumed that levelized capital cost is constant with a value of $0.2/m3 [18].
O&M costs for RO treatment in a centralized facility are dominated by electricity and membrane replacement costs. Therefore, other O&M costs (e.g., labor) were not accounted for in this study [18,20]. Electricity consumption per water volume treated was assigned to a uniform distribution over the range 0.45–1.40 kWh/m3, based on published work by Singh et al. [19]. These estimates take into account the relatively favorable geochemical composition of typical Indian CBM-produced waters (i.e., moderate total dissolved solids (TDS) (around 1300 ppm) comprising principally NaHCO3, with minimal organics or trace metals) [19]. Electricity cost was assigned to a triangular distribution with minimum = $48/MWh, maximum = $70/MWh, and likeliest value = $54/MWh [24]. These values take into account new regulations for emissions control from Indian coal-fired power plants. Finally, membrane replacement cost was assigned to the uniform distribution encompassing the range US$ 0.17/m3 ± 10% [20].
Retail costs and other performance data for the in-home RO devices used in the decentralized system were collected from Amazon India. Relevant information is summarized in Table S1 [21]. From these data, there is a moderate correlation between retail price, power consumption, and flow rate. Price increases with increasing flow rate and decreases with increasing power consumption per unit volume of water treated (see Figure S2). These relationships can be modeled using Equation (1) (R2 = 0.68).
The retail costs referenced in Table S1 and Equation (1) include a service contract that covers periodic maintenance (e.g., membrane replacement) over the lifetime of the device. Typical service life for domestic water purifiers was assigned to a uniform distribution over the range 6–8 years, based on previous work [22]. Accordingly, the number of devices required per household is given by the project lifetime (20 years) divided by assumed device lifetime. The number of households served was computed by determining how many families correspond to the FU service population, assuming one family per household and a 60% volumetric water yield (i.e., 0.6 L treated volume is produced per 1 L raw water). Daily drinking water use in the study area was assigned to a uniform distribution over the range 3.12 ± 1.17 L/day/person, based on field estimates from Hossain et al. [27]. Family size was assigned to a triangular distribution with minimum = 5.0, maximum = 5.4, and likeliest value = 5.1, based on data from a recent government survey [28]. Finally, the initial RO device cost for the decentralized system was computed by multiplying unit retail cost by the total number of devices required to deliver the FU.
Electricity cost to operate the in-home RO devices was computed based on the amount of time per day each device is used and the assumed cost of electricity. The operational time per day is a function of daily household water demand and device flow rate. Daily household water demand was computed by multiplying family size times daily water consumption per capita. This quantity was then divided by flow rate to compute the time per day that the device must be operated. This quantity was then multiplied by device power requirement (24–60 W; see Table S1), the total number of devices per FU, the number of days in the project lifetime (365 days/year × 20 years), and the assumed electricity cost. The resulting product corresponds to RO operating costs per FU in the decentralized configuration.
It was assumed that the centralized and decentralized systems would have the same water storage costs and RO brine management costs. Water storage is required because the majority of the produced water is created during the first few years that a CBM installation is operated. The excess water must be impounded to prevent contamination of the drinking water supply, or, for the application proposed in this study, to save it for use during later years of the project. It was assumed that the produced water is stored in lined impoundments. Estimated water storage costs were assigned to a uniform distribution over the range $5.0–$8.1/m3, based on Tipton et al. [25]. Brine management costs for the WAIV-MCr technology, a single value of US$ 1.19/m3 of raw produced water, were directly adapted from literature. This estimate is quite robust even in light of process parameter uncertainties [26].
2.4. Estimating Life Cycle Benefits
Table 2 summarizes relevant parameters for estimation of these costs. The subsequent paragraphs provide additional information about how these parameters were used to quantify the various benefits.
The health benefits arising from reduction in diarrheal illness were quantified using two different approaches. The first method made use of an assumed value of statistical life (VSL). The second approach made use of published DALY information. The two kinds of information were used in separate calculations resulting in two different kinds of cost-effectiveness metrics, which were then presented side-by-side as a way to assess robustness and consistency.
In the first method, health improvement benefits were monetized by first multiplying the value of statistical life (VSL) by the number of diarrheal deaths averted and then adding the number of non-fatal diarrheal cases avoided times an assumed treatment cost (Equation (2)). These two terms accounted for mortality and morbidity reduction, respectively.
We estimated current VSL to be $4.64 million, as adjusted from a 1997 value of $1.2 million and assuming compounding growth at 7% based on trends in gross domestic product purchasing price parity (GDP-PPP) [33,35]. The pre-intervention number of diarrheal deaths was 82,000 per year based on the Million Death Study, which periodically reviews childhood mortality in India [29]. A separate dataset from the Government of India reports that the number of non-fatal cases of diarrhea is 8 × 10⁻³ per person per year [30]. We assumed that implementation of the proposed intervention would reduce the risk of diarrheal illness by at least 72%, based on a recent review of water treatment technologies [31]. This percentage was multiplied by the pre-intervention numbers of fatal and non-fatal cases to estimate how many cases of each kind would be avoided by the proposed treatment. The assumed cost of treatment for a single, non-fatal case of waterborne diarrhea was $17.41 [34]. Due to data limitations, this value was modeled as a single point estimate, without any distribution. Finally, for the centralized configuration, it was assumed that the risk of recontamination after RO treatment was 14–40% [32]. Accordingly, for centralized systems, the overall reduction in diarrheal illness was assumed as 43–62%. In doing so, we assumed that the likelihoods of fatal and non-fatal cases would be equally affected by recontamination risk.
We also used a second method to quantify the health benefits arising from the proposed intervention. We did this because several of the parameters in Equation (2) are difficult to estimate robustly (e.g., VSL is highly normative and inherently challenging to estimate) [36]. The second approach makes use of disability-adjusted life years (DALYs) to quantify pre- and post-intervention waterborne disease burden. DALYs are a convenient metric for expressing how many years of productive life are lost due to death or illnesses. This metric is commonly used in epidemiological and water intervention literature, which makes it useful for comparison with relevant existing studies (e.g., [11]).
World Health Organization (WHO) data were used to parameterize the relationship between access to improved water supply and annual diarrheal DALYs per 1000 persons, based on data from 128 different countries (Figure S3 (Supplementary Materials)) [37]. These data revealed a statistically significant trend of decreasing DALYs with increasing improved water access (R2 = 51%). We applied this formulation to the case study region by assuming that baseline improved water access for the relevant districts of Dhanbad and Bokaro is 63% [28]. This value corresponds to approximately 28.8 DALYs per 1000 persons. We then assumed the post-intervention access to improved water supply is 100%, which corresponds to 0.6 DALYs per 1000 persons annually.
Two additional operational benefits were also computed and added to the monetized health improvement benefits. The economic value of the salts recovered from post-RO brines via WAIV-MCr is $0.43–$0.45/m3 of brine treated, based on a recent analysis of the WAIV-MCr technology. This parameter was assigned to a uniform distribution. It was also assumed that implementation of the proposed intervention would make it possible to avoid alternative produced water management costs. The avoided costs were assumed to be uniformly distributed over the range $8.6–$17/m3 of raw produced water [38].
2.5. Computing Present Value (PV) and Measuring Cost-Effectiveness
Since our assumed project lifetime is 20 years, it was necessary to account for the timing of all expected costs and benefits, and thereby compute an equivalent present value (PV). All cash flows were discounted at 6%, consistent with other CBM studies in India [14]. The capital costs of the centralized RO system are incurred in the first year, while that of the decentralized system are assumed to be incurred in the first year and then subsequently in 1 + lth, 1 + 2lth years… 1 + nlth, where l is the lifetime of the in-home device. All other costs (energy costs, water storage, post-RO brine treatment) and benefits (mortality/morbidity avoided, water disposal costs averted, recovered materials) are assumed to be incurred annually. Equations (3) and (4) present formulations for computing PV for costs and benefits, respectively. It was also necessary to compute the total accumulated amount of DALYs avoided by the intervention. This calculation is summarized in Equation (5).
Once the present values for costs and benefits were computed, two cost-effectiveness metrics were evaluated for the centralized and decentralized (in-home) configurations. These metrics include:
- Costs–benefits ratio (CBR): Given by the PV of total costs divided by the PV of total benefits (i.e., Equation (3) divided by Equation (4)).
- Cost per disability-adjusted life years (DALYs) averted ($/DALYs): Indicates what investment is required to achieve a unit decrease in cumulative DALYs over the project lifetime, as computed based on WHO methodologies [39]. This metric is given by PV of total costs divided by cumulative DALYs avoided (i.e., Equation (3) divided by Equation (5)).
The cost-effectiveness results obtained in this work may have considerable uncertainty. While a complete consequential life-cycle assessment (LCA) analysis was outside the scope of this study, due to critical data limitations, we performed a sensitivity analysis to understand how uncertainty and/or variability in individual parameters could affect the anticipated cost-effectiveness of both modeled configurations.
3. Results and Discussion
3.1. Cost-Effectiveness Metrics
Figure 2 illustrates our calculated values for two kinds of cost-effectiveness metrics: life cycle cost–benefit ratio and cost per DALYs averted ($/DALYs). Each metric was applied to both the centralized and decentralized (in-home) configurations.
Figure 2 reveals that both proposed configurations, centralized and decentralized (in-home), exhibit good performance based on the life cycle cost–benefit ratio (CBR). The ranges of computed CBR values are 0.15–0.23 and 0.6–1.1, respectively. The distribution for the centralized system is fairly narrow with all computed values significantly less than 0.5. Similarly, most of the distribution for the decentralized system (87%) exhibits a CBR <1. These results indicate that the sustainability benefits arising from potable reuse of RO-treated CBM produced in water-stressed coal-bearing regions will likely outweigh the economic costs [40]. These data also suggest that the centralized configuration is more cost-effective than the decentralized configuration. We posit that the observed cost-effectiveness of RO-based treatment reflects two combined effects. First, the cost of RO has been rapidly declining in the Asia-Pacific region over the last several years, as both centralized and decentralized technologies have become increasingly widespread [41]. Second, the monetized health impacts associated with delivery of treated water are very significant, because water stress is very severe in the selected region, which contributes to high rates of waterborne illnesses in the baseline case (status quo). For example, diarrheal illnesses account for a very high child mortality rate, on the order of three diarrheal deaths among children under the age of five, per every 1000 births [42]. The relatively inexpensive cost of RO treatment, in combination with the dramatic health improvements associated with increased access to improved water supply, make the proposed produced-to-potable concept highly cost-effective.
Figure 2 also presents distributions for our computed values of the $/DALY metric. This metric offers complementary information to the cost–benefit ratio; however, it places heavier emphasis on health benefits compared to other kinds of sustainability benefits. More specifically, it accounts only for health improvements achieved via reduction of waterborne illnesses and does not account for avoidance of produced waters management costs or recovery of valuable materials from RO brine. Despite these differences, the $/DALY metric exhibits similar trends to the cost–benefit ratio. The centralized system exhibits a narrower distribution and better cost-effectiveness compared to the decentralized system (i.e., $28–$46/DALY versus $138–$199/DALY, respectively). Accordingly, both metrics are in agreement that the centralized configuration is more cost-effective than the decentralized configuration.
The $/DALY metric is also useful for assessing the acceptability of the proposed approach compared to the “do-nothing” case or various possible alternatives, based on comparison with established threshold values. A recent review of epidemiological public-health decision-making metrics concluded that interventions costing less than $25/DALY are considered “highly attractive” for implementation in low- to middle-income developing countries, whereas interventions costing less than $150/DALY are considered “attractive” [40]. Applying these thresholds, the proposed centralized and decentralized configurations for RO-based treatment of CBM-produced waters are “highly attractive” and “attractive”, respectively. Finally, the $/DALY values computed in this study are conservative estimates (i.e., possible overestimates) for two reasons. First, the DALYs averted represent only a reduction in diarrheal illnesses and do not account for reductions in other water-borne diseases (e.g., cholera). Second, we could not find good data to parameterize health improvements (i.e., DALY reductions) associated with RO implementation in a developing country. We therefore assumed that DALY reduction for RO would be at least as good as the DALY reduction for filtration-based treatment, which was 72% [31]. However, this value is likely an underestimate, given the higher removal efficiency and efficacy of RO compared to filtration. For these reasons, the values of $/DALY computed in this analysis may slightly undersell the potential of both the centralized and decentralized treatment configurations.
It is also of interest to assess how robust the computed values of the cost-effectiveness metrics will be in the face of anticipated future changes. On one hand, the baseline case (status quo without intervention) may improve based on current governmental and foreign-funded initiatives to expand access to clean drinking water. An improvement in the baseline will undercut the computed benefits of the proposed RO-based CBM-treatment strategy. However, for the CBR metric, the computed benefits are strongly influenced by the value of statistical life (VSL) (Section 3.3), which increases linearly with economic growth indicators such as GDP-PPP. This parameter has increased at a steady rate (around 7%/year) in India over the past two decades, in which case benefits and costs will likely grow together over time. We expect similar trends in the $/DALY metric over time [43]. Therefore, the cost-effectiveness metrics computed in this study are not only reflective of current conditions but may also be fairly robust moving forward into the future.
3.2. Costs and Benefits–Components and Comparisons
We can also examine the breakdown of costs and benefits that contributes to the overall metrics presented in Figure 3. Each metric incorporates several kinds of costs and several kinds of benefits, which makes it relevant to understand which components most strongly drive the overall performance of each configuration. Figure 4 illustrates the apportionment of costs in each system, centralized and decentralized (in-home), and also the distribution of benefits in both systems.
The largest contributors to costs for the centralized system are brine management (i.e., “post RO”) (>50%), capital costs for RO (−20%), then non-energy O&M costs for RO (13%), and finally electricity cost for RO (5%). These results are initially surprising, since conventional wisdom holds that RO systems are very costly to operate because they consume so much electricity. For example, Meng et al. [4] estimated that electricity costs for RO-treatment of produced waters to create potable drinking water would account for 50% of the overall project cost in California. Still it is noteworthy that RO energy consumption has fallen from 6 kWh/m3 to 1.25 kWh/m3 over the last three decades [44]. This dramatic improvement makes RO more appealing for treatment of unconventional, highly saline produced waters to make them suitable as drinking water supply. From Figure 3A, RO electricity costs account for 22% of the total costs in the centralized system. While this is a not an insignificant fraction, it does not completely dominate the overall system cost. Also, it is noteworthy that electricity consumption to power RO accounts for a very small fraction (<1%) of the corresponding heating value of the CBM gas produced. This comparison underscores the advantage of creating potable water as a co-product of energy production (i.e., natural gas), whereby fusion of these two systems reflects the principles of industrial ecology insofar as waste from one system is used as valuable input for another system.
It is also somewhat surprising that the largest cost component for the centralized system is post-RO brine management. In this study, it was assumed that brine management occurs via wind-aided intensified evaporation with membrane crystallization (WAIV-MCr). However, it is not the features of the treatment itself that give rise to the high cost, but rather the lack of good disposal (reinjection) sites nearby to the case study location. Again referring to the California analysis by Meng et al. [4], their brine management costs were substantively lower (i.e., $0.2–$0.4/m3 in their study versus $0.7–$1.1/m3 in ours) because their study site was located much closer to conventional oil and gas wells where RO brines can be safely and inexpensively disposed via reinjection. Our study site does not have this advantage, which illustrates that responsible brine management will be a critical technical challenge for continued RO growth and also highlights the value of geographically explicit LCA studies. This is one example of how energy and water systems performance is so strongly influenced by geographic and regional socio-technical factors.
The costs for the decentralized (in-home) configuration are significantly higher than in the centralized configuration, as a result of very high capital costs (Figure 3B) for individual RO devices. Initial costs for the decentralized case are as much as 14 times higher than in the centralized configuration. The electricity cost for decentralized is also twice as high as in centralized. These observations have interesting implications not just for produced water management but also for broader drinking water practices in Asia-Pacific, where there has been rapid growth in the in-home treatment market. Centralizing potable water systems in regions where recontamination is not a major risk can lead to reduction of per-unit water costs by three-fourths. Further, management of post-RO brine is much more logistically challenging in decentralized systems, because small volumes of waste are created at a large number of locations. This increases logistical and transmission costs.
Regardless of the configuration, close to 80% of the benefits of the proposed intervention arise from reduction in diarrheal deaths. Since the benefits are discounted over time to compute present value (PV), larger mortality reductions in the early initial years offer larger economic benefits compared to similar reductions in later years. Some additional benefits are also accrued by avoiding the water disposal costs associated with current produced water management practices, which are not insignificant in current industrial practice. Finally, 5–6% of the anticipated benefits correspond to the economic value of the sodium salts recovered as byproducts during post-RO brine management. It is anticipated that the magnitude of this benefit may increase over time, as brine management technologies mature, such that the brine management unit process may be net-revenue generating [45]. This is currently not the case.
3.3. Sensitivity Analysis
Sensitivity results are summarized in Figure 4. Broadly, these results reveal that parameters pertaining to diarrheal disease are very influential for computing both metrics and in both modeled configurations. Importantly, both metrics are highly sensitive to the assumed mortality rates associated with waterborne diarrheal illness. This parameter is directly incorporated into the CBR calculation, and it is embedded in the assumptions about the baseline (without intervention) DALY estimates for calculation of the $/DALY metric.
Figure 4 also underscores that VSL and GDP-PPP (which was used to extrapolate VSL to current day) are influential for calculation of the CBR metric. This is because all monetized health benefits accounted for within CBR are computed using the VSL parameter. However, published VSL values are established based on expert elicitation or public surveying, which makes this parameter inherently challenging to validate objectively. Since the sensitivity analysis reveals that model outputs are highly sensitive to both VSL and GDP-PPP, it is evident that updating or improving the estimated value of this parameter would increase the robustness of the modeling results.
Sensitivity analysis also reveals that the initial cost of the in-home RO unit is an influential modeling parameter. This indicates that the overall cost-effectiveness of the decentralized configuration hinges on the initial costs. Reduction in this cost will require either governmental subsidies or further innovation that could increase the lifetime of the devices. It is therefore notable that several manufacturers have initiated efforts towards production of low-cost, locally produced RO water purifiers that may be as much as 40% less expensive than current available options [46]. Finally, it is a limitation of the sensitivity analysis that it cannot address post-RO brine treatment, since it is a substantive contributor to life cycle costs in both the centralized and decentralized configurations. The sensitivity analysis cannot probe which parameters most strongly influence the post-RO treatment cost because there is a lack of sufficiently well-resolved techno-economic data available for this technology. As additional data becomes available, it may become possible to understand how this cost component could be reduced.
3.4. Scalability of Potable-to-Produced Concept
3.4.1. Evaluating Potential Scope for Produced-to-Potable in the Damodar Valley Region
The functional unit selected for this study was based on current production levels in one particular coalfield (Raniganj) in the Damodar Valley coal basin. This basin was appealing for early CBM exploitation by private sector enterprises because it has rich potential and favorable extraction conditions. However, it is anticipated that CBM production will increase dramatically in the near future, as a result of various logistical and economic factors. Peak gas production rates are expected to be 5000–10,000 m3/day, and total anticipated production over the next 20 years is approximately 35 billion m3 (BCM) [14]. Assuming that gas–water ratio stays relatively constant at 1.1 L/m3, RO-treated CBM-produced waters could provide drinking water for more than 1.8 million people over 20 years. Given this very large technological potential, in combination with the favorable cost-effectiveness metrics presented in Figure 2, it seems there may be good incentive to invest in RO-based treatment of CBM-produced waters. This outcome is consistent with the recent commissioning of a pilot-scale RO project to treat CBM-produced waters by a major gas producing firm, Essar Oil, in the Raniganj coalfield.
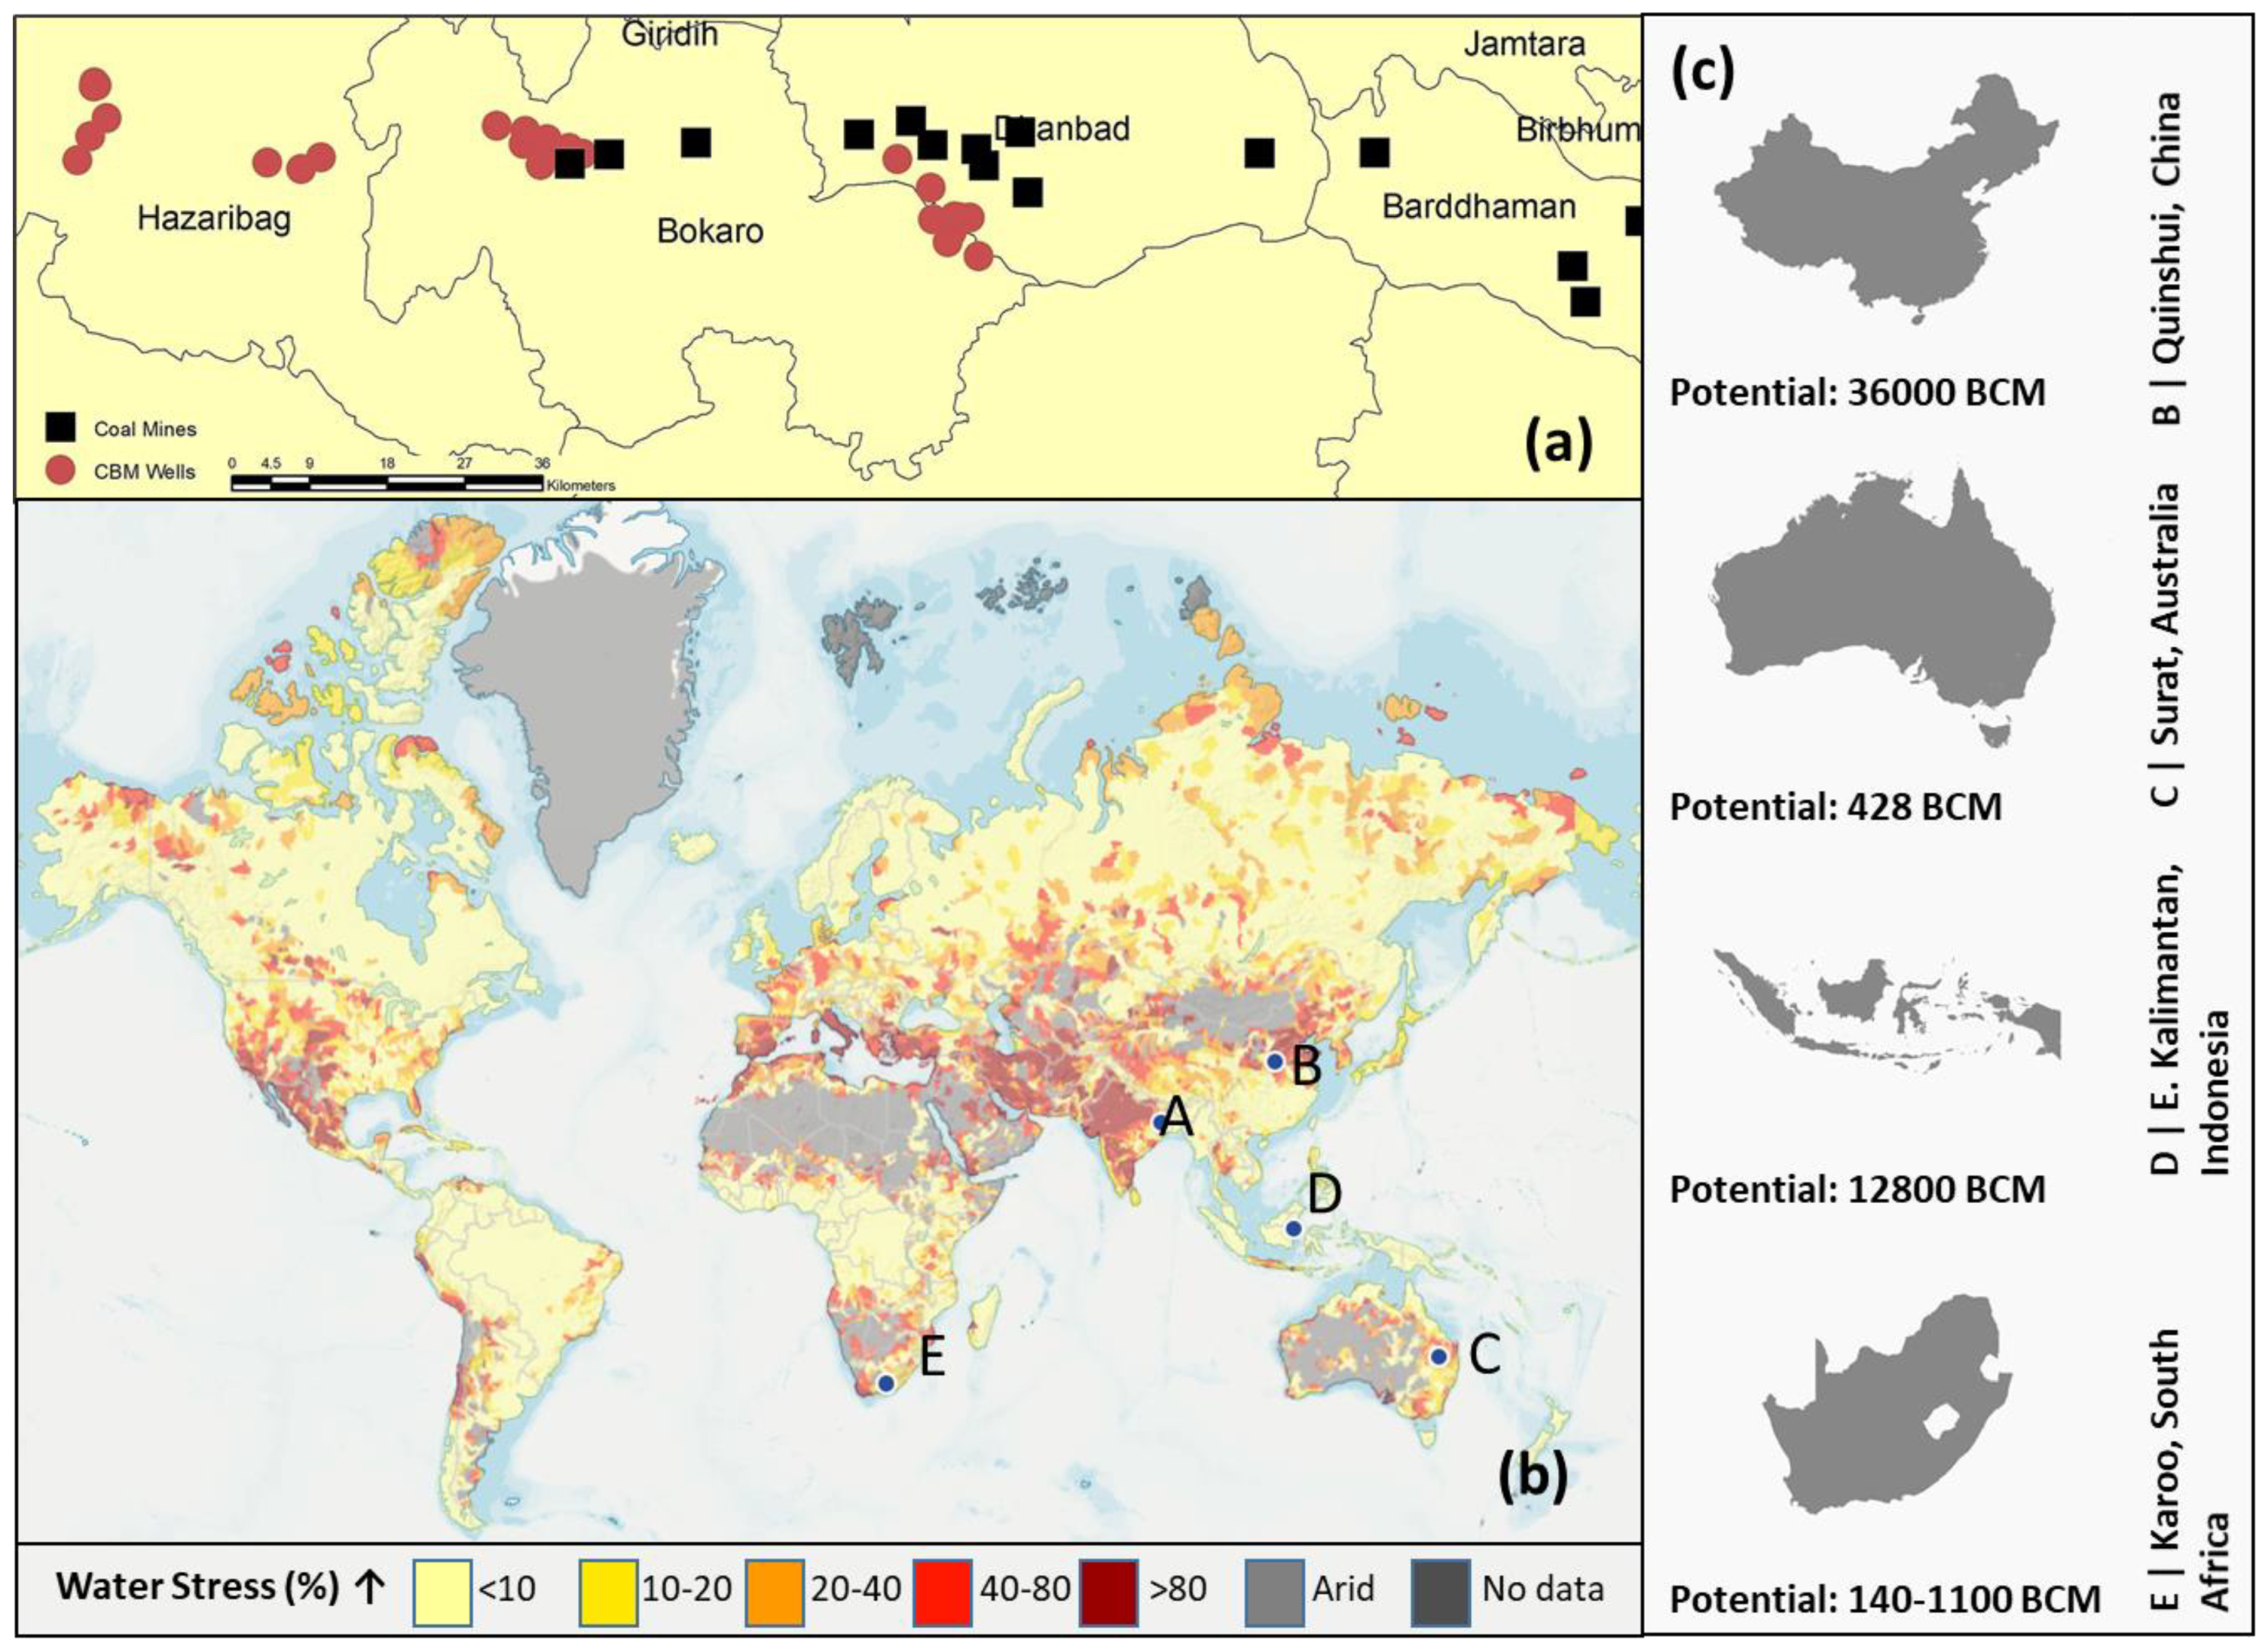
It is also potentially significant that the Damodar Valley possesses large quantities of coal mine water, which may be another alternative water source. The brackishness of mine waters is similar to CBM-produced waters (TDS = 200−1600 ppm), with higher calcium and magnesium (but lower sodium) concentrations. Since the geographic distributions of CBM-produced waters and mine waters are so strongly overlapping in some regions, and because RO is suitable for treatment of both CBM and mine waters, it may be desirable to use both kinds of raw water together as input for RO. It is estimated that current mine water production for one existing subsidiary of Coal India could provide sufficient drinking water for another 340,000 people annually [47]. Coal India currently has a pilot mine water treatment plant in operation servicing approximately 1000 people. Adding together currently available mine water and CBM-produced water resources, we estimate that RO treatment could deliver potable water for nearly 3.5 million people per year in the vicinity of the Damodar Valley. This is close to half of the population in the three districts of Dhanbad, Bokaro, and Hazaribagh (Figure 5a).
Incorporation of both mine water and CBM water into a single potable water system will have interesting logistical impacts. On one hand, increasing the availability of treated water will enhance reliability and resilience, since more than one kind of input will be available at any given time. Increasing the total volume of water treatment could also decrease service disruptions in the distribution network, which could reduce the risk of recontamination. On the other hand, making use of CBM and mine waters together in the same system may be challenging to achieve in practice, due to technological and logistical challenges. For example, there will need to be good coordination and strong collaboration between the coal and natural gas industries and among public and private sectors, which could be difficult to achieve. This difficulty may be partly mitigated in a socialized government setting, since the government plays a strong role in upholding environmental quality (via enforcement of responsible wastewater disposal practices) and promoting public health (via facilitating improved water access). Also, differences in geochemical composition of the two source waters will need to be carefully evaluated to avoid compromising effluent quality (e.g., some mine water samples exhibit considerable trace metal concentrations), which can affect treatment efficacy.
3.4.2. Evaluating Potential Scope Worldwide
Having observed that the proposed potable-to-produced concept offers seemingly appealing cost-effectiveness for the selected study region, we posit that it may also have wide applicability in other regions. Since the coal mining industry is often very negatively impactful on local water availability (both by contaminating surface waters and depleting groundwaters), coal-producing regions are frequently vulnerable to severe water stress. Examining the confluence of circumstances that gave rise to good results for RO-treatment of CBM-produced waters (with or without mine waters) in the Damodar Valley coalfields (India), we anticipate that similarly good performances might be achieved for the Qinshui Basin (China), Surat Basin (Australia), and Karoo Basin (South Africa), as shown in Figure 5b.
The locations highlighted in Figure 5b are experiencing dramatic growth in CBM production. They also exhibit highly localized CBM potential in relatively small geographic regions. For instance, 96% of CBM production in Australia comes from the Surat and Bowen Basins in Queensland, which account only for 6% of the country’s land area. High density of CBM in localized regions that are also nearby to dense population centers is conducive to the proposed produced-to-potable concept because large quantities of water are available in a single region that can be supplied by a relatively small water distribution system. The locations highlighted in Figure 5 also possess socialized governments, which is potentially helpful for harmonizing the seemingly disparate objectives of energy security, healthy potable water provision, and responsible produced waters management. Based on the results observed in this study, RO-based reuse of CBM-produced waters could deliver a cost-effective potable water supply in these regions. This approach could be an effective means of achieving international water-related development goals while also harmonizing water, energy, climate, and health objectives.
4. Conclusions
Extraction of CBM is associated with co-production of very brackish produced waters that require proper handling to reduce impacts to local water systems. Based on the confluence of regional and technological factors including, widespread acceptance of RO and high water stress, prospects of the potable reuse of such waters were investigated using a life cycle cost–benefit model for the Damodar Valley coalfields in eastern India. Results indicated that both centralized and decentralized (in-home) systems delivered cost-effective treatment of such waters, with the former being more appealing. These results are robustly validated using two metrics: cost–benefit ratio and cost-effectiveness ratio (in terms of $/DALY). These metrics were found to be highly sensitive to parameters such as value of statistical life and baseline water access, accuracy of which may be improved in the study region through further case studies.
To improve contextualization of these results, a first-order estimate of the potential of such concepts was carried out. Our geospatial analysis revealed that based on future CBM production estimates and mine water generation occurring in this region, such prospects could service 3.5 million people over 20 years. Similar opportunities exist in other CBM-producing basins in the Asia-Pacific, where high water stress is observed. This research, therefore, provides important insights into balancing the water and energy priorities in the context of coal-to-gas transitions in developing countries.
Supplementary Materials
The following are available online at https://www.mdpi.com/1996-1073/13/1/154/s1.
Author Contributions
Conceptualization, U.S. and L.M.C; Methodology, U.S. and L.M.C.; Software, U.S.; Validation, L.M.C.; Formal Analysis, U.S.; Investigation, U.S. and L.M.C.; Resources, L.M.C.; Data Curation, U.S.; Writing-Original Draft Preparation, U.S.; Writing-Review & Editing, L.M.C.; Visualization, U.S.; Supervision, L.M.C.; Project Administration, L.M.C.; Funding Acquisition, U.S. and L.M.C. All authors have read and agreed to the published version of the manuscript.
Funding
This research was funded by University of Virginia School of Engineering & Applied Science (William L Ballard Jr. Endowed Graduate Fellowship) and Environmental Resilience Institute (ACRES CoLab).
Conflicts of Interest
The authors declare no conflict of interest.
References
- Roy, J.; Tschakert, P.; Waisman, H.; Halim, S.A.; Antwi-Agyei, P.; Dasgupta, P.; Hayward, B.; Kanninen, M.; Liverman, D.; Okereke, C.; et al. Sustainable Development, Poverty Eradication and Reducing Inequalities; Intergovernmental Panel on Climate Change: Geneva, Switzerland, 2018. [Google Scholar]
- McCollum, D.; Echeverri, L.G.; Busch, S.; Pachauri, S.; Parkinson, S.; Rogelj, J.; Krey, V.; Minx, J.C.; Nilsson, M.; Stevance, A.; et al. Connecting the sustainable development goals by their energy inter-linkages. Environ. Res. Lett. 2018, 13, 033006. [Google Scholar] [CrossRef]
- Schnoor, J.L. Water-Energy Nexus. Environ. Sci. Technol. 2011, 45, 5065. [Google Scholar] [CrossRef] [PubMed]
- Meng, M.; Chen, M.; Sanders, K.T. Evaluating the Feasibility of Using Produced Water from Oil and Natural Gas Production to Address Water Scarcity in California’s Central Valley. Sustainability 2016, 8, 1318. [Google Scholar] [CrossRef] [Green Version]
- Boger, C.; Marshall, J.S.; Pilcher, R.C. Worldwide Coal Mine Methane and Coalbed Methane Activities. In Coal Bed Methane—From Prospect to Pipeline; Elsevier: San Diego, CA, USA, 2014; pp. 351–407. [Google Scholar]
- Singh, U.; Colosi, L.M. Water–energy sustainability synergies and health benefits as means to motivate potable reuse of coalbed methane-produced waters. Ambio 2019, 48, 752–768. [Google Scholar] [CrossRef]
- Nandi, A.; Megiddo, I.; Ashok, A.; Verma, A.; Laxminarayan, R. Reduced burden of childhood diarrheal diseases through increased access to water and sanitation in India: A modeling analysis. Soc. Sci. Med. 2017, 180, 181–192. [Google Scholar] [CrossRef] [Green Version]
- Malakar, K.; Mishra, T.; Patwardhan, A. Inequality in water supply in India: An assessment using the Gini and Theil indices. Environ. Dev. Sustain. 2018, 20, 841–864. [Google Scholar] [CrossRef]
- Grubert, E.; Kelly, D.; Rumbelow, B.; Wilson, J. Improving Produced Water Management: A Case Study of Designing an Inland Desalination Pilot Project. In Proceedings of the World Environmental and Water Resources Congress, Austin, TX, USA, 17–21 May 2015. [Google Scholar]
- Nair, M.; Kumar, D. Water desalination and challenges: The Middle East perspective: A review. Desalin. Water Treat. 2013, 51, 2030–2040. [Google Scholar] [CrossRef]
- Ren, D.; Colosi, L.M.; Smith, J.A. Evaluating the Sustainability of Ceramic Filters for Point-of-Use Drinking Water Treatment. Environ. Sci. Technol. 2013, 47, 11206–11213. [Google Scholar] [CrossRef]
- Editorial Board. RO membranes and components market is growing at 10.5% CAGR. Membr. Technol. 2015, 2015, 4. [Google Scholar] [CrossRef]
- Standing Committee on Petroleum and Natural Gas. Production of Coalbed Methane—Fourteenth Report; Lok Sabha Secretariat: New Delhi, Indian, 2016. [Google Scholar]
- Singh, A.K.; Hajra, P.N. Coalbed Methane in India: Opportunities, Issues and Challenges for Recovery and Utilization; Springer Nature: Cham, Switzerland, 2018. [Google Scholar]
- Bureau of Land Management. Powder River Basin Oil and Gas Project: Environmental Impact Statement; US Department of the Interior: Buffalo, WY, USA, 2002; Volume 1.
- Salmachi, A.; Karacan, C.Ö. Cross-formational flow of water into coalbed methane reservoirs: Controls on relative permeability curve shape and production profile. Environ. Earth Sci. 2017, 76, 200. [Google Scholar] [CrossRef]
- CIMFR. Desorption, Adsorption and Simulation Studies for Coalbed Methane Reservoir Analysis in Moonidih Block; Submitted to CMPDI: Dhanbad, Indian, 2010. [Google Scholar]
- Akgul, D.; Çakmakcı, M.; Kayaalp, N.; Koyuncu, I. Cost analysis of seawater desalination with reverse osmosis in Turkey. Desalination 2008, 220, 123–131. [Google Scholar] [CrossRef]
- Singh, U.; Singh, A.K.; Singh, D.B. Coalbed methane-produced water characteristics and insights from the Jharia coalfield in India. Energy Sources Part A Recovery Util. Environ. Eff. 2018, 40, 1897–1909. [Google Scholar] [CrossRef]
- Avlonitis, S.A.; Kouroumbas, K.; Vlachakis, N. Energy consumption and membrane replacement cost for seawater RO desalination plants. Desalination 2003, 157, 151–158. [Google Scholar] [CrossRef]
- Amazon India. Search—Reverse Osmosis. Available online: https://www.amazon.in/s/ref=nb_sb_noss_2?url=search-alias%3Daps&field-keywords=reverse+osmosis (accessed on 2 January 2018).
- Chun, Y.Y.; Lee, K. Environmental impacts of the rental business model compared to the conventional business model: A Korean case of water purifier for home use. Int. J. Life Cycle Assess. 2017, 22, 1096–1108. [Google Scholar] [CrossRef]
- United Nations. Household Size and Composition around the World 2017. Available online: https://www.un.org/en/development/desa/population/publications/pdf/ageing/household_size_and_composition_around_the_world_2017_data_booklet.pdf (accessed on 25 September 2019).
- Singh, U.; Rao, A.B. Integrating SO2 and NOx control systems in Indian coal-fired power plants. Decision 2015, 42, 191–209. [Google Scholar] [CrossRef]
- Tipton, D.S. Mid- Continent Water Management for Stimulation Operations, 2013. Available online: https://www.epa.gov/hfstudy/mid-continent-water-management-stimulation-operations (accessed on 16 July 2018).
- Macedonio, F.; Katzir, L.; Geisma, N.; Simone, S.; Drioli, E.; Gilron, J. Wind-Aided Intensified eVaporation (WAIV) and Membrane Crystallizer (MCr) integrated brackish water desalination process: Advantages and drawbacks. Desalination 2011, 273, 127–135. [Google Scholar] [CrossRef]
- Hossain, M.A.; Rahman, M.M.; Murrill, M.; Das, B.; Roy, B.; Dey, S.; Maity, D.; Chakraborti, D. Water consumption patterns and factors contributing to water consumption in arsenic affected population of rural West Bengal, India. Sci. Total Environ. 2013, 463–464, 1217–1224. [Google Scholar] [CrossRef] [Green Version]
- IIPS. District-Level Household and Facility Survey; Ministry of Health and Family Welfare: New Delhi, Indian, 2008.
- Million Death Study Collaborators. Changes in cause-specific neonatal and 1–59-month child mortality in India from 2000 to 2015: A nationally representative survey. Lancet 2017, 390, 1972–1980. [Google Scholar] [CrossRef]
- Ministry of Health and Family Welfare. Water-Borne Diseases. Press Information Bureau, 2014. Available online: https://pib.gov.in/newsite/printrelease.aspx?relid=106612 (accessed on 25 September 2019).
- Sobsey, M.D.; Stauber, C.E.; Casanova, L.M.; Brown, J.M.; Eliott, M.A. Point of Use Household Drinking Water Filtration: A Practical, Effective Solution for Providing Sustained Access to Safe Drinking Water in the Developing World. Environ. Sci. Technol. 2008, 42, 4261–4267. [Google Scholar] [CrossRef]
- Payment, P.; Siemiatycki, J.; Richardson, L.; Renaud, G.; Franco, E.; Prevost, M. A prospective epidemiological study of gastrointestinal health effects due to the consumption of drinking water. Int. J. Environ. Health Res. 1997, 7, 5–31. [Google Scholar] [CrossRef]
- Shanmugam, K.R. The Value of Life: Estimates from Indian Labour Market. Indian Econ. J. 1997, 44, 105–114. [Google Scholar]
- Greenland, K.; Schmidt, W. Cost of Infection Study Findings: India, 2012. Available online: https://blogs.lshtm.ac.uk/envhealthgroup/files/2015/05/Results-COI-India21Jun12.compressed.pdf (accessed on 16 July 2018).
- Miller, T.R. Variations between Countries in Values of Statistical Life. J. Transp. Econ. Policy 2000, 34, 169–188. [Google Scholar]
- Cropper, M.L.; Guttikunda, S.; Jawahar, P.; Lazri, Z.; Malik, K.; Song, X.; Yao, X. Applying Benefit-Cost Analysis to Air Pollution Control in the Indian Power Sector. J. Benefit-Cost Anal. 2019, 10, 185–205. [Google Scholar] [CrossRef] [Green Version]
- WHO. Country Statistics. 2018. Available online: http://www.who.int/gho/countries/en/ (accessed on 11 May 2018).
- Boysen, D.B.; Boysen, J.E.; Boysen, J.A. Strategic Produced Water Management and Disposal Economics in the Rocky Mountain Region. 2002. Available online: http://www.gwpc.org/sites/default/files/event-sessions/Deidre_B_Boysen_PWC2002_0.pdf (accessed on 16 April 2018).
- WHO. Metrics: Disability-Adjusted Life Year (DALY). World Health Organization. Available online: https://www.who.int/healthinfo/global_burden_disease/metrics_daly/en/ (accessed on 28 October 2019).
- Shillcutt, S.D.; Walker, D.G.; Goodman, C.A.; Mills, A.J. Cost effectiveness in low-and middle-income countries. Pharmacoeconomics 2009, 27, 903–917. [Google Scholar] [CrossRef]
- Cohen, Y.; Semiat, R.; Rahardianto, A. A perspective on reverse osmosis water desalination: Quest for sustainability. AIChE J. 2017, 63, 1771–1784. [Google Scholar] [CrossRef]
- Gomes, M.; Begum, R.; Sati, P.; Dikshit, R.; Gupta, P.C.; Kumar, R.; Sheth, J.; Habib, A.; Jha, P. Nationwide Mortality Studies to Quantify Causes of Death: Relevant Lessons From India’s Million Death Study. Health Aff. 2017, 36, 1887–1895. [Google Scholar] [CrossRef]
- Grosse, S.D. Assessing cost-effectiveness in healthcare: History of the $50,000 per QALY threshold. Expert Rev. Pharmacoecon. Outcomes Res. 2008, 8, 165–178. [Google Scholar] [CrossRef]
- Liu, Y.; Hejazi, M.; Kyle, P.; Kim, S.H.; Davies, E.; Miralles, D.G.; Teuling, A.J.; He, Y.; Niyogi, D. Global and Regional Evaluation of Energy for Water. Environ. Sci. Technol. 2016, 50, 9736–9745. [Google Scholar] [CrossRef]
- Wenten, I.G.; Ariono, D.; Purwasasmita, M.; Khoirudin. Integrated processes for desalination and salt production: A mini-review. In Proceedings of the AIP Conference, Bydgoszcz, Poland, 10 March 2017; Volume 1818, p. 020065. [Google Scholar]
- Annala, L.; Sarin, A.; Green, J.L. Co-production of frugal innovation: Case of low cost reverse osmosis water filters in India. J. Clean. Prod. 2018, 171, S110–S118. [Google Scholar] [CrossRef]
- Singh, A.K. Geoenvironmental Studies; National Geoscience Award Lecture: New Delhi, India, 2013. [Google Scholar]
- ONGC. Environmental Impact Assessment for Development of North Karanpura Coalbed Methane Block (NK-CBM-2001/I) in Jharkhand; Oil and Natural Gas Corporation Ltd.: Bokaro, India, 2013. [Google Scholar]
- ONGC. Exploratory Drilling for Coalbed Methane Gas in Bokaro CBM Block by M/s ONGC; Ministry of Environment and Forests: New Delhi, India, 2009.
- ONGC. Proposed Pilot Development of Coalbed Methane in Central Parbatpur in Jharia CBM Block Bokaro District and Exploratory Drilling in Jharia Block in Bokaro and Dhanbad Districts of Jharkhand by M/s ONGC; Ministry of Environment, Forests and Climate Change: Ranchi, India, 2015.
- Aqueduct. Water Risk Atlas. Available online: https://www.wri.org/applications/aqueduct/water-risk-atlas (accessed on 28 October 2019).
Figure 1.
Schematic depiction of two configurations for treatment of coalbed methane (CBM)-produced waters via reverse osmosis (RO) to produce potable drinking water. (a) In the centralized configuration, the produced water is treated near the wellfield and brine disposal occurs at the treatment location. (b) In the decentralized configuration, the produced water is pumped to individual homes where point-of-use RO is applied, and brine wastes are then collected or discharged to a secondary location for treatment. Dashed lines indicate the system boundaries for this study. The figure is an adaptive extension from [6].

Figure 2.
Cost-effectiveness of produced-to-potable configurations as indicated by the (A) cost–benefit ratio and (B) costs per DALYs averted.
Figure 2.
Cost-effectiveness of produced-to-potable configurations as indicated by the (A) cost–benefit ratio and (B) costs per DALYs averted.
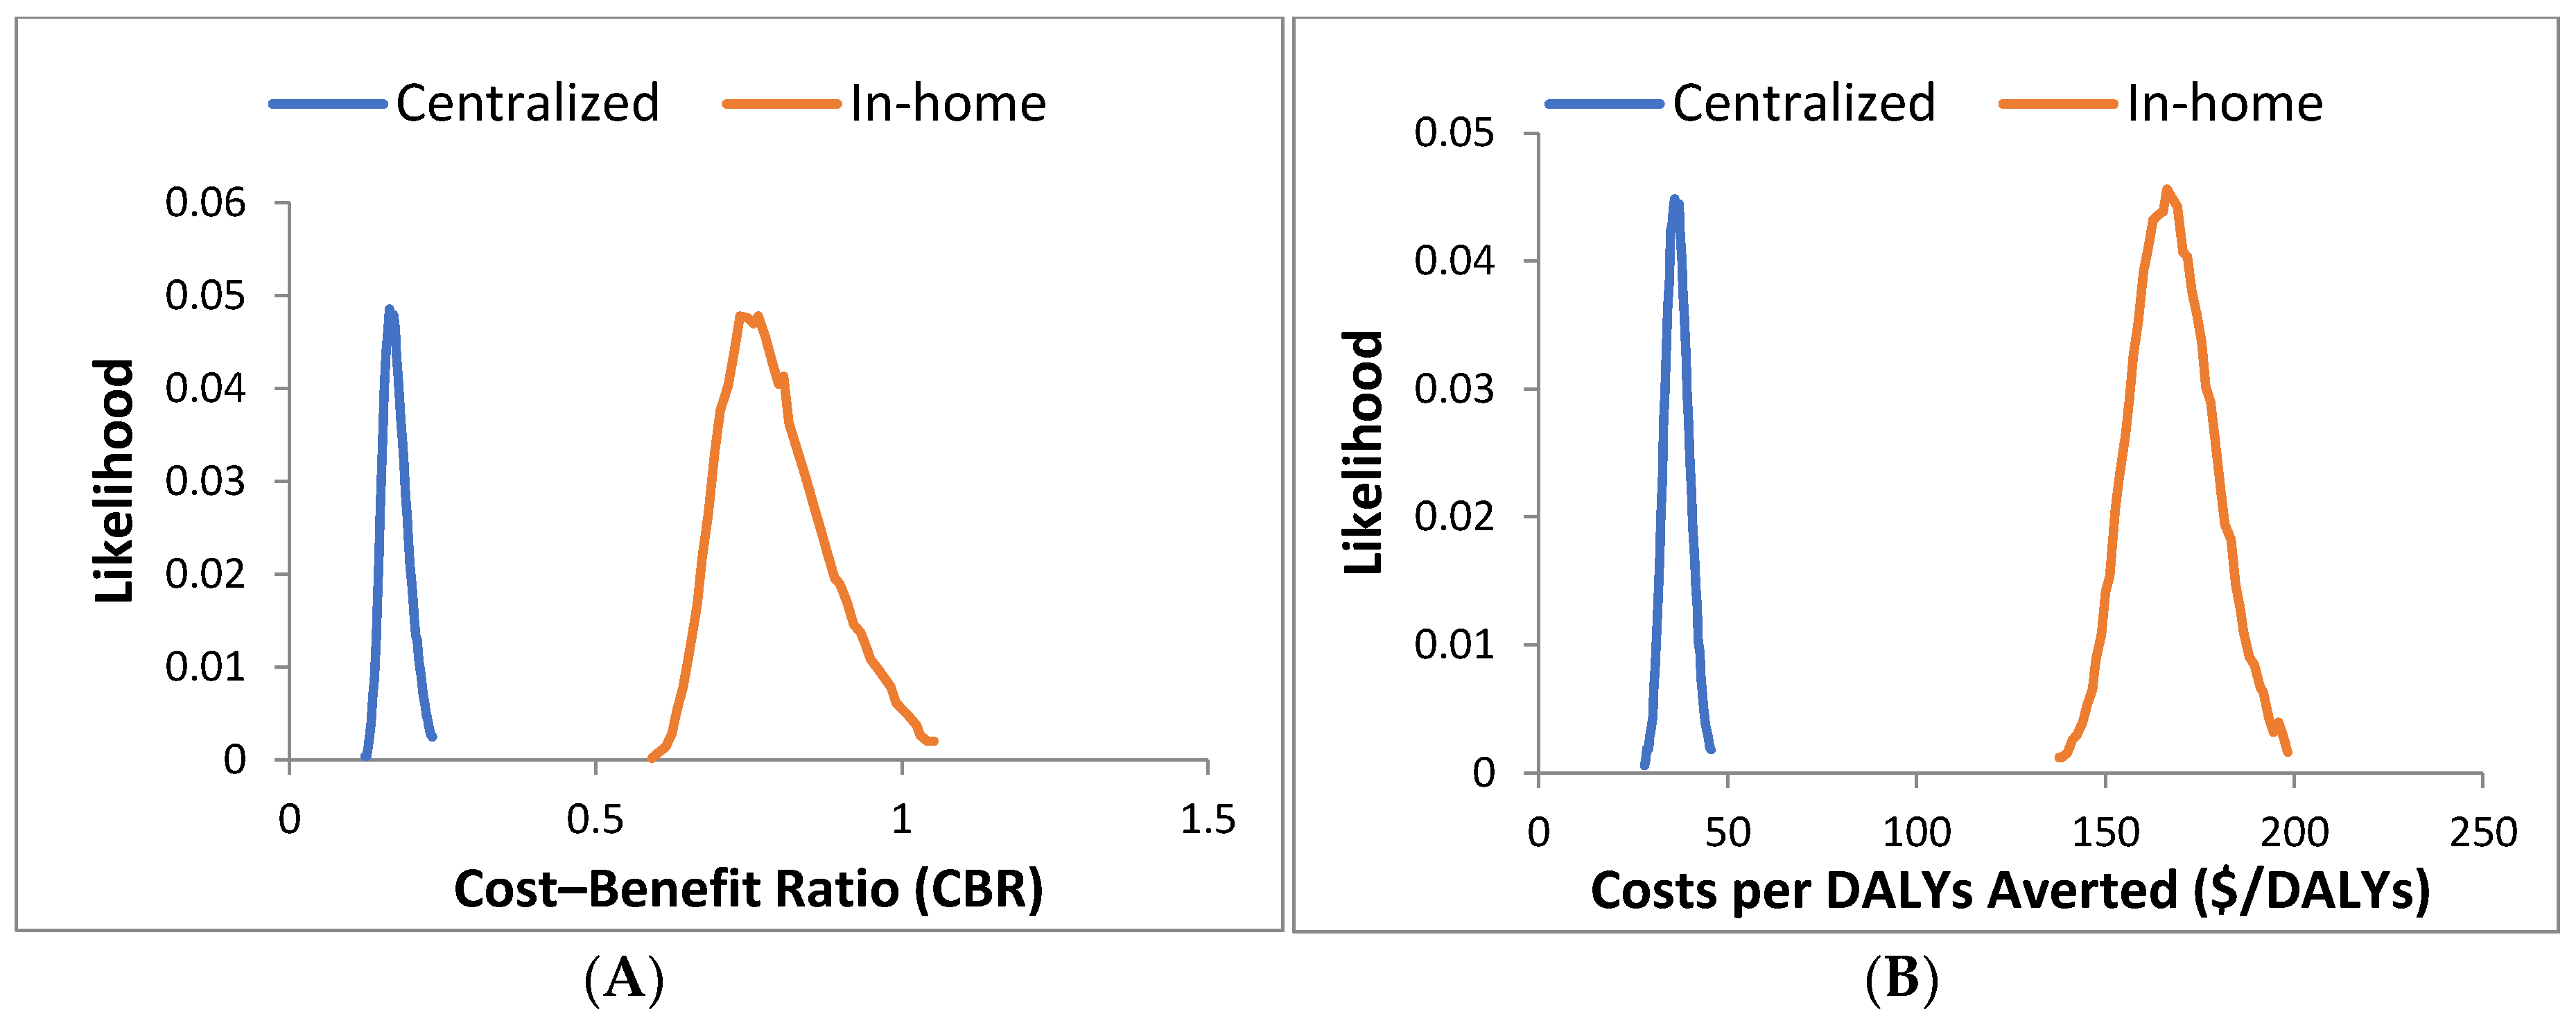
Figure 3.
Components of the costs in the (A) centralized and (B) decentralized (in-home) configurations, along with the (C) benefits which are very similar in both configurations.
Figure 3.
Components of the costs in the (A) centralized and (B) decentralized (in-home) configurations, along with the (C) benefits which are very similar in both configurations.
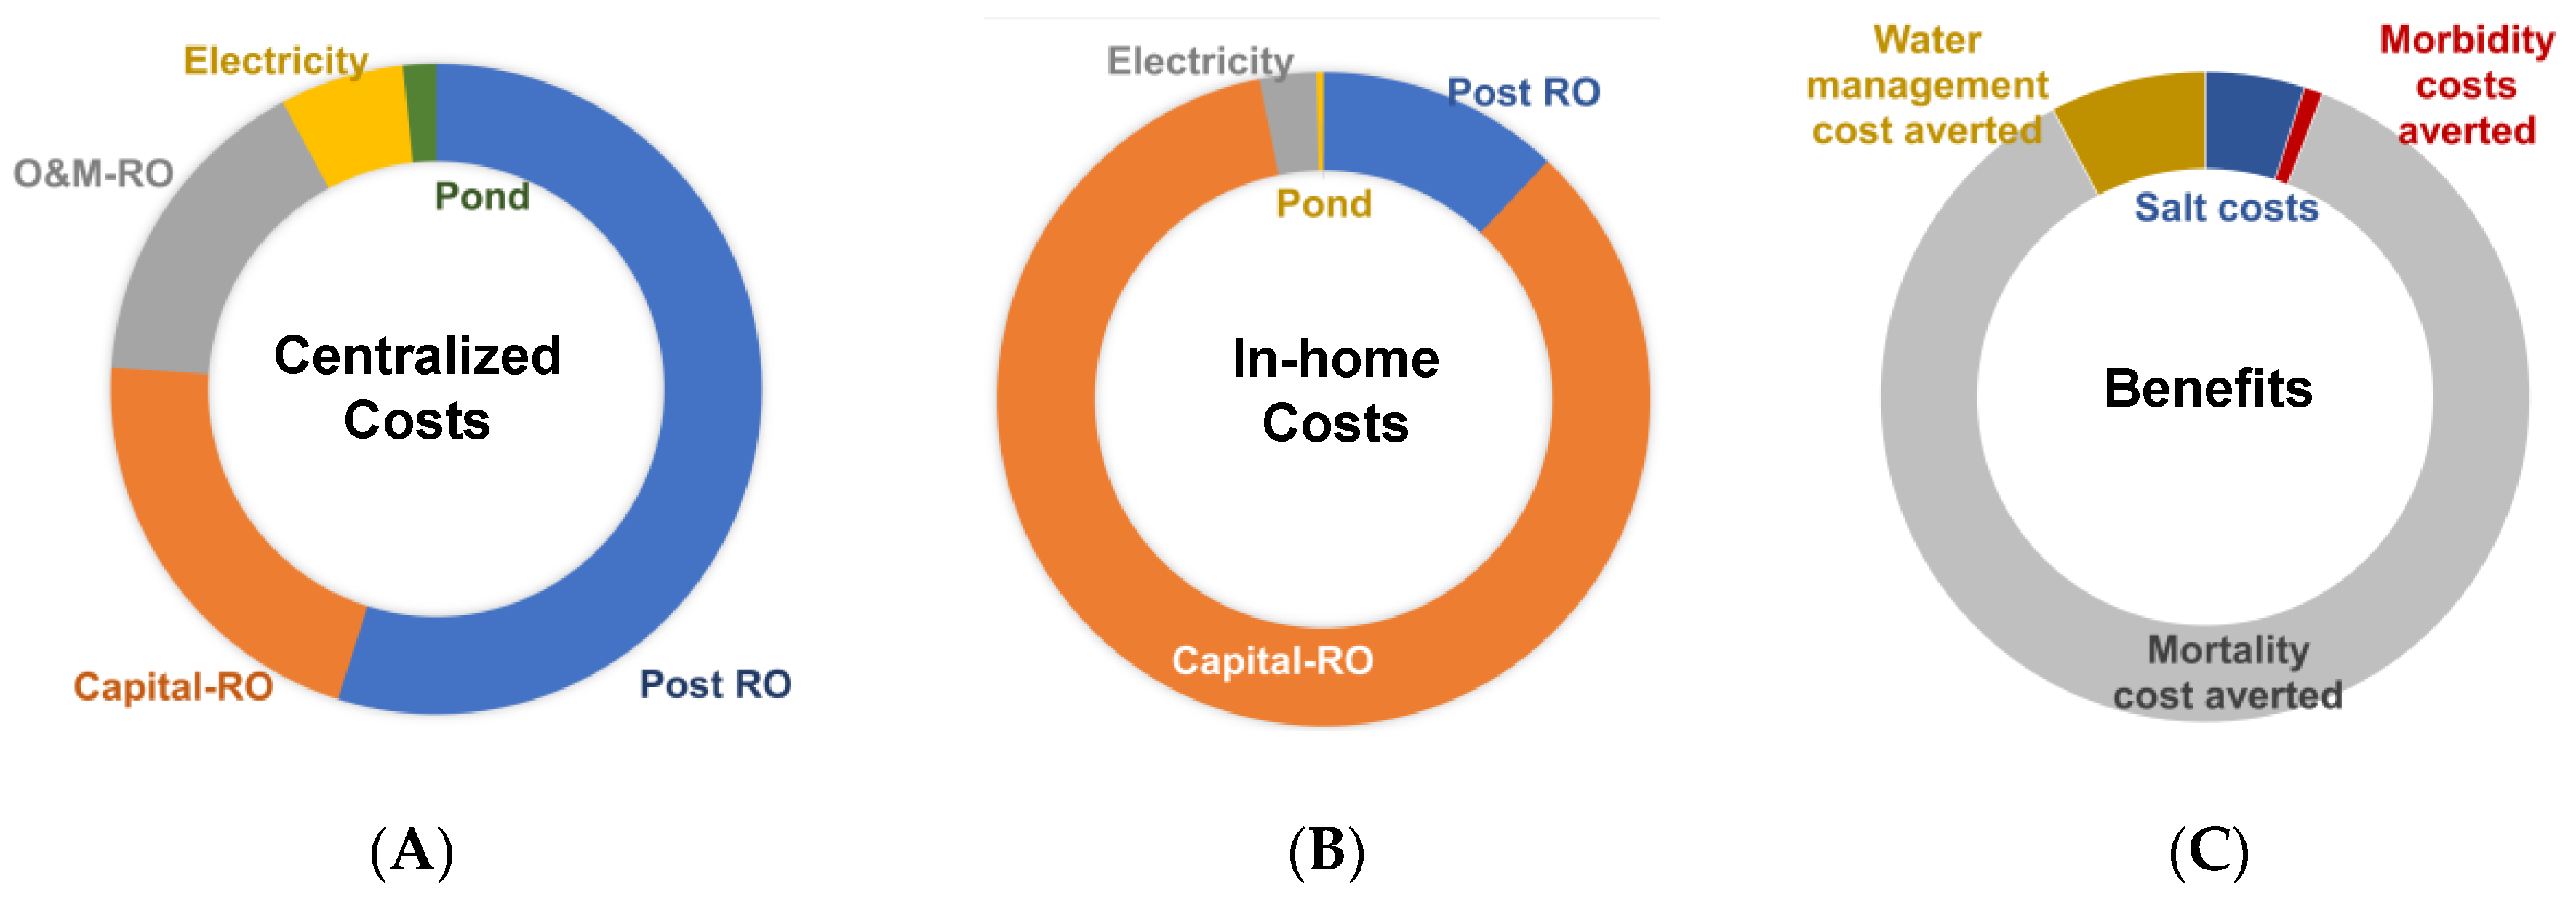
Figure 4.
Tornado charts illustrating which model inputs are most influential for computing each kind of cost-effectiveness metric. The widths of the horizontal bars illustrate variability in output metric arising from ±10% perturbation in each input parameter value, while holding all other inputs constant. Green bars indicate the downside while blue bars indicate upside of each parameter.
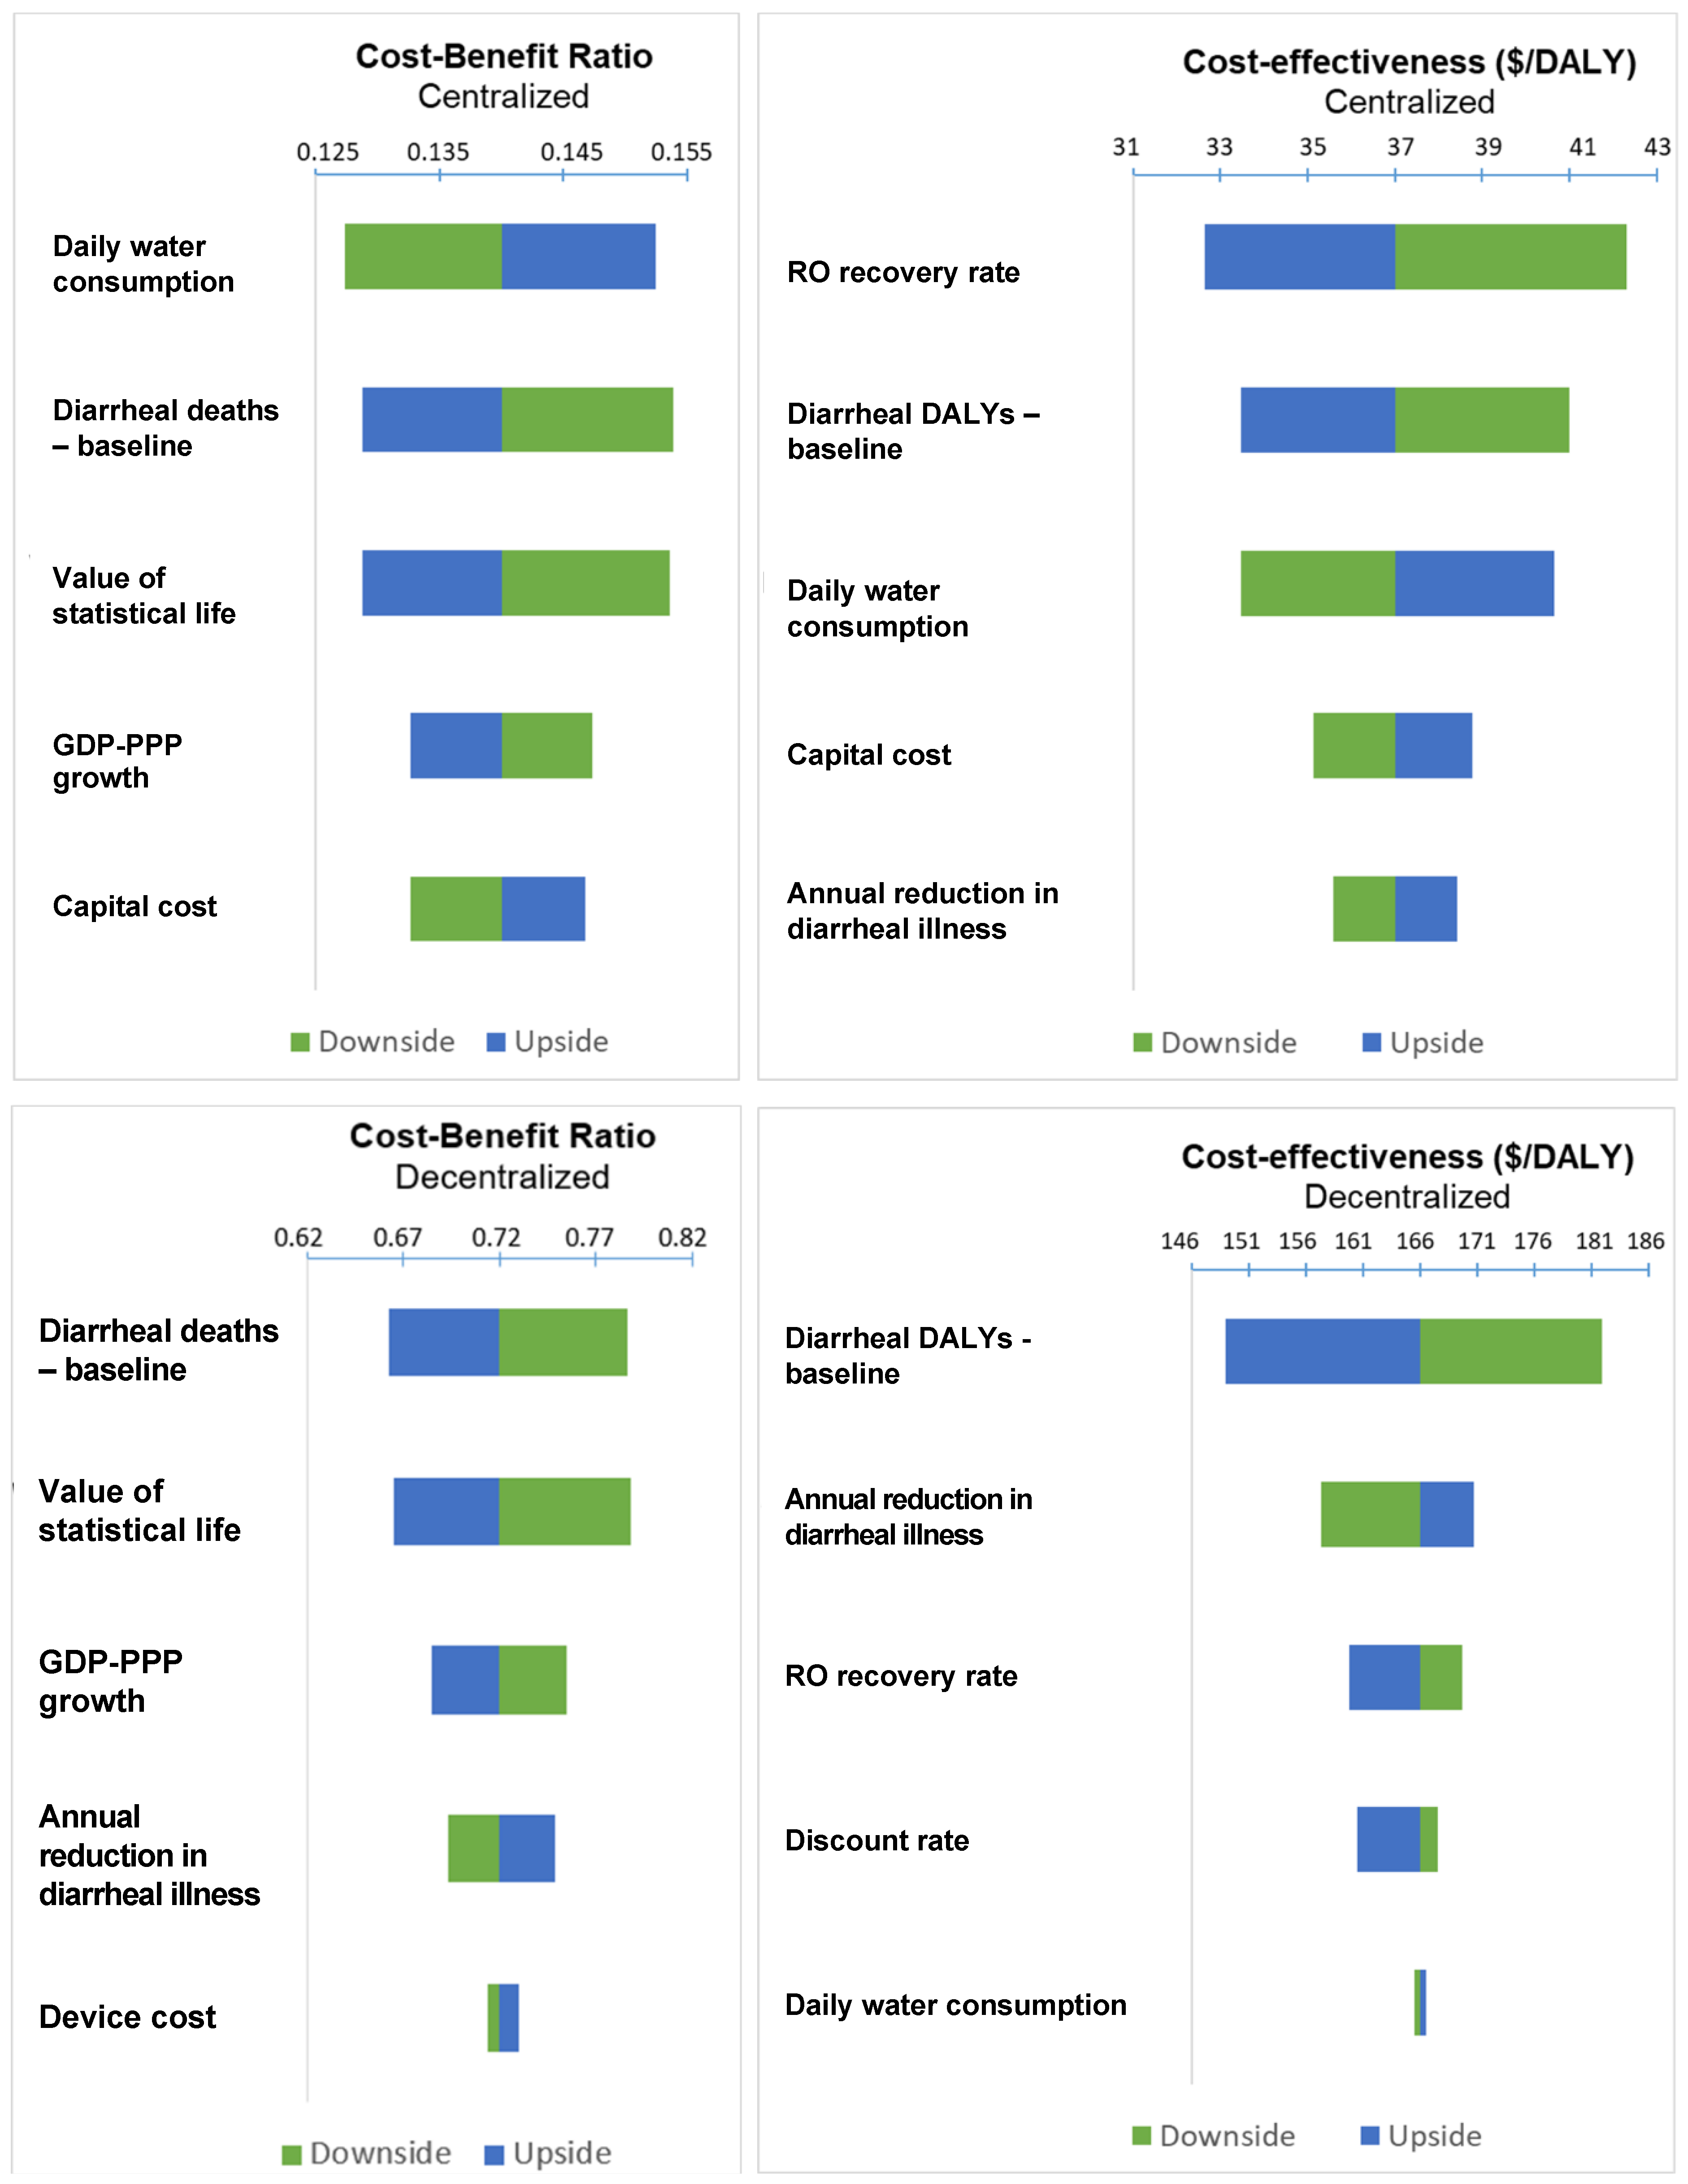
Figure 5.
(a) Our case study region in the Damodar Valley coalfields in India shows not only the possibility of a large amount of CBM-produced waters but also that these could be integrated with the ongoing mine water treatment trials in the region [48,49,50]. At the same time, (b) the global water stress map shows high water stress in several prominent CBM basins in the Asia-Pacific [51]. (c) These include −50,000 BCM gas potential across several countries with active or high prospects of production indicated [5].

Table 1.
Important assumptions for estimation of life cycle costs.
| Component | Unit | Value | Details |
|---|---|---|---|
| Centralized System | |||
| Capital cost for RO | $/m3 treated water | 0.20 | Corresponds to capital cost of 2000 m3/day facility [18]. These costs are levelized. |
| O&M energy consumption for RO | kWh/m3 | 0.45−1.40 | Varies with initial dissolved solids but assumes treatment down to World Health Organization prescribed levels [19]. |
| Non-energy O&M cost for RO | $/m3 | 0.17 ± 10% | [20] |
| Decentralized System | |||
| Initial cost of RO device | US$ | 137−257 | Based on online survey from Amazon India [21]. See Table S1 for list of devices. |
| Power consumption | W | 24−60 | |
| Flow rate | L/h | 9−15 | |
| Lifetime of device | years | 6−8 | Uniform distribution [22]. |
| Family size | 4.0−5.4 | Survey data [23]. Each family is assumed to own one device at a time. | |
| Centralized and Decentralized Systems | |||
| Electricity cost | $/MWh | 48−70 | Based on costs after implementation of new regulatory measures [24]. |
| Water impoundment cost | $/m3 | 5.0−8.1 | Assuming lined impoundment [25]. |
| Wind-aided intensified evaporation and membrane crystallization (WAIV-MCr) cost | $/m3 | 1.19 | Based on [26]. |
| Drinking water requirement | L/person/day | 3.12 ± 1.17 | Based on field surveys in eastern India [27]. |
Table 2.
Important parameters for estimating benefits.
| Component | Unit | Value | Details/Reference |
|---|---|---|---|
| Reference (without intervention) | |||
| Annual diarrheal mortality rate | Dimensionless | 6.56 × 10⁻⁵ | From Million Death Study’s most recent report [29]. |
| Annual diarrheal morbidity rate | Dimensionless | 8 × 10⁻³ | From government of India’s published data (non-diarrheal waterborne diseases are not included) [30]. |
| Clean water connectivity | % | 62.4–63.7 | Third district-level household survey findings for Dhanbad and Bokaro districts [28]. |
| Post-intervention | |||
| Reduction in diarrheal illness | % | 72 | Based on ceramic filters efficacy from [31]. RO is assumed to be at least as effective as ceramic filters (specifically candle filters) based on comparison of effluent concentrations. |
| Clean water connectivity | % | 100 | Assumed based on our intervention, corresponding to 0.6 disability-adjusted life years (DALYs) per 1000 persons annually. |
| Recontamination Risk | % | 14–40 | Only in centralized configuration [32]. |
| Other parameters | |||
| Value of statistical life | US$ | 4.64 × 10⁶ | Compounding 1997 value of $1.2 million from [33] with gross domestic product purchasing price parity (GDP-PPP) growth of 7% per annum. |
| Cost of one diarrheal case treatment | US$ | 17.61 | Recent estimate in eastern India [34]. Considers medication and in-patient costs only and not loss in working days. |
© 2019 by the authors. Licensee MDPI, Basel, Switzerland. This article is an open access article distributed under the terms and conditions of the Creative Commons Attribution (CC BY) license (http://creativecommons.org/licenses/by/4.0/).
Share and Cite
MDPI and ACS Style
Singh, U.; Colosi, L.M. Potable Reuse of Coalbed Methane-Produced Waters in Developing Country Contexts—Could the Benefits Outweigh the Costs to Facilitate Coal Transitions? Energies 2020, 13, 154. https://doi.org/10.3390/en13010154
AMA Style
Singh U, Colosi LM. Potable Reuse of Coalbed Methane-Produced Waters in Developing Country Contexts—Could the Benefits Outweigh the Costs to Facilitate Coal Transitions? Energies. 2020; 13(1):154. https://doi.org/10.3390/en13010154
Chicago/Turabian StyleSingh, Udayan, and Lisa M. Colosi. 2020. "Potable Reuse of Coalbed Methane-Produced Waters in Developing Country Contexts—Could the Benefits Outweigh the Costs to Facilitate Coal Transitions?" Energies 13, no. 1: 154. https://doi.org/10.3390/en13010154
Note that from the first issue of 2016, this journal uses article numbers instead of page numbers. See further details here.