Article

Battery Storage Integration in Voltage Unbalance and Overvoltage Mitigation Control Strategies and Its Impact on the Power Quality

by
Dimitar Bozalakov
1,†,
Mohannad J. Mnati
1,†,
Joannes Laveyne
1,†,
Jan Desmet
2,† and
Lieven Vandevelde
1,3,*,†
1
Electrical Energy Laboratory (EELAB), Department of Electrical Energy, Metals, Mechanical Constructions and Systems (EEMMeCS), Ghent University, Technologiepark-Zwijnaarde 131 9052 Ghent, Belgium
2
Electrical Energy Laboratory (EELAB)-LEMCKO, Campus Kortrijk, Department of Electrical Energy, Metals, Mechanical Constructions and Systems (EEMMeCS), Ghent University, Graaf Karel de Goedelaan 34, 8500 Kortrijk, Belgium
3
Flanders Make, 3920 Lommel, Belgium
*
Author to whom correspondence should be addressed.
These authors contributed equally to this work.
Energies 2019, 12(8), 1501; https://doi.org/10.3390/en12081501
Submission received: 28 March 2019 / Revised: 13 April 2019 / Accepted: 15 April 2019 / Published: 20 April 2019

Abstract

:
The increased utilisation of distributed renewable energy sources in low voltage grids leads to power quality problems such as overvoltages and voltage unbalance. This imposes challenges to the distribution system operators to maintain the power quality in their grids. To overcome these issues, energy storage systems could be integrated together with the distributed energy resources and the stored energy could be used when needed to better improve power quality and achieve better grid performance. However, integrating an energy storage system introduces additional cost, therefore, determining the right capacity is essential. In this article, an energy storage system is combined with the classical positive-sequence control strategy and the three-phase damping control strategy. The three-phase damping control strategy is able to mitigate the voltage unbalance by emulating a resistive behaviour towards the zero- and negative-sequence voltage components. This resistive behaviour can be set on different values such that the desired voltage unbalance mitigation is achieved. Hence, the three-phase damping control strategy, equipped with the energy storage system is investigated under different values of the resistive behaviour. Both control strategies are investigated under the same conditions and the impact of the different capacities of the energy storage systems is investigated.

1. Introduction

Because of environmental and economical concerns, the share of the distributed energy resources (DRES) in the distribution grids is growing continuously. The decreasing prices of the photovoltaic (PV) panels accelerates the penetration of DRES even more compared to previous years [1]. Therefore, the distribution system operators (DSO) face power quality challenges such as overvoltages. Due to the single-phase DRES and asymmetrical loading, the voltage unbalance additionally decreases the hosting capacity of the low voltage (LV) feeders [2].
To overcome these issues, the DSO could reinforce the LV grids in which the problems occur but this is an incredibly expensive solution. Installing dedicated equipment such as distribution static compensators (DSTATCOM) and dynamic voltage restorers (DVR) are mostly used at medium voltage level (MV) and usually they are installed in the vicinity of the LV networks with high penetration of DRES. However, this solution does not effectively mitigate power quality issues at the end of the LV feeders. In addition, if power quality issues appear in another LV grid which is part of the same MV network but more distant from the dedicated equipment, then the last one should be relocated or a new one must be installed which is associated with additional costs [3,4]. On-load tap changers (OLTC) are very efficient devices for overvoltage mitigation. However, the voltage unbalance still remains as an issue. In literature, many research is carried out regarding voltage control by means of reactive power provided by DRES themselves. Control strategies such as variable power factor (PF), fixed power factor (FPF) and volt/var control have been developed and examined [5]. Nevertheless, the reactive power is very effective in MV networks but very inefficient in LV grids due to the high R / X ratios as demonstrated in [6].
Active power drooping can be used to prevent overvoltages, but this eventually leads to a significant loss for the prosumer which will extend the payback period. The rapid development of battery energy storage systems (BESS) in the recent years has led to new opportunities to solve the technical and economic challenges of increasing the penetration level of renewables and decrease the CO 2 emissions even more compared to the set targets for 2020 [7]. To reduce the curtailed active power, a BESS can be incorporated in the DRES. BESSs have great potential to help with the power quality improvement in many aspects such as peak shaving, overvoltage mitigation and voltage unbalance mitigation [8,9,10,11,12]. BESS can have a significant advantageous impact on the load shifting caused by electric vehicles and plug-in electric vehicles [13]. In [14], an examination is carried out on a BESS connected at MV level and the results show that the reactive power control in combination with the active power curtailment is more economically viable compared to a BESS solution. As mentioned above, however, the LV grids have higher R / X ratio and the reactive power control is an ineffective solution for voltage control in these grids. In [1], different types of battery storage elements are examined and the findings reveal that the Li-Ion batteries can be a cost effective solution for improving the power quality by mitigating overvoltages during peak generation times. In [15], the authors have investigated the Tesla PowerWall 2.0 (Fremont, CA, USA) and the findings of the paper show that this BESS can be a profitable investment. The authors in [16] have investigated BESSs with different capacities starting from 5 kWh to 25 kWh and, according to this reference and studied scenarios, these BESS can bring a profit to the prosumer between 200 to 350 euro per year. The authors in [17] report that the Tesla PowerWall 1.0 and 2.0 can be used for peer-to-peer energy supply and the price per kWh is around 0.075 € and 0.069 €, respectively. Therefore, the integration of BESS has the potential to become a very attractive solution for overvoltage mitigation in LV grids.
However, very often, the integration of BESS is associated only with overvoltages while the voltage unbalance is completely neglected. Power quality issues such as overvoltages and voltage unbalance in areas with high penetration of renewables are examined in detail in [18]. In this study, the authors use the three-phase damping control strategy to mitigate the voltage unbalance and a droop controller to prevent overvoltages. The results reveal that this combination is able to increase the penetration of DRES in LV grids; however, some active power is drooped in order to keep the phase voltages within limits. Usually in literature, the effect of storage is examined only in balanced grids and only positive-sequence currents are injected by DRES and BESS. Therefore, the objective of this article is to investigate the energy storage impact on the voltage profiles, power quality and also investigate the grid performance, when the classical positive-sequence and the three-phase damping control strategies are used under unbalanced grid conditions. In addition, different levels of the voltage unbalance mitigation are examined and their impact on the drooped energy and storage capacity is assessed.
The remainder of the article is organised as follows: in Section 2, a detailed description of the droop controller and BESS controller is given as well as an overview of the positive-sequence and the three-phase damping control strategies. In Section 3, the different scenarios are defined and detailed information about the used model and network is given. In this section, the simulation results are discussed and, finally, in Section 4, the conclusions are drawn.

2. Control Strategies Description

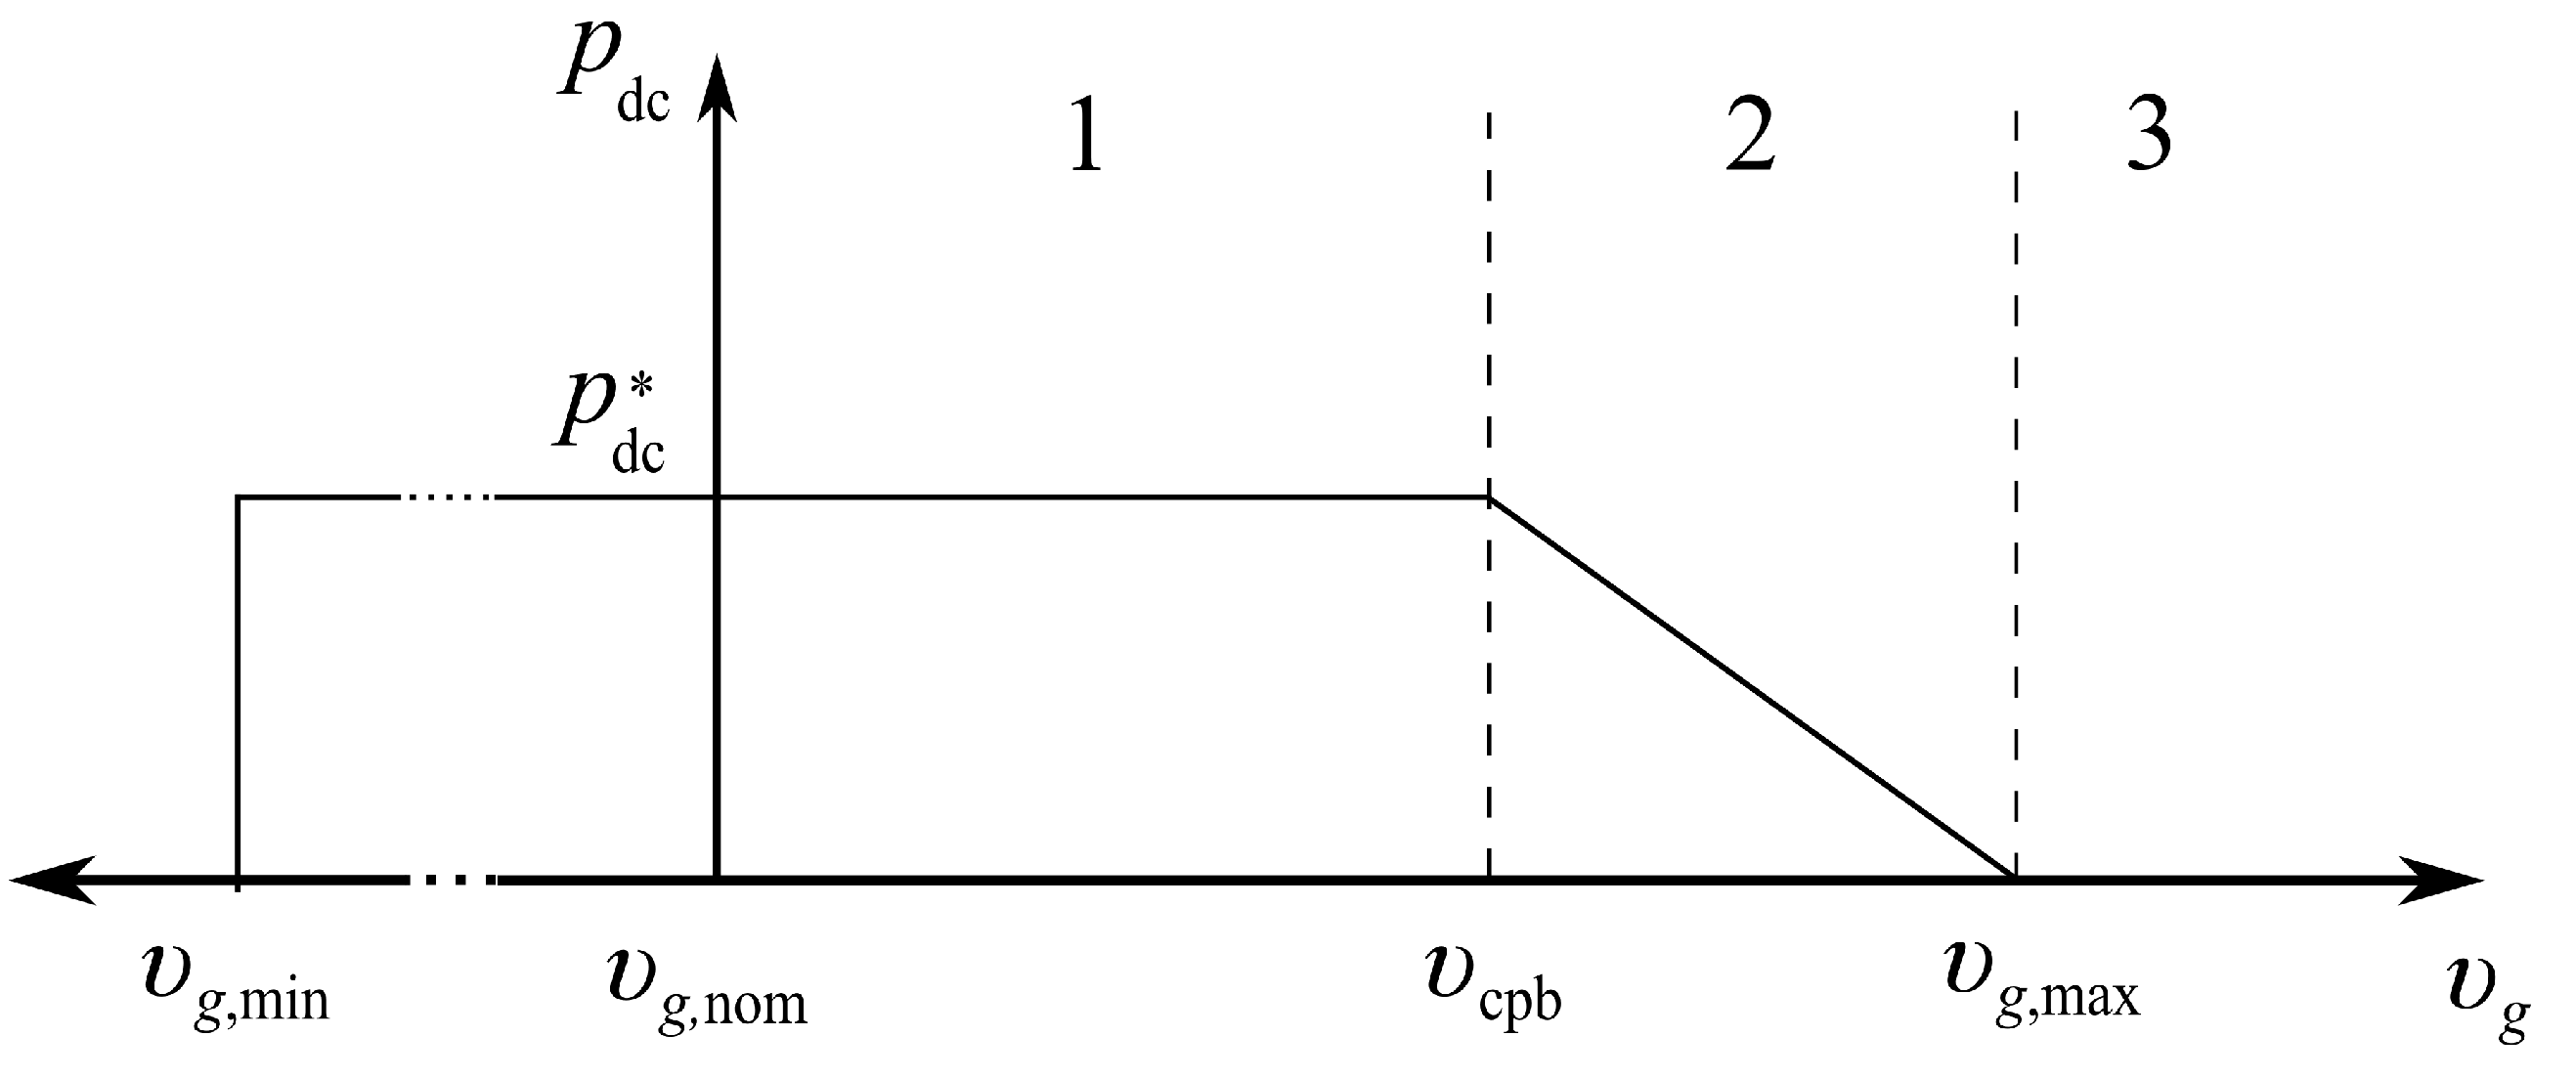
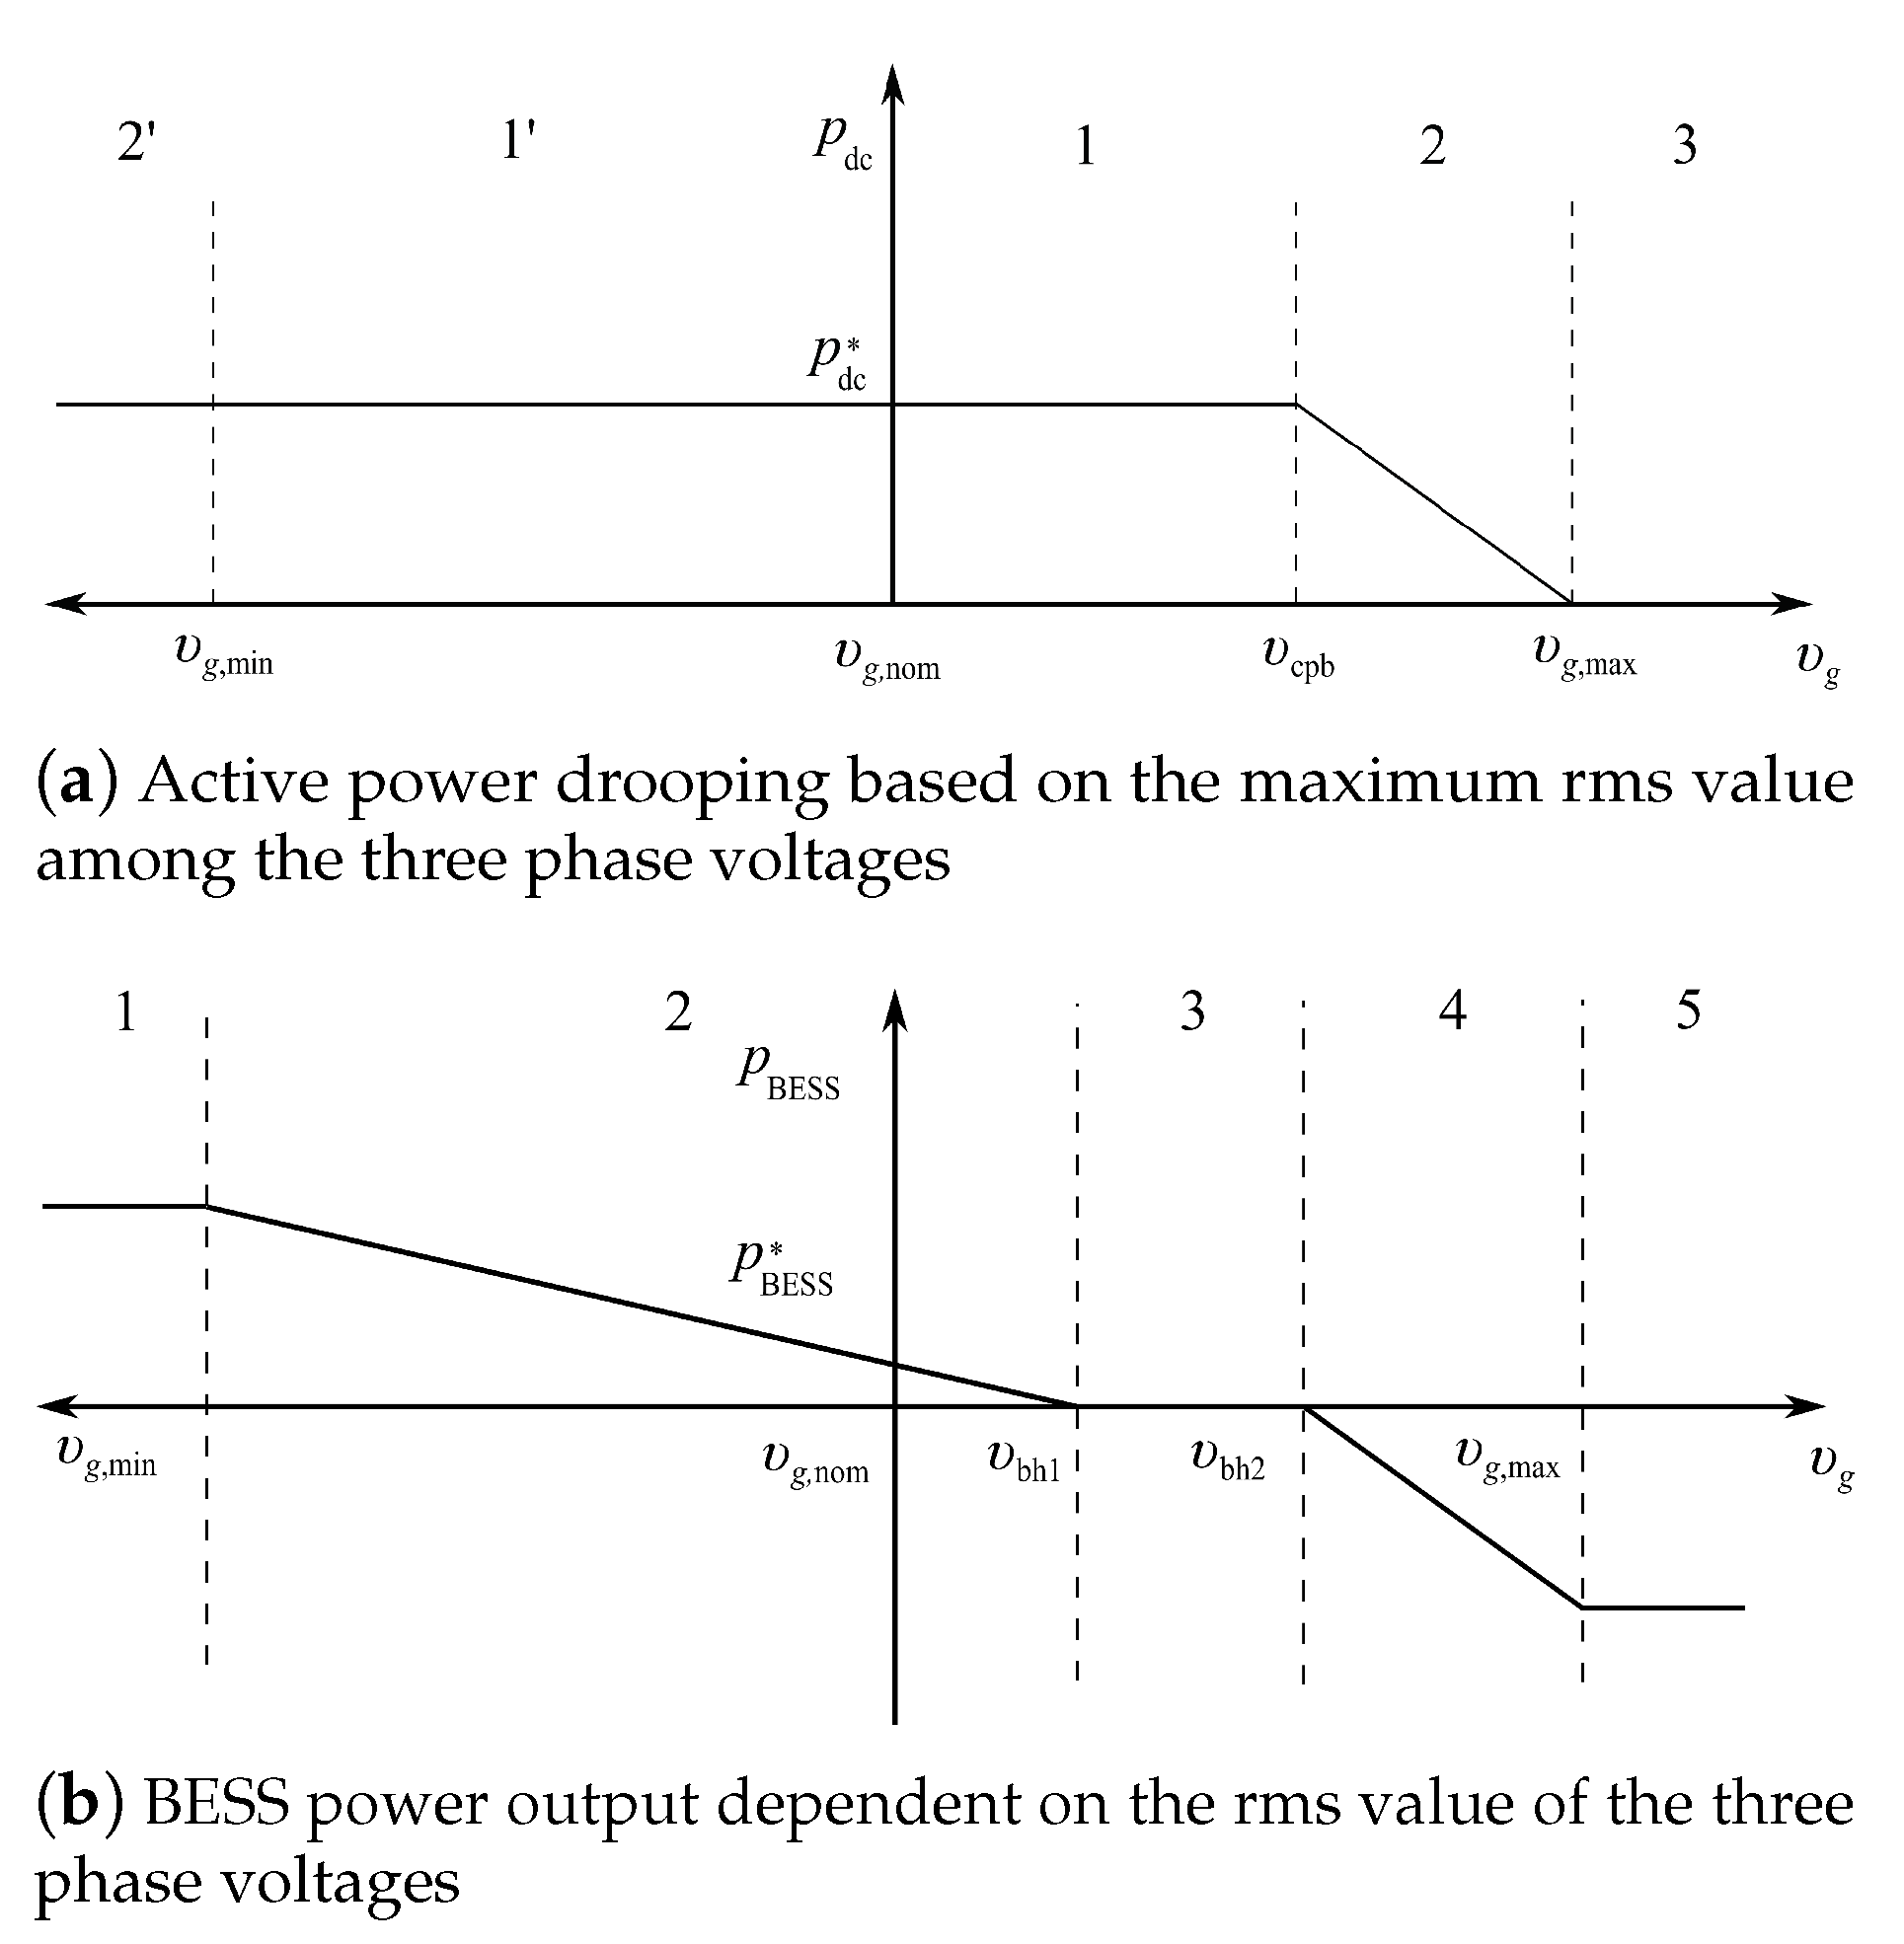
2.1. Active Power Drooping

During periods of peak generation in combination with low loading levels, some feeders may suffer from overvoltages and voltage unbalance problems. Consequently, some of the DRES must be turned off, which is known as hard active power curtailment. Eventually, this leads to loss of renewable energy and financial loss for the prosumer. An appropriate solution for this problem is the active power drooping. This solution also curtails active power, but it does not disconnect the DRES entirely. The active power curtailment, in combination with the positive-sequence and the three-phase damping control strategies, is implemented in [18] and it relies on local measurements such as voltages and currents at the inverter terminals. Thus, the necessity of communication between the different DRES that are connected in the same network could be avoided. Based on these measurements, an appropriate active power curtailment is applied such that the DRES is still connected to the grid and renewable energy is being injected into it, but, most importantly, the quality of the power is not deteriorated. Some of the outcomes of the project INCREASE [19] are published in [20] and the results revealed that the soft active power curtailment is able to increase the energy yield with 50% compared to the hard active power curtailment. Therefore, in order to prevent overvoltages and maximise the renewable energy penetration, without introducing a secondary level control such as coordinated and multi-agent systems, the active power drooping is a preferable solution due to its simplicity, effectiveness and reliability.
This droop controller measures the root mean square (rms) values of the grid voltages and uses the maximum one among the three-phase voltages and this value is used as the input of the droop function as shown in Figure 1. If | v g | is in region 1, the droop controller allows the DRES to inject all available power provided by the primary source. The first region ranges from the nominal grid voltage v g , nom to the constant power band voltage v cpb . Region 2 ranges from v cpb to the maximum allowable grid voltage v g , max and droops the injected active power in a linear way. If the grid voltage is above v g , max , then the DRES is being disconnected from the grid and all renewable power is curtailed. The droop controller can be described mathematically by the following piecewise linear function:
p dc = 0 , if | v g | < v g , min , p dc * , if | v g | v cpb , p dc * 1 | v g | v cpb v g , max v cpb , if v cpb < | v g | v g , max , 0 , if | v g | > v g , max .
In this work, it is assumed that the power electronic inverter has an efficiency of 100% and then the available power on the direct current (DC) side is equal to the injected power on the alternating current (AC) side, hence, p dc * = p ac . Index “*” denotes the available power on the DC side which can vary from 0 to p dc , nom depending on the delivered power by the primary source (photovoltaic system, wind turbine, small combined heat power (CHP) etc.). To comply with EN50160 [21], parameters v g , min and v g , max are usually set to 0.9 and 1.1 p.u., respectively. The conditioning algorithm that ensures maximum power harvesting called a maximum power point tracking algorithm is also neglected because it is out of the scope of this work.

2.2. Controller for the Battery Energy Storage System

The BESS controller is an important part of the DRES and it has an enormous impact of the overall performance of the total system. Some of the most important aspects of this controller are to maintain the storage elements in good condition, control the state-of-charge and also source or sink power when requested by DRES [22,23]. The requested power from BESS occurs when some specific circumstances are present. In literature, there are different control strategies developed for BESS based on different parameters. In [16,24], two BESS strategies are proposed where the decision of storing or sourcing the energy is based on the available power from the primary source meaning that, above a certain value of the peak power, BESS is charged and vice versa if the power is below a certain value. The drawback of this solution is overusing the BESS in times even when the grid voltages are within limits. In [25], a control strategy for BESS is proposed that is based on the grid voltage measurements and the battery is charged based on a certain voltage threshold. However, in reference, the voltage threshold when BESS is charging and discharging is chosen to be 1.00 p.u. which vary, and a three-phase balanced grid is also examined. Nevertheless, the three-phase four-wire LV feeders are unbalanced by nature due to asymmetrical loading by single-phase customers and also single-phase DRES. This implies that a controller based on the power of the primary source would be more suitable. As mentioned above, these types of control are less effective. In [18], a droop controller is examined under unbalanced conditions and the results show that a better practice is to use the maximum rms value among the phase voltages and use this value to calculate the necessary active power drooping. Hence, in this article, the same practice is adopted for the BESS controller.
The battery controller checks whether or not the BESS is able to source or sink the calculated power and this procedure is executed in three major steps. In the first step, the requested battery power is calculated, then the battery power output is calculated based on the requested power and the maximum allowed by BESS. Finally, the state-of-charge (SOC) is calculated and the requested power has been sourced or sunk to the DRES by taking into account the remaining energy in the battery.
As mentioned above, the droop controller relies on local measurements to droop the necessary active power and thus it prevents overvoltages. The same principle is adopted for the BESS controller in this article. Hence, the requested power by the BESS starts with the measurements of the grid voltages which is the first step of the entire procedure. The process can be described with the following linear piecewise function:
p BAT , r = p BAT , max , if | v g | < v g , min , p BAT , max v bh , 1 | v g | v bh , 1 v g , min , if v g , min | v g | v bh , 1 , 0 if v bl , 2 | v g | v bh , 1 , p dc , if v bh , 1 | v g | v max , p BAT , max , if | v g | > v g , max .
If | v g | is lower than the minimum grid voltage v g , min , the calculated battery output is equal to the maximum battery power ( p BAT , max ) that BESS is able to deliver (source). If the grid voltage is between v g , min and the lower threshold of the discharge range v bh , 1 , the calculated power is within the linear zone of the discharge region. The battery power output is 0 when the grid voltage is within the lower ( v bh , 1 ) and upper ( v bh , 2 ) thresholds of the BESS controller. When | v g | is greater than v bh , 2 and lower than the maximum grid voltage v g , max , the droop controller is activated and the drooped power is used to charge the battery. In this case study, v bh , 2 is chosen to be equal to v cpb . Since in this region the battery is charged, then the sign of the battery output power becomes negative. In the last region, | v g | is greater than v g , max and, therefore, all the energy available from the primary source is being drooped. Hence, the battery output power is negative and equals the maximum battery power ( p BAT , max ) that is allowed to charge the BESS.
In the second stage of the BESS controller, the battery power output is calculated based on the requested power, the maximum allowed power by the BESS and also the nominal power of the DRES:
p BAT , o = min ( p dc p dc * , p BAT , r ) if p BAT , r + p dc * > p dc and p BAT , r > 0 , p BAT , r if p BAT , r + p dc * < p dc and p BAT , r > 0 , max ( p BAT , max , p BAT , r , p dc * ) if p BAT , r < 0 .
If the battery power request p BAT , o is positive, then a check is done if the sum of p BAT , r plus the available power p dc * is greater than the nominal power p dc . If this statement is true, then the minimum between the remainder to the nominal power and the p BAT , r is selected. When the sum of the available power p dc * and p BAT , r is lower than p dc , then the battery power output is equal to the requested power p BAT , r . These two checks are performed when power is being injected into the BESS. In case of power sourcing from BESS to DRES, a check is performed between the maximum charging power of BESS, the requested power p BAT , r and the available power on the DC side. The checks are performed in order to deal with the constraints imposed by the power ratings of the power electronic converter and inverter embedded in BESS and DRES, respectively.
In the final stage, the exchanged power p BAT of the BESS and the DRES is calculated, based on the SOC and requested battery output power:
p BAT = max ( p BAT , o , p BAT , max ) if SOC p BAT , o η Δ t C BAT < 1 . 0 , ( 1 SOC i 1 ) * C BAT Δ if SOC i p BAT , o η Δ t C BAT 1 . 0 , min ( ( p dc p dc * ) , p BAT , o ) if p BAT , o + p dc * > p dc and p BAT , o > 0 , p BAT , o if p BAT , o + p dc * < p dc and p BAT , o > 0 ,
where η is the charge and discharge efficiency of the BESS, C BAT is the capacity of BESS, Δ t is the time between the samples of BESS controller or the time between the load and solar profile measurements which is 15 min, SOC i is the current value of the state-of-charge and SOC i 1 is the previous state of it. The SOC is calculated as follows:
S O C i = S O C i 1 + 0 Δ t p BAT · η dt .
In this stage, the SOC is checked and the battery controller ensures that the minimum and maximum battery charge is in between 20% and 100%. Furthermore, if p BAT is positive, the storage will only be discharged until 80% or 50% depth of discharge (DoD), whether it is morning or afternoon, respectively. This distinction is made to ensure that in the evening enough energy remains in BESS that can be used during the morning peak load. Therefore, the initial condition of the SOC at midnight is 50%.
Finally, the used curves of the droop and BESS controller are depicted in Figure 2a,b, respectively. When | v g | is greater than v g , nom , the used droop controller behaves as the one shown in Figure 1 and described by (1). Region 1’ and 2’ are active if the grid voltage is lower than v g , nom and v g , min , respectively. In this region, the control strategy tries to support the grid voltage by consuming energy from BESS plus the primary source and injecting it into the grid. Note that, in the first quadrant, the droop takes into account the maximum among the phase voltages to prevent overvoltages in any phase, while in quadrant IV the droop is driven by the minimum of the rms value phase voltages to prevent undervoltages. This controller is then described by using the following linear piecewise function:
p dc = p dc * + p BAT , if | v g | v bh , 1 , p dc * , if v bh , 1 < | v g | v cpb , p dc * 1 | v g | v cpb v g , max v cpb , if v cpb < | v g | v g , max , 0 , if | v g | > v g , max .
In [14], the drooping point value (in this article called constant power power band) is chosen to be 1.04 p.u. and maximum active power curtailment is applied when the grid voltage is above 1.05 p.u. These values will almost lead to a constant active power curtailment considering the fact that the initial settings of the MV/LV transformers are set to similar levels. In [18], a value for v cpb of 1.06 p.u. is investigated and obtained results show that such a value is more suitable if used in droop curves when DRES are equipped with the positive-sequence control strategy and a droop controller.
The BESS controller is depicted in Figure 2b. In region 1, the grid voltage | v g | is lower than v g , min and maximum battery power is requested. Region 2 is active if the grid voltage | v g | is between v g , min and v bh , 1 . In this region, power is also requested from BESS, but it is associated with the grid voltage | v g | and, as can be seen from (2), a positive power has been requested from BESS. Region 3 ranges from v bh , 1 to v bh , 2 and zero power is requested if | v g | falls within this interval. As can be seen from (2), a negative power will be requested if the grid voltage is in region 4. Droop parameter v bh , 2 is chosen to be equal to v cpb thus the BESS is charged only when active power is drooped to prevent overvoltages. Finally, maximum power is being consumed by BESS if the grid voltage is above v g , max . Note that this controller takes into account the maximum among the three-phase voltages when BESS is charged to prevent overvoltages, in order to prevent undervoltages, the minimum rms voltage value is chosen if the BESS is discharged.
To improve the grid efficiency, the droop and BESS controller parameters could be set to different values depending on the grid properties. Moreover, a secondary layer of control could use forecasts to adjust these values and thus further improve the grid performance. However, this requires a secondary level of control that sets these parameters for the different DRES individually, which is not the scope of this work.

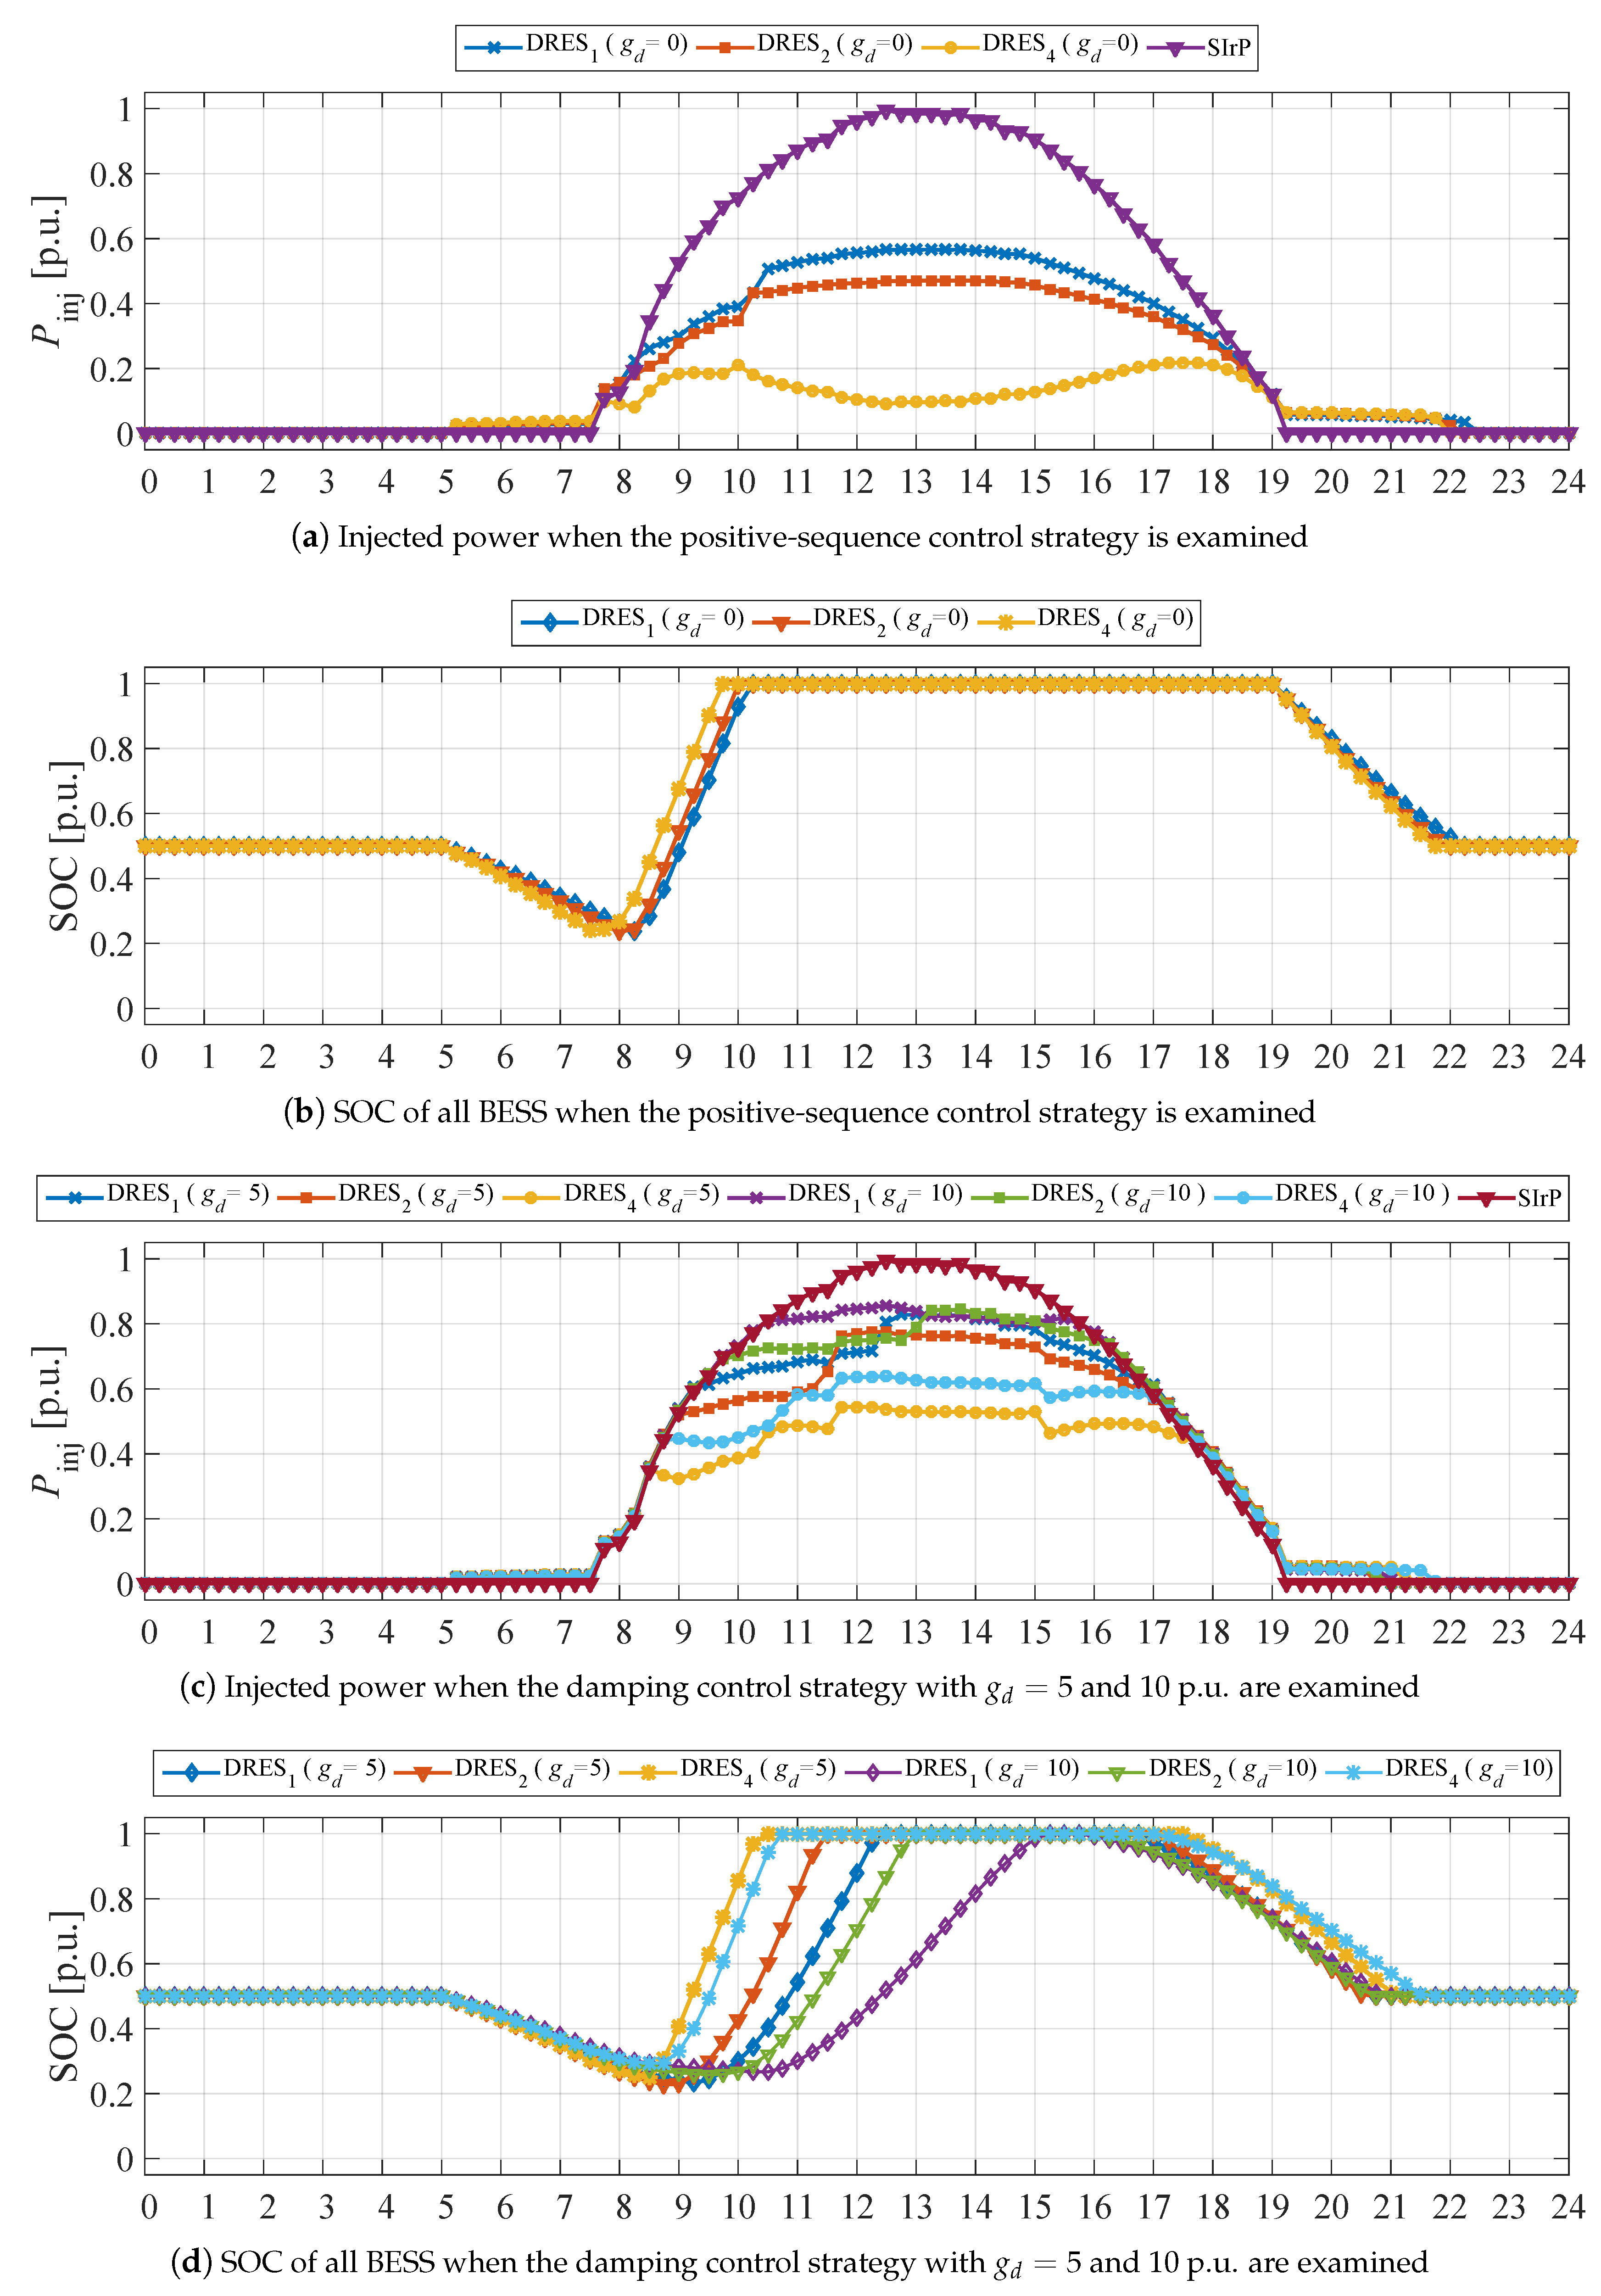
2.3. Positive-Sequence Control Strategy

The most common practice for controlling three-phase inverter-connected DRES to the distribution grid is done by exchanging only positive-sequence current. This comes from the fact that most of the three-phase angle detection techniques are based on phase locked loop (PLL) algorithms using a synchronous reference frame [26]. In other words, the three-phase PLLs use a coordinate transformation from a b c to dq [27] and, therefore, the output signals of these PLLs have phase angles corresponding to the positive-sequence component of the grid voltage [27,28,29,30]. An analytical model of the positive-sequence control strategy can then be obtained as:
i ̲ a = 1 3 g 1 | v a | e j θ a + | v b | e j ( θ b + 2 π 3 ) + | v c | e j ( θ c 2 π 3 ) ,
i ̲ b = 1 3 g 1 | v b | e j θ b + | v a | e j ( θ a 2 π 3 ) + | v c | e j ( θ c + 2 π 3 ) ,
i ̲ c = 1 3 g 1 | v c | e j θ c + | v a | e j ( θ a + 2 π 3 ) + | v b | e j ( θ b 2 π 3 ) ,
where v x and θ x are the respective phase voltages and angles and g 1 is the fundamental input conductance of the inverter. The later ensures the power balance between the AC and the DC side and it is calculated by using the following equation:
g 1 = 3 p dc * | v ̲ x | 2 + 2 x y | v x | | v y | cos ( θ x θ y 2 π 3 ) .
Additional information about the fundamental conductance and its mathematical extraction can be found in [6,18].

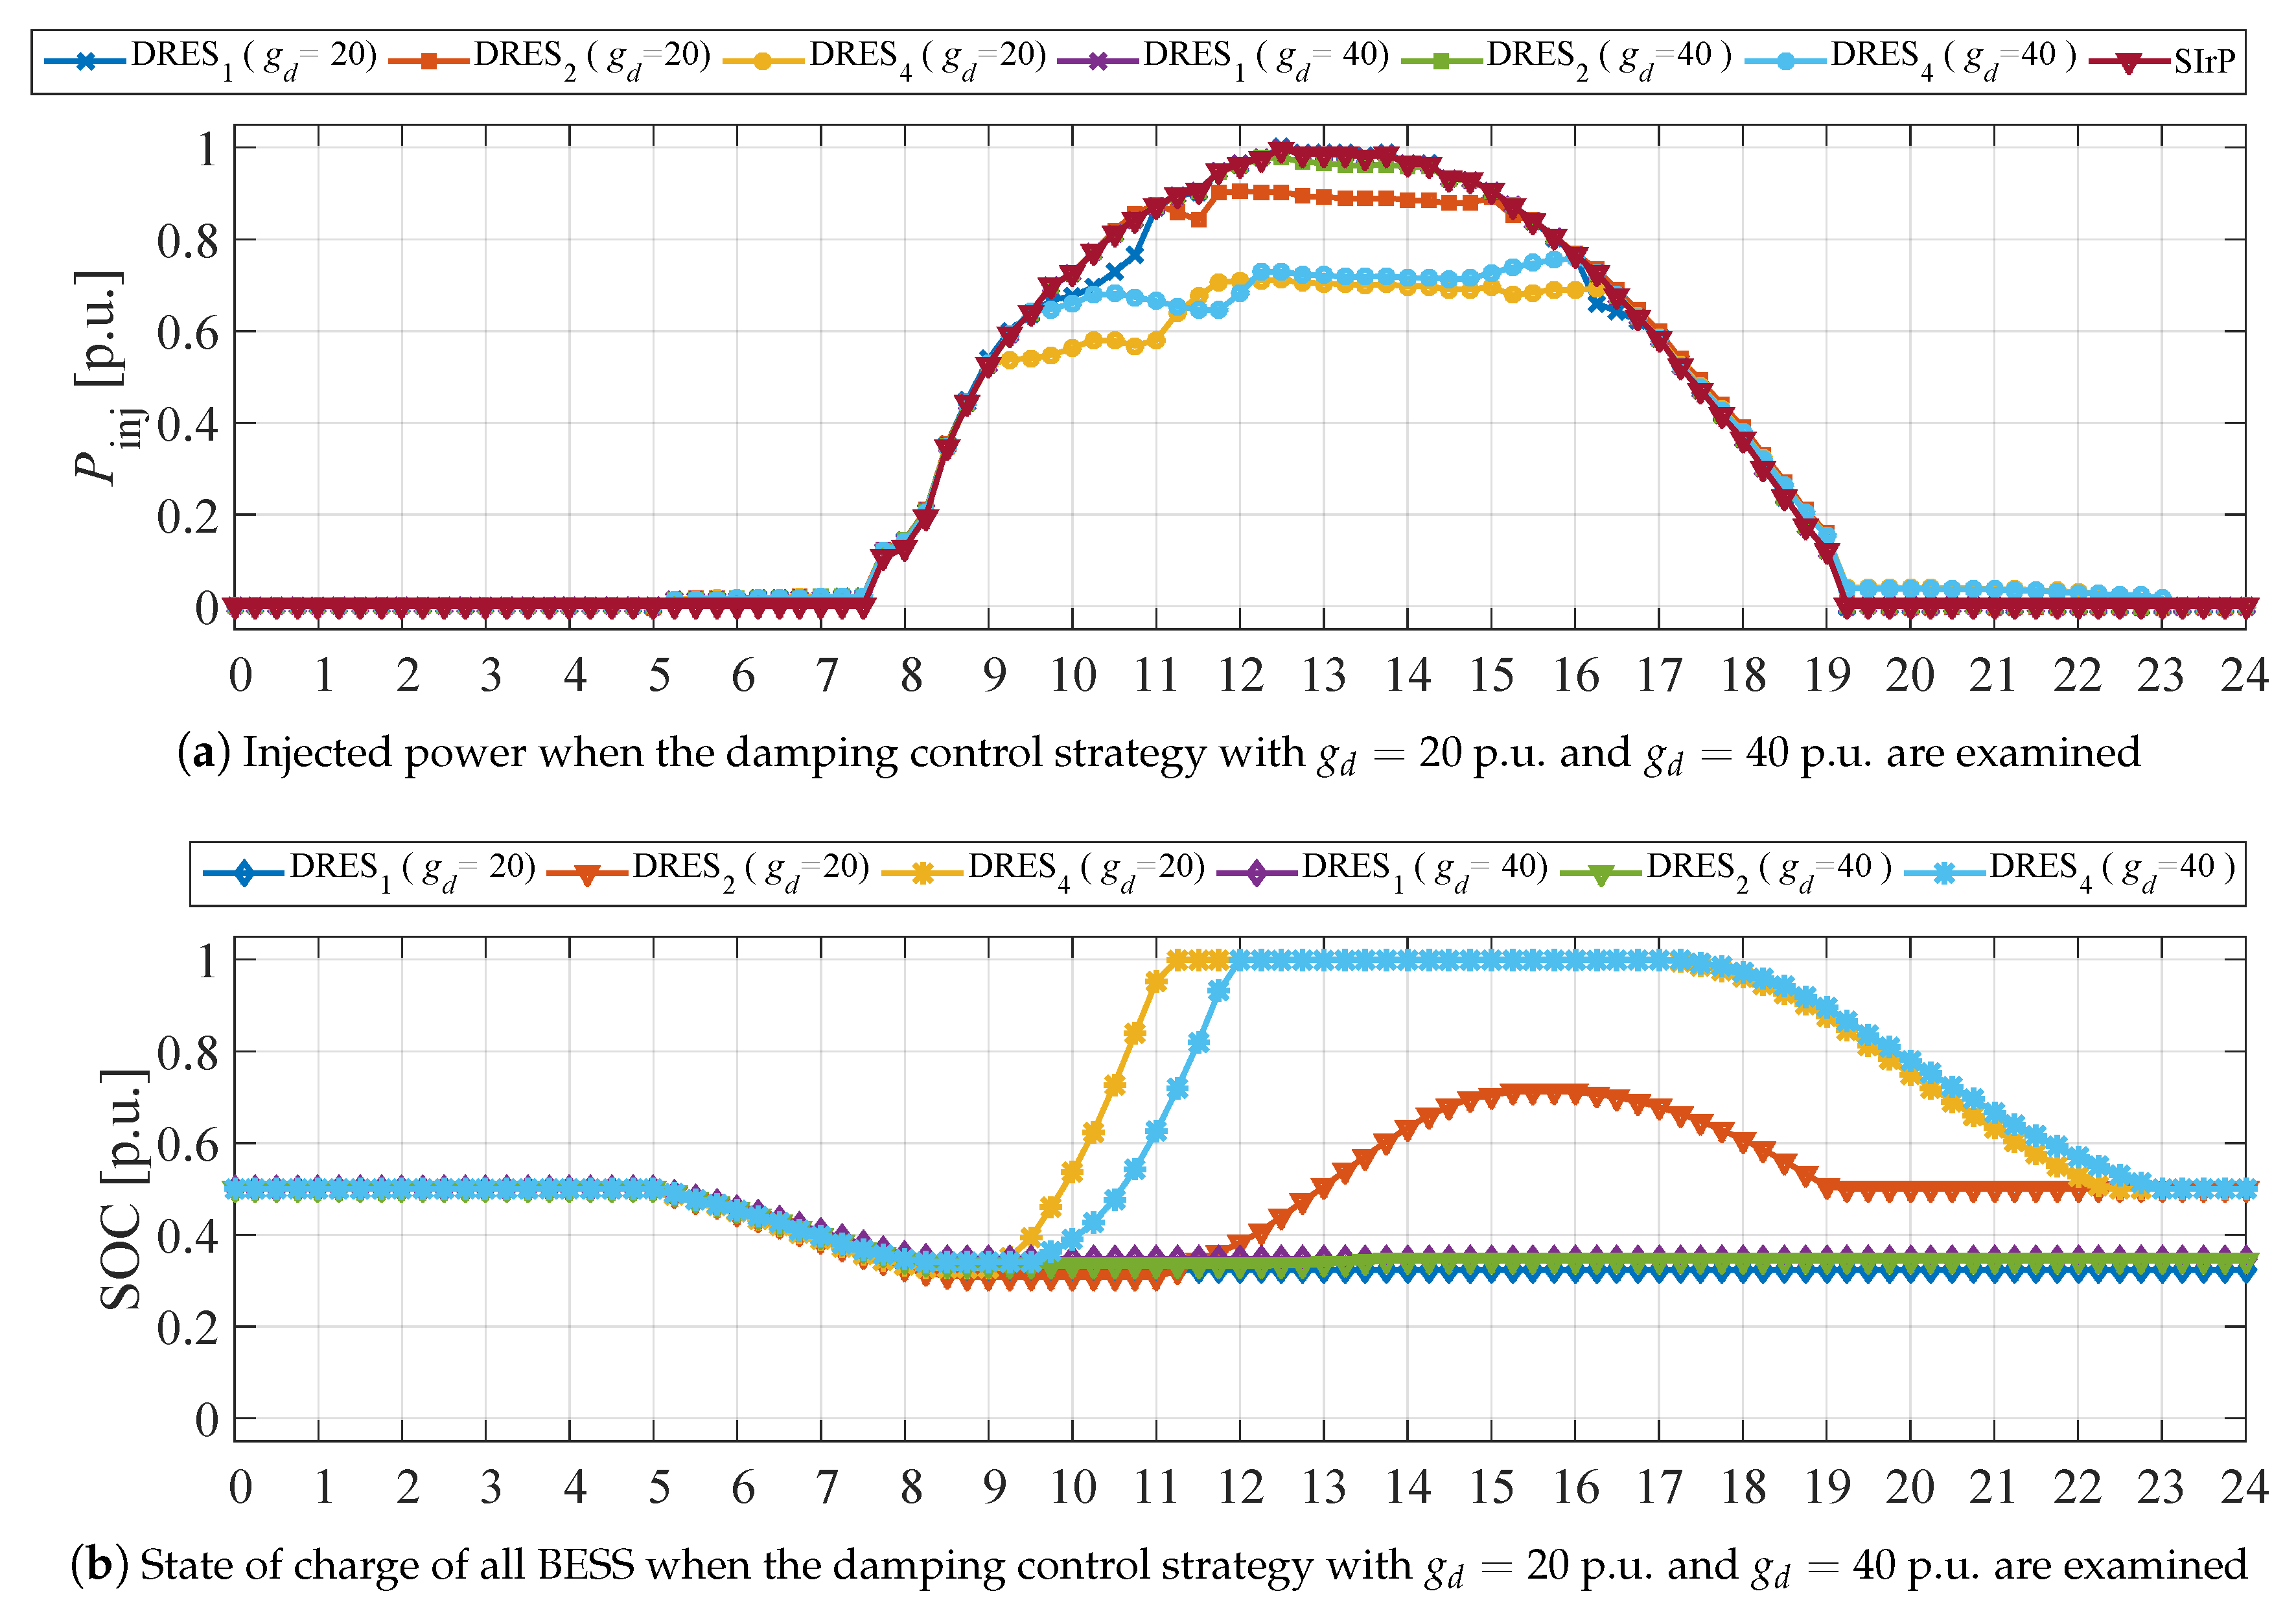
2.4. Three-Phase Damping Control Strategy

The second most common problem in areas with high penetration of renewable energy resources is the voltage unbalance in three-phase LV grids. Usually, the three-phase DRESs are connected via a three-phase three-wire connection and inject only positive-sequence currents. Even if these DRESs would have been equipped with voltage unbalance mitigation control strategies, then they would have been able to impact only the negative-sequence component due to the three-wire interface. Furthermore, Ref. [21] recommends only limits to the negative voltage unbalance factor which is the ratio of the negative to positive-sequence components. Nevertheless, the zero-sequence component has a huge impact on the penetration of DRES, especially when asymmetrical loading and current injection are involved. The three-phase damping control strategy studied in [18,31,32] is able to successfully mitigate the voltage unbalance at the point of common coupling (PCC). The idea behind the three-phase damping control strategy is as follows: the desired reaction of the three-phase damping control strategy is to behave resistively towards the zero- and negative-sequence voltage components in LV networks [31,33,34]. The currents injected by the damping control strategy can be described mathematically by the following set of equations:
i ̲ a = 1 3 g 1 | v a | e j θ a + | v b | e j ( θ b + 2 π 3 ) + | v c | e j ( θ c 2 π 3 ) + g d 2 | v a | e j θ a | v b | e j ( θ b + 2 π 3 ) | v c | e j ( θ c 2 π 3 ) ,
i ̲ b = 1 3 g 1 | v b | e j θ b + | v a | e j ( θ a 2 π 3 ) + | v c | e j ( θ c + 2 π 3 ) + g d 2 | v b | e j θ b | v a | e j ( θ a 2 π 3 ) | v c | e j ( θ c + 2 π 3 ) ,
i ̲ c = 1 3 g 1 | v c | e j θ c + | v a | e j ( θ a + 2 π 3 ) + | v b | e j ( θ b 2 π 3 ) + g d 2 | v c | e j θ c | v a | e j ( θ a + 2 π 3 ) | v b | e j ( θ b 2 π 3 ) ,
where g d is the fundamental damping conductance of the inverter which has an opposite sign of g 1 in case of power injection into the grid. The terms related to g 1 can be interpreted as the steady-state value of the fundamental component of the injected current. These terms are adapted by the DC bus-voltage controller in order to balance the power exchanged with the grid. Since the bus voltage controller is slow, g 1 is slowly varying. The terms related to g d emulate the resistive behaviour towards the zero- and negative-sequence voltage components. More information about the derivation of the three-phase damping control strategy can be found in [18].
In practice, the power balance between the DC side and the utility grid is maintained by using a DC-bus controller, the output of which is the fundamental conductance g 1 of the voltage source inverter (VSI) [35]. In order to incorporate the input conductance into a simulation model, the following equation for the power balance can be used:
g 1 = 3 p dc * | v ̲ x | 2 + 2 x y | v x | | v y | cos ( θ x θ y 2 π 3 ) 2 g d | v ̲ x | 2 x y | v x | | v y | cos ( θ x θ y 2 π 3 ) | v ̲ x | 2 + 2 x y | v x | | v y | cos ( θ x θ y 2 π 3 ) .
The term of the positive-sequence fraction is directly related to the exchanged active power with the grid and the term determined by the second fraction compensates also for the power of the zero-sequence and the negative-sequence components [31]. This control strategy mitigates the voltage unbalance by injecting higher currents in the phase with lower voltage and lower current in the phase with higher voltage. The damping capabilities of this control strategy are determined by the damping conductance g d which can be calculated by using the nominal ratings of the DRES:
G d = P DC nom V nom 2 ,
where P DC nom is the nominal power of the inverter and V nom is the nominal grid voltage. In a p.u. system, the damping conductance is expressed as:
g d = P nom / P DC base V nom 2 / V base 2 ,
where P base is the base power of the power electronic inverter and V base is the base value of the grid voltage. From Equation (9), it can be seen that the value of the damping conductance plays an important role in the resistive behaviour towards the zero- and the negative-sequence voltage components. In [27,31,33,36,37,38], the authors have used a fixed value of the damping conductance and it was chosen to be 1 p.u. Therefore, further investigation of the value of this parameter can be made in order to improve the performance of the three-phase damping control strategy. More information about the detailed description of the three-phase damping control strategy can be found in [18,39].

3. Simulation Results

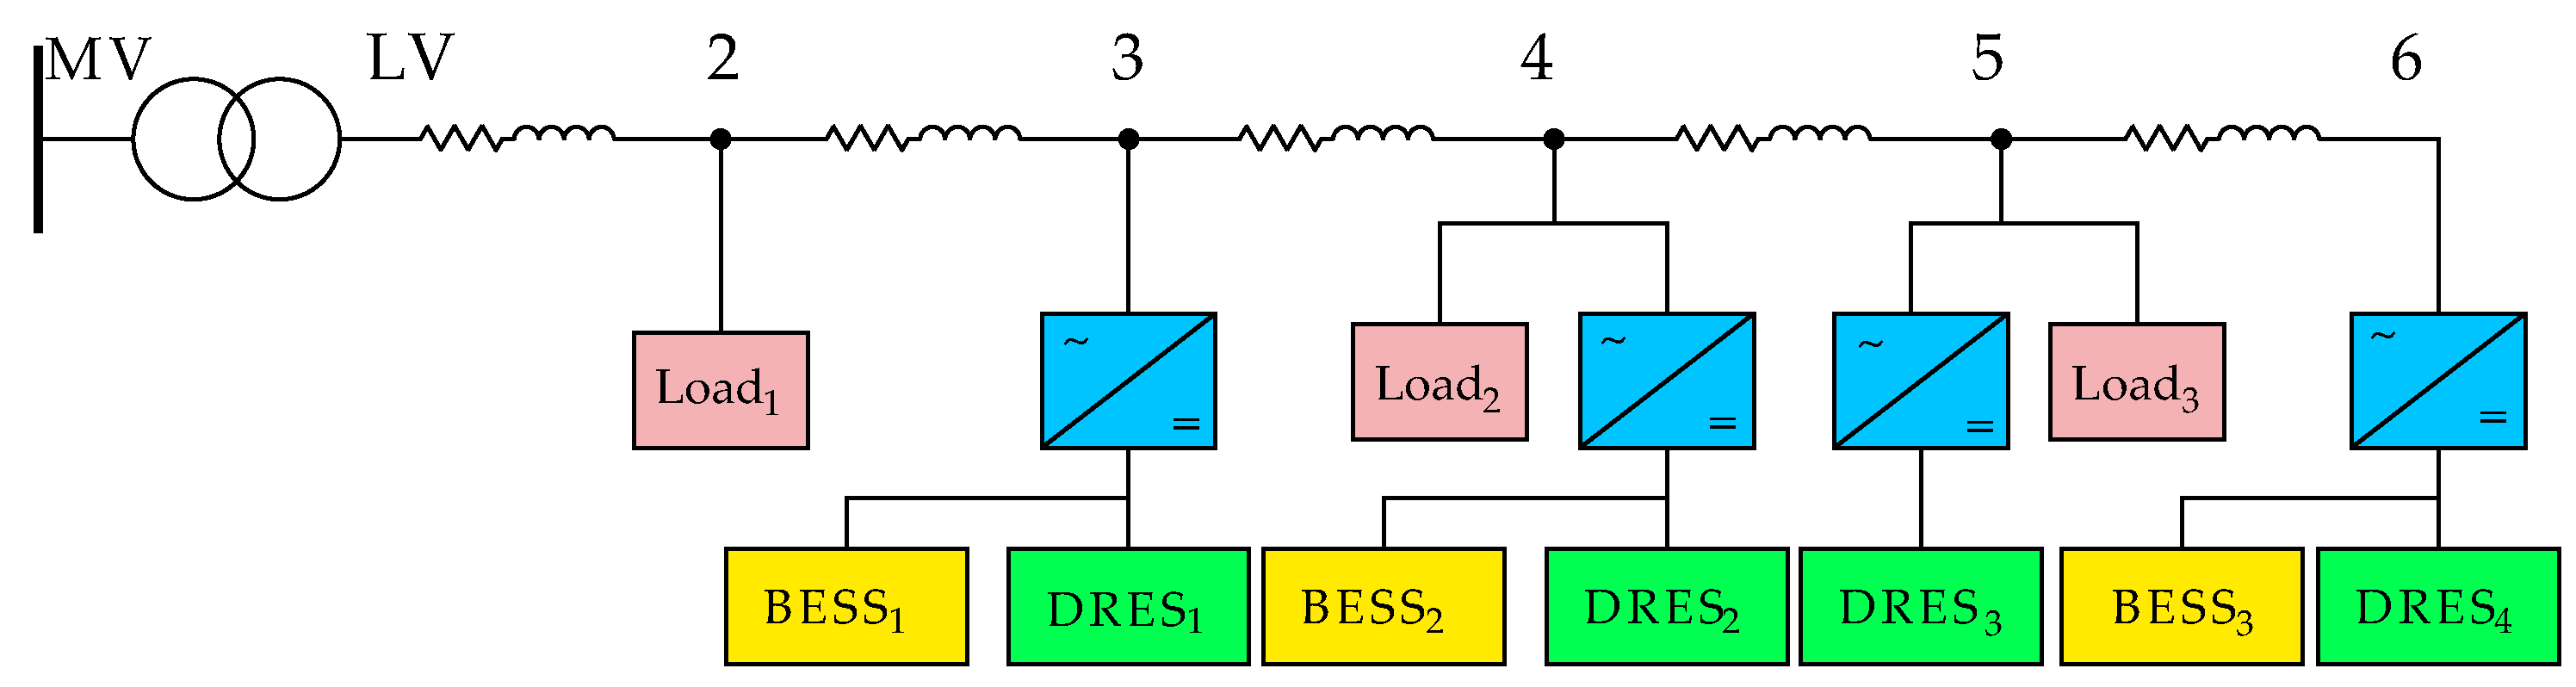
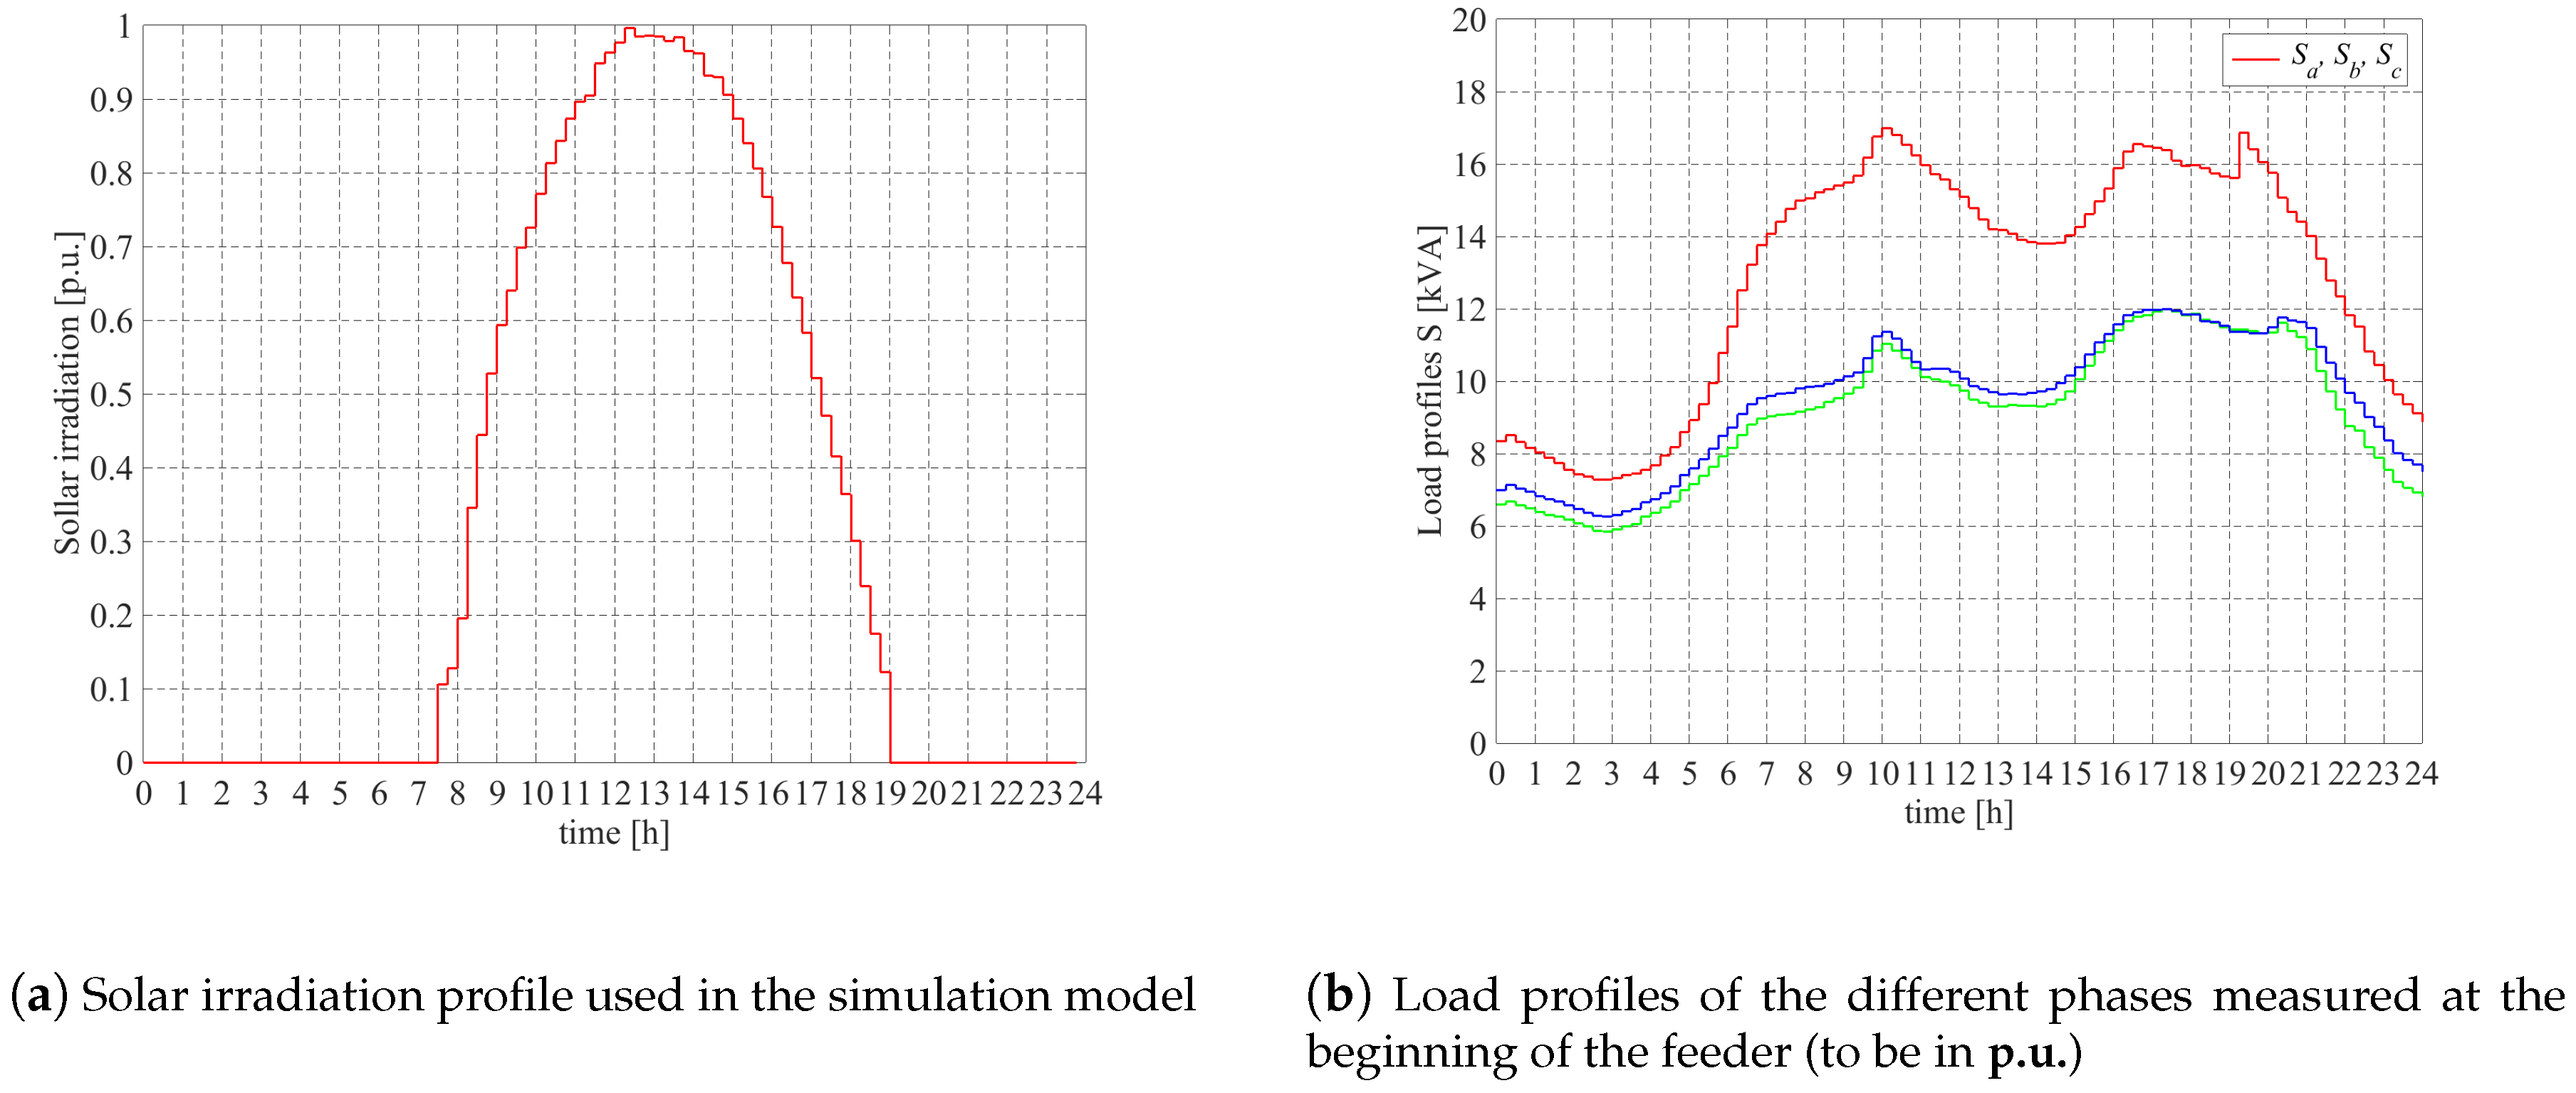
3.1. Model Description

3.1.1. Grid Data

The incorporation of a storage system into the three-phase damping control strategy is tested by means of simulations on an existing feeder, which is shown in Figure 3. This feeder is a small part of an 80 node LV network located in Suha, Slovenia. The MV/LV transformer of Dyn type and it has a nominal power of 250 kVA, short circuit voltage of 4% while the no load losses are 325 W and 3250 W, respectively. The primary and secondary nominal voltages are 20 kV and 0.4 kV, respectively. The voltages at the secondary side are set to be 1.04 p.u., which is a typical setting used by the DSO in order to avoid undervoltages to the most remote customers when high loading conditions are present. The zero- and positive-sequence impedances of the cables in the feeder as well as their lengths are listed in Table 1.

3.1.2. DRES, BESS and Load Data

In this article, four DRESs are considered to be connected to the LV feeder and their nominal powers are as listed in Table 2 and the load data are listed in Table 3. The rated power of all DRES is chosen such that overvoltages occur at the feeder if maximum renewable generation is present and the classical positive-sequence control strategy is employed in all DRESs. Thus, no further penetration of other DRES is possible. All DRESs are chosen to have the same power ratings. This decision, although arbitrary, will help to better illustrate and assess the effect of the power drooping and BESS impact on the total renewable energy loss. DRESs with rated power above 5 kW are three-phase connected and equipped with active power drooping and BESS. One of the test cases is formed when the classical positive-sequence control strategy is equipped in all three-phase DRES and this test case is used as the reference one.
A BESS with 25% of the peak power of the DRES is proposed in [40]; however, this capacity is too small when high penetration of renewables is present. In [41], a small BESS is incorporated in single-phase residential PV installations in an LV grid of 30 nodes. By using synthetic load and irradiation profiles, a probability study is performed to estimate the occurrence of overvoltages. The results showed that a capacity of about 4/5 of the peak power is needed to overcome the overvoltages. A large network is studied in [42] and it consists of 52 customers and in each one a 5.2 kWp PV system is installed. All PV installations are connected via three-phase inverters and the authors consider the grid to be balanced. However, the results of the conducted examinations showed that the capacity of BESS, needed to prevent overvoltages in a grid with 50% penetration of renewables, should be equal to the peak power of the PV system and almost five times capacity is needed if 100% renewable penetration is present.
In addition, the positive-sequence control and the three-phase damping control strategies are tested without a BESS which forms the reference case C0. As of the storage, two different storage capacities are examined as listed in Table 2. Case study C1 (i) is defined when Tesla PowerWall 1.0 DC is used, which has the ability to source and sink 3.3 kW and it has a maximum capacity of 7 kWh. Case study C2 (ii) uses one TeslaWall 2.0 DC system. According to [43], these systems have a round trip efficiency of 91%. These capacity values give ratios of 0.3 to 0.7 with respect to the rated power of the DRESs which is within the range of the values suggested in [41,42]. The positive-sequence control strategy forms the sub-case (S1). Equation (9) shows that the resistive behaviour of the three-phase damping control strategy is dependent on the damping conductance g d . Hence, four different values of the damping conductance g d = 5 , g d = 10 , g d = 20 and g d = 40 p.u. are further investigated which form four additional sub cases S2, S3, S4 and S5, respectively. Analytically speaking, the three-phase damping control strategy is a special case of the positive-sequence control strategy i.e., if g d = 0 p.u., the damping control strategy becomes the positive-sequence control strategy. Therefore, later in the article, g d = 0 p.u. will be used to refer to the positive-sequence control strategy. Finally, the formed cases and sub-cases are compared to a case where the DRES are not equipped with storage. Thus, the performance of the three-phase damping control strategy and the BESS can be assessed individually. In summary, all test cases are presented in Table 4. Note that active power drooping is incorporated into all cases and sub-cases whether or not storage is considered.
The aggregated load profiles that are measured at the terminals of the MV/LV transformer as well as the solar irradiation profile are depicted in Figure 4. Both load and irradiation profiles are measured on a 15 min basis. The apparent power measured at the beginning of the feeder is distributed over the PQ loads based on their power ratings and an asymmetrical load flow simulation is run for each time slot.

3.1.3. Short Description of the Simulink Model

The data of the solar irradiation and load profiles are depicted in Figure 4a,b, respectively. The load profiles are obtained when no DRESs are connected. These data are put in the simulation model as described in [44]. The simulation model that uses MATLAB and Simulink in [20] is a time domain one which is able to solve asymmetrical power flows and it is used to perform the time series simulations in this article. Since the model is a time-domain-based one, the duration of one simulation can vary between 10 to 20 min. Therefore, reducing the simulation time is very important to speed the developed model up. A simulation is ran and when a steady-state regime is achieved, the simulation is stopped automatically and the data are stored in the workspace of MATLAB.

3.1.4. Integration of BESS into DRES

The energy storage unit is considered as a black box which is connected to the DC bus of the DRES. It is characterised only by the listed capacity and round trip efficiency while the behaviour of the power electronic DC–DC converter is neglected. This assumption significantly simplifies the simulation model and the exchanged power with the DC bus is calculated by using Equation (4). These assumptions, although arbitrary, do not deteriorate the accurate representation of the obtained simulation results.
The droop parameters are chosen to be v g , min = 0.9 p.u. v g , max = 1.1 p.u. v cpb = 1.06 p.u. The BESS controller is designed to draw power only if active power drooping is applied; therefore, the upper BESS threshold v bh , 2 is set to be equal to v cpb . In practice, areas with high penetration of DRES usually do not suffer from severe undervoltage problems; hence, the lower threshold v cpb of the BESS controller is set to 1.04 p.u. Zero power is requested from BESS if the grid voltage is within the range of v bh , 1 < v g v bh , 2 .

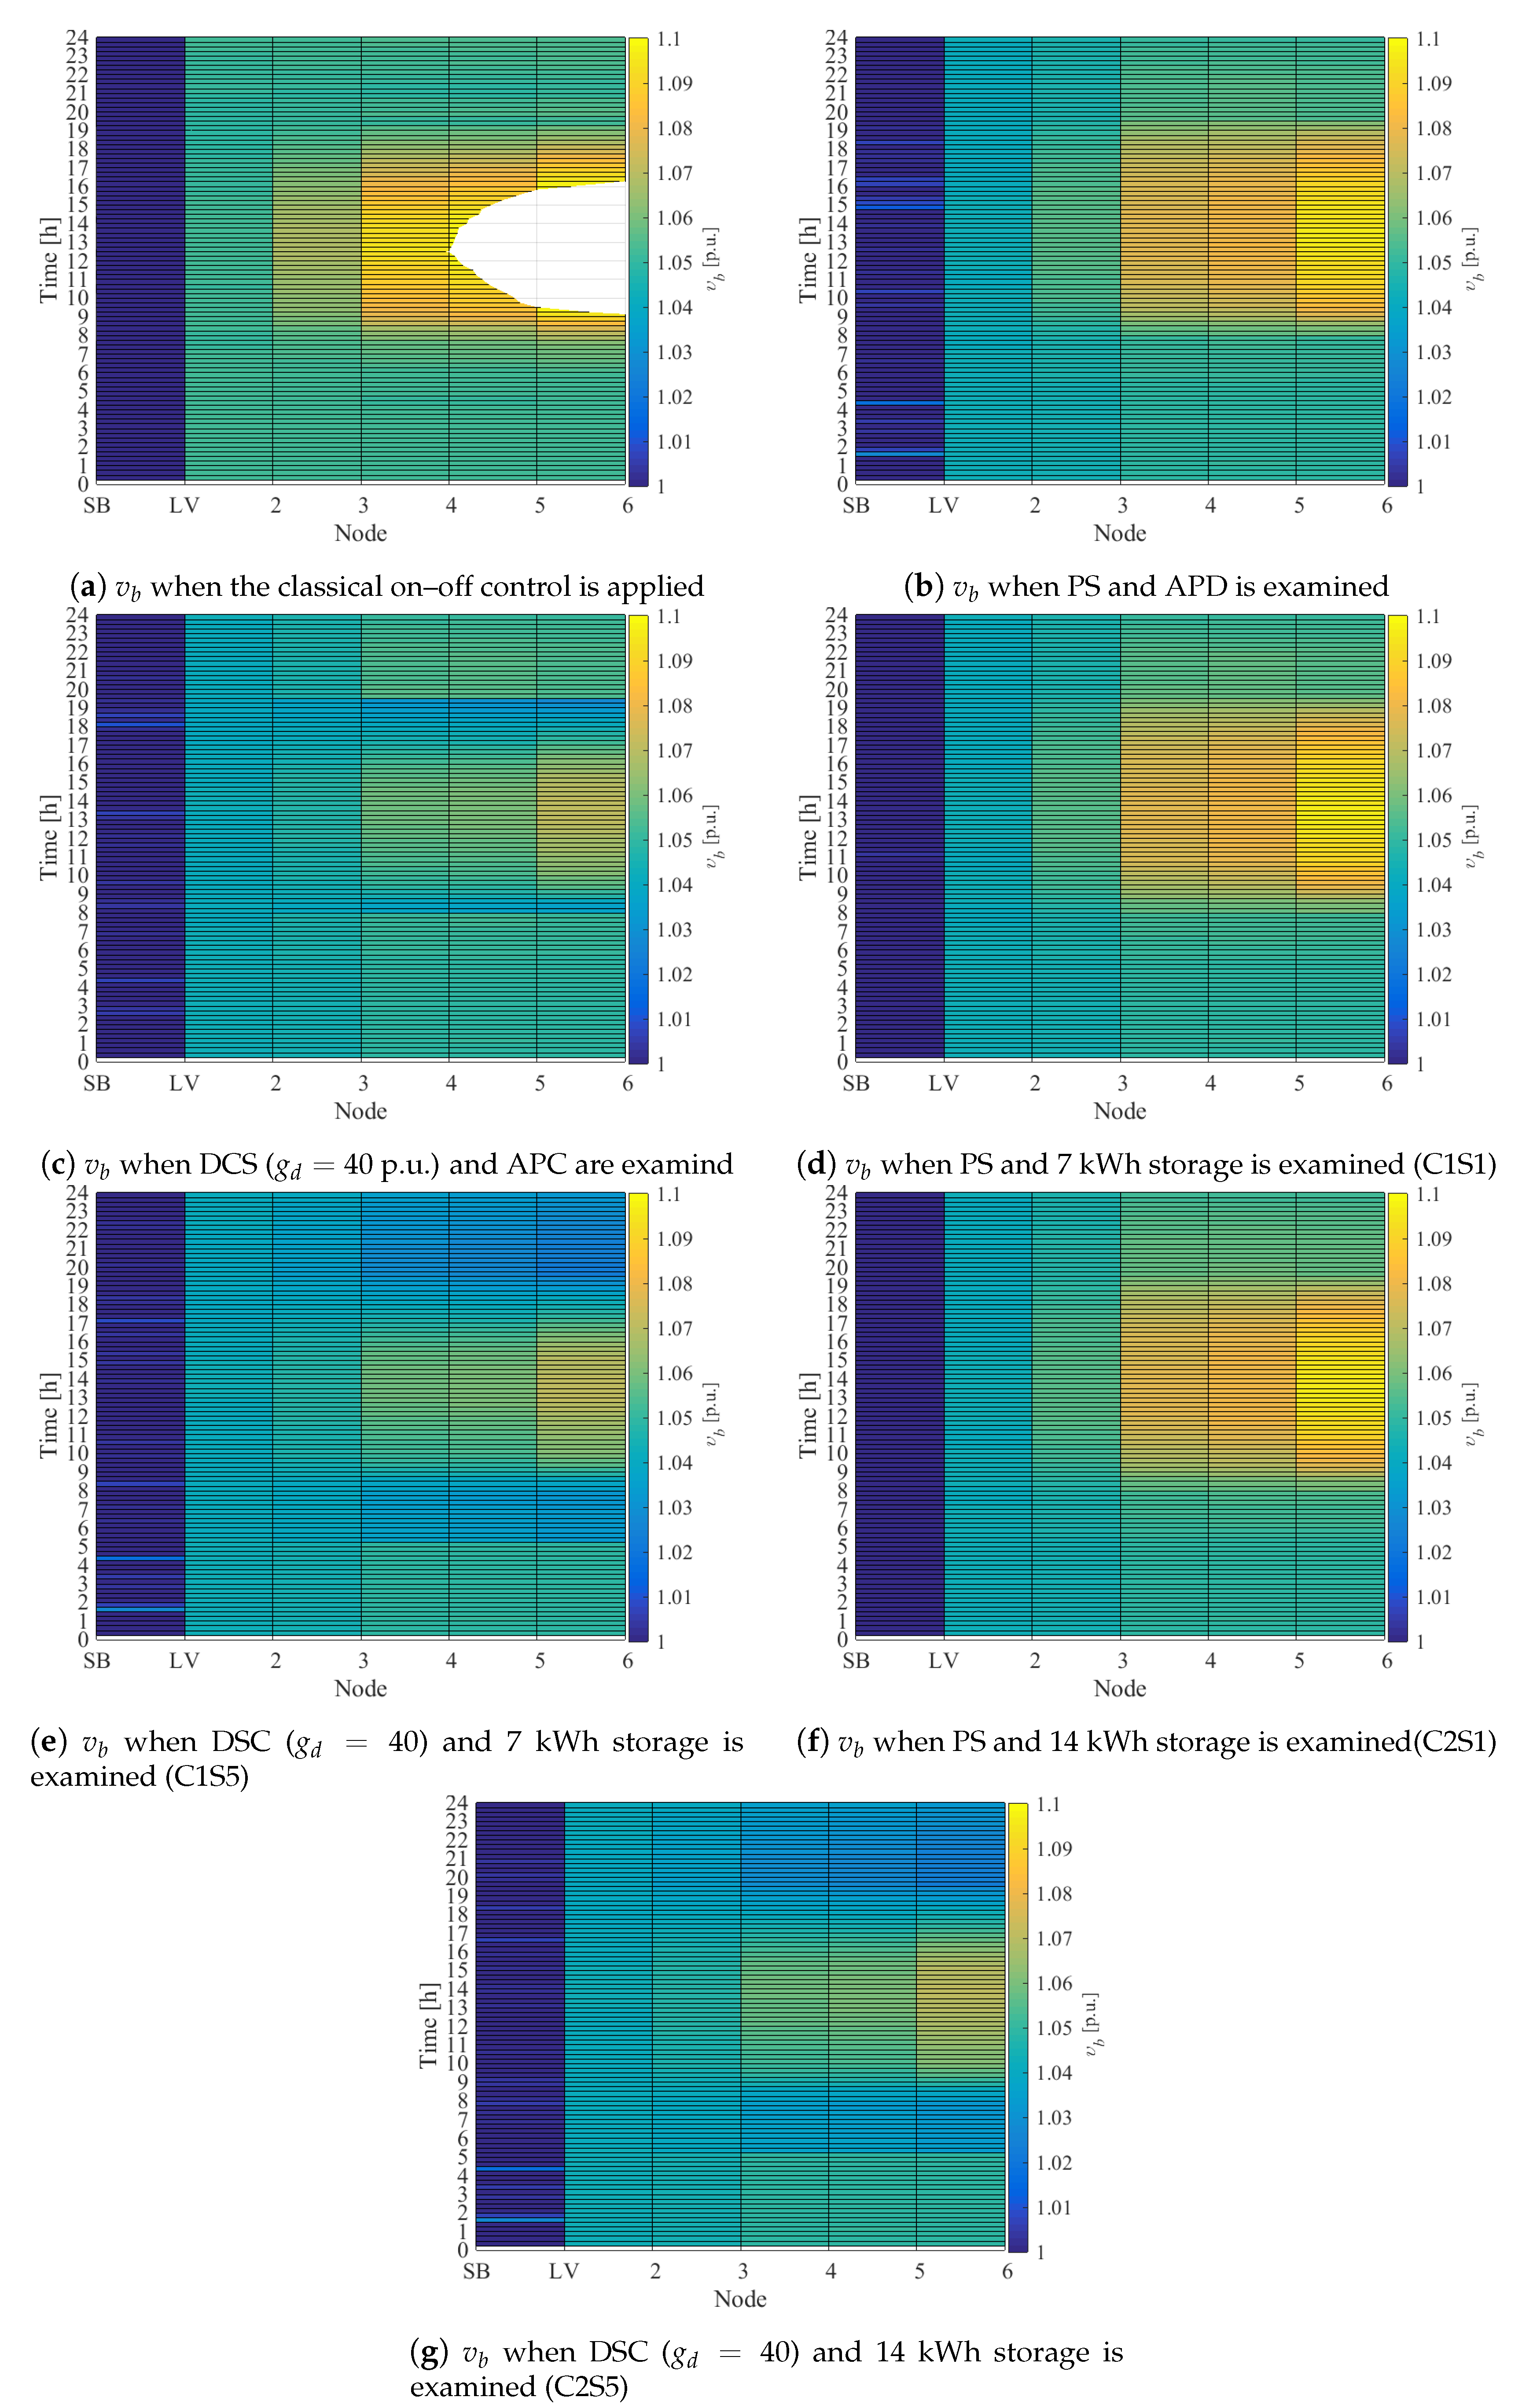
3.2. Simulation Results

The measured unbalanced load profiles show that phases b and c are the least loaded ones. Taking into account that an additional single-phase DRES is connected at node 5, then the highest phase voltage among all will be the one of phase b. Hence, during high solar irradiation levels, the droop and BESS controllers will be mainly driven by the rms values of | v ̲ b | because this phase has the highest voltage. The considered scenario of testing the presented grid configuration of DRESs, solar irradiation and load profiles does not lead to undervoltages so neither the droop nor the BESS controllers are operating in the undervoltage region. Hence, in this particular case, only phase voltage v b is of interest for the further analysis of integrating BESS into the DRES. Figure 5a–g show the obtained simulation results for phase voltage profile v b across the feeder for an entire day when different control strategies and BESS sizes are applied. The abbreviation SB stands for “slack bus” which is at the medium voltage side and LV stands for low voltage side which is after the distribution transformer. Figure 5a represents the case when no control is applied and it can be clearly seen that there are times when overvoltages occur in the end of feeder when high solar irradiation is present. The overvoltages occur at nodes 4 to 6 and, in practice, DRES 2 and DRES 4 would have been disconnected from the grid due to the embedded overvoltage on–off control algorithm. At a closer look at the obtained simulation results, it can be seen that DRES 2 would have been disconnected around 13h00. Due to the unbalanced loading and the neutral point shifting effect, studied in [45], DRES 3 and DRES 4 are subjected to overvoltages almost at the beginning and end of the solar irradiation profile which eventually would lead to incredible loss of renewable energy due to hard curtailment.
The simulation results of case C0S0 are presented in Figure 5b where the positive-sequence control strategy with active power drooping is investigated. In this case (and all other that follow), active power drooping is incorporated and it can be seen that phase voltage v b does not exceed 1.1 p.u. during the peak generation periods. To limit the amount of the presented data, only the extreme cases ( g d = 0 and 40 p.u. as well as storage of 7 kWh and 14 kWh) will be considered for further interpretation. In Figure 5c, the simulation results of the three-phase damping control strategy are presented where the damping conductance is g d = 40 p.u. and active power drooping is applied (C0S5). Since active power drooping is used in this case, there are no overvoltages that are present at the far end of the feeder. Furthermore, because of the voltage unbalance mitigation properties of this control strategy, higher currents are being injected in the other two phases and lower current into phase b. Consequently, the yellow colour in Figure 5c is less intensive, which means that v b is closer to its nominal value at the end of the feeder.
The simulation results, obtained when case C1S1 is used in all DRESs, are presented in Figure 5d. Since active power drooping and BESS of 7 kWh are incorporated in all DRESs, overvoltages are prevented across the feeder. Despite the BESS, the yellow density of Figure 5d resembles very much the one of b. If case C1S5 is considered, the high value of the damping conductance helps with improving the resistive behaviour and the voltage profile of v b and the later one has significantly lower voltages as shown in Figure 5e.
The obtained simulation results of BESS with capacity of 14 kWh and positive-sequence control strategy are shown in Figure 5f. As anticipated, overvoltages are not present across the feeder for the entire day because of the droop controller. The intensity of the yellow colour slightly differs from cases C0S1 and C1S1 where a small difference in the morning and evening hours can be seen. Nevertheless, the similarity between C0S1, C1S1 and C2S1 is very high, which implies that, even if a BESS with s doubled capacity is used, the voltage profile of v b will be rather the same if the positive-sequence control strategy is used. When case C2S5 is considered, the high damping conductance value in combination with a BESS with storage capacity of 14 kWh helps to maintain even lower voltage levels in phase b. The simulation results of this case are presented in Figure 5g. In this case, there is a small difference in the yellow density around the noon hours but overall the colour map and density is quite similar to cases C0S5 and C1S5. A detailed description of the amount of the drooped power and the SOC are given in the next paragraphs.

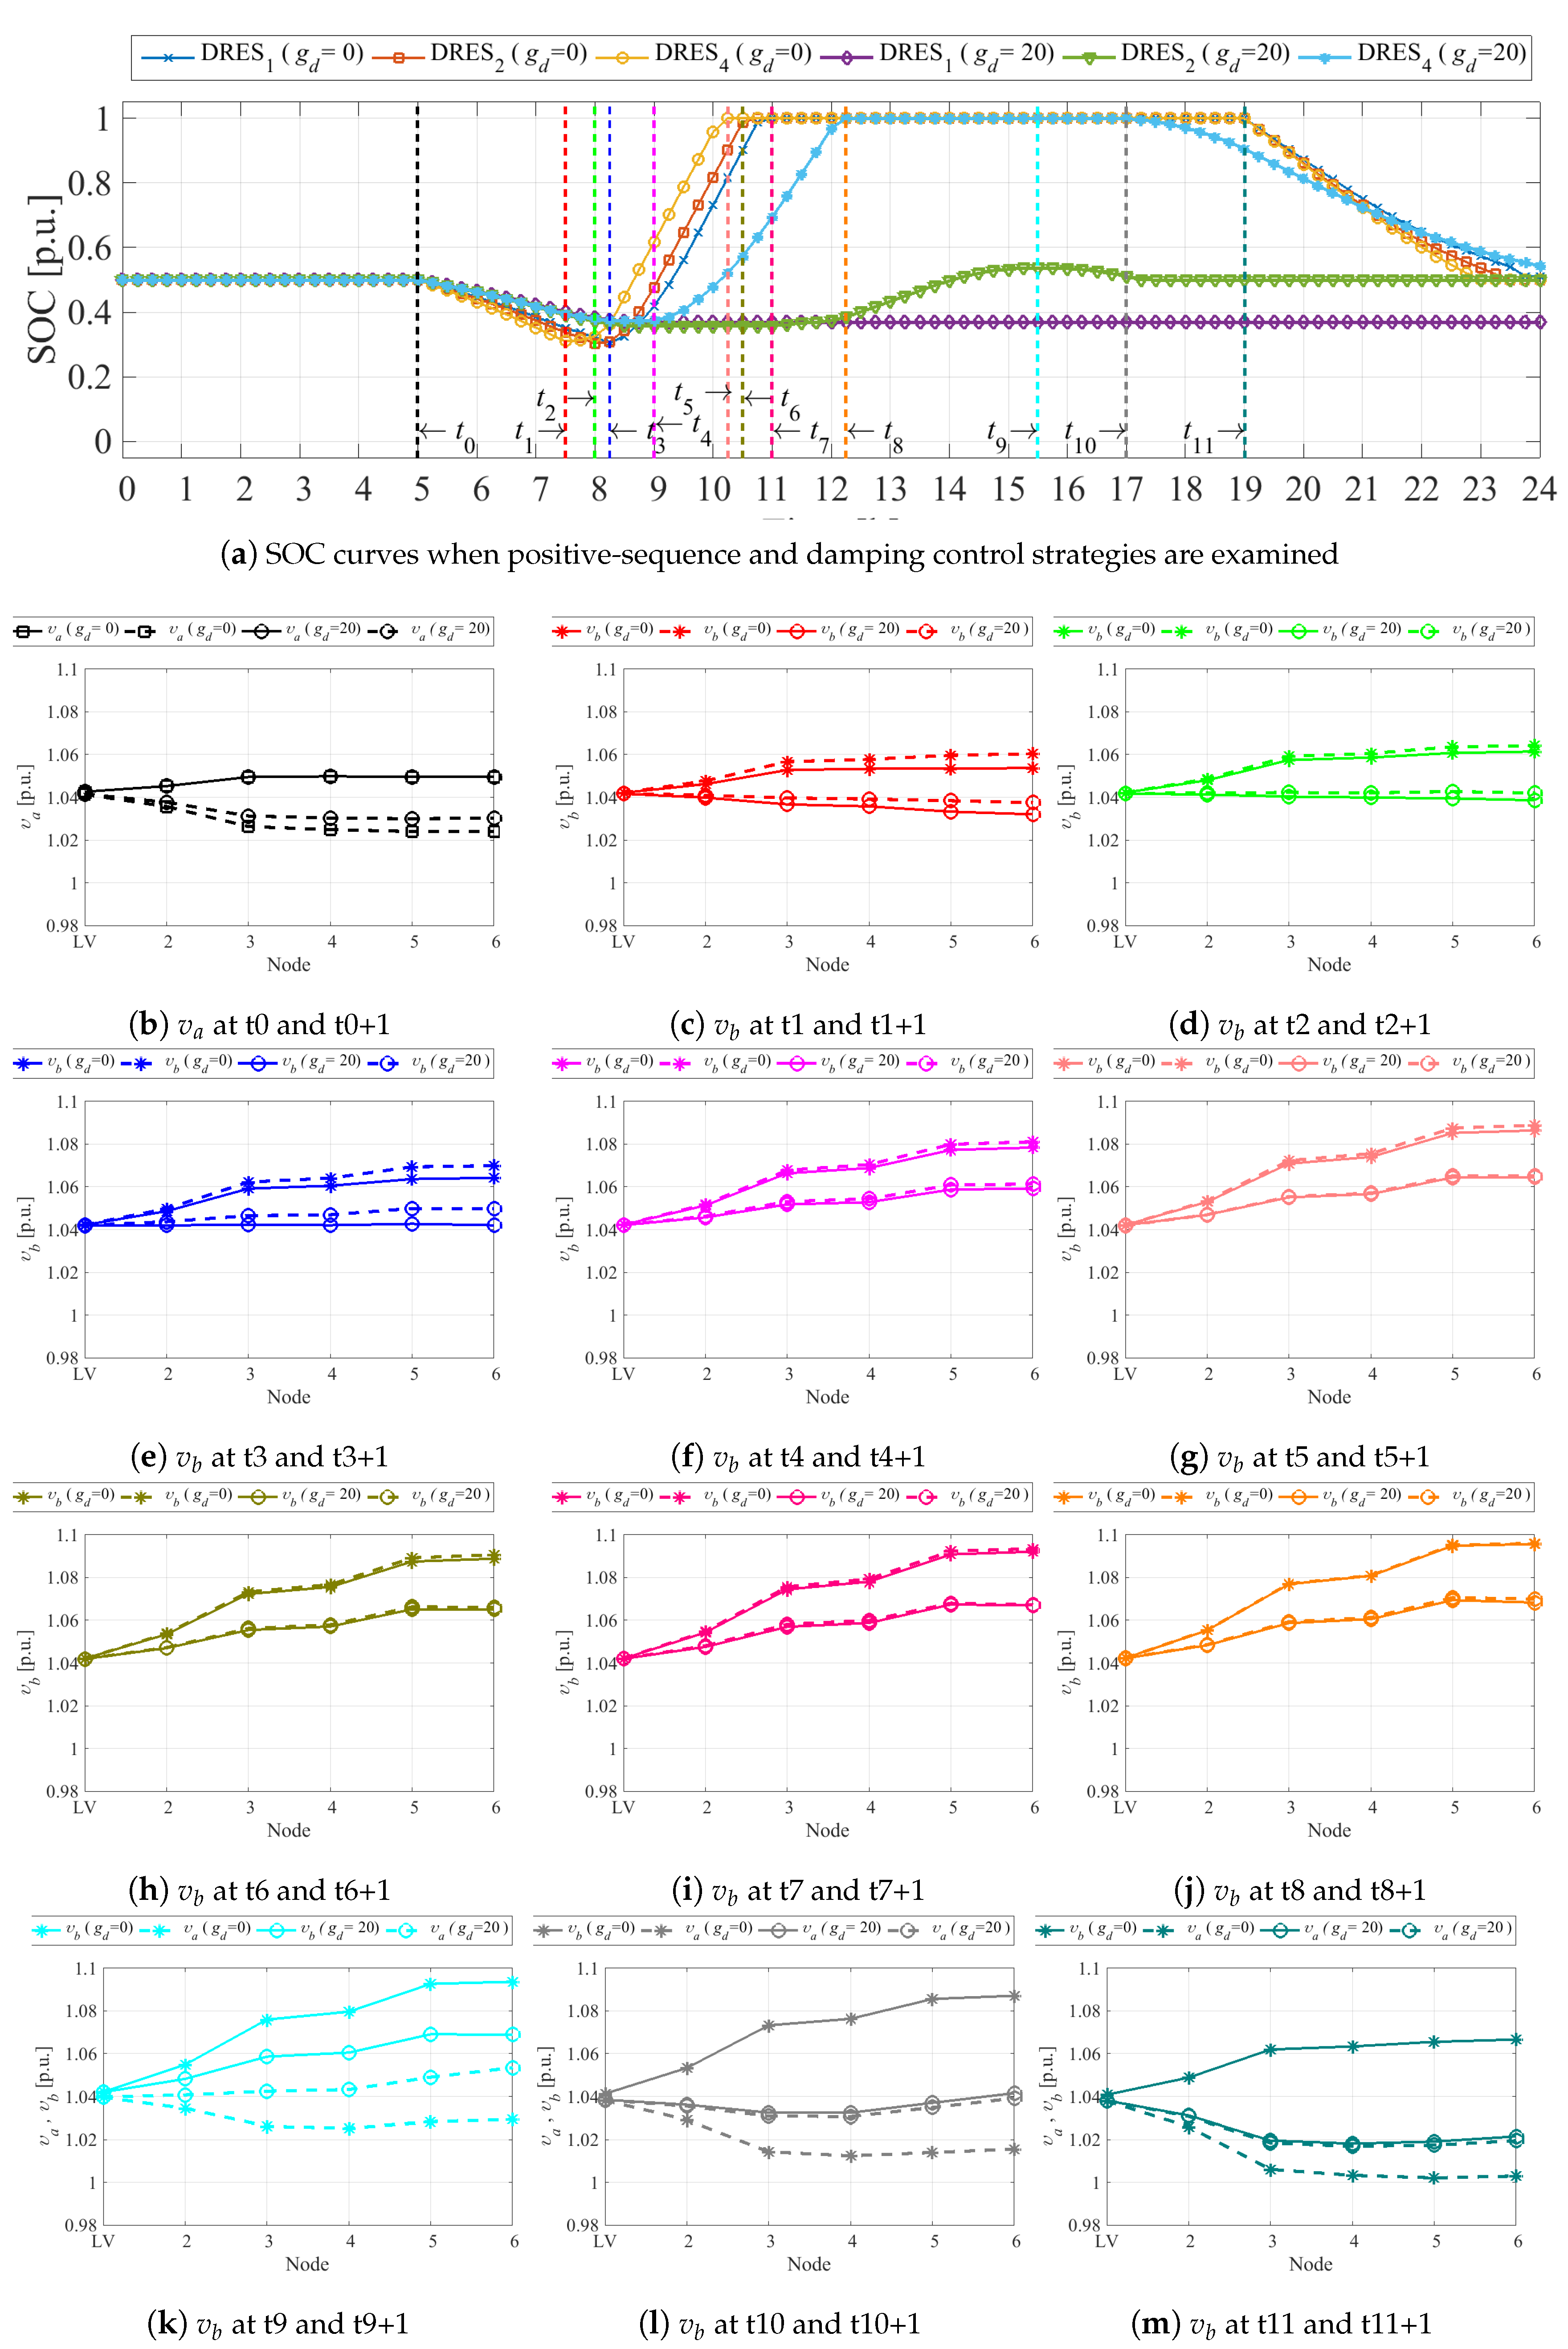
3.2.1. BESS Controller Operating Principle

The operation of the used BESS controller can be seen in Figure 6a–m. In this figure, the different inflection points of the SOC curves are examined. Note that the interpretation of the results is focused on the charging and discharging points of the curves. In addition, the performance of the BESS is examined when used in the positive-sequence and the three-phase damping ( g d = 20 p.u.) control strategies, and the point under consideration plus the previous point are used to explain the controller actions. All SOC curves of the BESS controller are depicted in Figure 6a.
The BESS controllers are enabled in the beginning of the morning peak loading and at point t 0 the voltage in phase v a is the lowest among the phases and low enough to trigger all BESS controllers to draw power from the batteries. Voltage profiles of v a of both examined control strategies are shown in Figure 6b where, by using a solid line, the results at t 0 are shown and a dashed line is used to depict the results at point t 0 + 1 . As it can be seen from these two samples, the phase voltages for the positive-sequence and the damping control strategies are quite close to each other. Hence, the voltage unbalance is not dominant yet. From t 0 until t 1 , all BESS are being depleted since all phase voltages are lower than v bh , 1 .
The minimum of the SOC curve of BESS 3 , when storage is combined with the positive-sequence control strategy, is located at time instance t 1 . At time instance t 1 + 1 , the solar irradiation is high enough to rise the phase voltage v b above v cpb at node 6 and DRES 4 starts to droop power. According to Equations (2) and (6), all drooped power is redirected to charge the BESS 3 . The voltage profiles of phase voltages v b are depicted in Figure 6c. The phase voltage v b is lower than v bh , 1 for almost 2 h 45 min and BESS 3 is depleted down to 0.3 p.u. It is important to note that the three-phase damping control strategy mitigates the voltage unbalance very well and, for this time instance, the voltage profile is kept within v bh , 1 and v cpb which does not activate the droop nor the BESS controllers. The interpretation of the simulation results for time instances t 2 , t 2 + 1 , t 3 and t 3 + 1 is similar to time instance t 1 with the only difference that DRES 2 and DRES 1 start drooping active power at t 2 + 1 and t 3 + 1 , respectively. The voltage profiles of phase voltage v b are shown in Figure 6d,e, respectively. Note that the BESS controllers of the DRESs, which are equipped with the three-phase damping control strategy are still not activated because all phase voltages are lower than v bh , 1 .
The positive-sequence control strategy droops considerable amount of power which results in fully charged BESS for DRES 1 , DRES 2 and DRES 4 at time instances t 7 , t 6 and t 5 , respectively. This means that all BESS are fully charged in about 2 h 45 min and the rest of the drooped renewable energy is being lost. The voltage profiles of phase voltage v b for time instances t 5 , t 6 and t 7 are depicted in Figure 6g–i, respectively.
Unlike the positive-sequence control strategy, the three-phase damping control strategy starts drooping power way later during the day due its voltage unbalance mitigation abilities. The inflection point of SOC 3 occurs at time instance t 5 and at t 5 + 1 starts the active power drooping. The three-phase damping control strategy is able to provide some support to the grid voltages by depleting BESS 3 until 9h00, which is 1 h 30 min more compared to the positive-sequence control strategy (for DRES 4 ), but this does not necessarily means that BESS is depleted deeper. Because of the balancing abilities of the three-phase damping control strategy, the lowest phase voltage is supported, allowing the BESS 3 controller to exchange smaller quantities of power but for a longer period. Furthermore, BESS 3 is discharged down to about 0.37 p.u., whereas the positive-sequence discharges the BESS to a deeper level for a shorter amount of time. At time instance t8, BESS 3 is fully charged which is two hours later compared to DRES 4 equipped with the positive-sequence control strategy which means less renewable energy is going to be lost. In addition, at this time instance, the minimum of SOC 2 occurs and at t 8 + 1 phase voltage v b is greater than v cpb (see Figure 6j). Hence, DRES 2 enters in the drooping region, but it is remarkable to point out that this happens with a delay of about 4 h 15 min compared to the DRES 2 , which is equipped with the positive-sequence control strategy (point t 2 ).
When the three-phase damping control strategy is used, BESS 2 is not even fully charged and the maximum of SOC 2 occurs at time instance t 9 and the voltage profiles of phase voltage v b are depicted in Figure 6k. BESS 2 starts to be discharged at time instance t 9 + 1 and being discharged and this controller is been driven by phase voltage v a since it is the lowest one among the phase voltages. At this time instance, the superior performance of the three-phase damping control strategy over the positive-sequence control strategy can be seen. The voltage level at node 4 is 1.08 p.u. for the positive-sequence and 1.06 p.u. for the damping control strategy, which means that the former one still droops renewable energy, while the latter one is about to exit the drooping region in the next time instance.
It is also important to point out that the three-phase damping control strategy (with g d = 20 p.u.) is able to maintain the voltage levels at node 4 below v cpb so that BESS 1 is never been charged. Hence, when the three-phase damping control strategy is used, the size of the storage in DRES that is closer to the MV/LV transformer can be reduced or completely eliminated. The discharge times of the different BESS will be discussed later on, where all cases and sub-cases are examined individually.
The voltage unbalance mitigation abilities of the three-phase damping control strategy allow for less drooped power. This statement is confirmed by the simulation results obtained for time instances t 10 and t 10 + 1 where DRES 4 exits the drooping region and BESS 3 starts sourcing power. The voltage profiles of phase voltage v a and v b are shown in Figure 6l. As of the positive-sequence control strategy, it is still in the drooping region until time instance t 11 where all DRES 4 exit the drooping region and this condition is sufficient to trigger BESS 2 and BESS 3 to start sourcing power from the battery. The voltage profiles of phase voltage v a and v b are shown in Figure 6k.

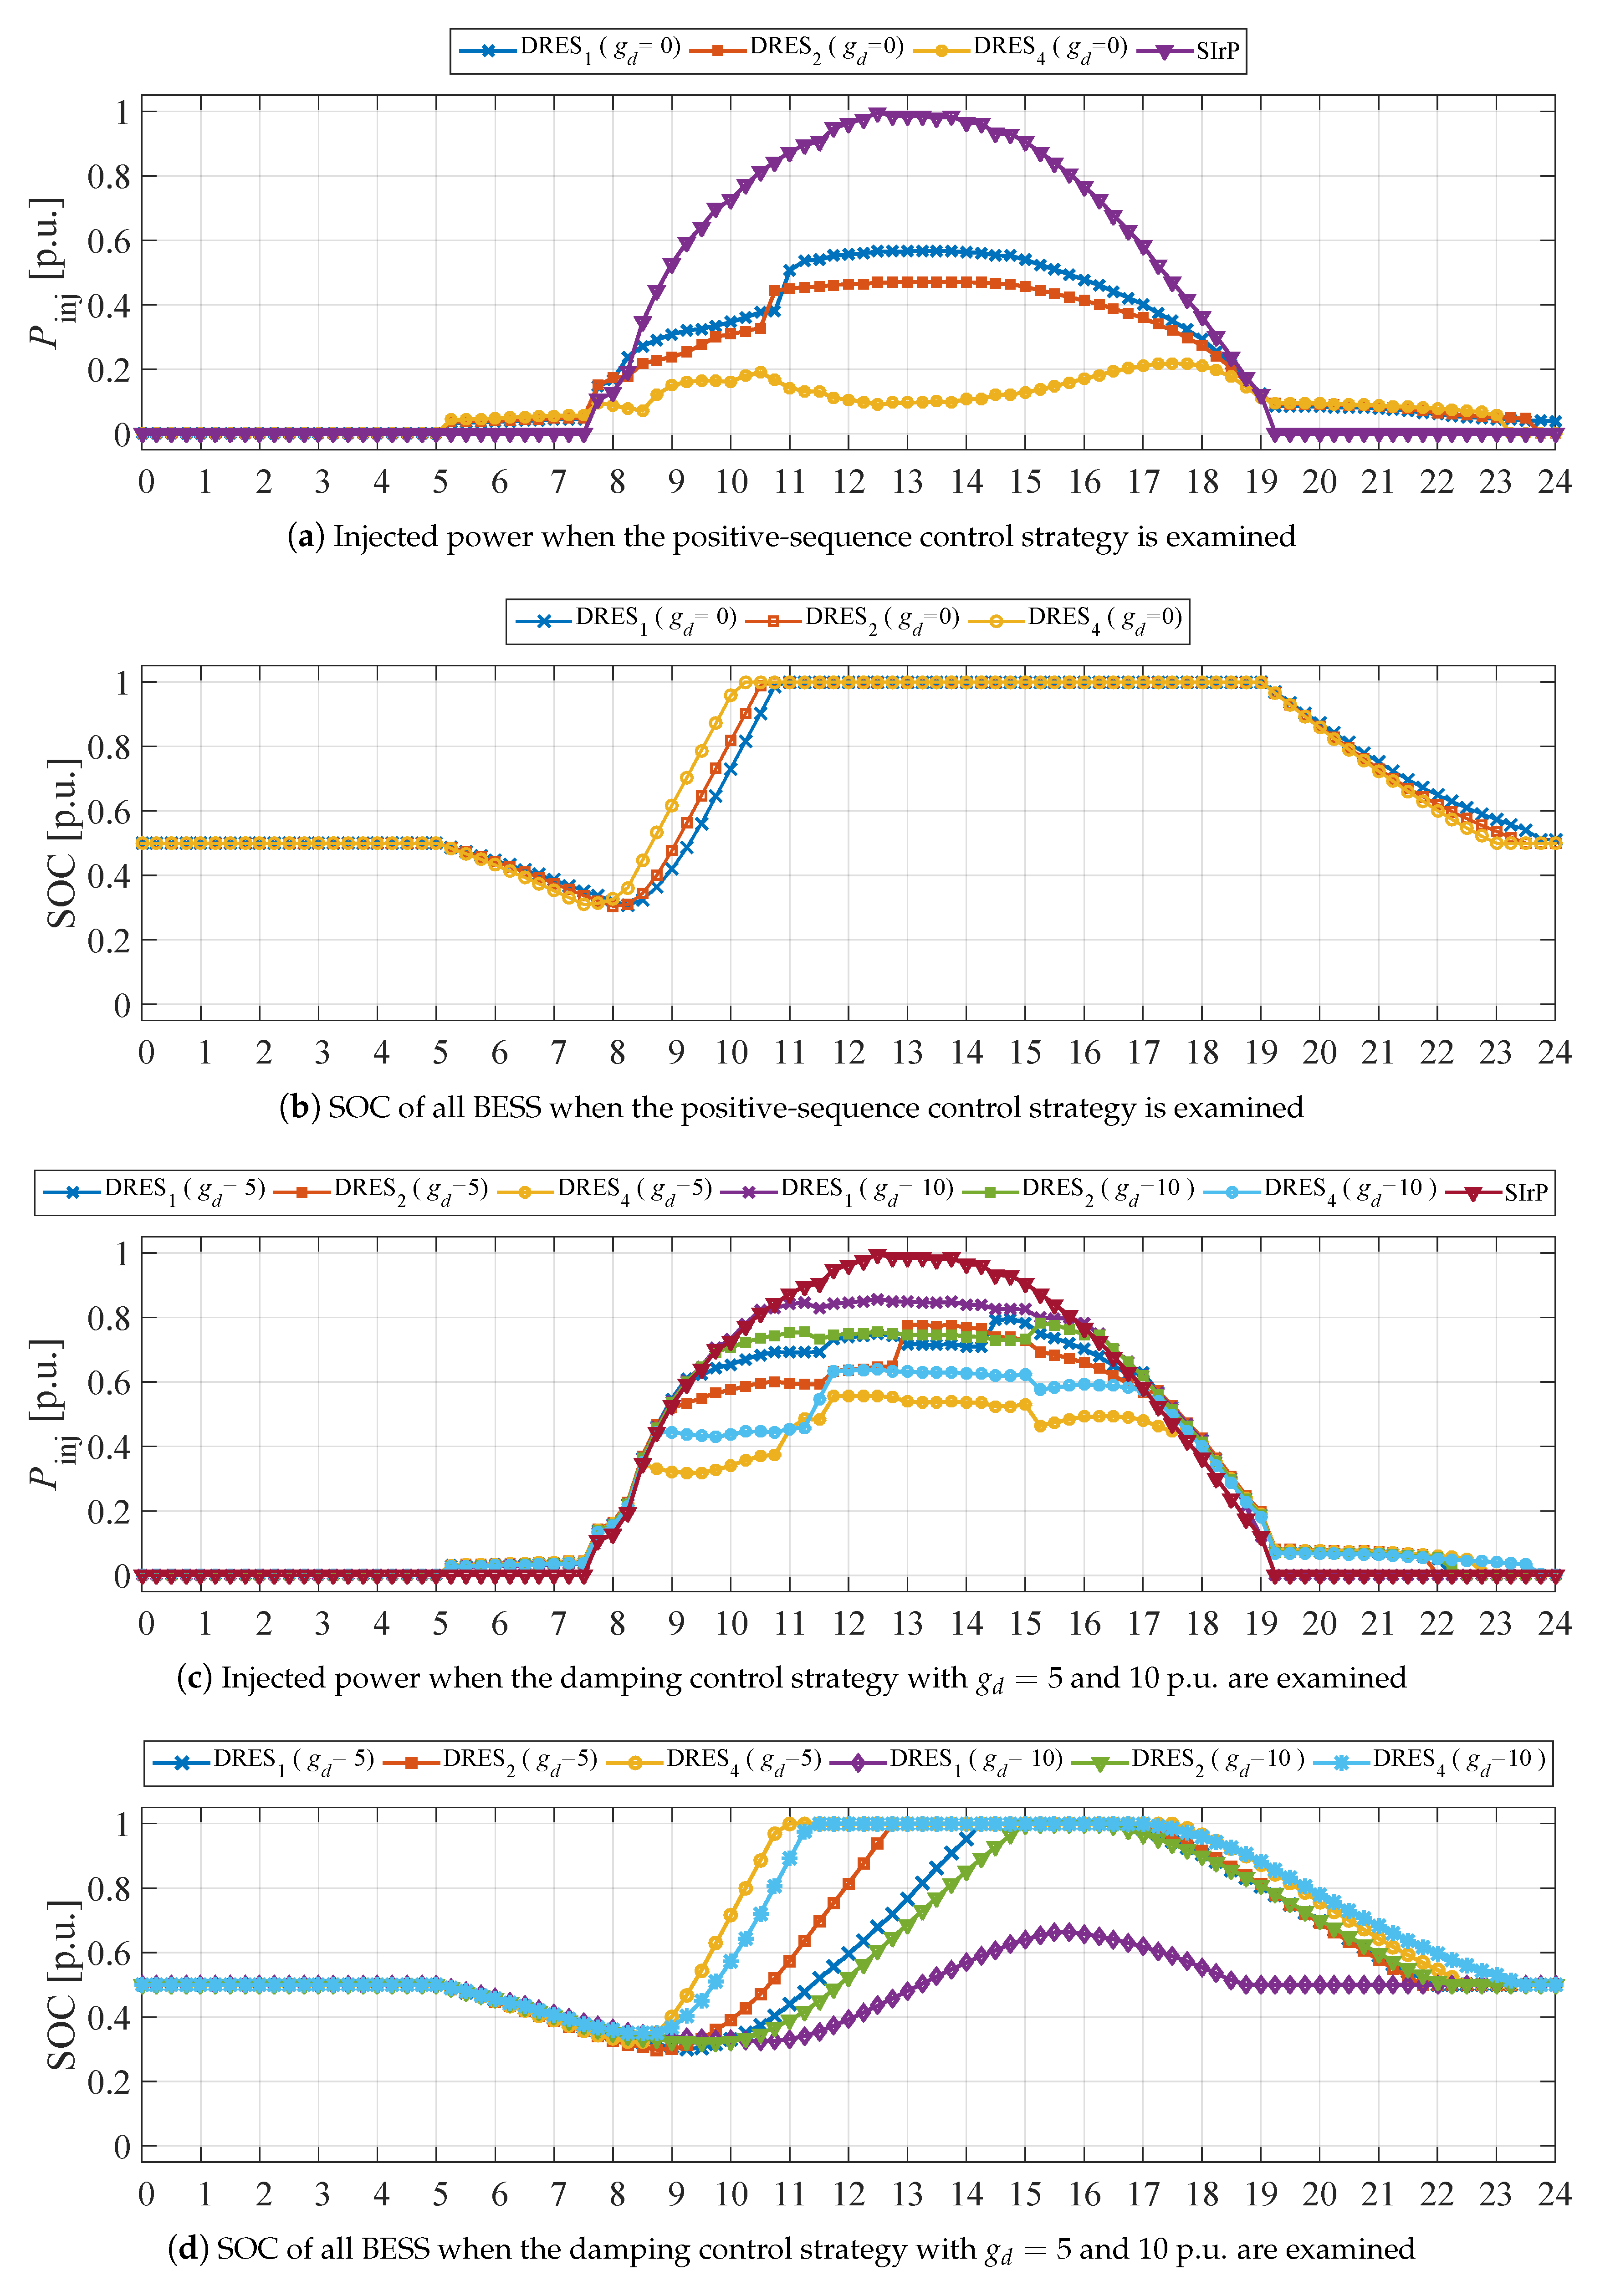
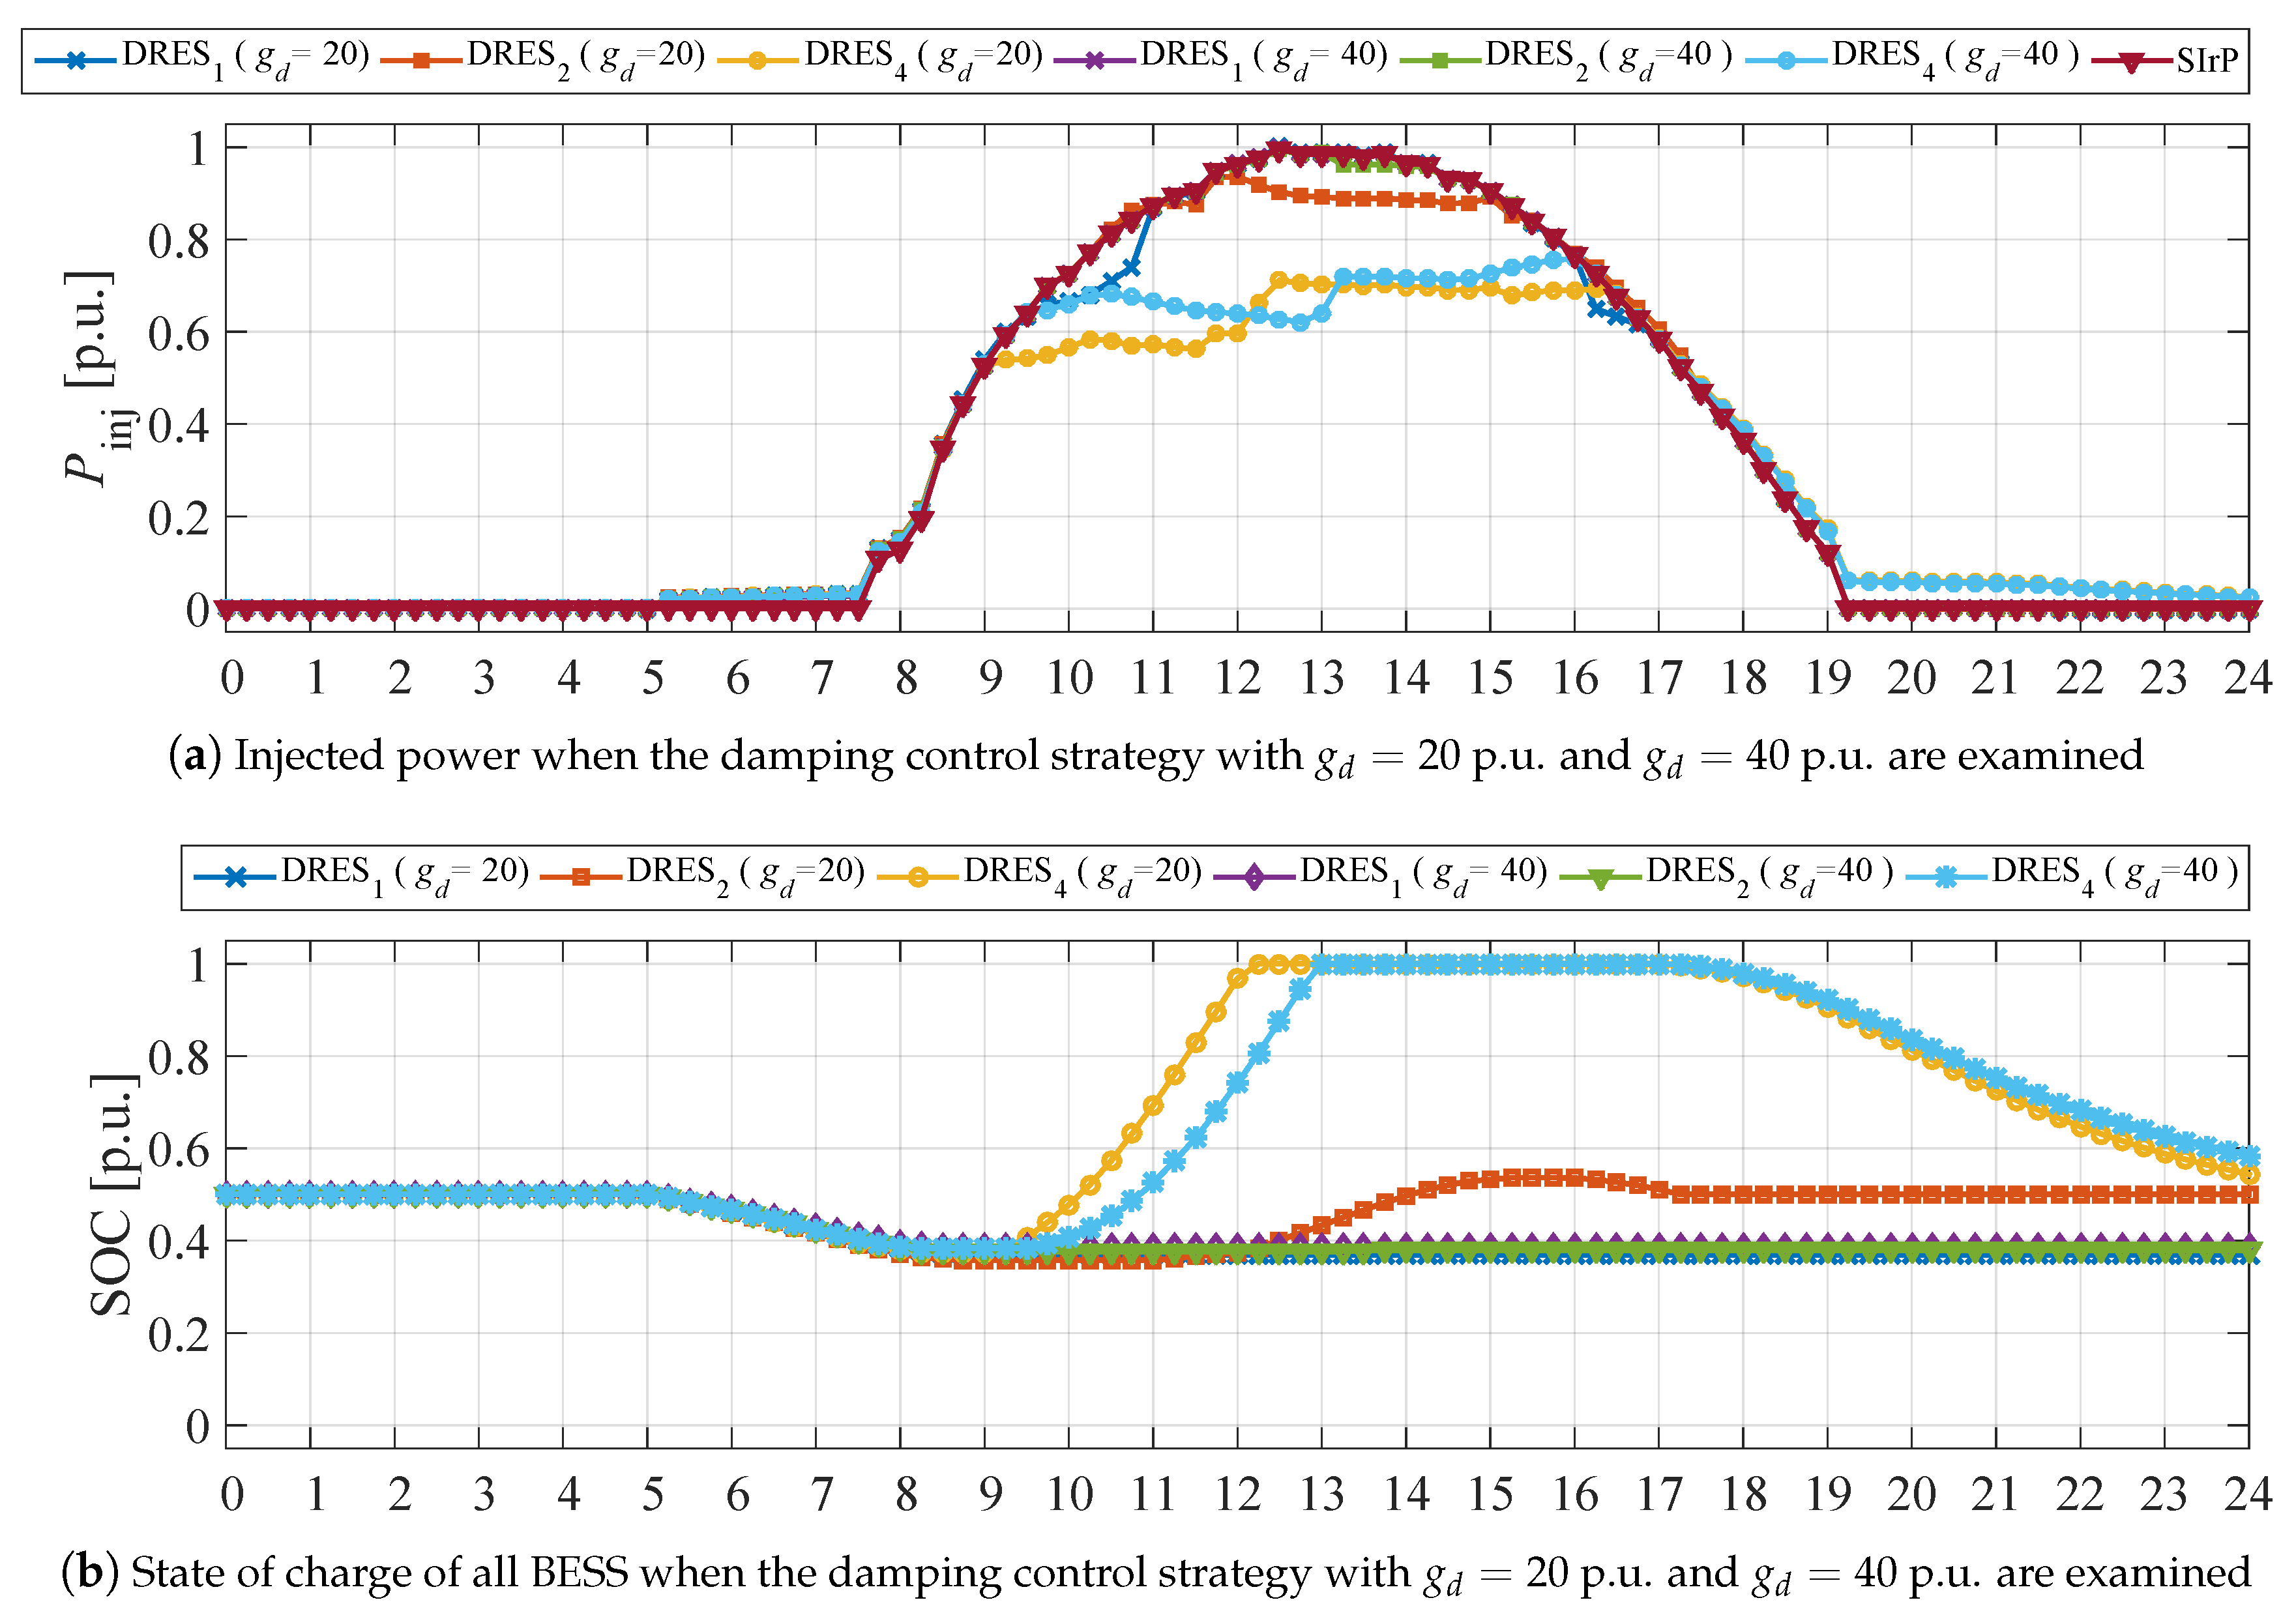
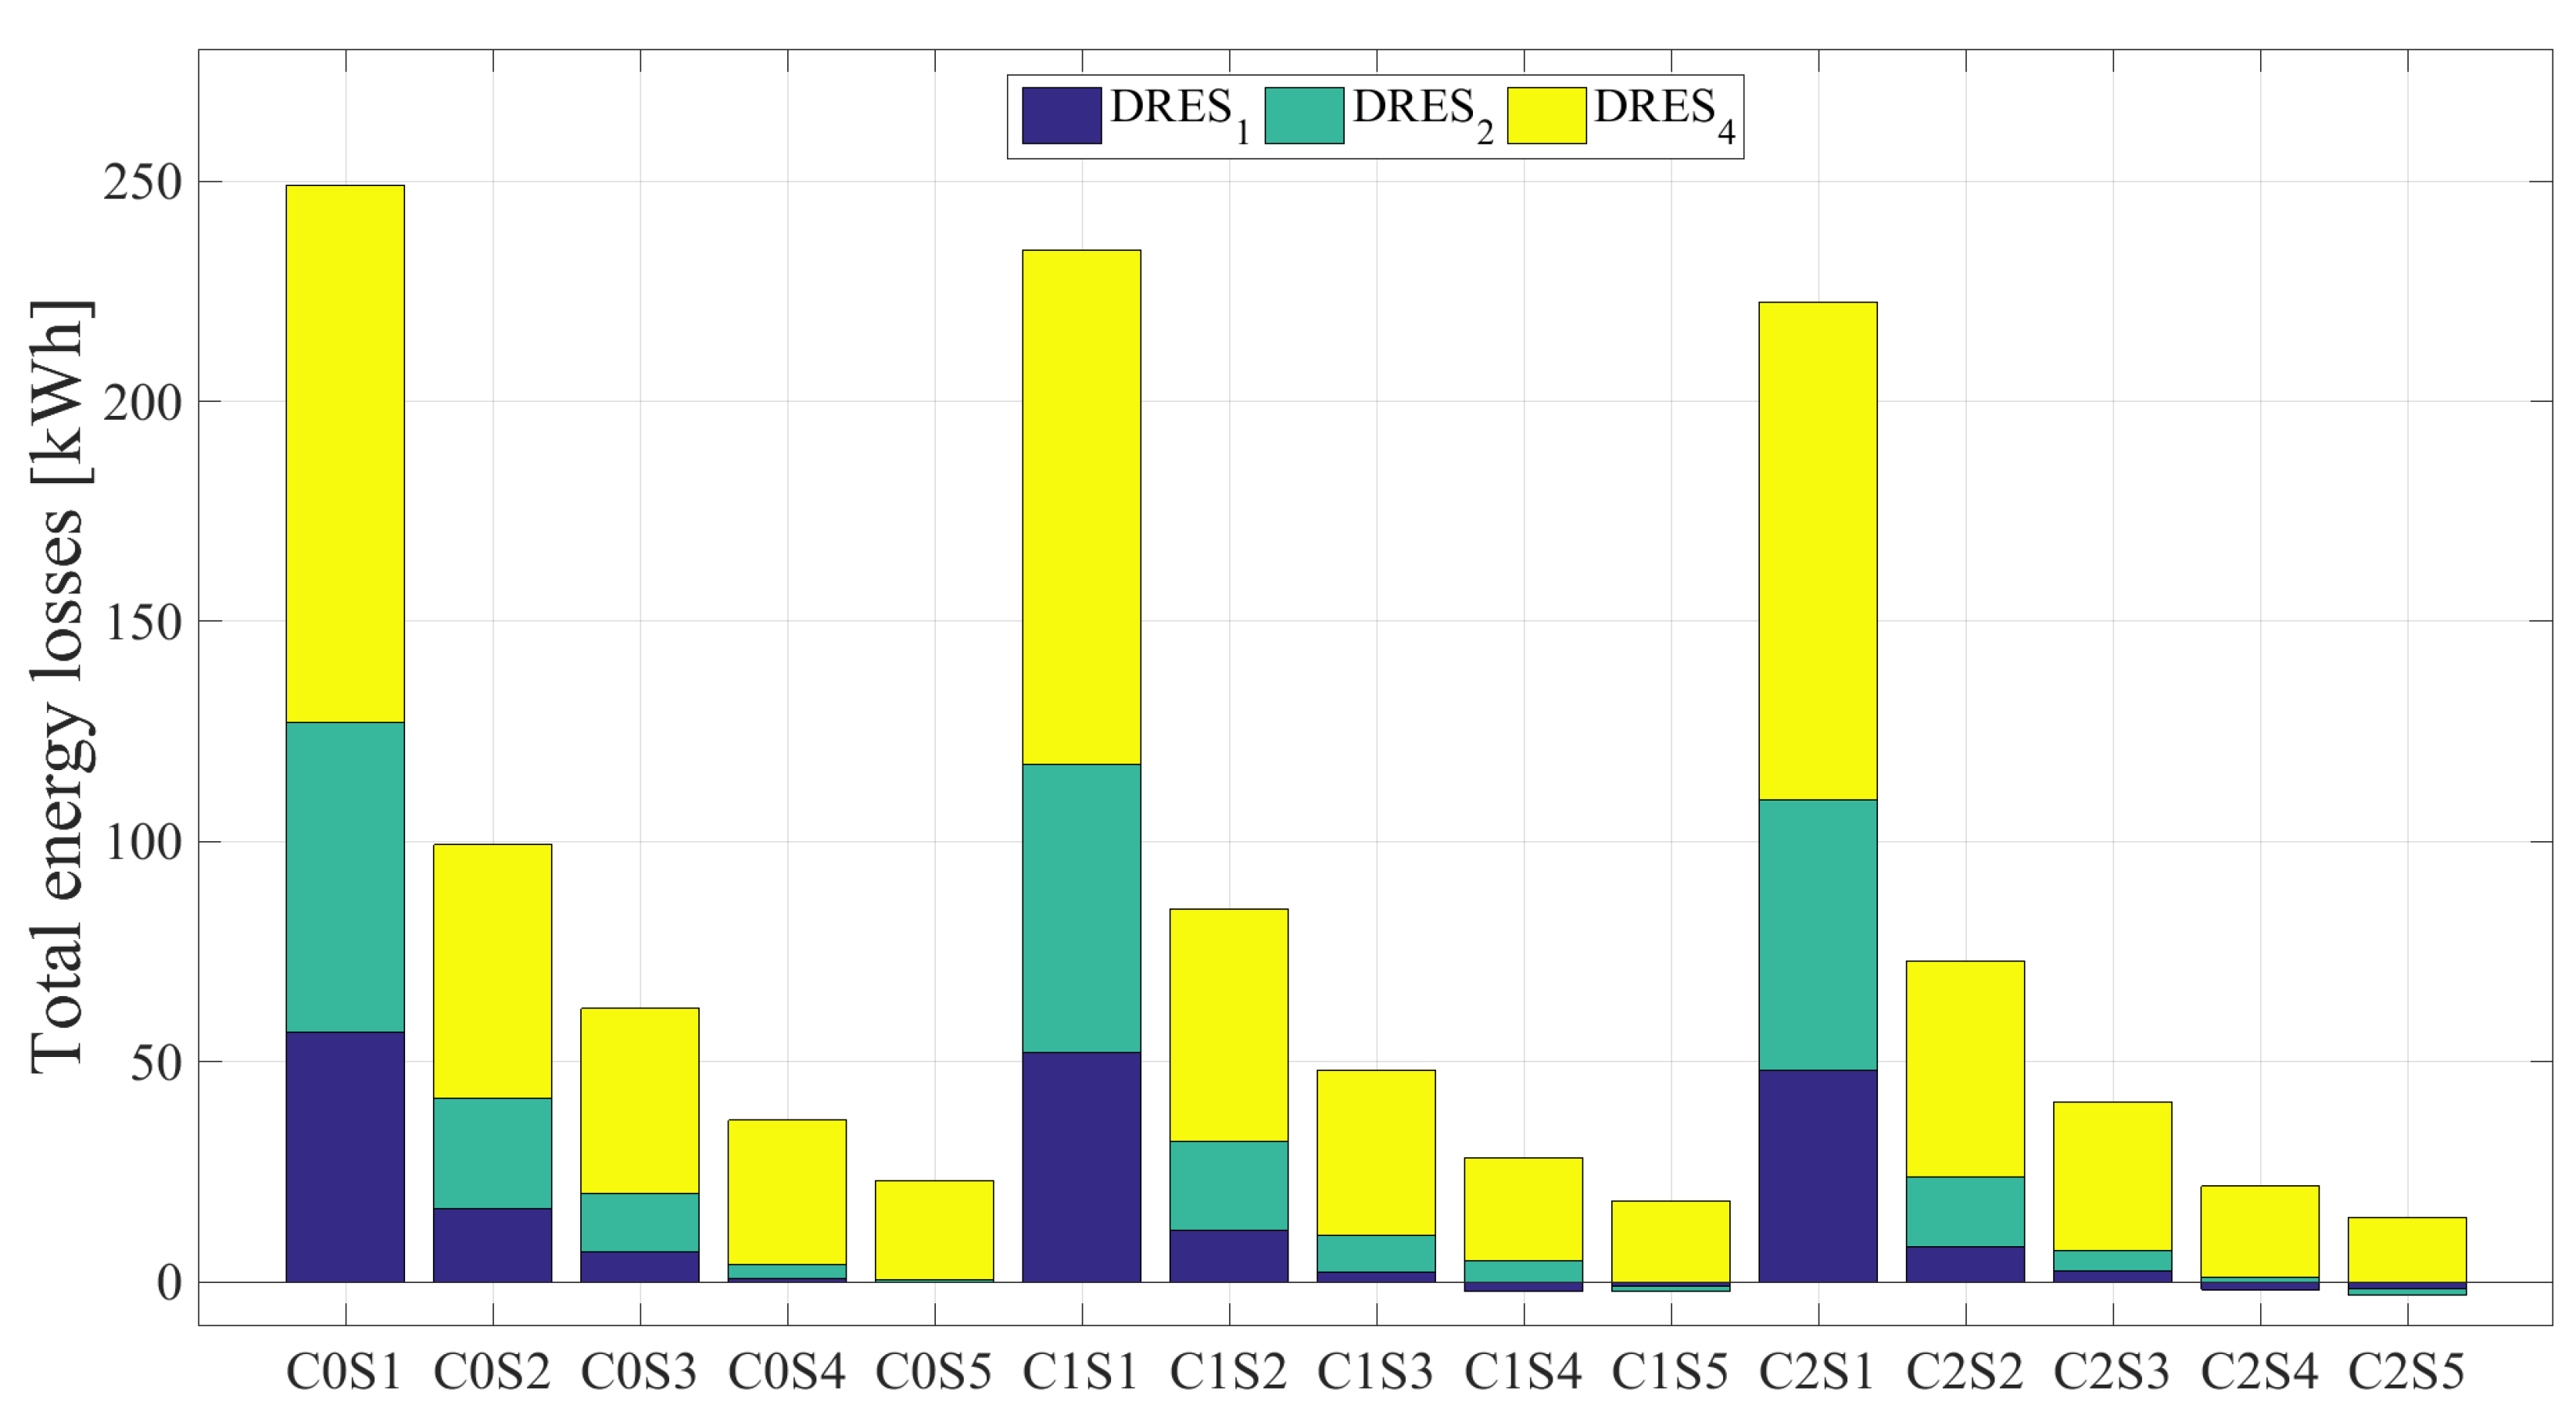
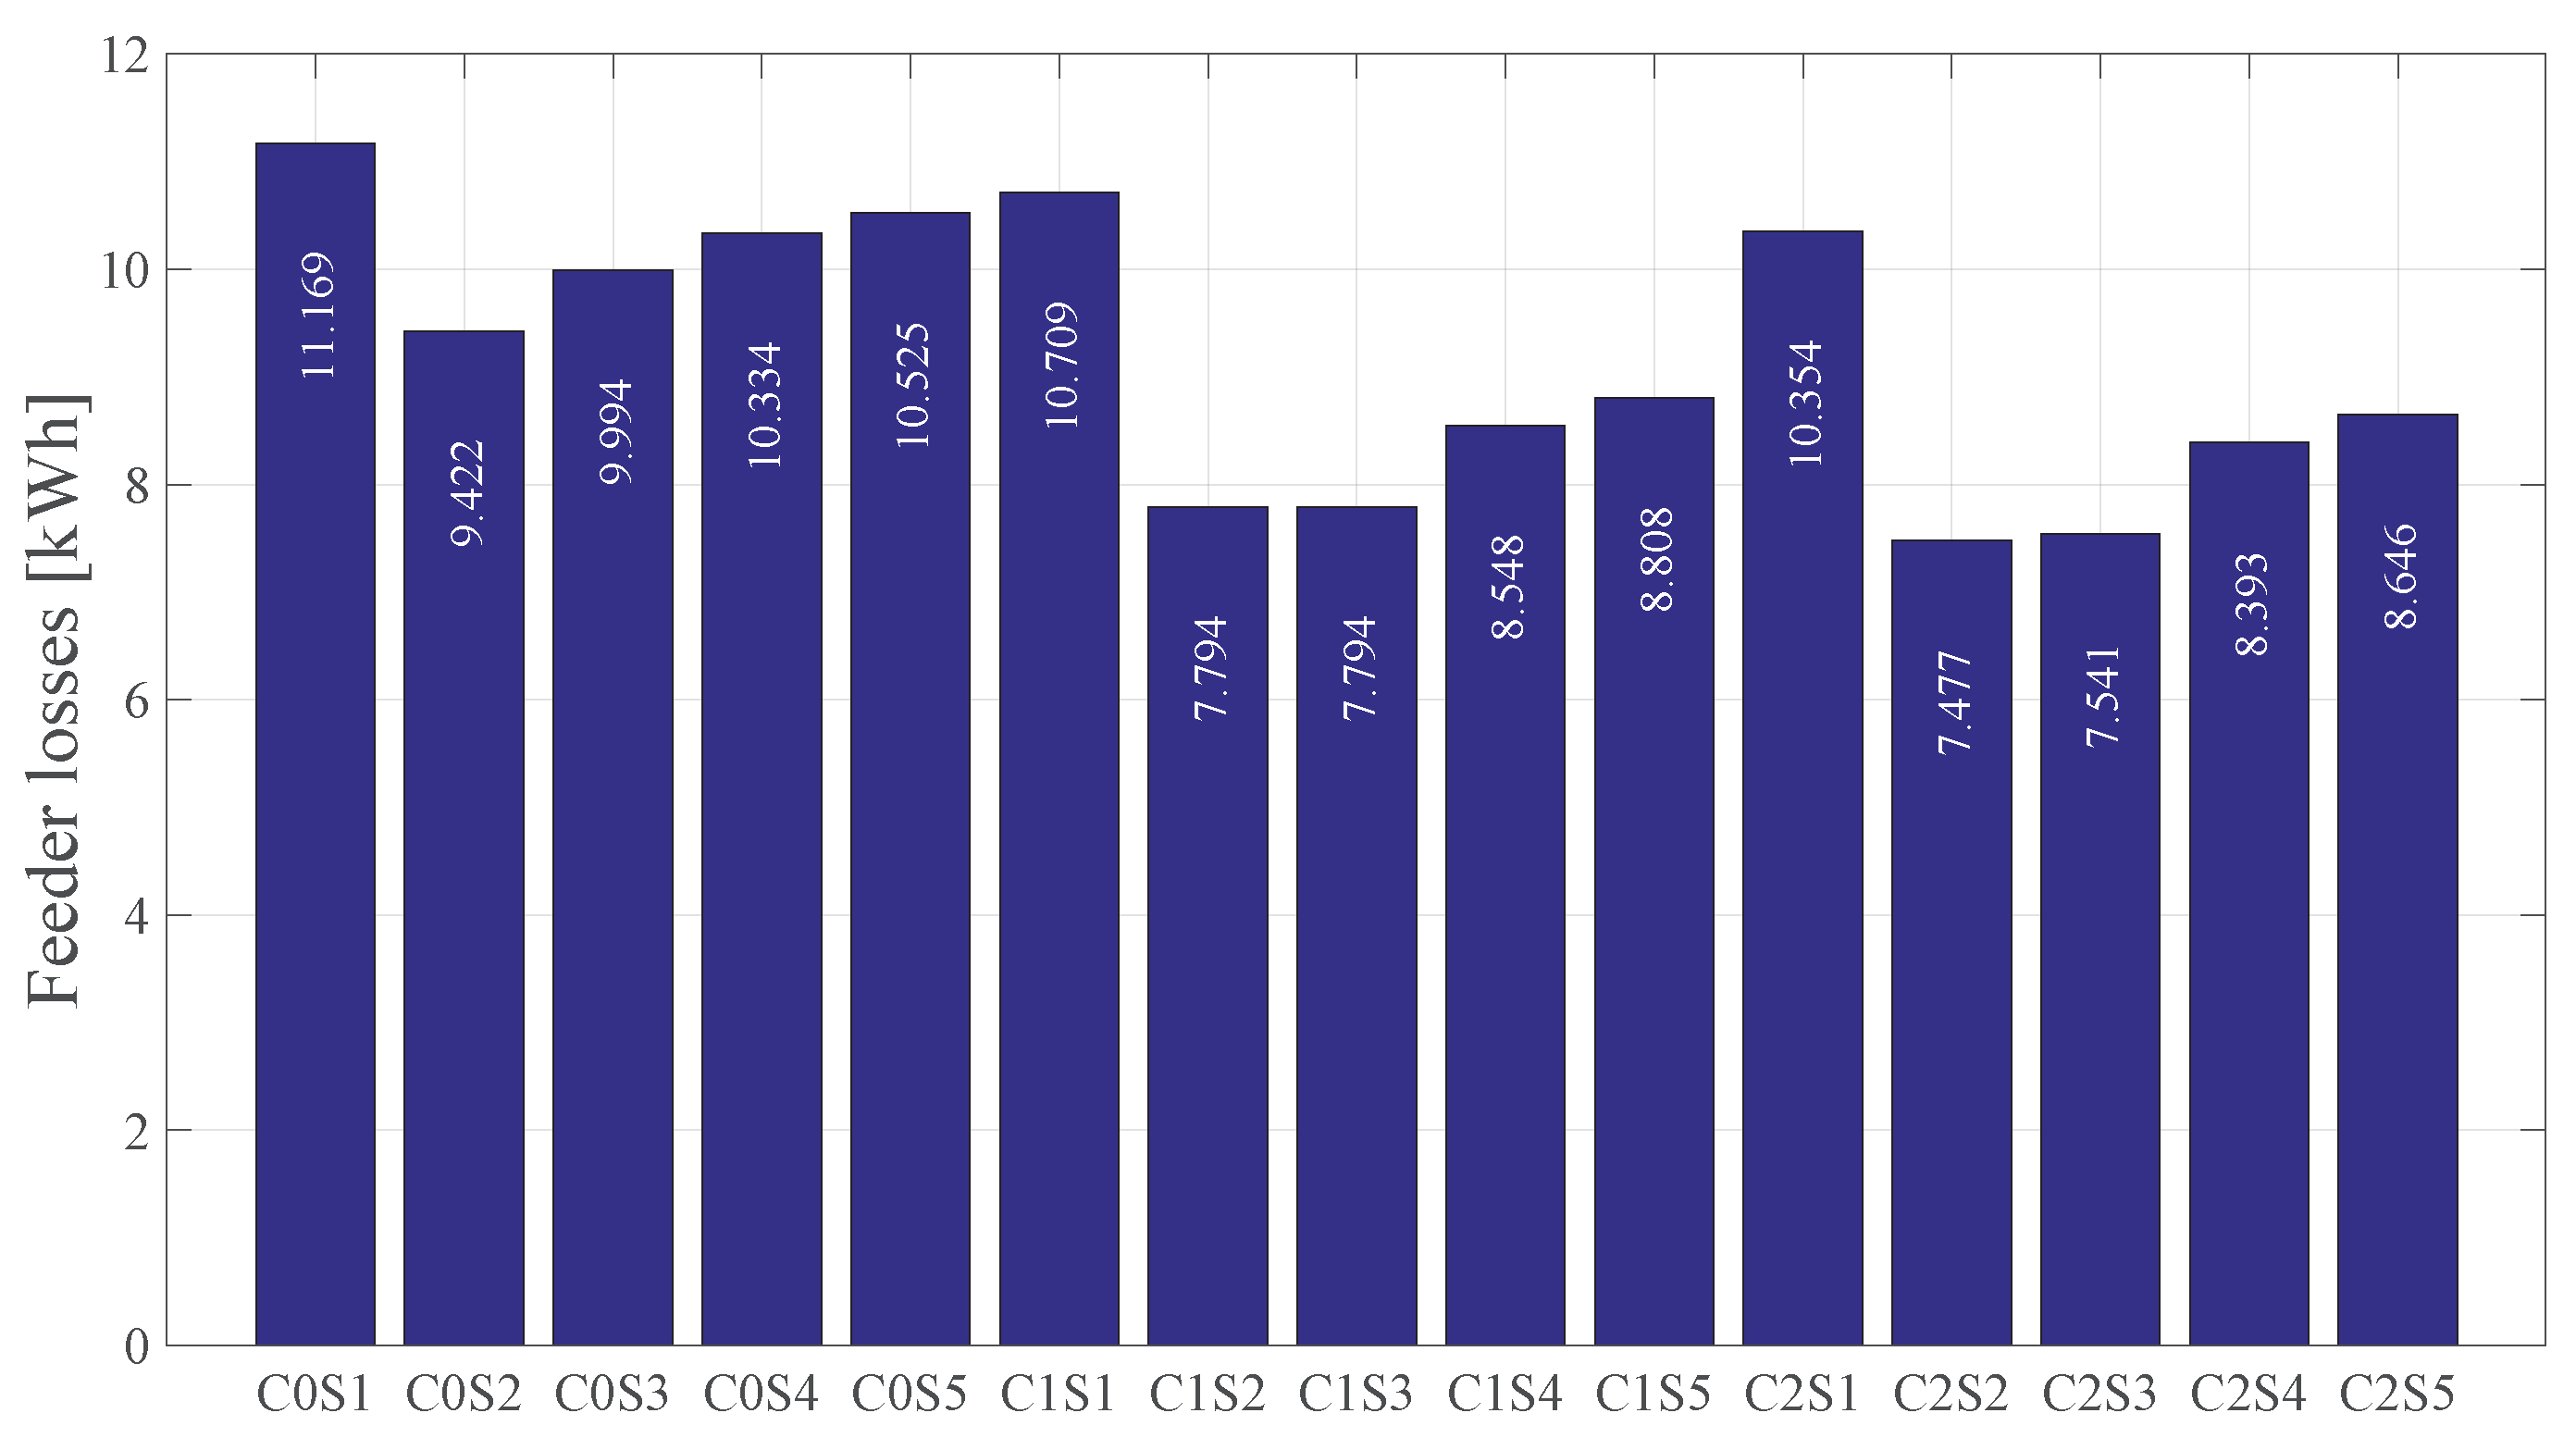
3.2.2. Performance Assessment of the Different Cases and Sub-Cases

The injected active power by DRES of case C1S1 and their SOC curves of the incorporated BESSs are depicted in Figure 7a,b, respectively. A solar irradiation curve is used as a reference in Figure 7a to be compared with the injected power curves during the day. The BESS controllers are enabled at 5h00 and it is driven by the rms value of phase voltage v a , which is lower compared to v bh , 1 . From this time, instance power has been requested from all BESS so that part of the local demand is covered by the storage. This state remains until 7h30 for DRES 4 and 8h15 for DRES 1 and DRES 2 . At the end of the discharging period, all BESSs are depleted almost to 25%. When the positive-sequence control strategy is used, the injected power by DRES 4 forces the phase voltage to breach the drooping threshold and the droop controller of DRES 4 is activated at 7h45. DRES 2 and DRES 1 start the active power drooping at 8h30. Eventually, the amount of the drooped energy is so great that all BESSs are charged very quickly: BESS 3 is fully charged at 9h45 while DRES 2 and DRES 1 are charged at 10h00 and 10h15, respectively. From these points on, all DRESs equipped with the positive-sequence control strategy droop renewable energy. This will eventually result in enormous losses of renewable energy and it will postpone the revenue of the prosumers despite the fact that storage is incorporated in all DRESs. The discharging moment of all BESSs occurs at 19h00, which is a bit after the peak loading and the installed storage is able to cover the rest of the peak load until 22h00 for DRES 4 to 22h30 for DRES 1 .
The obtained simulation results for the three-phase damping control strategy when g d = 5 p.u. and 10 p.u. are used, which can be seen in Figure 7. The injected active power is depicted in Figure 7c, whereas SOC curves are shown in Figure 7d. Because of its voltage unbalance mitigation abilities, all of the phase voltages are kept below the drooping threshold v cpb for a longer time compared to the positive-sequence control strategy. In these figures, it can be seen that DRES 4 enters the drooping region at 8h30 (when g d = 5 p.u.) and 8h45 (when g d = 10 p.u.) which is about 1 h later compared to the positive sequence strategy. It takes 1 h for BESS 3 to be fully charged at 10h30 (C1S2) and 10h45 (C1S3). The charge rate is similar to C1S1 but at least it is postponed with about an hour before DRES 4 starts drooping energy. As of DRES 2 and DRES 1 , the higher values of the damping conductance help to increase the voltage levels at their node connections and they enter the drooping region much later compared to the positive-sequence control strategy. On top of that, the charging rate is also slower which allows DRES 2 and DRES 1 to droop even less renewable energy for the examined period. Unlike the positive-sequence control strategy, the three-phase damping control strategy starts using the stored energy in BESS much earlier, which is closer to the start of the peak loading of the feeder. Eventually, all BESSs are depleted between 20h30 and 21h30, which is a bit earlier compared to case C0S1, but the BESS is drained for a longer time period; therefore, the local demand is supported for a longer period.
An incredible performance of the three-phase damping control strategy is achieved when the damping conductance assumes higher values such as 20 p.u. and 40 p.u. The exchanged power and the SOC curves can be seen in Figure 8a,b, respectively. DRES 4 starts drooping power much later and it charges its BESS for considerably longer time compared to the previous sub-cases. It is important to point out that BESS 2 of DRES 2 at g d = 20 p.u. is not charged to its full capacity which means all drooped power is stored in BESS 2 while BESS 1 has not even been charged because the rms voltage levels at node 4 are always below v cpb value and there is not any dropped power. The superior performance of the three-phase damping control strategy is even more prominent when g d = 40 p.u. where DRES 2 and DRES 1 do not droop any power and their BESS also remains uncharged for the rest of the examined period.
The curves of the injected power and SOC when the positive-sequence control strategy with BESS size of 14 kWh (C2S1) are presented in Figure 9a,b, respectively. Power has been requested from all BESS from 5h00 to cover the morning load peak and, since the requested power is a function of the sourcing power, the injected power by all DRESs is almost two times bigger compared to the smaller storage of 7 kWh. Despite the higher power request, the BESSs are not discharged deeper. On the contrary, they were discharged less because the higher injected power increases the voltage levels in phase a and thus the BESS controller requests less power from the storage. In this particular case, none of the BESSs are discharged below 0.3 p.u. while C1S1 has led to a discharge of 0.27 p.u. The bigger capacity also results in a slower charge rate and all BESS are fully charged in about 2 h. Nevertheless, all BESSs are full before 10h45 and from this point on until 19h00 renewable energy is been curtailed. After 19h00, all BESS controllers are driven by the rms value of v a and the local demand is supported by the storage. The double capacity is able to provide energy almost until 23h45, but this energy comes after the peak load demand.
The simulation results of the power and SOC curves obtained by using the three-phase damping control strategy are shown in Figure 9. This examination is conducted for two values of the damping conductance, namely g d = 5 p.u. and g d = 10 p.u., which correspond to case studies C2S2 and C2S3. Similar to cases C1S2 and C1S3 by using the three-phase damping control strategy, it results in a slight delay in the power drooping and also the full charging of BESS 3 . However, because of the bigger storage capacity, the saturation time of the BESSs is lower in comparison to C1S2 and C1S3, which eventually leads to less losses of renewable energy. The local demand is supported from about 16h30 until 23h15 which more or less fits in the peak loading of the feeder and thus less energy is exported to the MV network.
Finally, the results of case studies C2S4 and C2S5 are depicted in Figure 10. As it can be seen from the obtained results, the similarity of case studies C1S4 and C1S5 is very close with cases C2S4 and C2S5. There some differences in the saturation times of BESS 3 and also the peak charging of BESS 2 (at g d = 20 p.u.) is slightly lower.
In [46,47,48], the authors investigated ancillary services such as reactive power support, harmonic mitigation, voltage unbalance, etc. that DRESs could provide to the DSO. From the conducted examinations, it can be clearly seen that the three-phase damping control strategy has a great potential to provide ancillary services such as voltage control and voltage unbalance mitigation. In addition, DRESs and BESS controllers could also be a part of a multi-agent system where the different thresholds are adapted based on some parameters and input data such as optimisations and forecasts to improve system performance and use the storage in a more adaptive way, which is an interesting topic for future work.
Figure 11 shows the energy losses for the investigated period due to active power drooping when the different control strategies are examined. The first five bars represent cases C0S1–C0S5 where only a droop controller is incorporated and the simulation results show that the positive-sequence control strategy droops about 249 kWh of energy for the investigated period while the theoretical power injection of all DRESs is 472 kWh, which is a significant loss of renewable energy. If the drooped damping control strategy is used (C0S2), then the total drooped power drops down to 99 kWh which is a bit better compared to C0S1. If the three-phase damping control strategy with g d = 10 , g d = 20 p.u. and g d = 40 p.u. are used (C0S3, C0S4 and C0S5), then the total energy loss is 62 kWh, 36 kWh and 23 kWh, respectively. As anticipated, in C0S1, the major energy loss is due to drooping and it comes from DRES 4 because it is located at the end of the feeder and usually those DRESs suffer the most losses. Less energy is drooped by DRES 2 and DRES 1 because they are closer to the MV/LV transformer. The same trend is kept in cases C0S2 and C0S3. It is interesting to point out that in C0S4 the drooped power of DRES 1 is almost negligible while power drooping is entirely prevented of DRES 1 and DRES 2 in C0S5.
The energy loss when storage of 7 kWh is incorporated (cases C1S1 to C1S5) into the DRESs are also depicted in Figure 11. As expected, the positive-sequence control strategy has very high energy loss (234 kWh), which is the highest among the C1 cases but slightly lower compared to C0S1. Therefore, the added value of the storage to the positive-sequence control strategy is only about 15 kWh, which is rather insignificant. Case C1S2 has 84 kWh compared to 99 kWh of case C0S2. The performance of the three-phase damping control strategy with g d = 10 p.u. leads to energy loss of only 48 kWh compared to 62 kWh of case C0S3 where the majority of the losses comes from DRES 2 and DRES 4 . Case C1S4 the resistive behaviour is able to balance the grid voltages up to the point where DRES 1 does not droop any power. Since its BESS is depleted to some level in the morning and it is not charged in the afternoon, it results in a negative energy value in the total losses. The actual energy losses come from DRES 2 and DRES 4 and total sum is about 29 kWh. As it can be seen from Figure 8, when g d = 40 p.u. is considered, BESS 1 and BESS 2 are not charged which means that DRES 1 and DRES 2 inject all renewable energy. This also results in a negative value for the losses because of the discharged energy in the morning. The real losses are due to DRES 4 and, in this particular sub-case, they are 18 kWh for the considered period.
The energy loss when storage with a capacity of 14kWh are shown in Figure 11 as cases C2S1 to C2S4. As expected, the positive-sequence control strategy leads to the highest energy loss of 222 kWh. The damping control strategy leads to less renewable energy drooping - C2S2 -72 kWh, C2S3 -41 kWh C2S4 - 21 kWh and C2S5 -14 kWh. It is also important to highlight that, in sub-case C2S3, the majority of the energy losses is in DRES 4 , while, in sub-cases C2S4 - 21 kWh and C2S5, these losses are only due to DRES 4 .
In summary, all DRESs that are equipped with the three-phase damping control strategy are able to sink and source power for a longer time period compared to the positive-sequence control strategy. In addition, the positive-sequence control strategy depletes BESS slightly deeper compared to the three-phase damping control strategy which will result in a shorter life time of the battery storage. Despite the high damping conductance values, DRES 4 is always drooping some power.
The achieved superior performance of the three-phase damping control strategy is achieved by injecting higher current in the phase with the lowest voltage and lower currents in the phases with the highest voltages. Consequently, some oversizing of the power electronic inverter is needed in order to perform the voltage unbalance mitigation. The positive-sequence control strategy needs an inverter with a nominal phase current of about 32 A while the three-phase damping control strategy with g d = 40 p.u. needs an inverter with output nominal of 47 A which is 50% over-sizing and it would be slightly more expensive. The maximum rms values of the phase currents at different values of g d are listed in Table 5, which is valid for all cases. In summary, the BESS has a positive impact when incorporated with the three-phase damping control strategy, but the effect of energy storage becomes less prominent with the increase of the damping conductance. Providing flexibility by using storage could be another stream of revenue to the prosumers, but, in the end, it is a trade-off between oversizing the power electronic inverter and choosing the correct storage capacity for BESS.
The second row of Table 5 shows the needed power ratings of the power electronic inverter at different damping conductance values. In the same table, the prices of commercially available SMA inverters are also listed. If g d assumes values of 0, the inverter costs 2769 euro, whereas, for g d = 5 p.u., the next more powerful inverter should be selected in order to meet the required power ratings. This inverter costs 2799 euro which is only 40 euro difference compared to the positive-sequence control strategy. For damping conductance values of 10, 20 and 40 p.u., an inverter is selected which has nominal power of 30 kVA and its price is 3593.6 euro, which is around 839 euro more expensive compared to SMA Tripower Sunny 20000TL-30 (Manufactured bu SMA, Germany) and 799 euro more expensive compared to SMA Tripower Sunny 25000TL-30. Prices of TeslaWall 1.0 and TeslaWall 2.0 are also listed in the same table as well as the total system prices depending on the selected storage capacity. From the obtained simulation results in Figure 11, it can be seen that, if damping conductances of 20 to 40 p.u. are used, active power drooping does not occur. Therefore, the necessity of BESS can be avoided if the prosumer pays extra 839 euro. Nevertheless, this is applicable only to prosumers that are close to the distribution transformer. For prosumers that are located farther from the distribution transformer, active power drooping is inevitable during peak generation. Hence, investing in a BESS and a larger inverter seems to be the most appropriate solution so that the loss or renewable energy is kept as low as possible.
DRESs are well known for increasing the grid efficiency because some part of the produced energy is consumed locally. However, in the areas with increased penetration of DRES, some reverse power flow is present because of the excess of energy, which is injected back into the MV network. Including BESS in DRES improves further the system performance because the local demand can be satisfied at times when renewable energy is not present. To assess the added value of the storage to the positive-sequence and the three-phase damping control strategies, the obtained results are compared to the reference cases (C0S1–C0S4) where only active power drooping is applied.
The grid losses of the feeder of all cases are depicted in Figure 12. The positive-sequence cases droops more power compared to the other cases which means less current is flowing trough feeder and the local demand is satisfied by both the grid and the DRES. Considering the fact that the positive-sequence control strategy is not able to mitigate the voltage unbalance, this leads to higher feeder losses. In all cases, the damping conductance assuming values of 5 and 10 p.u. leads to the biggest decrease of feeder losses because of the balancing abilities of the damping control strategy, despite less drooped losses. However, when the damping conductance assumes a value of 20 p.u. and 40 p.u., all cases show an increase in the feeder losses. The loss increase is due to the fact that more energy is circulating in the feeder and some part of it is exported to the MV grid. Nevertheless, it is important to note that the losses are still lower compared to cases of the positive-sequence control strategy.

4. Conclusions

In this article, the combination of BESS with the positive-sequence and the three-phase damping control strategies was examined. The simulation results showed that, in unbalanced LV grids, the positive-sequence control strategy performs very poorly and droops incredible amount of renewable energy when equipped with a droop controller no matter what capacity of BESS is used. On the other hand, three-phase damping control strategy is able to mitigate the voltage unbalance and, by doing so, it droops less renewable energy. When storage is incorporated in it, the drooped power is further decreased. From the conducted examinations, it can be seen that the value of the damping conductance has incredible impact on the drooped energy, which can be used to decrease the capacity of BESS. Furthermore, voltage unbalance mitigation together with the storage helps to reduce the feeder losses, which is beneficial for the distribution system performance.
The superior performance of the three-phase damping control strategy, especially with high values of the damping conductance, compared to the positive-sequence control strategy is achieved by oversizing the power electronic inverter, which is associated with additional cost. However, the combination of both has the potential for the prosumer to provide more ancillary services and flexibility to the grid, which is an additional stream of revenue that can decrease the total system to payback time.

Author Contributions

D.B., M.J.M. and J.L. have written the text and performed the simulations. J.D. and L.V. have provided reviews and editing of the proposed ideas and also supervision of the process.

Funding

This research was funded by project Ports Energy and Carbon Savings (PECS) Project No. 2S03-009

Acknowledgments

The authors would like to kindly thank Marjan Jerele and Elektro Goreniska (DSO in Slovenja) for providing the data for the low voltage grid that is used in this article. The work of D.B. in this article is carried out in the frame of project Ports Energy and Carbon Savings (PECS), which is an Interreg 2 Seas project (period 2014–2020), co-funded by the European Regional Development Fund under subsidy contract No 2S01-020. The project also receives additional funding by the Dutch Provinces of North-Holland and South-Holland. The work of J.L. in this paper is carried out in the frame of the ROLECS project (ICON HBC.2018.0527), financed by Flanders Innovation and Entrepreneurship (VLAIO).

Conflicts of Interest

The authors declare no conflict of interest.

References

  1. Zsiborács, H.; Hegedűsné Baranyai, N.; Vincze, A.; Háber, I.; Pintér, G. Economic and Technical Aspects of Flexible Storage Photovoltaic Systems in Europe. Energies 2018, 11, 1445. [Google Scholar] [CrossRef]
  2. Weckx, S.; Driesen, J. Load Balancing With EV Chargers and PV Inverters in Unbalanced Distribution Grids. IEEE Trans. Sustain. Energy 2015, 6, 635–643. [Google Scholar] [CrossRef]
  3. Tolabi, H.B.; Ali, M.H.; Rizwan, M. Simultaneous Reconfiguration, Optimal Placement of DSTATCOM, and Photovoltaic Array in a Distribution System Based on Fuzzy-ACO Approach. IEEE Trans. Sustain. Energy 2015, 6, 210–218. [Google Scholar] [CrossRef]
  4. Behrouzian, E.; Bongiorno, M.; Teodorescu, R. Impact of Switching Harmonics on Capacitor Cells Balancing in Phase-Shifted PWM-Based Cascaded H-Bridge STATCOM. IEEE Trans. Power Electron. 2017, 32, 815–824. [Google Scholar] [CrossRef]
  5. Chaudhary, P.; Rizwan, M. Voltage regulation mitigation techniques in distribution system with high PV penetration: A review. Renew. Sustain. Energy Rev. 2018, 82, 3279–3287. [Google Scholar] [CrossRef]
  6. Bozalakov, D.; Laveyne, J.; Desmet, J.; Vandevelde, L. Overvoltage and voltage unbalance mitigation in areas with high penetration of renewable energy resources by using the modified three-phase damping control strategy. Electr. Power Syst. Res. 2019, 168, 283–294. [Google Scholar] [CrossRef]
  7. Shaw-Williams, D.; Susilawati, C.; Walker, G. Value of Residential Investment in Photovoltaics and Batteries in Networks: A Techno-Economic Analysis. Energies 2018, 11, 1022. [Google Scholar] [CrossRef]
  8. Yang, Y.; Li, H.; Aichhorn, A.; Zheng, J.; Greenleaf, M. Sizing Strategy of Distributed Battery Storage System with High Penetration of Photovoltaic for Voltage Regulation and Peak Load Shaving. IEEE Trans. Smart Grid 2014, 5, 982–991. [Google Scholar] [CrossRef]
  9. Hilton, G.; Cruden, A.; Kent, J. Comparative analysis of domestic and feeder connected batteries for low voltage networks with high photovoltaic penetration. J. Energy Storage 2017, 13, 334–343. [Google Scholar] [CrossRef]
  10. Chua, K.H.; Lim, Y.S.; Taylor, P.; Morris, S.; Wong, J. Energy Storage System for Mitigating Voltage Unbalance on Low-Voltage Networks with Photovoltaic Systems. IEEE Trans. Power Deliv. 2012, 27, 1783–1790. [Google Scholar] [CrossRef]
  11. Faessler, B.; Schuler, M.; Preißinger, M.; Kepplinger, P. Battery Storage Systems as Grid-Balancing Measure in Low-Voltage Distribution Grids with Distributed Generation. Energies 2017, 10, 2161. [Google Scholar] [CrossRef]
  12. Hesse, H.C.; Martins, R.; Musilek, P.; Naumann, M.; Truong, C.N.; Jossen, A. Economic Optimization of Component Sizing for Residential Battery Storage Systems. Energies 2017, 10, 835. [Google Scholar] [CrossRef]
  13. Zangs, M.J.; Adams, P.B.E.; Yunusov, T.; Holderbaum, W.; Potter, B.A. Distributed Energy Storage Control for Dynamic Load Impact Mitigation. Energies 2016, 9, 647. [Google Scholar] [CrossRef]
  14. Idlbi, B.; von Appen, J.; Kneiske, T.; Braun, M. Cost-Benefit Analysis of Battery Storage System for Voltage Compliance in Distribution Grids with High Distributed Generation. Energy Procedia 2016, 99, 215–228. [Google Scholar] [CrossRef]
  15. Rodrigues, S.; Torabi, R.; Ramos, H.G.; Morgado-Dias, F. Powerwall 2.0 economic feasibility in Australia. In Proceedings of the 2017 International Conference in Energy and Sustainability in Small Developing Economies (ES2DE), Funchal, Madeira Island, 10–13 July 2017. [Google Scholar]
  16. Zeh, A.; Witzmann, R. Operational Strategies for Battery Storage Systems in Low-voltage Distribution Grids to Limit the Feed-in Power of Roof-mounted Solar Power Systems. Energy Procedia 2014, 46, 114–123. [Google Scholar] [CrossRef]
  17. Nguyen, S.; Peng, W.; Sokolowski, P.; Alahakoon, D.; Yu, X. Optimizing rooftop photovoltaic distributed generation with battery storage for peer-to-peer energy trading. Appl. Energy 2018, 228, 2567–2580. [Google Scholar] [CrossRef]
  18. Bozalakov, D.V.; Vandoorn, T.L.; Meersman, B.; Papagiannis, G.K.; Chrysochos, A.I.; Vandevelde, L. Damping-Based Droop Control Strategy Allowing an Increased Penetration of Renewable Energy Resources in Low-Voltage Grids. IEEE Trans. Power Deliv. 2016, 31, 1447–1455. [Google Scholar] [CrossRef]
  19. Vandevelde, L.; Meersman, B. Increasing the Penetration of the Renewable Energy Sources in the Distribution Grid by Developing Control Strategies and Using Ancillary Services (INCREASE); EC-FP7 Project, Grant Agreement No.: 608998; European Commission: Brussels, Belgium, 2016. [Google Scholar]
  20. Kontis, E.O.; Kryonidis, G.C.; Chrysochos, A.I.; Demoulias, C.S.; Papagiannis, G.K. Long-term evaluation of DRES penetration in LV networks using droop control techniques. In Proceedings of the 2016 IEEE PES Innovative Smart Grid Technologies Conference Europe (ISGT-Europe), Ljubljana, Slovenia, 9–12 October 2016. [Google Scholar]
  21. Voltage characteristics of electricity supplied by public distribution networks. In EN Standard 50160-2008; CEN-CENELEC Management Centre: Brussels, Belgium, 2008.
  22. Keerthisinghe, C.; Verbič, G.; Chapman, A.C. A Fast Technique for Smart Home Management: ADP With Temporal Difference Learning. IEEE Trans. Smart Grid 2018, 9, 3291–3303. [Google Scholar] [CrossRef]
  23. Conti, S.; Faraci, G.; Nicolosi, R.; Rizzo, S.A.; Schembra, G. Battery Management in a Green Fog-Computing Node: A Reinforcement-Learning Approach. IEEE Access 2017, 5, 21126–21138. [Google Scholar] [CrossRef]
  24. Marra, F.; Yang, G.; Træholt, C.; Østergaard, J.; Larsen, E. A Decentralized Storage Strategy for Residential Feeders With Photovoltaics. IEEE Trans. Smart Grid 2014, 5, 974–981. [Google Scholar] [CrossRef]
  25. Alam, M.J.E.; Muttaqi, K.M.; Sutanto, D. Distributed energy storage for mitigation of voltage-rise impact caused by rooftop solar PV. In Proceedings of the 2012 IEEE Power and Energy Society General Meeting, San Diego, CA, USA, 22–26 July 2012. [Google Scholar]
  26. Blaabjerg, F.; Teodorescu, R.; Liserre, M.; Timbus, A.V. Overview of Control and Grid Synchronization for Distributed Power Generation Systems. IEEE Trans. Ind. Electron. 2006, 53, 1398–1409. [Google Scholar] [CrossRef]
  27. Meersman, B.; Renders, B.; Degroote, L.; Vandoorn, T.; Vandevelde, L. The influence of grid-connected three-phase inverters on voltage unbalance. In Proceedings of the IEEE PES General Meeting, Providence, RI, USA, 25–29 July 2010; pp. 1–9. [Google Scholar]
  28. Liserre, M.; Teodorescu, R.; Rodriguez, P.; Blaabjerg, F.; Timbus, A. Independent synchronization and control of three phase grid converters. In Proceedings of the International Symposium on Power Electronics, Electrical Drives, Automation and Motion (SPEEDAM), Taormina, Italy, 23–26 May 2006. [Google Scholar]
  29. Liserre, M.; Teodorescu, R.; Rodriguez, P.; Blaabjerg, F.; Timbus, A. PLL algorithm for power generation systems robust to grid voltage faults. In Proceedings of the 37th IEEE Power Electronics Specialist Conference (PESC 2006), Jeju, Korea, 18–22 June 2006. [Google Scholar]
  30. Chung, S.K. A phase tracking system for three phase utility interface inverters. IEEE Trans. Power Electron. 2000, 15, 431–438. [Google Scholar] [CrossRef]
  31. Meersman, B.; Renders, B.; Degroote, L.; Vandoorn, T.; Vandevelde, L. Three-phase inverter-connected DG-units and voltage unbalance. Electr. Power Syst. Res. 2011, 81, 899–906. [Google Scholar] [CrossRef]
  32. Bozalakov, D.V.; Mnati, M.J.; Laveyne, J.; den Bossche, A.V.; Vandevelde, L. Voltage Unbalance and Overvoltage Mitigation by Using the Three-phase Damping Control Strategy in Battery Storage Applications. In Proceedings of the 2018 7th International Conference on Renewable Energy Research and Applications (ICRERA), Paris, France, 14–17 October 2018; pp. 753–759. [Google Scholar]
  33. Meersman, B. Control of 3-Phase Inverter-Connected Distributed Generators Regarding the Improvement of the Power Quality. Ph.D. Thesis, Universiteit Gent, Faculteit Ingenieurswetenschappen en Architectuur, Ghent, Belgium, 2012. [Google Scholar]
  34. Bozalakov, D.; Meersman, B.; Bottenberg, A.; Rens, J.; Desmet, J.; Vandevelde, L. Dc-bus voltage balancing controllers for split dc-link four-wire inverters and their impact on the quality of the injected currents. CIRED Open Access Proc. J. 2017, 2017, 564–568. [Google Scholar] [CrossRef]
  35. Vandoorn, T.L.; Meersman, B.; Degroote, L.; Renders, B.; Vandevelde, L. A Control Strategy for Islanded Microgrids With DC-Link Voltage Control. IEEE Trans. Power Deliv. 2011, 26, 703–713. [Google Scholar] [CrossRef]
  36. Renders, B. Convertor-Gekoppelde Decentrale Generatoren en Netkwaliteit in Laagspanningsnetten. Ph.D. Thesis, Universiteit Gent, Faculteit Ingenieurswetenschappen, Gent, Belgium, 2009. [Google Scholar]
  37. Renders, B.; Gusseme, K.D.; Ryckaert, W.R.; Vandevelde, L. Input impedance of grid-connected converters with programmable harmonic resistance. IET Electr. Power Appl. 2007, 1, 355–361. [Google Scholar] [CrossRef]
  38. Ryckaert, W.R.; Gusseme, K.D.; de Sype, D.M.V.; Ghijselen, J.A.; Melkebeek, J.A. Reduction of the voltage distortion with a converter employed as shunt harmonic impedance. In Proceedings of the APEC 2005 Twentieth Annual IEEE Applied Power Electronics Conference and Exposition, Austin, TX, USA, 6–10 March 2005; Volume 3, pp. 1805–1810. [Google Scholar]
  39. Bozalakov, D.; Vandoorn, T.; Meersman, B.; Demoulias, C.; Vandevelde, L. Voltage dip mitigation capabilities of three-phase damping control strategy. Electr. Power Syst. Res. 2015, 121, 192–199. [Google Scholar] [CrossRef]
  40. Vavilapalli, S.; Padmanaban, S.; Subramaniam, U.; Mihet-Popa, L. Power Balancing Control for Grid Energy Storage System in Photovoltaic Applications—Real Time Digital Simulation Implementation. Energies 2017, 10, 928. [Google Scholar] [CrossRef]
  41. Cappelle, J.; Vanalme, J.; Vispoel, S.; Maerhem, T.V.; Verhelst, B.; Debruyne, C.; Desmet, J. Introducing small storage capacity at residential PV installations to prevent overvoltages. In Proceedings of the 2011 IEEE International Conference on Smart Grid Communications (SmartGridComm), Brussels, Belgium, 17–20 October 2011; pp. 534–539. [Google Scholar]
  42. Hashemi, S.; Østergaard, J. Efficient Control of Energy Storage for Increasing the PV Hosting Capacity of LV Grids. IEEE Trans. Smart Grid 2018, 9, 2295–2303. [Google Scholar]
  43. Thesla Powerwall 2 DC. Available online: https://www.solahart.com.au/media/2849/powerwall-2-dc_datasheet_english.pdf (accessed on 15 April 2019).
  44. Kryonidis, G.C.; Kontis, E.O.; Chrysochos, A.I.; Demoulias, C.S.; Bozalakov, D.; Meersman, B.; Vandoorn, T.L.; Vandevelde, L. A simulation tool for extended distribution grids with controlled distributed generation. In Proceedings of the 2015 IEEE Eindhoven PowerTech, Eindhoven, The Netherlands, 29 June–2 July 2015. [Google Scholar]
  45. Degroote, L.; Renders, B.; Meersman, B.; Vandevelde, L. Neutral-point shifting and voltage unbalance due to single-phase DG units in low voltage distribution networks. In Proceedings of the 2009 IEEE Bucharest PowerTech, Bucharest, Romania, 28 June–2 July 2009. [Google Scholar]
  46. Xavier, L.S.; Cupertino, A.F.; Pereira, H.A. Ancillary services provided by photovoltaic inverters: Single and three phase control strategies. Comput. Electr. Eng. 2018, 70, 102–121. [Google Scholar] [CrossRef]
  47. Safa, A.; Berkouk, E.M.; Messlem, Y.; Gouichiche, A. A robust control algorithm for a multifunctional grid tied inverter to enhance the power quality of a microgrid under unbalanced conditions. Int. J. Electr. Power Energy Syst. 2018, 100, 253–264. [Google Scholar] [CrossRef]
  48. Olek, B.; Wierzbowski, M. Local Energy Balancing and Ancillary Services in Low-Voltage Networks With Distributed Generation, Energy Storage, and Active Loads. IEEE Trans. Ind. Electron. 2015, 62, 2499–2508. [Google Scholar] [CrossRef]
  49. Available online: http://www.europe-solarshop.com/inverters/sma.html (accessed on 15 April 2019).
  50. Available online: https://zerohomebills.com/product/sma-sunny-tripower-30000tl-us-10-30kw-solar-inverter/ (accessed on 15 April 2019).
  51. Available online: https://zerohomebills.com/product/tesla-powerwall-7-kw-with-storedge-dc-system/ (accessed on 15 April 2019).
  52. Available online: https://www.tesla.com/powerwall (accessed on 15 April 2019).
Figure 1. Active power drooping (APD) based on the voltage-based droop control.
Energies 12 01501 g001
Figure 2. Active power droop controller and BESS controller used for the integration in the examined control strategies.
Energies 12 01501 g002
Figure 3. Feeder topology used to access the performance the examined control strategies.
Energies 12 01501 g003
Figure 4. Solar irradiation and load profiles used in the simulation model.
Energies 12 01501 g004
Figure 5. Voltage profile of phase b during an entire day when the positive-sequence and three-phase damping (under two values of gd) control strategies and storage capacities are examined.
Energies 12 01501 g005
Figure 6. Reaction of the BESS controllers when positive-sequence (gd = 0) p.u. and three-phase damping control (gd = 20) p.u. strategies are examined at different time instances.
Energies 12 01501 g006
Figure 7. Injected power and SOC of all DRES when the positive-sequence and the three-phase damping control strategies are examined (C1S1, C1S2 and C1S3).
Energies 12 01501 g007
Figure 8. Injected power and SOC of all DRES when the the three-phase damping control strategy is examined (C1S4 and C1S5).
Energies 12 01501 g008
Figure 9. Injected power and SOC of all DRES when the positive-sequence and the three-phase damping control strategies are examined (C2S1, C2S2 and C2S3).
Energies 12 01501 g009
Figure 10. Injected power and SOC of all DRES when the the three-phase damping control strategy is examined (C2S4 and C2S5).
Energies 12 01501 g010
Figure 11. Total losses of renewable energy due to drooping of active power of all DRES when different test cases are studied.
Energies 12 01501 g011
Figure 12. Feeder losses depending on the examined case study.
Energies 12 01501 g012
Table 1. Properties of the LV feeder.
LINER 1 ( Ω /km)X 1 ( Ω /km)C 1 (nF/km)R 0 ( Ω /km)X 0 ( Ω /km)Length (km)
LV-20.4560.08825040.08770.057
2-30.4680.08525040.08510.094
3-40.480.0825040.080.025
4-50.4620.08325040.08330.132
5-60.9240.07620040.07580.066
Table 2. Nominal power of DRES and storage capacity.
DRESRated ActiveCase 0Case 1Case 2
PowerCapacity/Output PowerCapacity/Output PowerCapacity/Output Power
Node 2 DRES 1 20 kW (Y)0 kWh/ 0 kW7 kWh/3.3 kW (0.35) *14 kWh/5 kW (0.70) *
Node 4 DRES 2 20 kW (Y)0 kWh/ 0 kW7 kWh/3.3 kW (0.35) *14 kWh/5 kW (0.70) *
Node 5 DRES 3 5 kW/bn---
Node 6 DRES 4 20 kW(Y)0 kWh/ 0 kW7 kWh/3.3 kW (0.35) *14 kWh/5 kW (0.70) *
* Ratio between the capacity of BESS and the nominal power ratings of the DRES.
Table 3. Nominal power of the loads and type of connection.
LoadRated Active PowerRated Reactive Power
Node 3 Load 1 (Y)4.5/2.7/2.7 kW2.17/1.3/1.3 kvar
Node 4 Load 2 (Y)3.6/3.6/3.6 kW1.74/1.74/1.74 kvar
Node 6 Load 3 (Y)5.4/3.6/3.6 kW2.61/1.74/1.74 kvar
Table 4. Examined test cases.
g d = 0 p.u. g d = 5 p.u. g d = 10 p.u. g d = 20 p.u. g d = 40 p.u.
Case 0 (APD)C0S1C0S2C0S3C0S4C0S5
Case 1—7 kWhC1S1C1S2C1S3C1S4C1S5
Case 2—14 kWhC2S1C2S2C2S3C2S4C2S5
Table 5. Maximum current ratings of the power electronic inverters as a function of the damping conductance and storage.
Parameter g d = 0 p.u. g d = 5 p.u. g d = 10 p.u. g d = 20 p.u. g d = 40 p.u.
I max [A]3238424547
P [kW]2023.626.12829.2
Inverter typeSMA TripowerSMA TripowerSMA TripowerSMA TripowerSMA Tripower
SunnySunnySunnySunnySunny
20000TL-3025000TL-3030000TL-US-1030000TL-US-1030000TL-US-10
Inverter S max [kVA]2025303030
Inverter cost [Euro]2769.00 [49]2799.00 [49]3593.60 [50]3593.60 [50]3593.60 [50]
TeslaWall 1.0 price [Euro]4522.3 [51]4522.3 [51]4522.3 [51]4522.3 [51]4522.3 [51]
TeslaWall 2.0 price [Euro]7740 [52]7740 [52]7740 [52]7740 [52]7740 [52]
Total7291.3 *7321.3 *8115.9 *8115.9 *8115.9 *
10,509 **10,549 **11,333.6 **11,333.6 **11,333.6 **
* Solar inverter + TeslaWall 1.0; ** Solar inverter + TeslaWall 2.0.

