1. Introduction
Nowadays, we are moving from hierarchical power distribution networks to smart distributed systems, where control policies (or services in general) and Renewable Energy Sources (RES) are pervasively deployed across distribution networks. This distributed power network, also known as smart grid, must provide features to be self-healing and resilient to anomalies [
1]. To foster this transition and to systematically shift existing control and protection paradigms to a full smart grid view, we need to map new use cases and services to Smart Grid Architecture Model (SGAM) [
2].
As defined in [
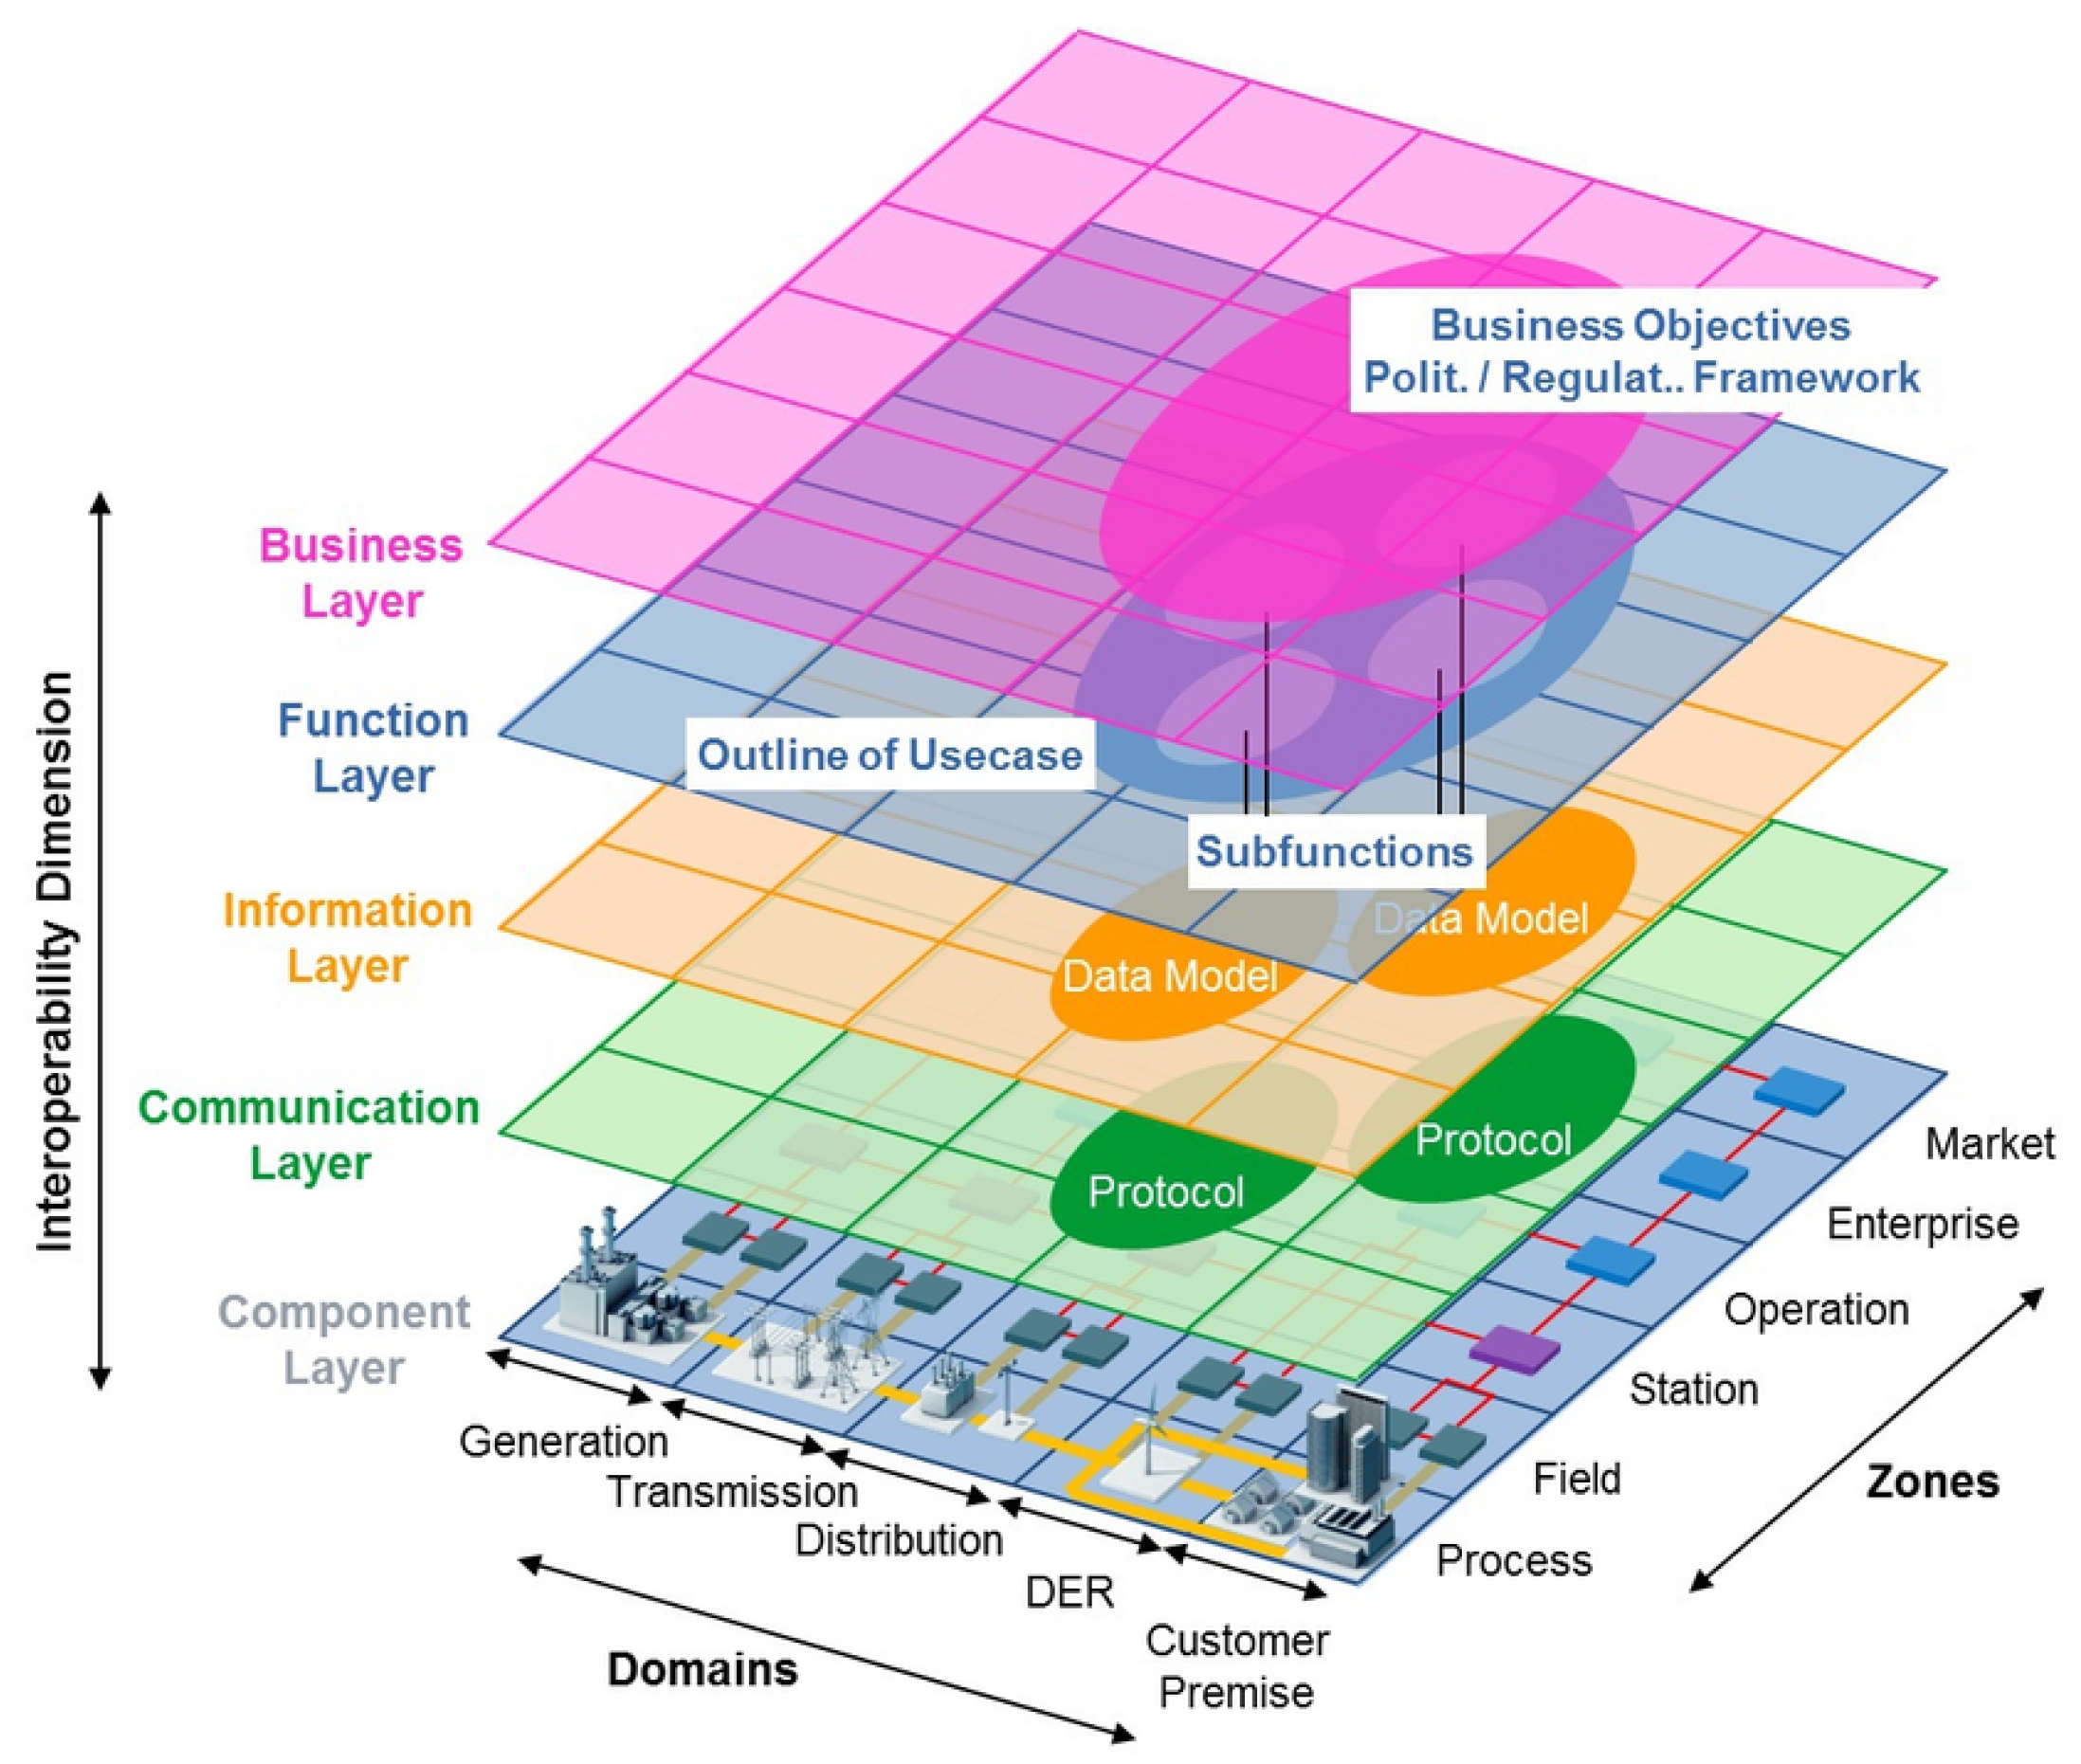
2], SGAM is a methodology that helps in designing new smart grid’s use cases and services with an architectural approach. This methodology allows a neutral representation of the involved technologies highlighting their interoperability supported by standards and, consequently, enabling standards gap analysis. For this purpose, SGAM defines a three-dimensional model (see
Figure 1) consisting of five interoperable layers: (i)
Component Layer, (ii)
Communication Layer, (iii)
Information Layer, (iv)
Function Layer and (v)
Business Layer.
To test and validate novel services and algorithms for smart grids, a near real-world environment is needed [
1]. Hence, to study the interoperability in smart grids based on SGAM, we need to combine different tools and simulators that concurrently reproduce the behaviour of the five SGAM layers for different use cases. Thus, we need a distributed real-time co-simulation framework able to simulate systems and to test and verify performance of new general-purpose services. In this view, distributed real-time simulations (RTS) can support the research efforts to meet emerging lab test requirements [
3,
4,
5].
RTS is the most reliable tool for electromagnetic transient analysis (EMT) in power systems, which is greatly flexible and scalable thanks to its computation parallelism feature. Different software algorithms and functions, as well as various hardware devices, could be tested using RTS through so-called software in-the-loop and hardware in-the-loop set-ups. This can reduce costs and enable more complete and continuous testing of the entire system without interruption, with many possible configurations, and safely under possibly dangerous conditions.
Considering the importance of both SGAM and co-simulation, and noting the great contribution which RTS could add, we developed a distributed SGAM-based co-simulation platform that integrates RTS functionalities with distributed software components for smart grid management (e.g., device management, data collection and services) so that use case developers could also partially use real-world systems by coupling hardware devices or using actual measurements in real-time. The system under test could be replaced by the real physical system as the last phase of test and validation before completely deploying the new system in the field. In this view, all physical components of the electric system can be modelled and simulated by Digital Real Time Simulators (DRTSs). However, some of these components like intelligent electronic devices including meters could be decoupled from the core of DRTS, in case they are real (physical) devices or prototypes. This so-called hardware in-the-loop experiment enables more complete and real-like testing of the system for interoperability analysis of new devices.
ICT (Information and Communication Technology) infrastructure gives to the Smart Grid the character of a complex cyber-physical system [
6]: hardware and software elements acting together to foster innovative automation and control process in the grid management. Unfortunately, the cost of developing and deploying real-world testbed to assess innovation feasibility is too high and risky. Resiliency of the power grid could come under stress during the testing of new Smart Grid technologies. Hence, the co-simulation of the communication network and the power system infrastructure has become of primary importance in the Smart Grid challenge to determine the benefit of these innovation [
7,
8].
In this paper, we present a novel distributed real-time co-simulation framework based on SGAM. To prove platform functionalities, we also propose a novel algorithm for wide area measurement-free monitoring of smart grids under high PV Penetration. Our co-simulation framework is flexible on integrating and testing different services, even concurrent, to realize distributed intelligence in smart grids. The scientific novelty of the proposed co-simulation framework consists of:
providing a test and validation tool to evaluate performance and operation of novel smart grid’s use cases based on SGAM;
providing modularity, flexibility and scalability to easily test new use cases in a plug-and-play fashion;
allowing an interoperability analysis of all the entities either hardware or software) involved in the simulation scenario;
integrating digital real-time simulators to grant even the opportunity of performing hardware in-the-loop simulations;
integrating ICT network simulators (i.e., OMNeT++ [
9]) to study the impact of new Internet-connected technologies (i.e., Internet-of-Things devices) on the communication networks;
integrating third party software (e.g., smart metering architectures [
10]) to allow distributed software in-the-loop simulations by exploiting even data collected by real-world Internet-of-Things (IoT) devices.
As mentioned before, to prove our platform functionalities, we proposed also a novel solution to use distribution state estimation for active distribution networks in which rooftop PV panels are being increasingly installed in the low voltage grid, while no wide area measurement is available. There are currently several methods used in distribution state estimation of active networks; however, these methods need sparse real-time measurements, which requires a communication infrastructure with large bandwidth and high reliability. Most current networks do not have wide area measurements, while they are rapidly accommodating more and more distributed generations, especially rooftop PV panels in low voltage residential grids. The novelty of our proposed distribution state estimator is to monitor these evolving smart grids during the transitory period when smart meters are not widely deployed in the system for collecting real-time measurements from PVs.
The rest of the paper is organized as follows:
Section 2 reviews relevant literature solutions.
Section 3 presents the proposed software architecture for general purpose services in smart grids based on SGAM. To better explain what the general and specific elements are, we map our developed use case to SGAM.
Section 4 then introduces in detail our use case solution for wide area monitoring of smart grids with high penetration of PV production, without collecting measurements from secondary substations or prosumers.
Section 5 presents both the case study and the experimental results of the use case. Finally,
Section 6 discusses the concluding remarks.
3. SGAM-Based Co-Simulation Architecture
Future smart grid will be complex and distributed systems that will bring new challenges to the system analysis, control and management. In this context, the interdependency and interoperability of the different distributed actors playing in a smart grid requires wide and accurate test and analysis before field implementation.
In this section, we present our proposed co-simulation architecture that follows the SGAM model depicted in
Figure 1. It is a distributed infrastructure that has been designed to be flexible and scalable for testing different general-purpose smart grid’s services in a plug-and-play fashion. Our architecture exploits Internet-of-Things (IoT) communication paradigms and technologies that allow a fast bidirectional communication among the actors in the smart grid, either hardware or software.
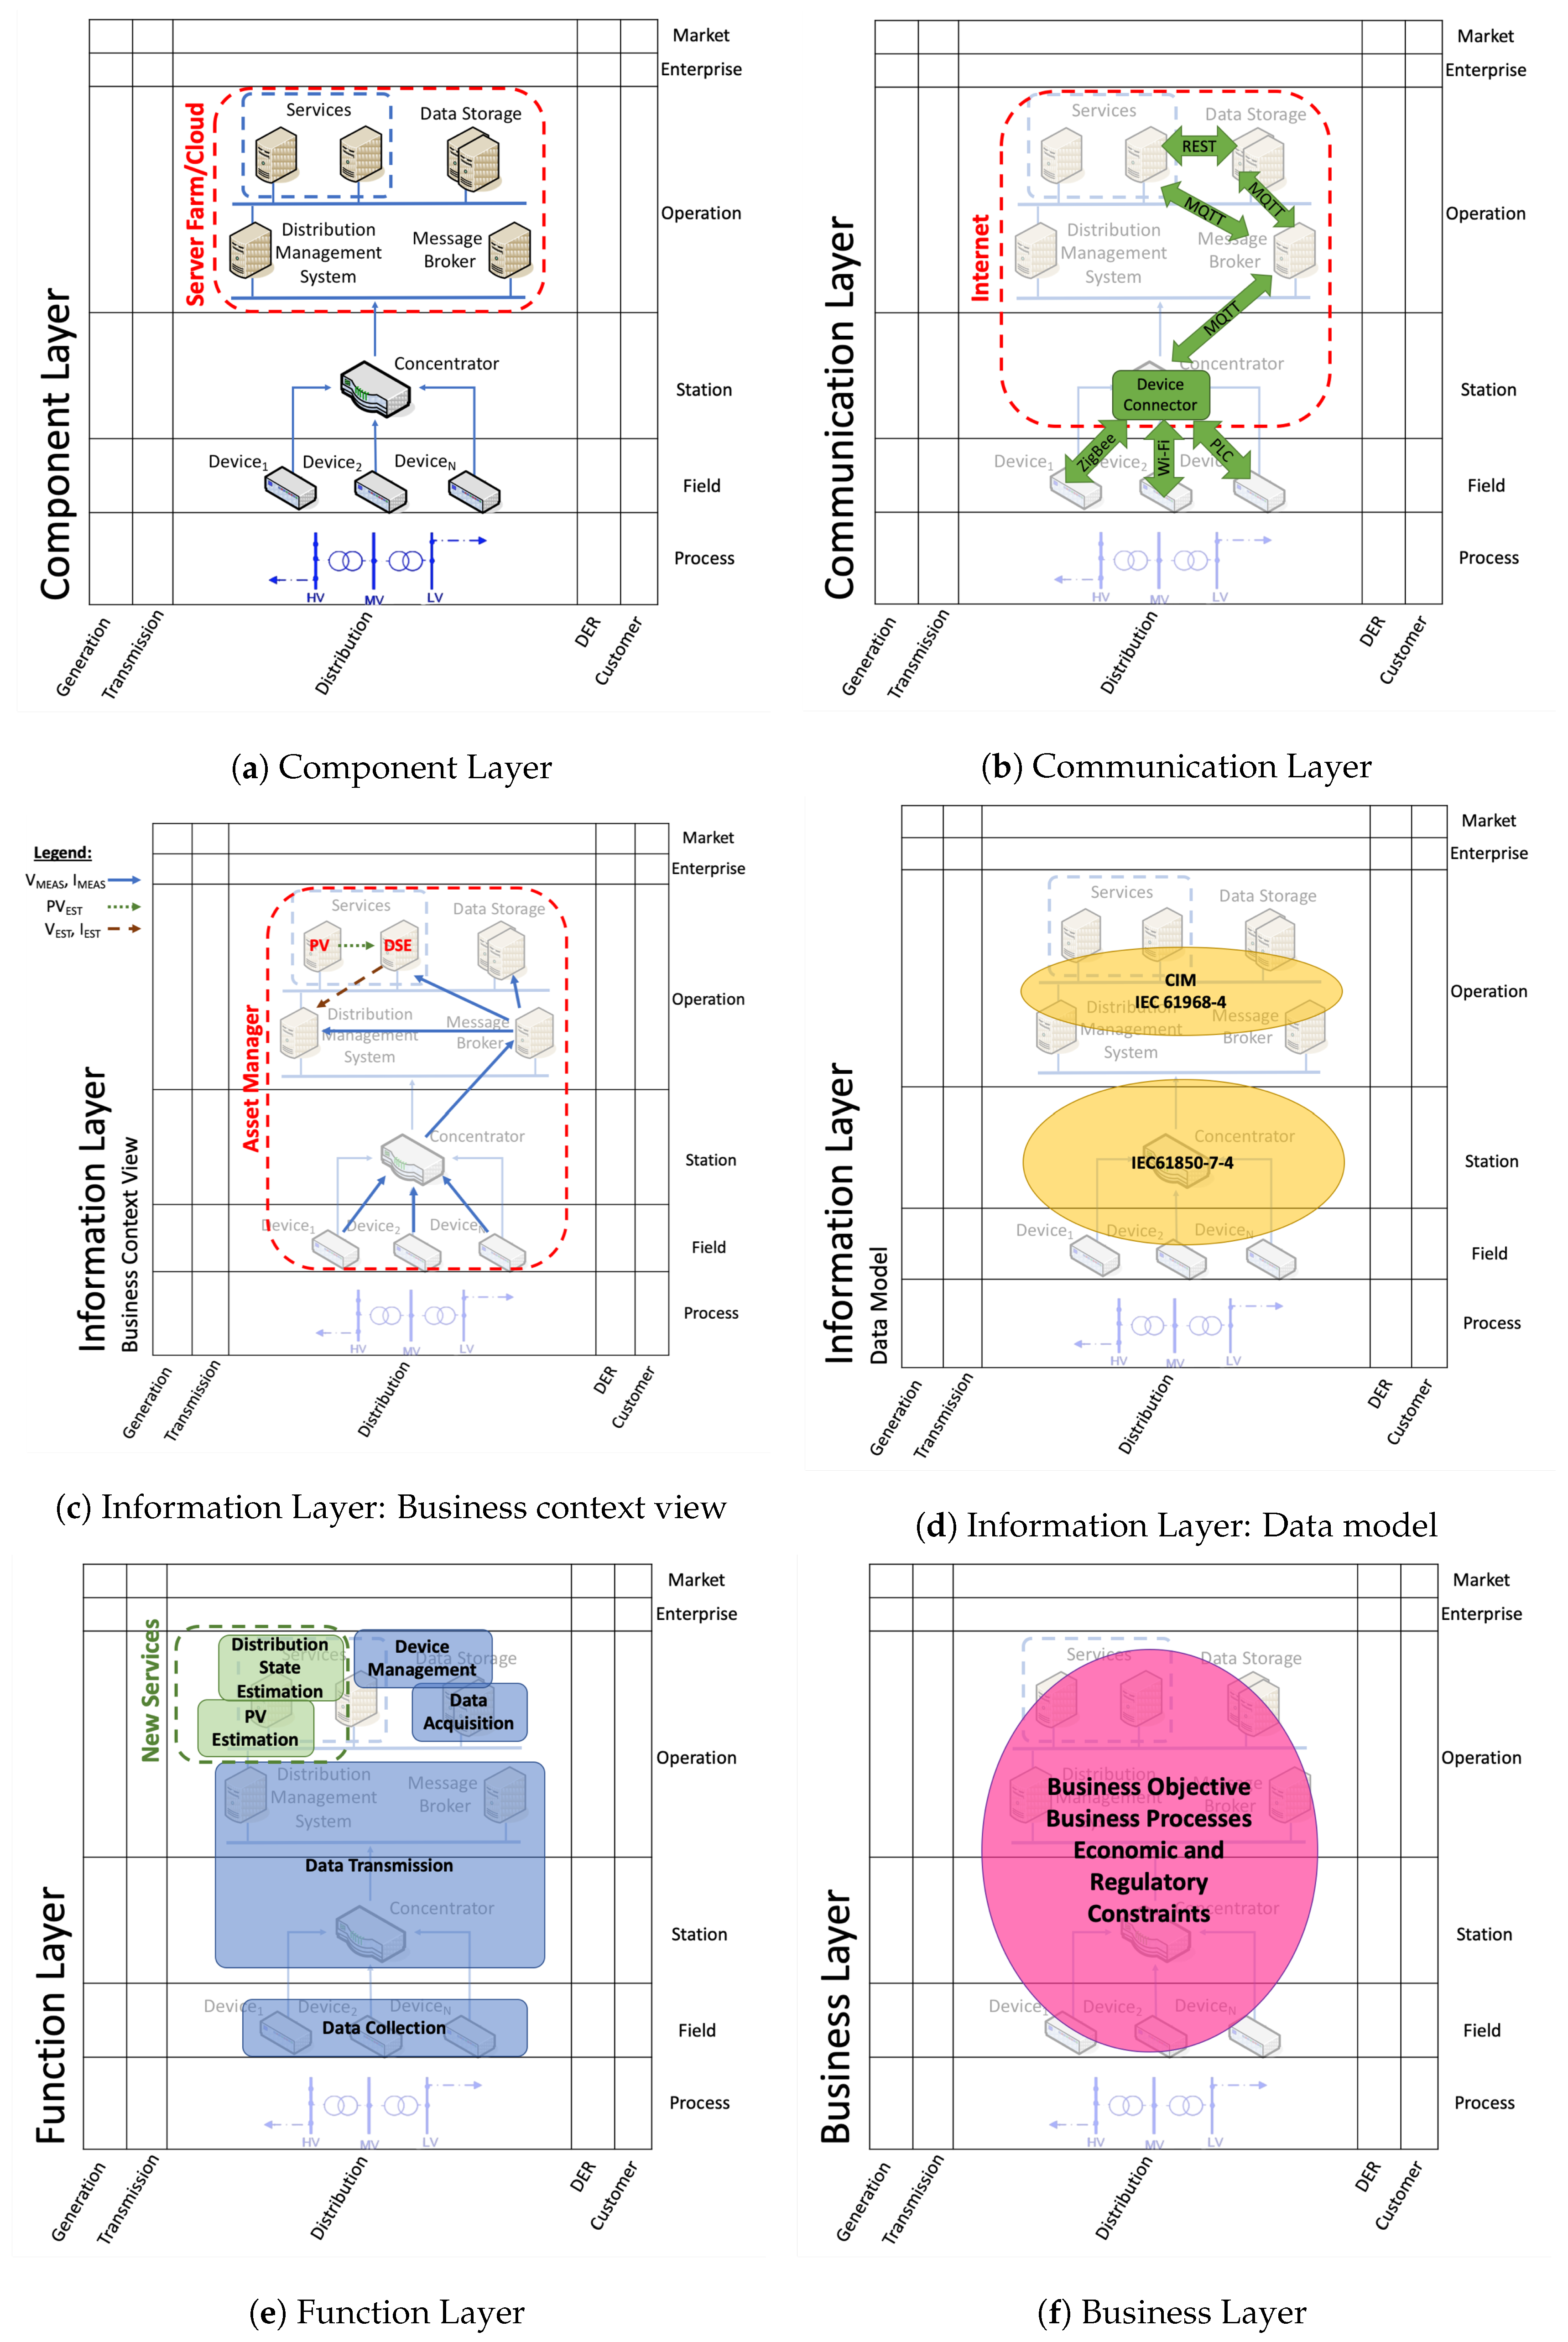
Figure 2 depicts our co-simulation architecture for each SGAM layer. The rest of this section describes each layer of the proposed co-simulation architecture in more detail.
3.1. Component Layer
The
Component Layer (see
Figure 2a) includes all the possible hardware technologies that can be installed to perform different services in a distribution network. As shown in the figure, the distribution network is constantly monitored and actuated by a certain number of heterogeneous
Devices that exploit a
Concentrator to send information and receive commands to/from a clusters of servers where
Distribution Management System,
Message Broker,
Data Storage and
Services are deployed. These servers can be physically in a remote server farm or in the cloud. The
Distribution Management System is a collection of applications used by the Distribution System Operators (DSO) to monitor, control and optimize the performance of the distribution system and manage it. The
Message Broker allows an asynchronous bidirectional communication among the actors in the system through the MQTT (Message Queue Telemetry Transport) protocol [
30]. The
Data Storage consists of different non-relational databases that are specifically developed for Big Data management ensuring scalability and clusterization. More in depth, our co-simulation architecture implements: (i) InfluxDB [
31], an open-source time-series database, to collect measurements from devices and (ii) MongoDB [
32], an open-source document-oriented database, to store all the relation between the actors in the system. Finally,
Services are all those distributed algorithms needed to maintain and enhance the operational status of the smart grid, such as
PV Simulator and
Distribution State Estimator (see
Section 4).
In our co-simulation infrastructure, the distribution network can be either real or simulated through Digital Real-Time Simulators (DRTS), such as OPAL-RT. DRTS reproduces the behaviour of a real electric distribution system, which is modelled as a testbed for testing and validation of new technologies, management algorithms or control strategies. DRTS allows also to perform software in-the-loop or hardware in-the-loop simulations [
33].
For power system electromagnetic transient analysis (EMT), real-time simulation is very reliable with flexibility and scalability due to its computation parallelism feature. All physical components of the electric system can be modelled and simulated by DRTS; this would correspond to the process, field, and station zones in SGAM. However, some of these components like intelligent electronic devices including meters which are normally mapped to the field zone, or data concentrators which are mapped to the station zone could be decoupled from the core of DRTS, in case they are real (physical) devices or prototypes. This so-called hardware in-the-loop experiment enables more complete and real-like testing of the system for interoperability analysis of new devices.
3.2. Communication Layer
The
Communication Layer includes all the protocols and the software components to allow a fast bidirectional communication over the Internet. As shown in
Figure 2b, our co-simulation platform exploits two main protocols for the communication over the Internet: (i)
MQTT [
30] and (ii) REST (Representational State Transfer) [
34], whilst the heterogeneous
Devices deployed along the smart grid communicates with different low-level protocols either wireless or wired, such as ZigBee, Wi-Fi or PLC.
MQTT protocol [
30] enables an asynchronous bidirectional communication to send data in (near-) real time. It implements the publish/subscribe approach [
35]. This paradigm removes the interdependencies between information producer and consumer that increases the scalability of the whole co-simulation platform [
28]. This allows for developing distributed services and algorithms that can react to specific events in (near-) real-time ensuring independency from data-sources. On the other hand, REST [
34] implements a synchronous communication based on the request/response communication paradigm, which is complementary to publish/subscribe. REST represents a system for transmitting data over the HTTP protocol and it is widely used to develop Web Services.
To integrate the heterogeneous devices in our co-simulation platform and to enable the interoperability among them, we developed different
Device Connectors (DeCs). DeC is software component that acts as bridge between our platform and the underlying technologies providing MQTT functionalities, both for publishing and subscribing. In particular, it converts information coming from devices into a common data-format adopted by our platform and send it through the MQTT protocol, and vice versa. Each technology needs its own DeC, which is a key component to allow us in using each low-level technology transparently. To develop the different DeCs, we followed a methodology described in [
36]. DeCs are installed in the
Concentrators, thus, physically closed to the devices to be integrated. In addition, we developed a specific DeC to integrate also DRTS (e.g., OPAL-RT) into our co-simulation platform.
To assess the impact on data transmission according to different Internet media, the
Communication Layer includes also OMNeT++ [
9], which is a framework to simulate different physical layers and protocols in communication networks (e.g., 5G, 4G and fibre optics). We integrated OMNeT++ in our co-simulation platform following a methodology in [
37,
38] based on socket connections. In a testbed environment, OMNeT++ can be installed in a server that works as a virtual router that simulates the different network technologies. In this view, all the traffic generated by the actors in the co-simulation platform is routed through our OMNeT++ virtual router to evaluate delays, congestions and packet losses in the communication for each Internet media.
3.3. Information Layer
The
Information Layer defines categories, properties and relations between the actors, either hardware or software, playing in a smart grid domain (e.g., places, substations and devices). This includes information flows and data models (see
Figure 2c,d, respectively). This information is georeferenced and is handled by the
Asset Manager, which can be installed in a server together with the
Data Store where this information is collected.
In case of the proposed wide area measurement-free monitoring system (see
Section 4),
Figure 2c shows the relations among senders and receivers together with the different information flows.
Devices send
and
to
Distribution Management System,
Data Storage and
Services through the
Concentrator and the
Message Broker via MQTT, whilst the
Distribution State Estimator (DSE) receives information about PV estimation,
, and provides as output
and
to
Distribution Management System via REST.
The actors in the proposed platform exploit the JSON open-standard format to exchange information among them. We choose JSON because it is becoming a common data-format for data exchange in the Web and across IoT devices. It uses human-readable text to transmit data objects consisting of key-value pairs.
Regarding the common information model, our platform is compliant with both IEC 61968 and IEC 61850 standards [
39] (see
Figure 2d). IEC 61968-4 [
40] defines the information model for data exchange between devices and networks in electrical distribution systems, whilst IEC 61850-7-4 [
41] defines the communication between devices in transmission, distribution and substation automation systems.
3.4. Function Layer
The
Function Layer includes all services and algorithms that a specific use case provides. Our co-simulation platform includes the following main functionalities (refers to blue-boxes in
Figure 2e): (i)
Data Collection performed by
Devices to monitor and collect physical behaviours; (ii)
Data Transmission to route data and messages from/to the actors in the system through the Internet; (iii)
Data Acquisition to store information; (iv)
Device Management to remotely manage all the devices deployed in the smart grid. The
Device Management features are implemented by the
Device Manager, which is another software component in our platform physically installed in a remote server farm or in the cloud.
In addition, this layer provides the functionalities of each individual service for smart grids (refers to green-boxes in
Figure 2e). As an example, in case of the proposed wide area measurement-free monitoring system (see
Section 4), the platform includes also
PV Estimation and
Distribution State Estimation to estimate the status of the grid with photovoltaic systems.
Our platform is flexible in integrating and testing more services and modules (such as new models for renewable energy systems) to realize distributed intelligence. Since this architecture has been designed to be modular, services can either play concurrently or be replaced in a plug-and-play fashion. Thanks to the IoT communication paradigms and technologies adopted to exchange data among the actors in the platform, services can be assessed in testbed environments by exploiting DRTS, or even in real-world scenarios by using real Devices deployed across the smart grid. Replacements or updates can be done without affecting the rest of the platform.
3.5. Business Layer
The
Business Layer accommodates the use case business processes, services and organizations. This includes the business objectives, regulatory and economic constraint related to the use case.
Figure 2f represents the zones and domains affected by the use case and consequently influenced by underlying business objectives and economic and regulatory constraints. This layer would include the content, structure, and governance of transactions anticipated to create value by taking advantage of business opportunities [
42].
The business layer contains non-functional requirements for implementation. Therefore, we do not associate directly some physical components to run/serve such contents. Nevertheless, a business model needs to establish the content and structure. As an example, for the use case, we developed and demonstrated in this work, the business model in general is “monitoring wide area of distribution grid”, and, as a detailed view, it can “monitor system normal state violations or operation interruptions and report to regulator”. Wide area monitoring is the basis for many other use cases like Fault Detection, Isolation, Restoration (FDIR) [
43] or Volt/VAr control [
44]. For the security, some of the following regulations, as examples, are required: NERC CIP [
45], BDEW White Paper [
46] and ISO 27001/02/19 (Information Security Management) [
47].
4. Wide Area Measurement-Free Monitoring
In this section, we present a DSE solution for distribution systems in which a high level of generation is assumed by rooftop PV panels installed in low voltage systems. We assume either no dedicated smart meter is measuring PV production, or no real-time information is reported by possible connected meters due to insufficient communication infrastructure. Our proposed solution is able to estimate system state with only conventional measurements at the head of feeders.
The proposed DSE considers the presence of multiple PV units. Nevertheless, there are still substations assumed to be supplying purely passive Low Voltage (LV) grids (with no PV installation). We will demonstrate our algorithm not only performs proper state estimation of nodes with no PV connection, but also monitors the network with an acceptable accuracy during nights when no PV power is injected to the grid.
The proposed method for wide area monitoring mainly relies on accurate estimated PV generations using the technique described in
Section 4.1. The proposed DSE employs the predicted PV generations as accurate pseudo measurements to predict the current system state. No new meters are needed to be installed widely in the distribution network to measure operational parameters along the feeders, secondary substations, or at customer premises.
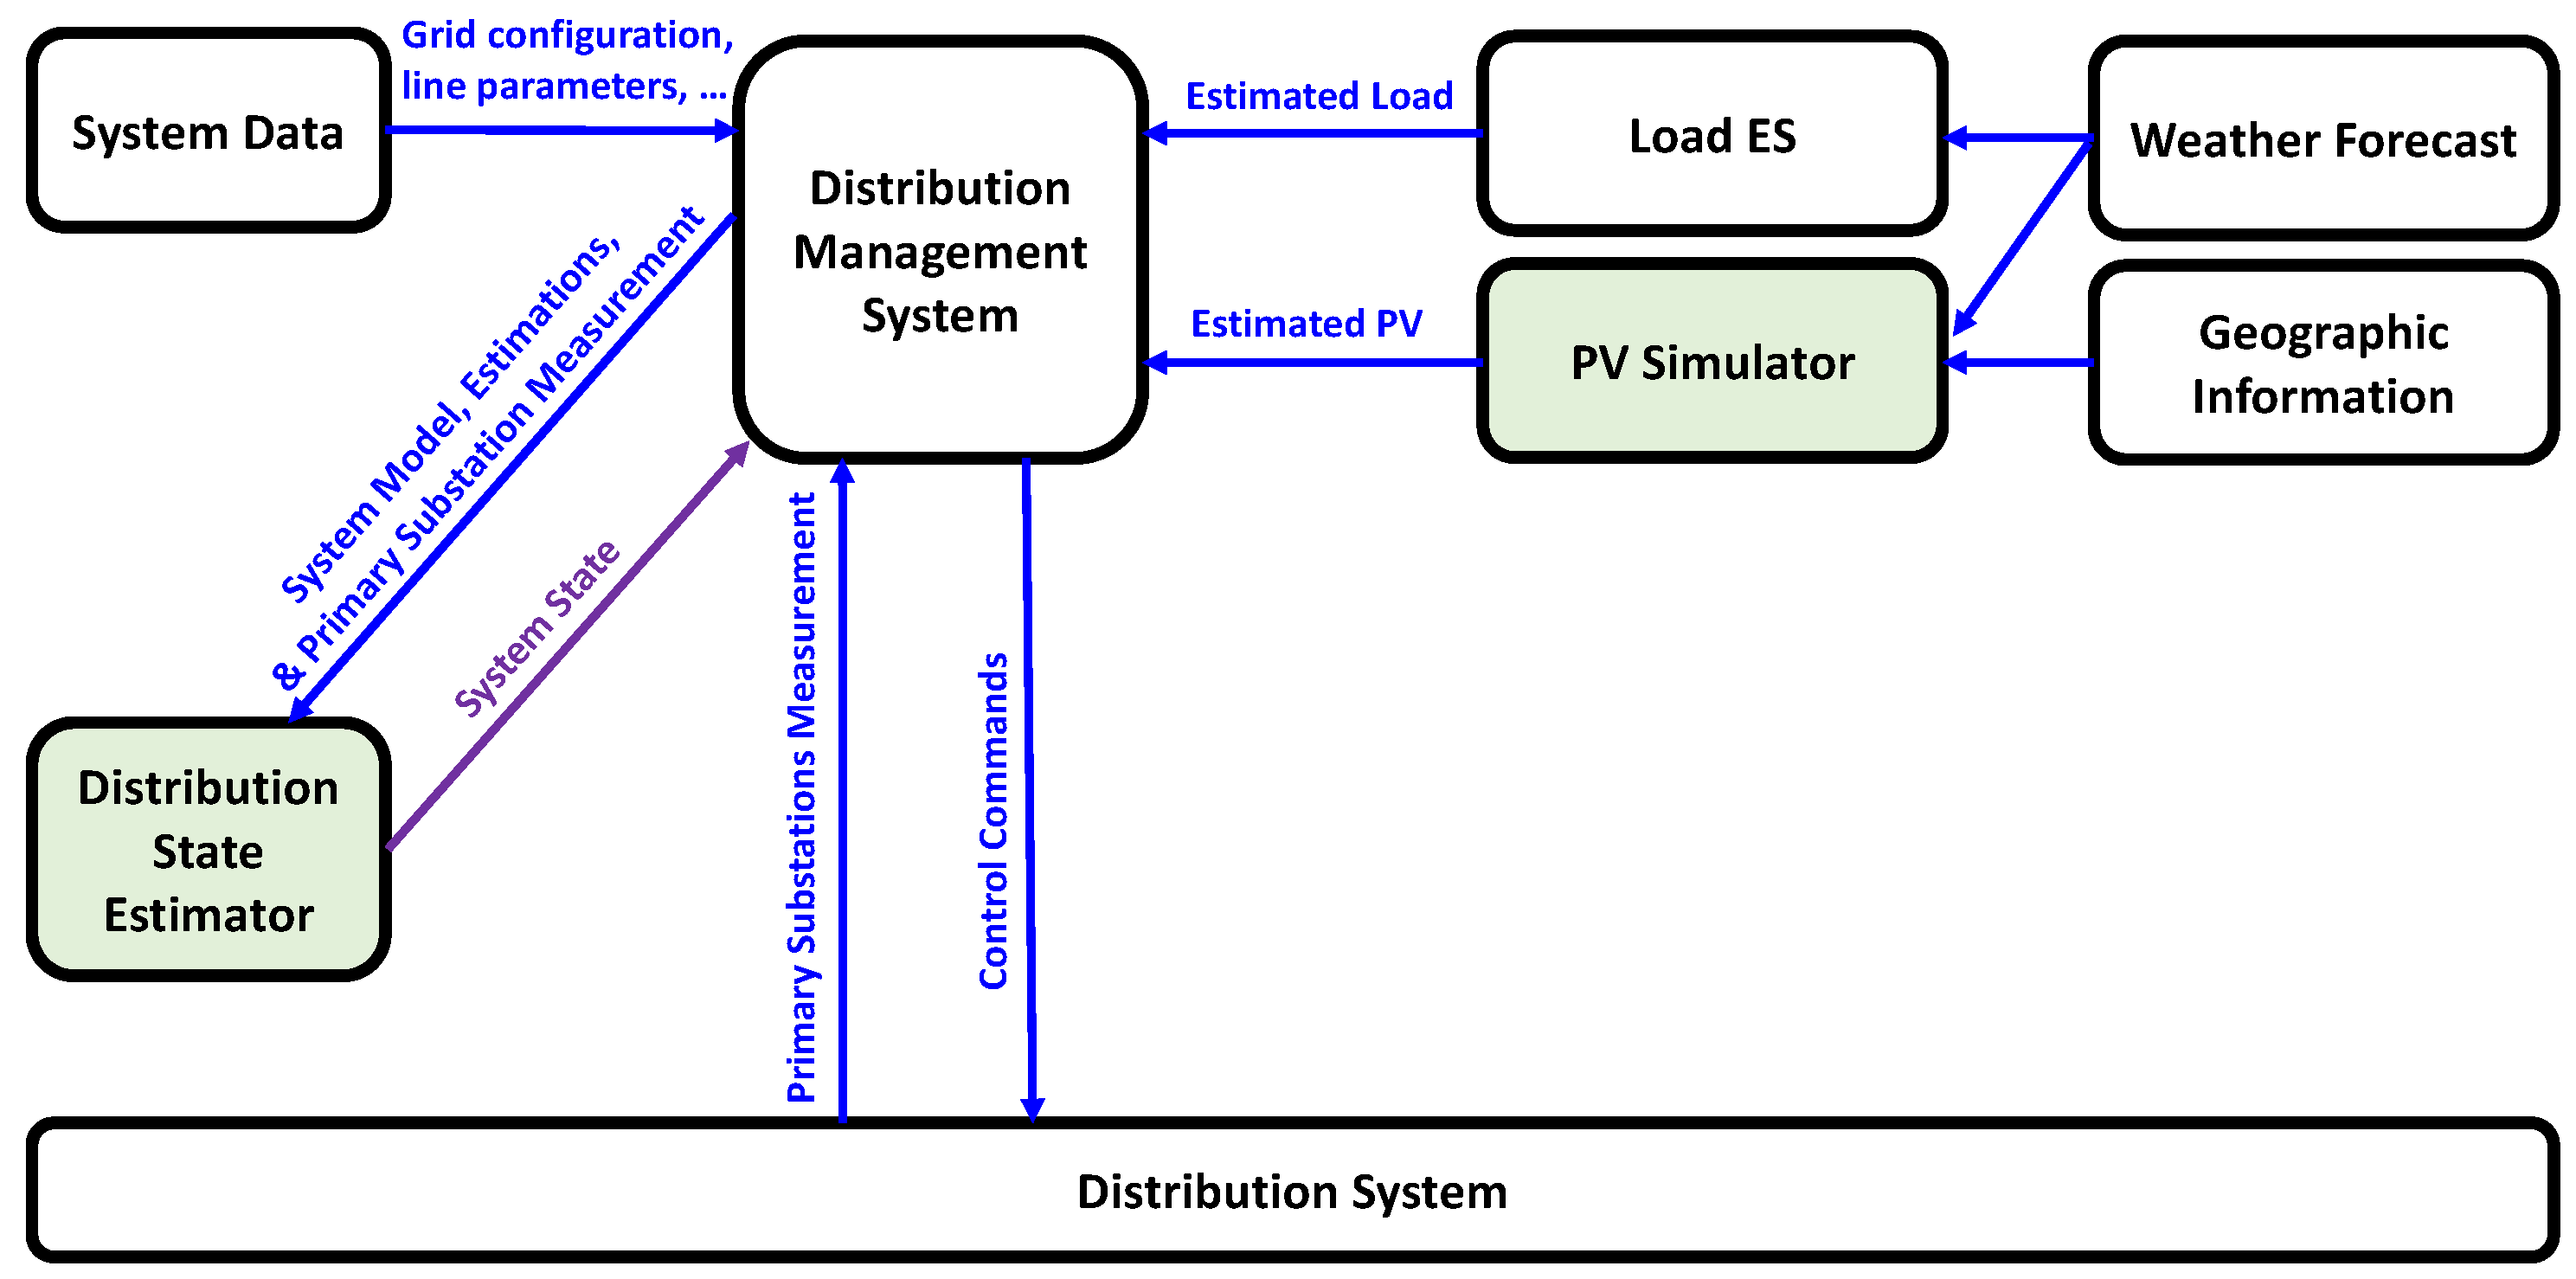
Figure 3 presents the overall conceptual architecture of the proposed scheme. Having the weather forecast and city geographic information of an area, load estimator and PV simulator (PVsim) would forecast the generation and consumption data for that area. The distribution management centre receives the forecasted data and the measurements taken at all feeders’ main HV/MV substations.
For each time step (e.g., every 15 min), having the forecasted consumptions and generations, system electrical data and main substations measurements, the DMS runs the state estimator for each feeder to estimate the system state. With an accurate estimation of the system state for each time step, the distribution system manager can monitor all line currents, node voltages, power losses, etc. in near real time, hence it can send appropriate commands to manage the network.
The scheme components in
Figure 3 are the following:
System data including configuration of the network, parameters of the lines and transformers, and in general information about the grid infrastructure;
Load ES providing an estimation or forecast of load data;
PV Simulator giving an accurate estimation of PV production of roof-top PV panels;
Weather Forecast feeding both Load ES and PV Simulator with climate conditions collected by real weather stations;
Geographic Information including all the geographic information of the city given as input to
PVsim (see
Section 4.1);
Distribution System providing measurements at the beginning of MV feeders in primary substations;
Distribution State Estimator computing the state of the distribution network;
Distribution Management System managing the distribution network.
The proposed architecture only requires the system data, estimated demands, estimated PV productions and voltage and current measured at the beginning of MV feeder at the primary substation to predict system state in near real-time. Among these, the system data, load estimates and main substation measurements are already available for traditional distribution networks. The remaining challenges are a method for accurate estimation of PV productions and an appropriate DSE which can realize the proposed architecture in
Figure 3. Therefore, the rest of this section introduces
PVsim and describes the algorithm for
Distribution State Estimator.
4.1. PV Simulator to Estimate Energy Production
To estimate energy production of PV systems in urban contexts, we exploited the methodology proposed in our previous work [
48] as enabling technology by relying on both GIS (Geographic Information System) and meteorological data.
The main input of the PV simulator (PVsim) is a Digital Surface Model (DSM), our GIS data, which is a high-resolution raster image representing terrain elevation of buildings of interest. Thanks to DSM, PVsim detects encumbrances on roofs (e.g., chimneys and dormers) that prevent the deployment of PV panels, and simulates the evolution of shadows on roofs over one year, with 15-minute intervals, in clear-sky conditions. As a preliminary result, this phase identifies the suitable area, which is the real area of a roof that can be used to deploy PV panels.
To estimate the evolution of temperature and irradiance over the time in real-sky conditions, PVsim combines the shadow model with weather data retrieved from weather stations through third-party services (e.g., weather underground [
49]). To estimate the incident global radiation, solar radiation is decomposed by considering the attenuation due to air pollution (i.e.,
Linke turbidity coefficient [
50]). Solar radiation decomposition needs as inputs both the direct normal incident radiation and the diffuse horizontal incident radiation [
51]. However, if weather stations provide global horizontal radiation only, incident radiation is computed by applying decomposition models in literature [
52,
53,
54,
55,
56,
57].
Finally, PVsim estimates the PV production for each identified area by using the evolution of temperature and irradiance in real-sky conditions. For this computation, PVsim exploits characteristics and parameters of some commercial PV systems as default values. However, such parameters can be changed according to the characteristics of other commercial PV systems. The final output of the PVsim is georeferenced information on the size of deployable PV systems and the related generation profiles for each building.
4.2. Distribution State Estimator Formulation
State estimation refers to the estimation of the most probable values for system state variables using the system mathematical representation and a set of measurements. The calculation of unknown system states is usually done by minimization of a function representing the difference between the estimated and the measured values. The measurement set includes:
real measurements (e.g., nodal voltages, branch currents, power flows);
pseudo measurements (e.g., the estimated consumption data).
With enough number of measurements which are well distributed over the distribution system, the system will be observable and its state can be estimated. In distribution systems, owing to the large number of pseudo measurements (i.e., loads), observation is rarely a problem.
Measurements are functions of state variables
. The equations between the state variables
and measurements
can be presented as follows:
where
h is the vector of functions and
e denotes the vector of measurement errors. Our
Distribution State Estimator is based on Branch current-based State Estimation (BSE), proposed for distribution systems in [
58]. In this method, the real and imaginary parts of branch currents are selected as state variables:
where
and
are the real and imaginary parts of the vector of branch current. The system states can be estimated by minimization of the following least-squares function
:
where
W is the diagonal weighting matrix with
elements and
m is the number of measurements.
The
elements indicate the influence of each measurement on the resulted estimation. To have more accurate estimations, higher
values should be considered for more accurate measurements (e.g., nodal voltages) and lower
values should be considered for inaccurate measurements (e.g., estimated loads). Minimizing the least-squares function leads to the best possible values of state variables. By taking the derivation of
and setting it equal to zero, the following iterative solution is obtained:
where the gain matrix
G and
H are defined as follows:
In the BSE method, by selecting the real and imaginary parts of branch currents as state variables, the H and G matrices become constant which simplifies and speeds up the computations.
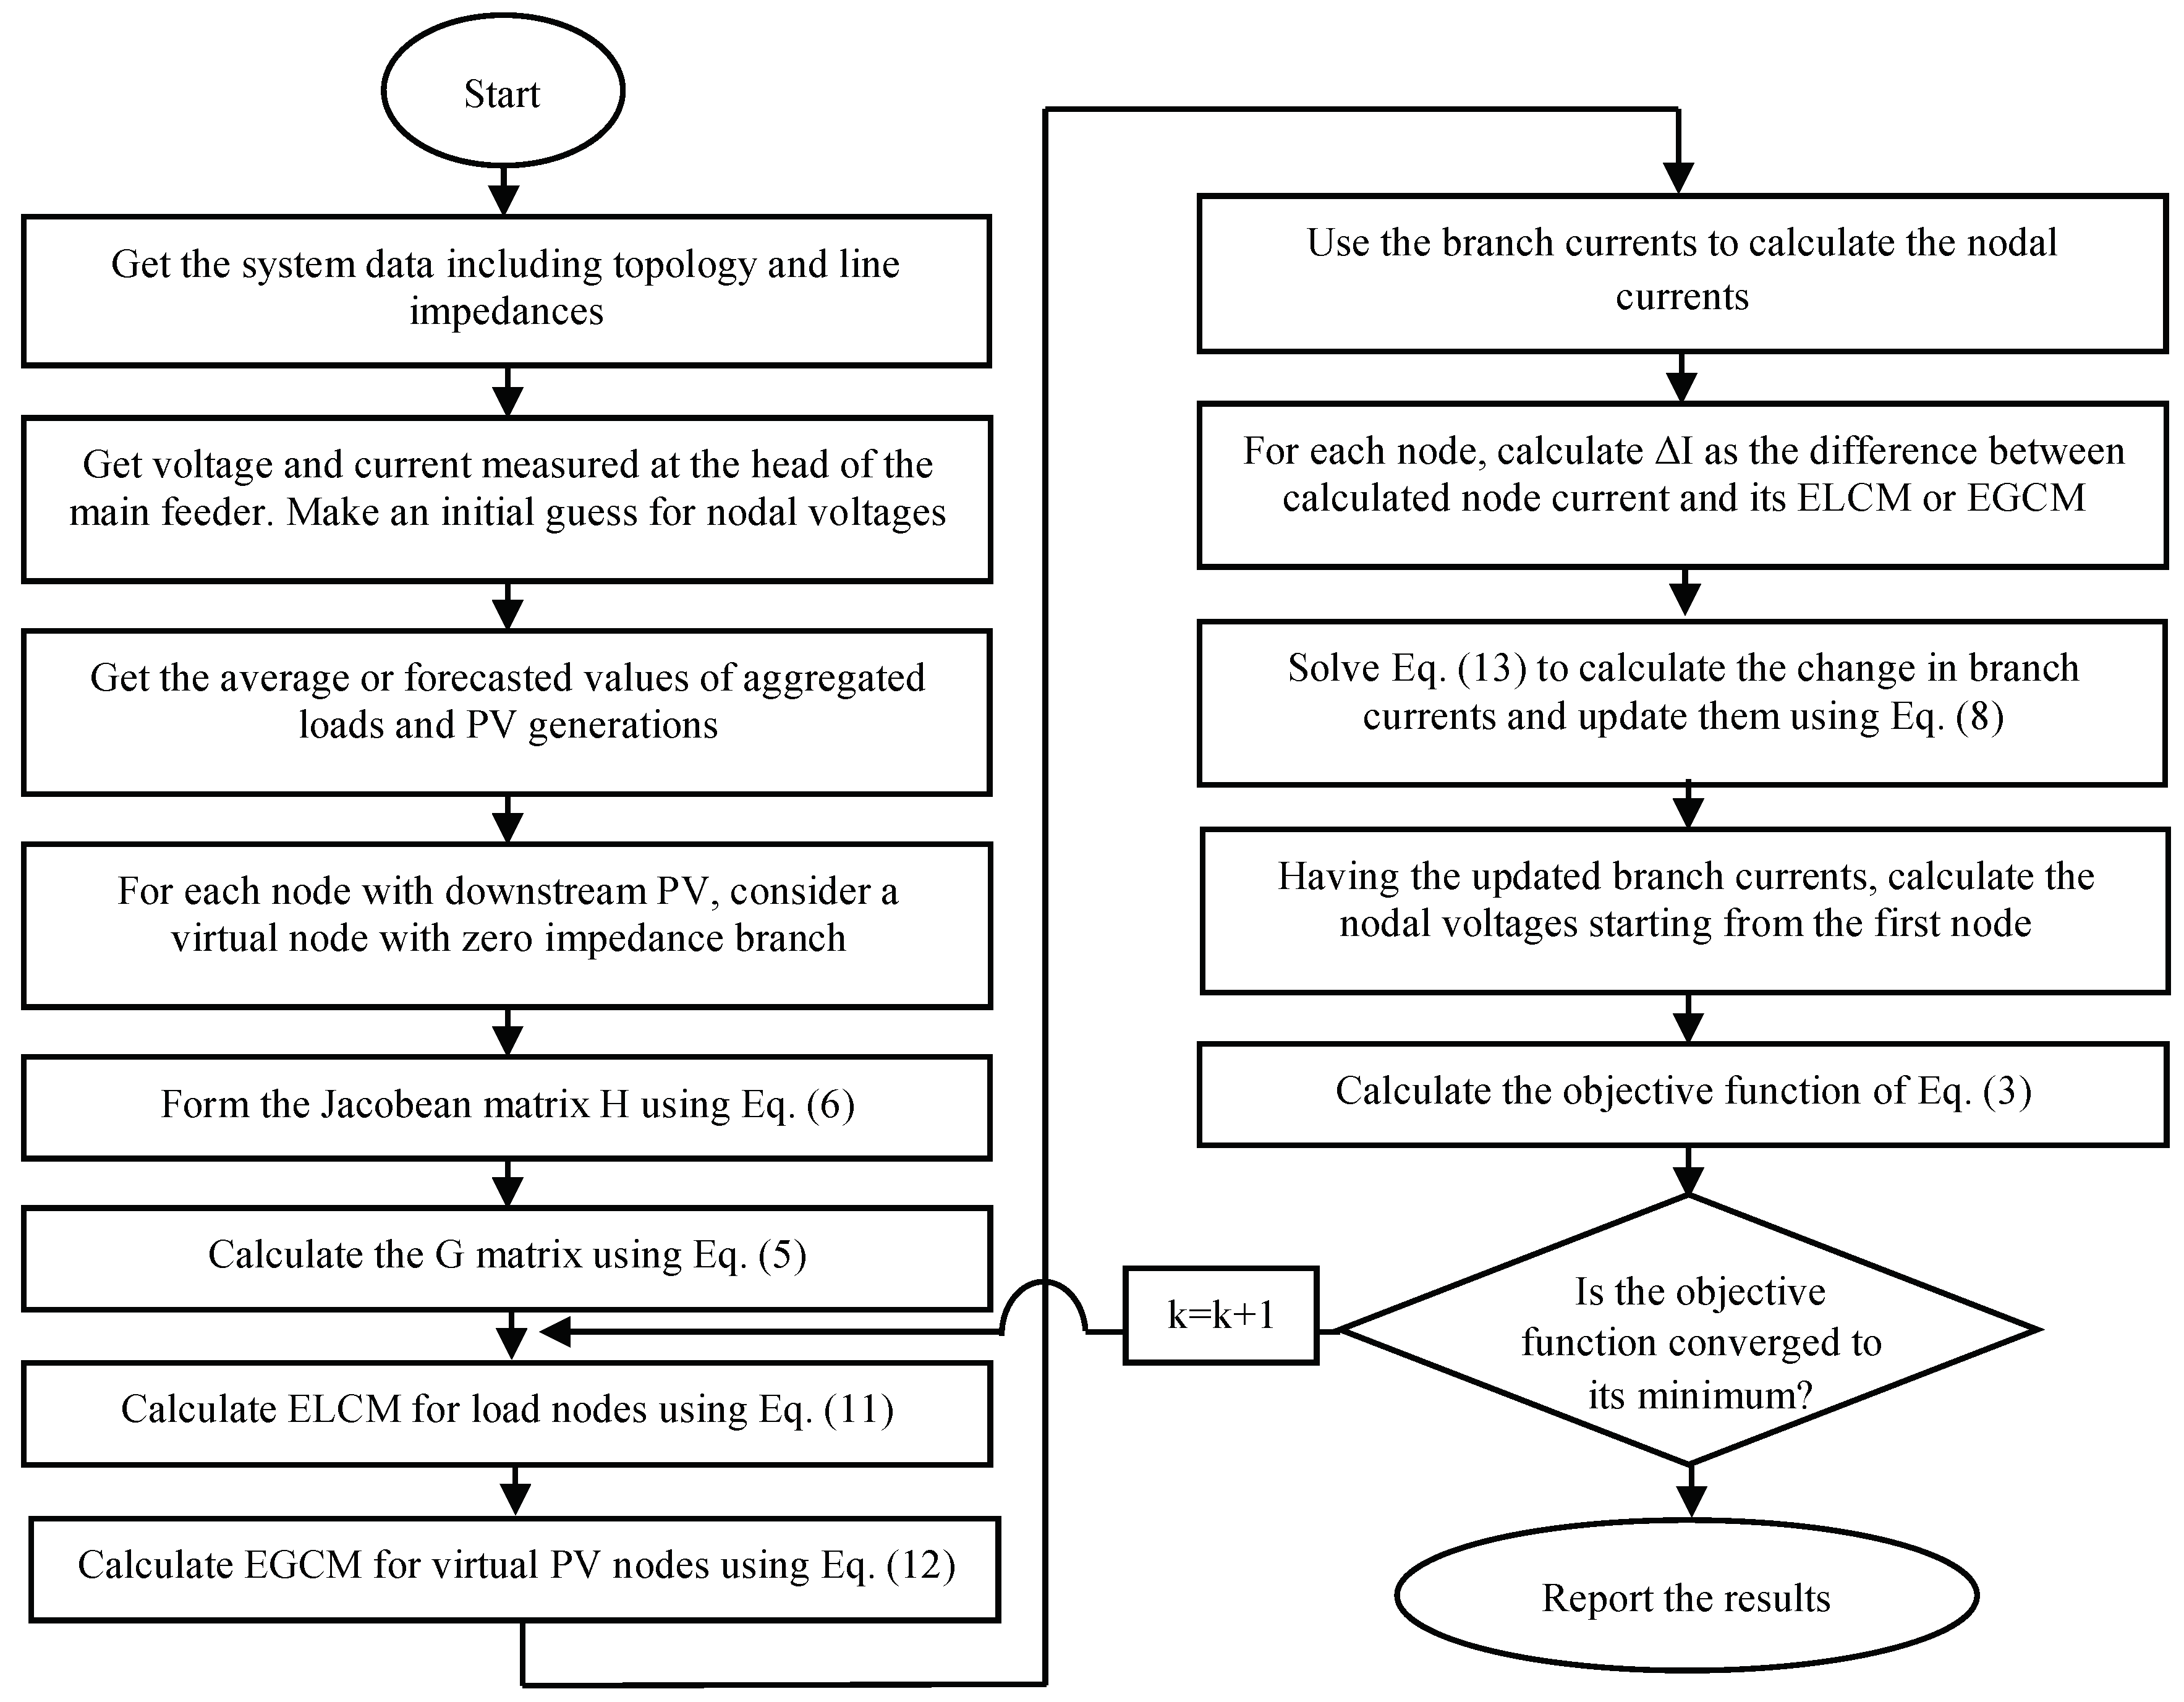
During the state estimation, starting from an initial guess, the following equation is solved iteratively until the objective function is minimized, and the state variables are updated in each iteration:
In this paper, as proposed in [
58], the real and imaginary parts of branch currents are selected as state variables. Therefore, Equation (
7) can be rewritten as follows:
where
denotes the change in branch currents in iteration
k and includes a real and an imaginary part:
In order to better illustrate the methodology used in our algorithm, the case study is briefly introduced here, while the formulation and procedure is discussed in a generic manner.
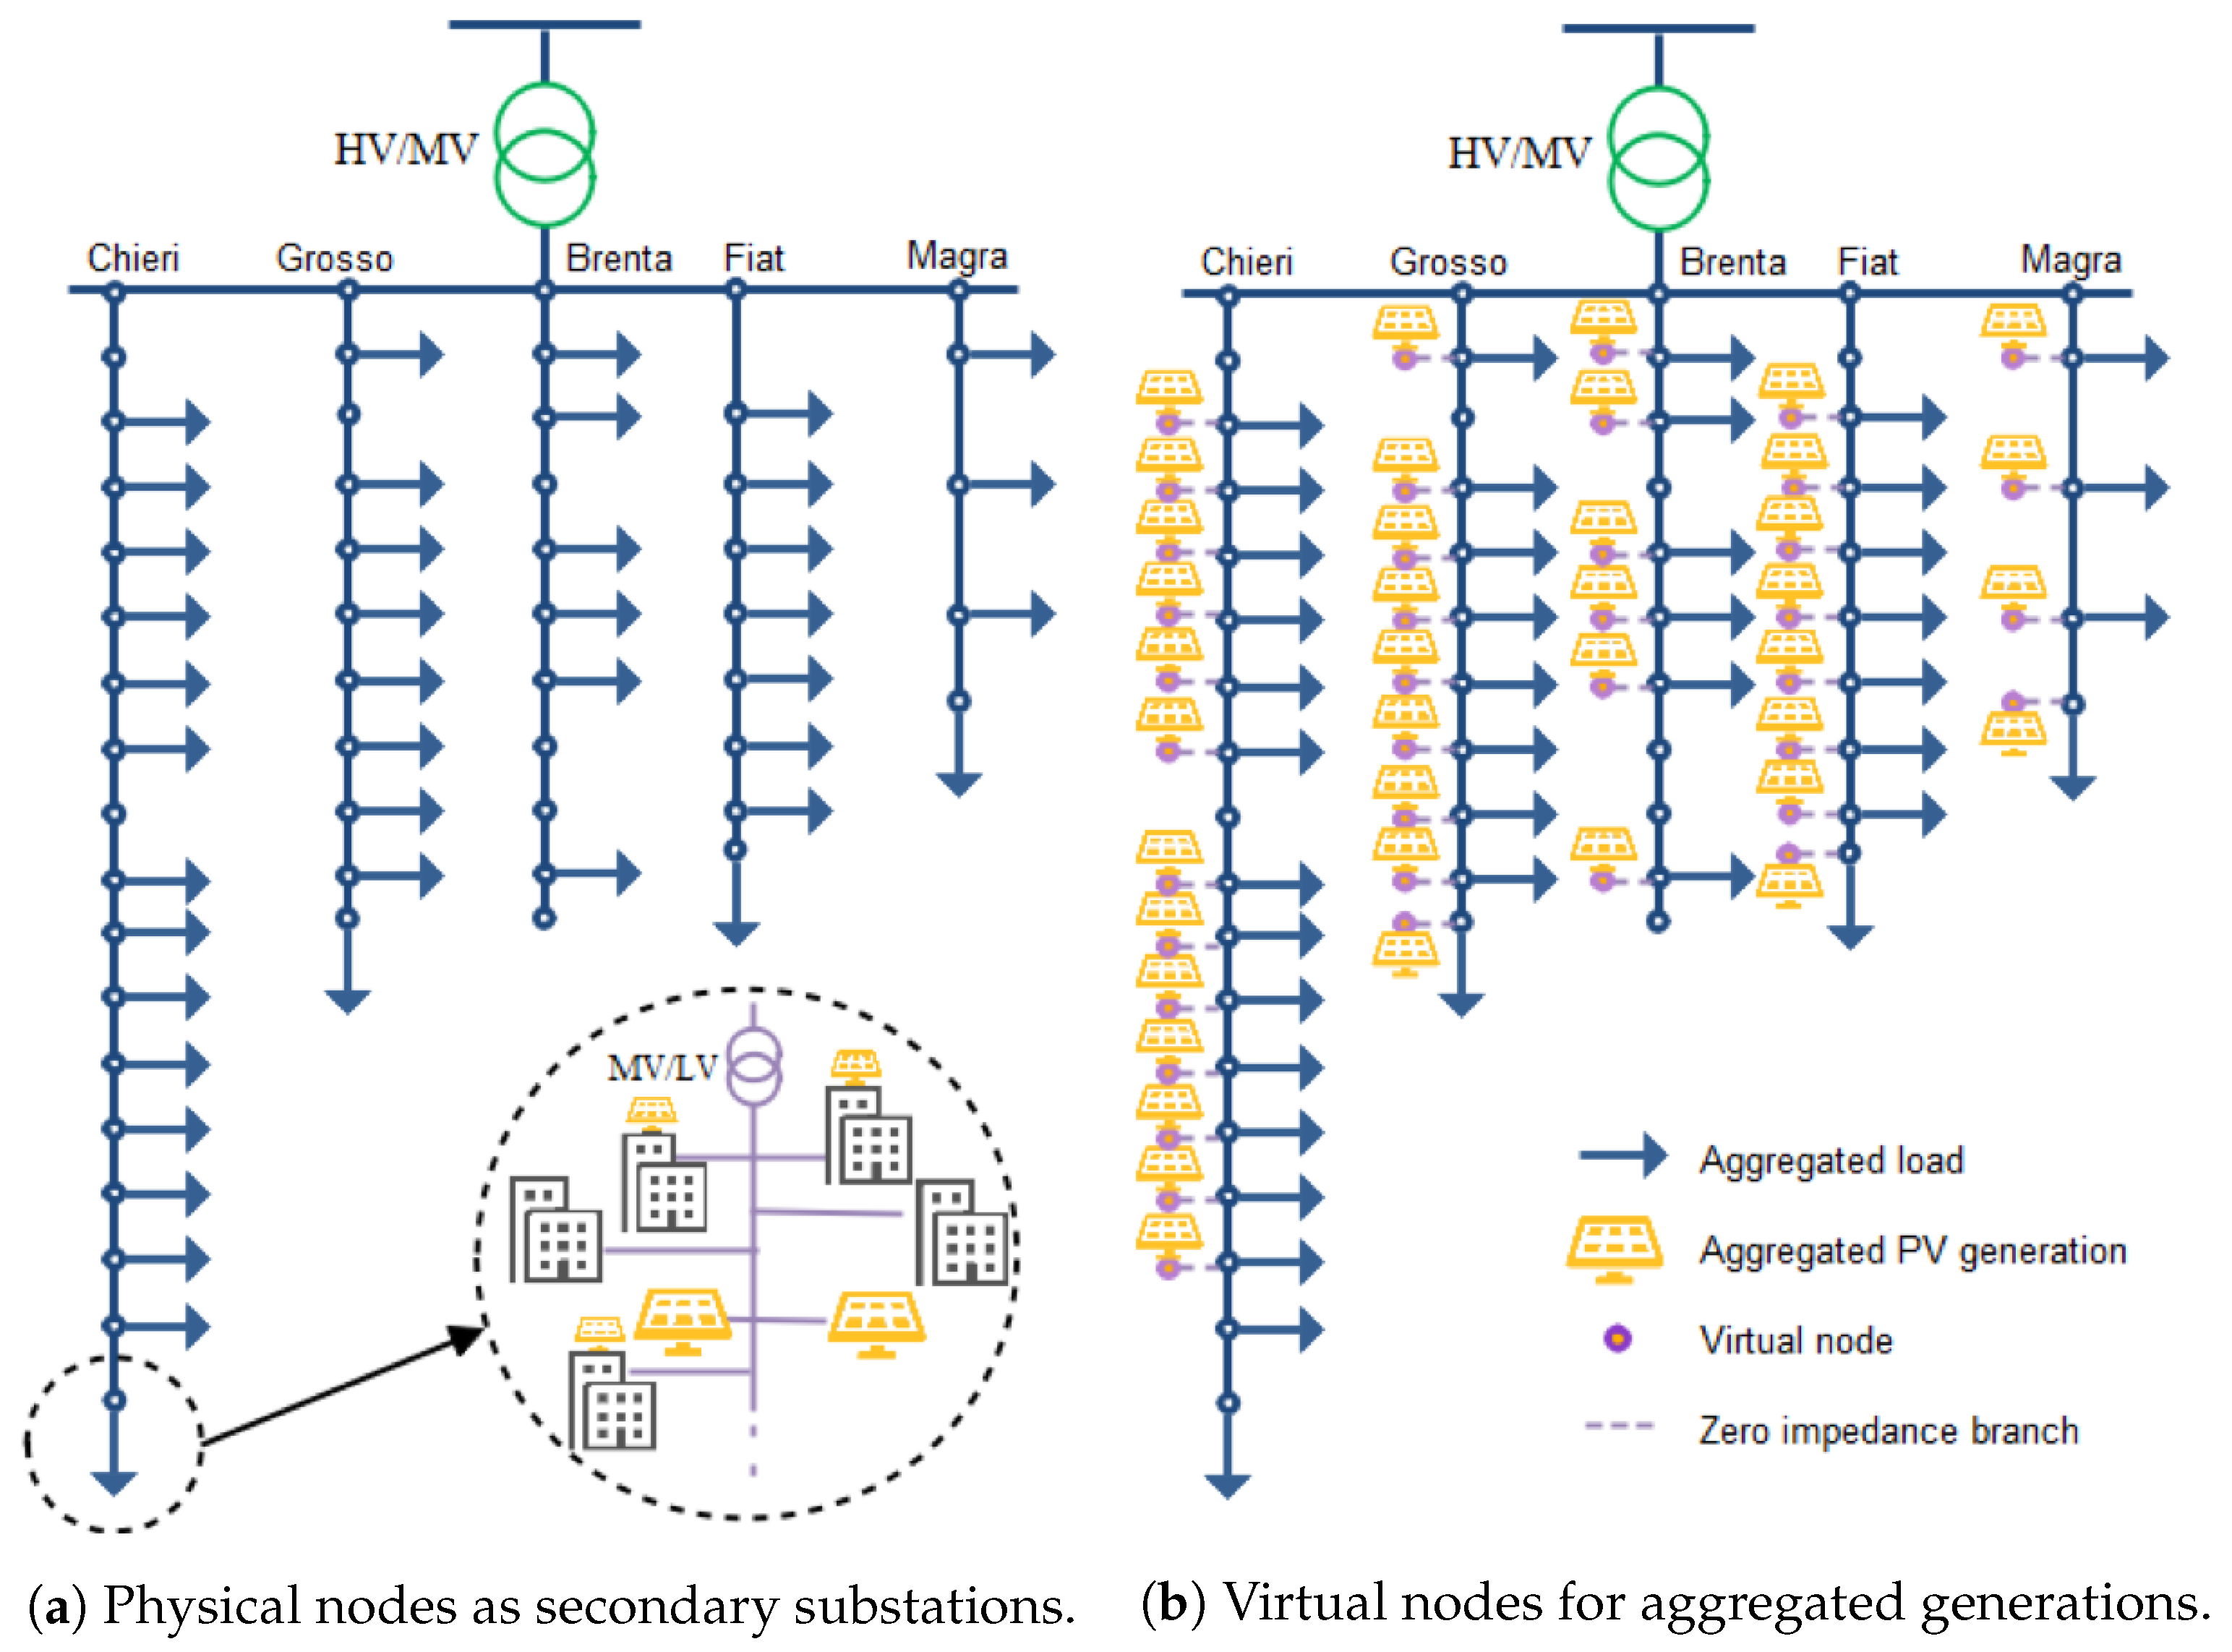
The considered distribution system as the case study is shown in
Figure 4a. The network is a small portion of an urban medium voltage distribution system in Turin city in the northwest of Italy. A near future scenario of high penetration of roof-top PV production is assumed for low voltage grids supplied by this network. It includes a set of MV feeders feeding customers through MV/LV transformers. The voltages and currents measured at the head of each MV feeder are considered as the only available real measurements, and there is no wide area measurement over this network. The estimated aggregated demands and the aggregated PV generations at MV/LV transformers are considered as pseudo measurements.
For aggregated loads, in each iteration, the estimated load should be converted to an Equivalent Load Current Measurement (ELCM):
where
and
represent the aggregated load for MV/LV transformer at node
t,
is the node voltage at iteration
, and
is the node equivalent current measurement at iteration
k.
For aggregated PV generation at each node, similarly, in each iteration, the estimated generation should be converted to an equivalent current measurement:
where
and
represent the aggregated generation for MV/LV transformer at node
t, and
is the node equivalent generation current measurement (EGCM) at iteration
k.
As noted before, the elements indicate the influence of each measurement on the resulted estimation. Therefore, to have more accurate estimations, different values should be considered for more aggregated loads and aggregated generation based on their estimation accuracies.
The problem is in conventional BSE; it is not possible to consider different weighting values for different equivalent current measurements connected at the same node, while, in our case study, the equivalent model of aggregated PV generators and loads of low voltage systems are connected to the same MV node.
To tackle this challenge, the aggregated generations are considered to be connected to a virtual node, as shown in
Figure 4b. The virtual node is then connected to the main MV node using a zero-impedance branch.
Using the above equations, all the pseudo measurements can be converted to equivalent current measurements and Equation (
9) can be rewritten as follows for three phase (
a,
b,
c):
where
indicate the difference between the calculated currents and the equivalent current measurements, and subscribes
r and
i show the variables real and imaginary parts.
Figure 5 summarises the method procedure as a flowchart.
5. Case Study and Experimental Results
To test the performance of the developed algorithm of wide area monitoring discussed in
Section 4, we performed some simulations on a portion of an urban distribution system in Turin, city in the northwest of Italy. It should be noted that wide area monitoring requires a wide area measurement collection system like Advanced Metering Infrastructure for a very precise observation of the system operational state. However, currently integration of renewable energy resources, like PV panels in Turin, is growing faster than deploying new measurement devices. Therefore, a solution for the transitory period is needed for wide area monitoring. The results of the proposed scheme may not be as precise as advanced measurement-based schemes, but we demonstrate in this section that it can provide fairly accurate results.
To perform a real-time simulation, we used an Opal RT digital real time simulator with eMEGAsim configuration of solver which is based on electromagnetic transient analysis (EMT). The modelling environment for eMEGAsim is MATLAB Simulink, and an interfacing software named RT-LAB is used to compile the model to load and execute on hardware simulator. The portion of the real system used in our study is in medium voltage; however, the values of loads and PVs are aggregated power of all low voltage connected prosumers under each secondary substation (MV/LV substation). This network has five MV feeders which are all cables. Hence, we modelled all branches with pi model of transmission lines. It should be noted that the real system is modelled in Opal-RT for real time simulation which plays the role of a real-world system. However, this grid is also modelled in MATLAB for running power flow used in BSE [
59]. The former is fed by real and accurate input, while the latter in distribution state estimation gets load and PV input data with errors.
As introduced in
Section 4.2, the network in
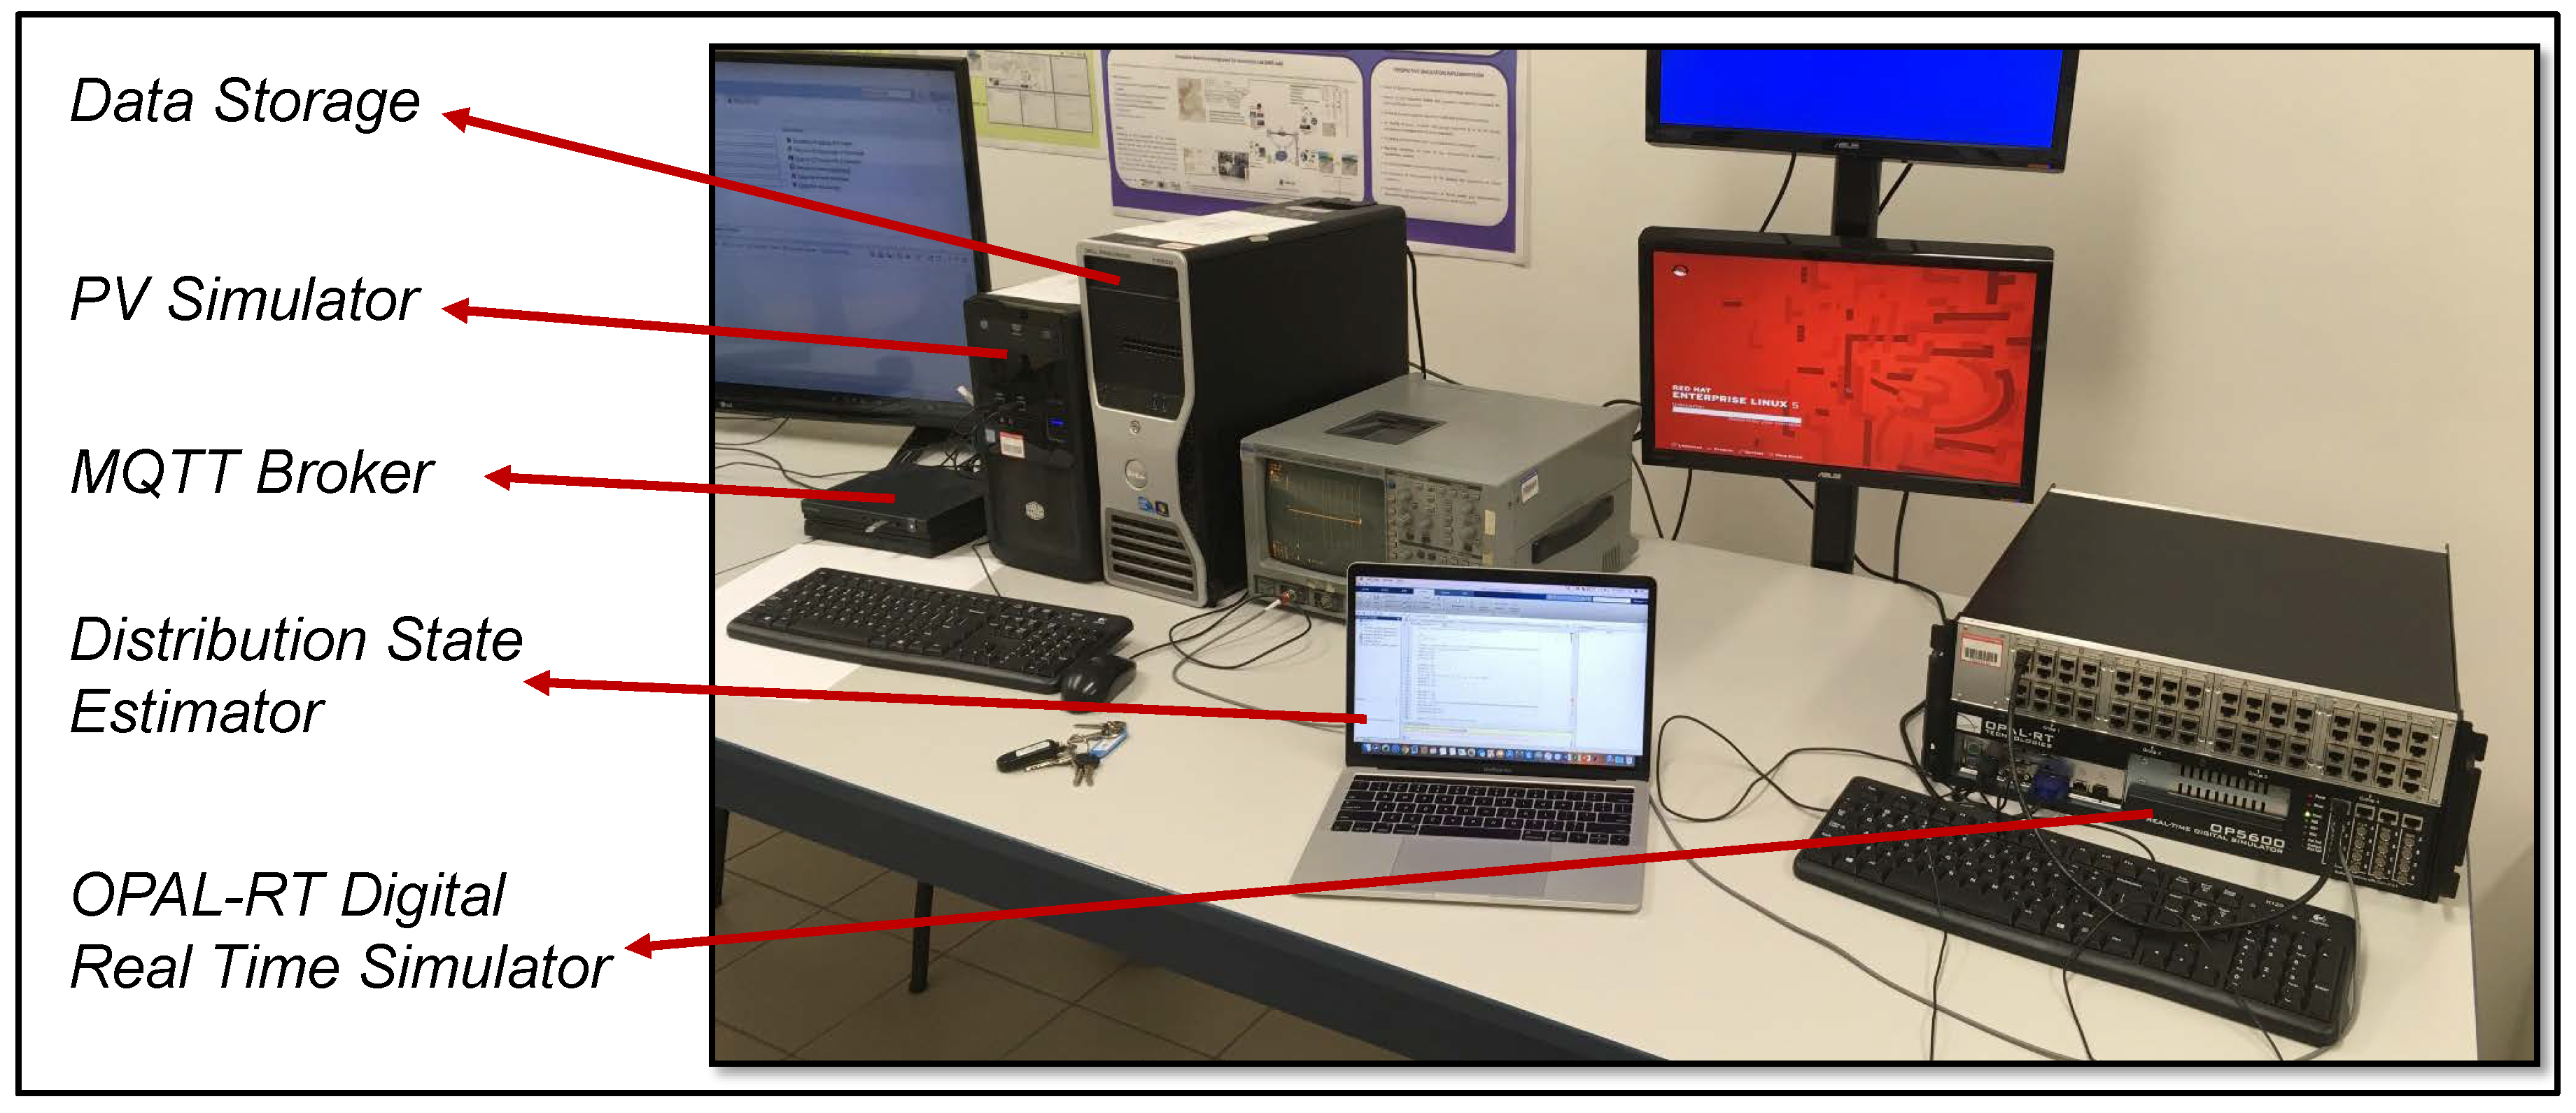
Figure 4 is assumed to be under high PV penetration, and two scenarios of sunny and cloudy days are considered. The co-simulation platform set-up, as shown in
Figure 6, includes an OP5600 Opal-RT digital real time simulator to run the grid model including components of process, field and station zones; a laptop PC to run the distribution state estimation algorithm and three different desktop PCs to execute PVsim, to run the MQTT message broker and to accommodate the data storage, respectively.
This set-up tries to mimic the real-world system with a real physical network; the real-time simulator can be just replaced with the real network. In the latter case, the real network has to send only measurements from the beginning of feeders at primary substations. From a real-time simulator, this signal is generated by running the virtual model of the grid.
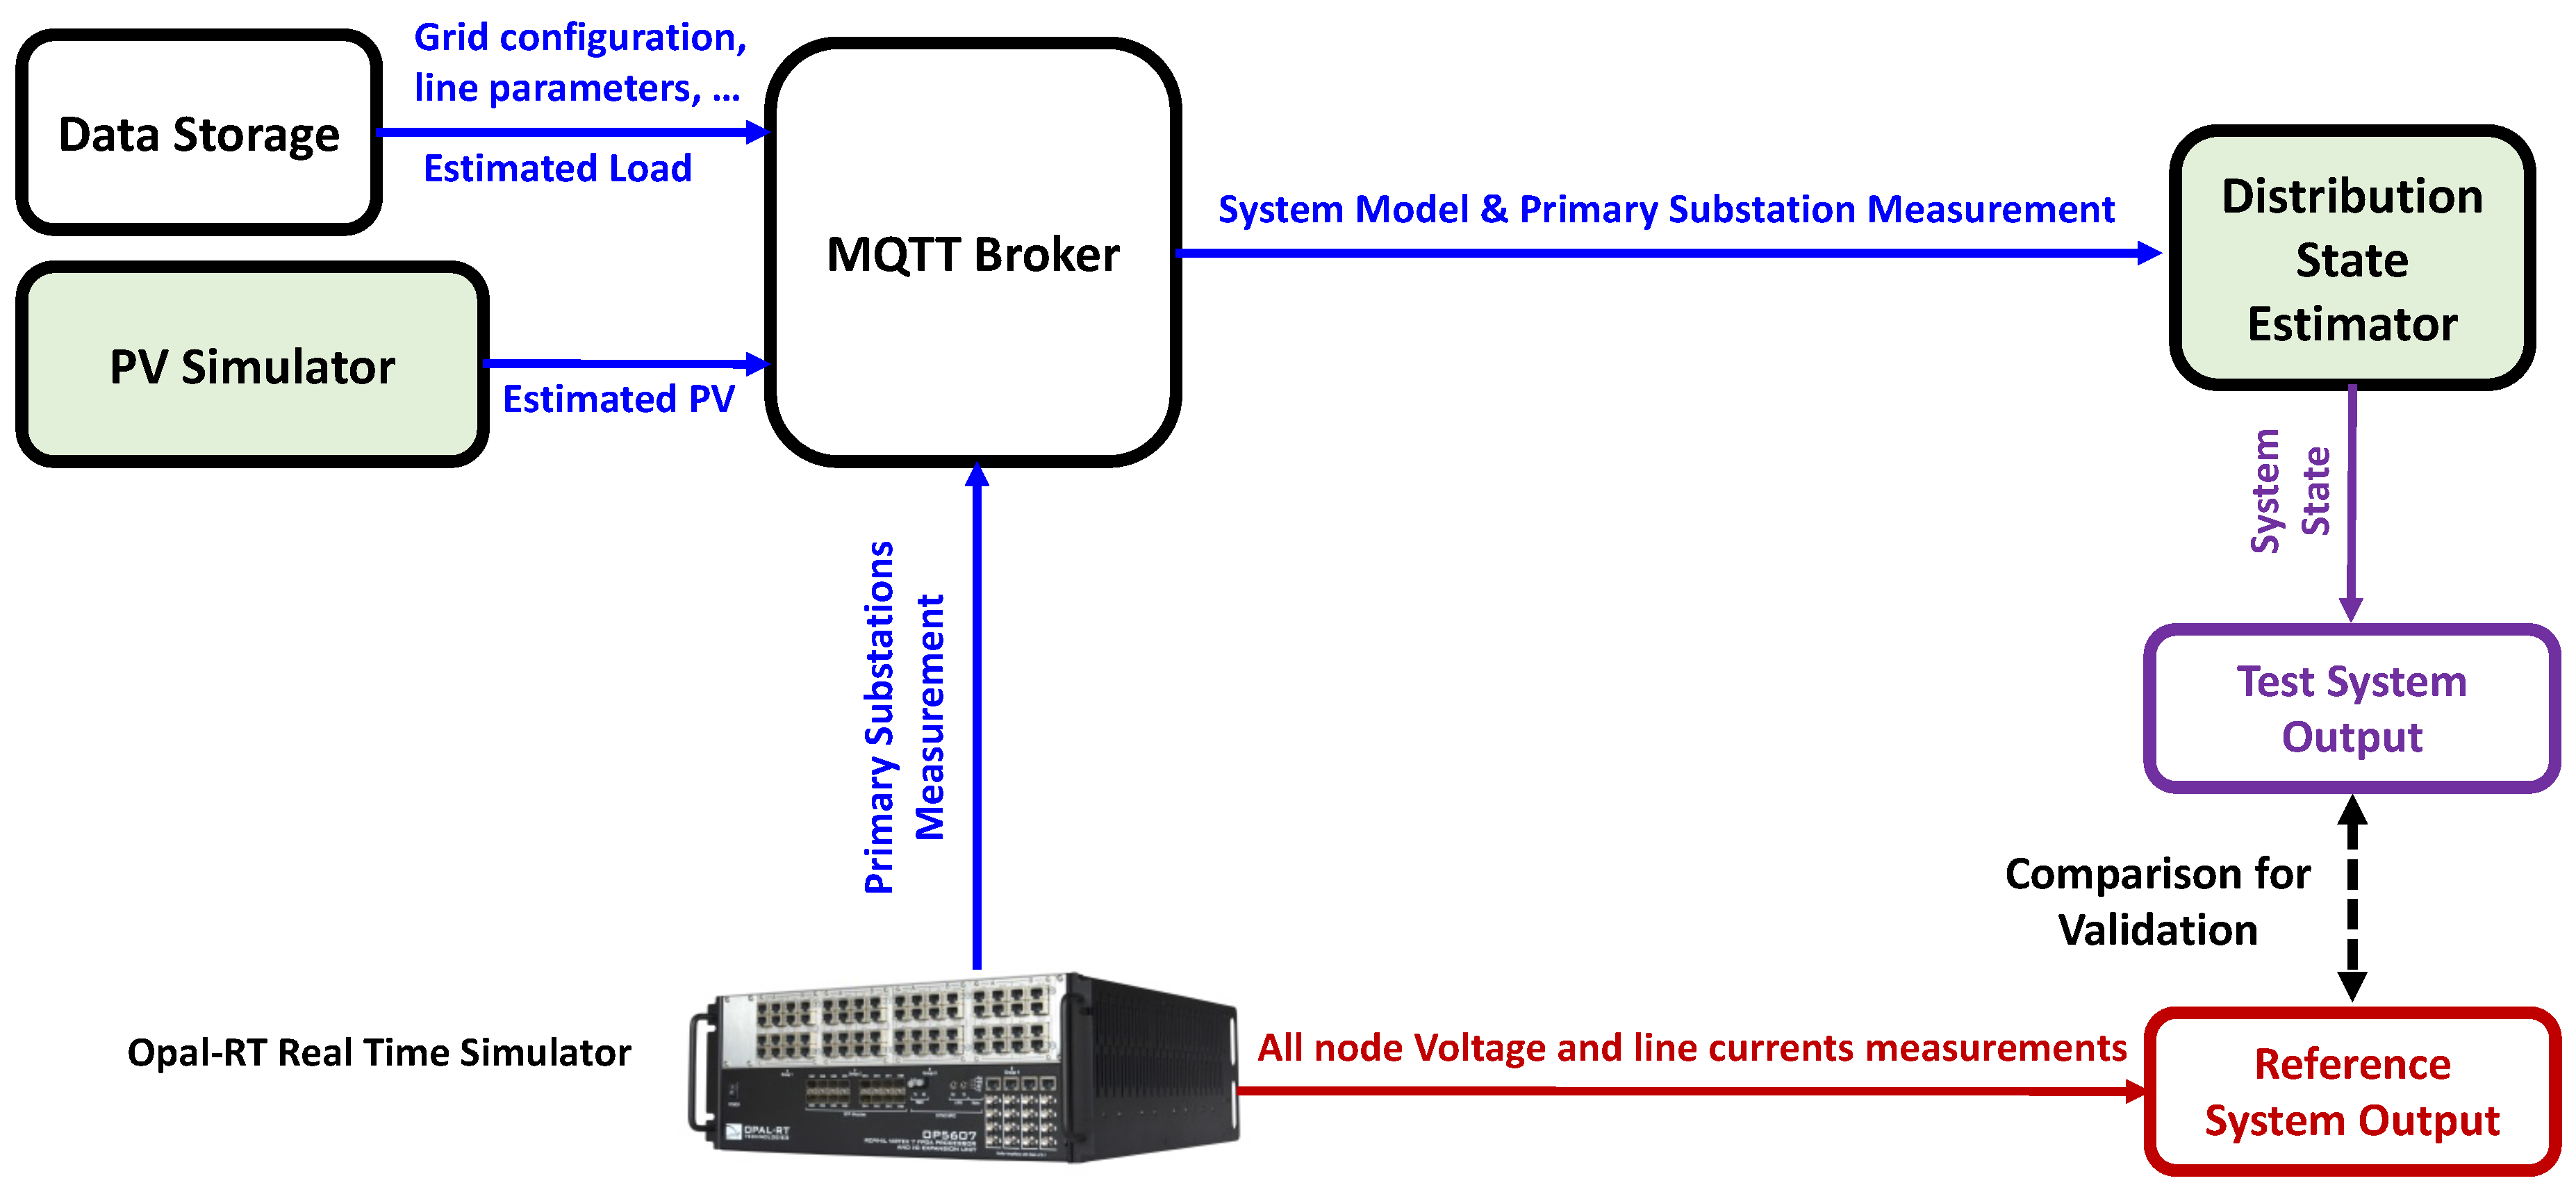
This set-up is actually our test system to observe the results of our new wide area monitoring system which relies on PVsim, rather than wide area measurements. Since no measurements from prosumers are available, the monitoring system is blind to the real amount of production or consumption; we provide just an estimation of consumption with error.
The reference system to be used for validating the results of test system is actually the real network or the virtual model of the real network with all captured voltage and current values of nodes. In our laboratory, we stored all these values in the real-time simulator and, at the end of each scenario simulation, we made a comparison between these values and what the estimator could estimate. This is illustrated in
Figure 7.
To assess the results of our algorithm for wide area measurements compared to reference data, we exploited the following indexes that are widely used in descriptive statistics:
Bias is the mean value of the differences between state estimation and observed values;
Mean Absolute Error (MAE) is defined as the average of the absolute difference between the state estimation and the reference data;
Root Mean Square Difference (RMSD) is the standard deviation of differences between state estimation and observed values;
Correlation Coefficient is a 0 to 1 number representing the strength of the correlation between the state estimation and observed values;
Index of Agreement is the standardised measure of the agreement of the state estimation with the observed values. It ranges from −1 to 1, where 0 means no agreement, −1 a perfect negative agreement and 1 a perfect positive agreement, respectively.
We report Bias, MAE and RMSD in percentage.
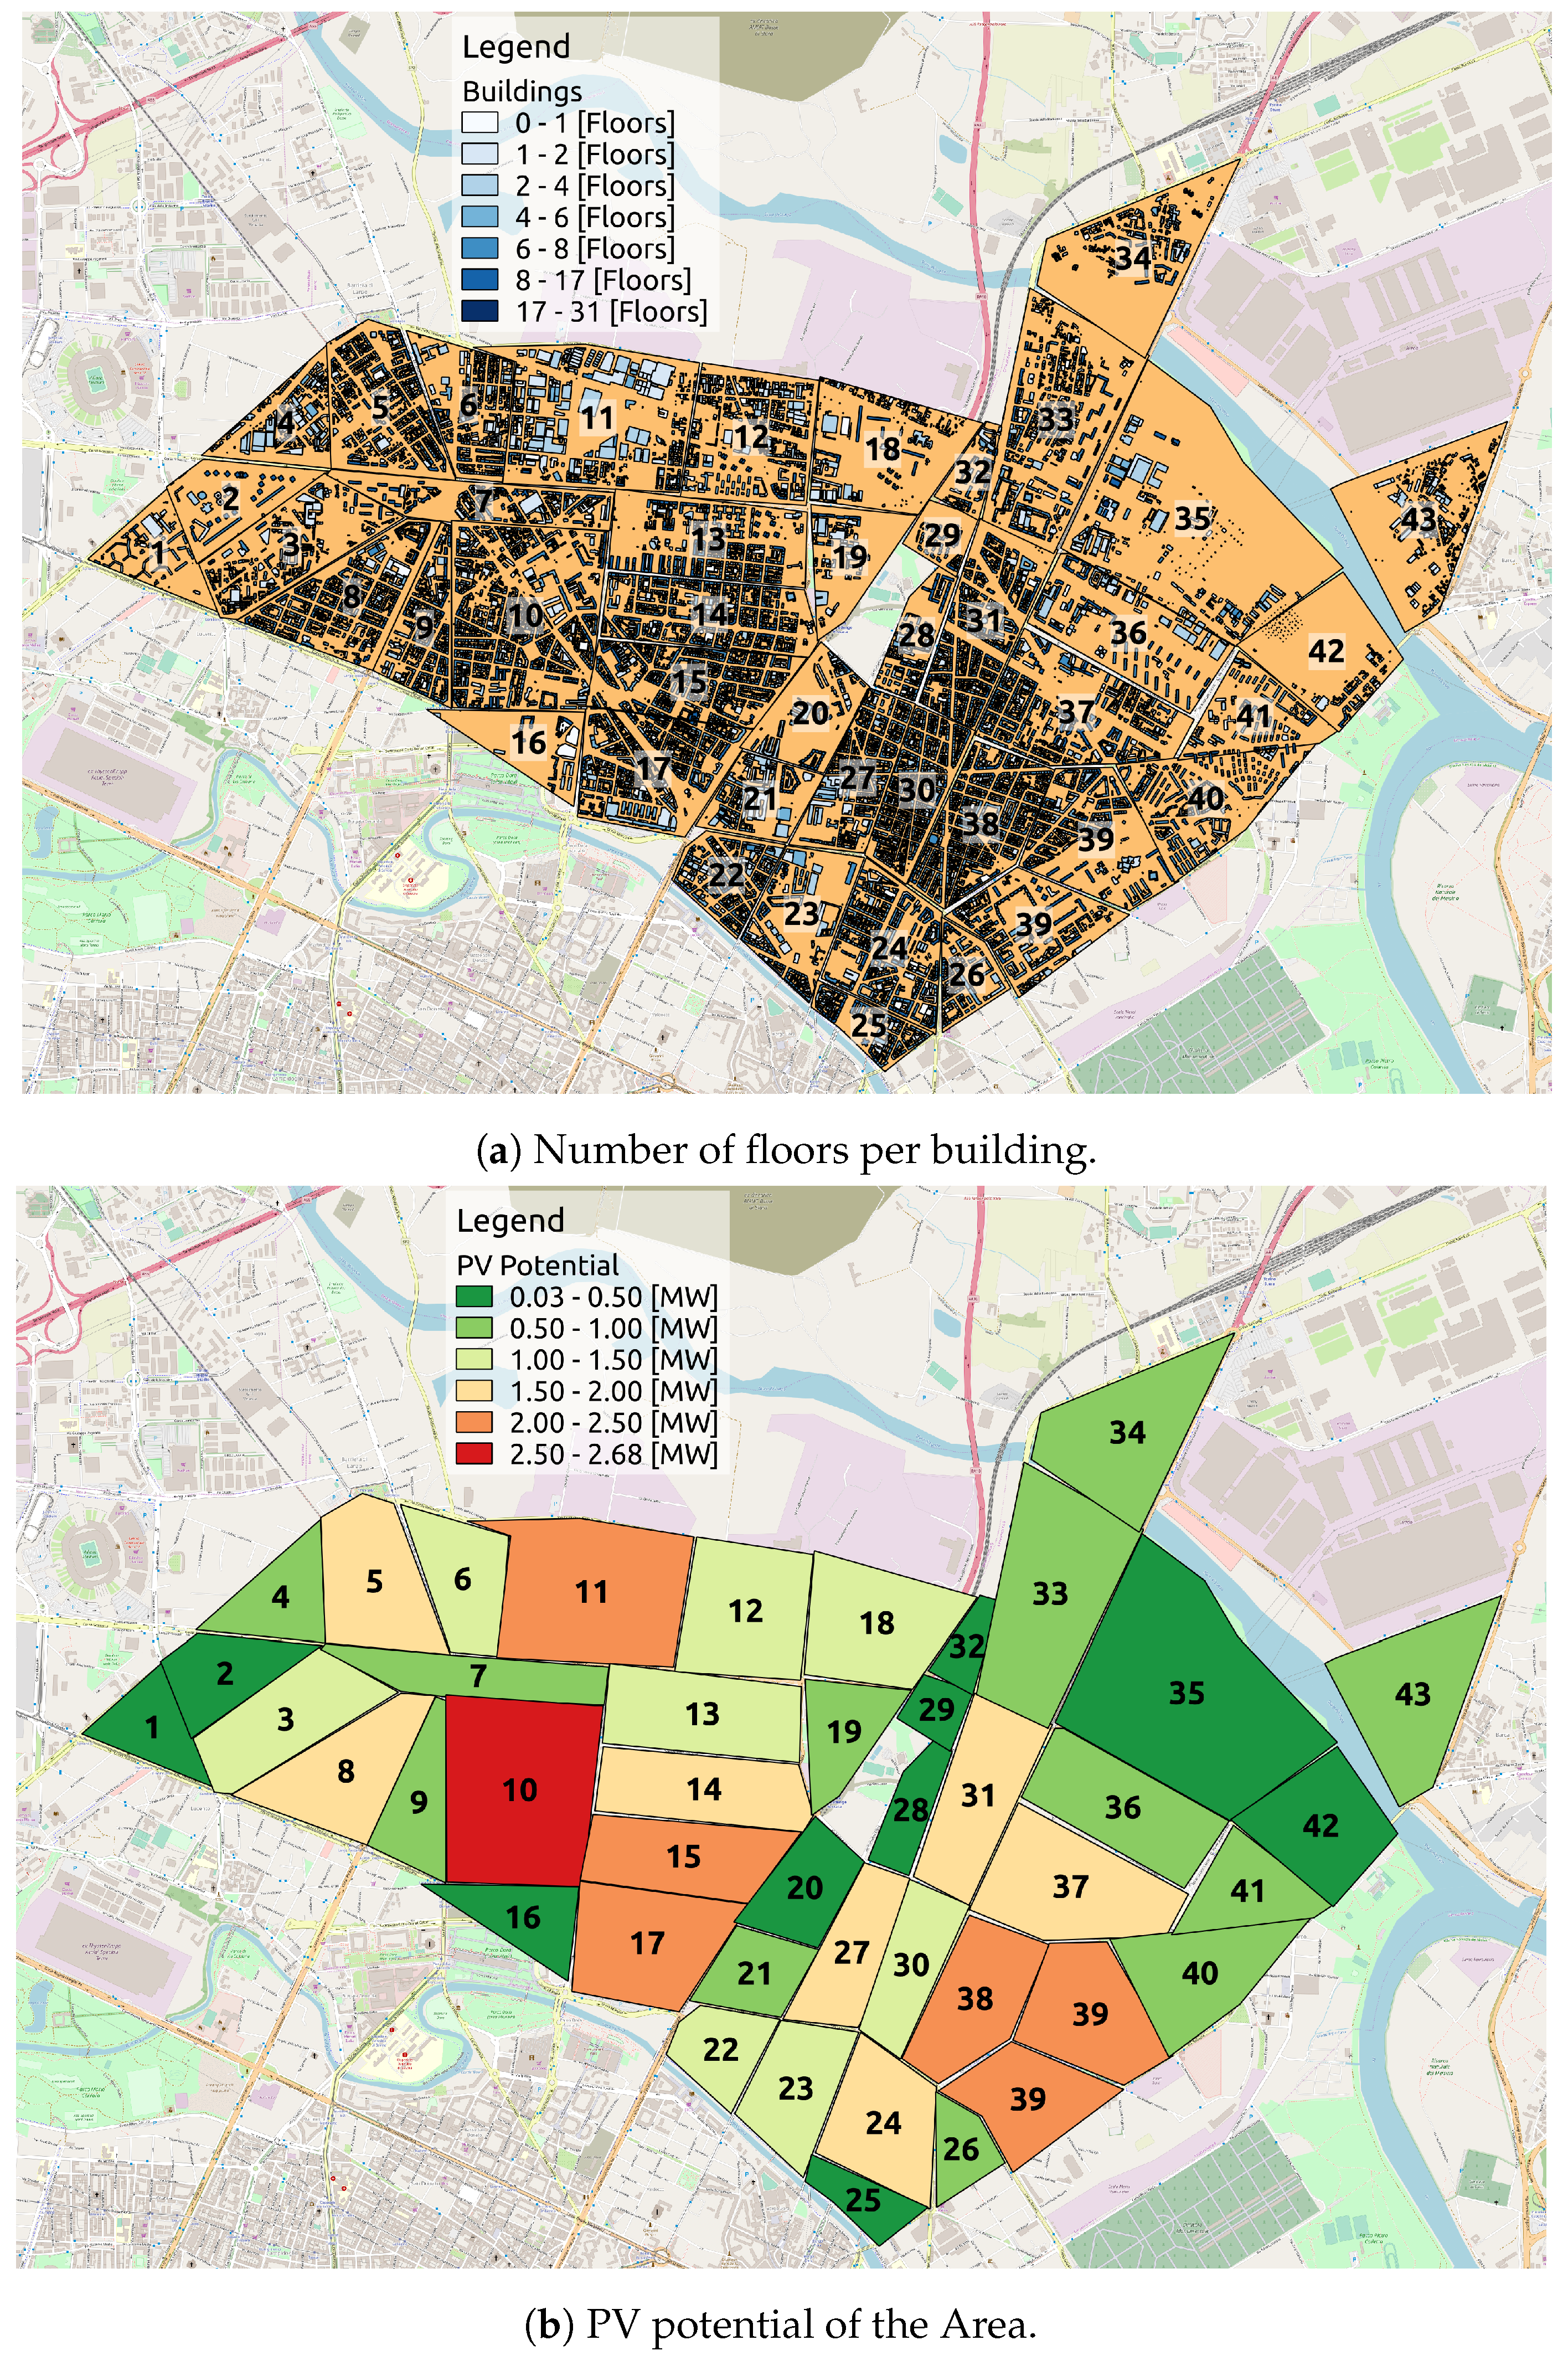
Figure 8a shows the maps of the selected substations reporting the involved buildings with their heights, expressed in floors (i.e., the reference case). As shown in the map, most of the buildings are lower than eight floors and just a few of them are higher than 17 floors. In this urban area, we simulated the PV energy production by exploiting the PVsim presented in
Section 4.1. We supposed to deploy PV modules with the following characteristics: (i) nominal power of about 283 W, (ii) efficiency in standard condition of
, (iii) temperature coefficient equal to
. The total capacity of the whole area is
MW, with a mean value of
MW for each substation.
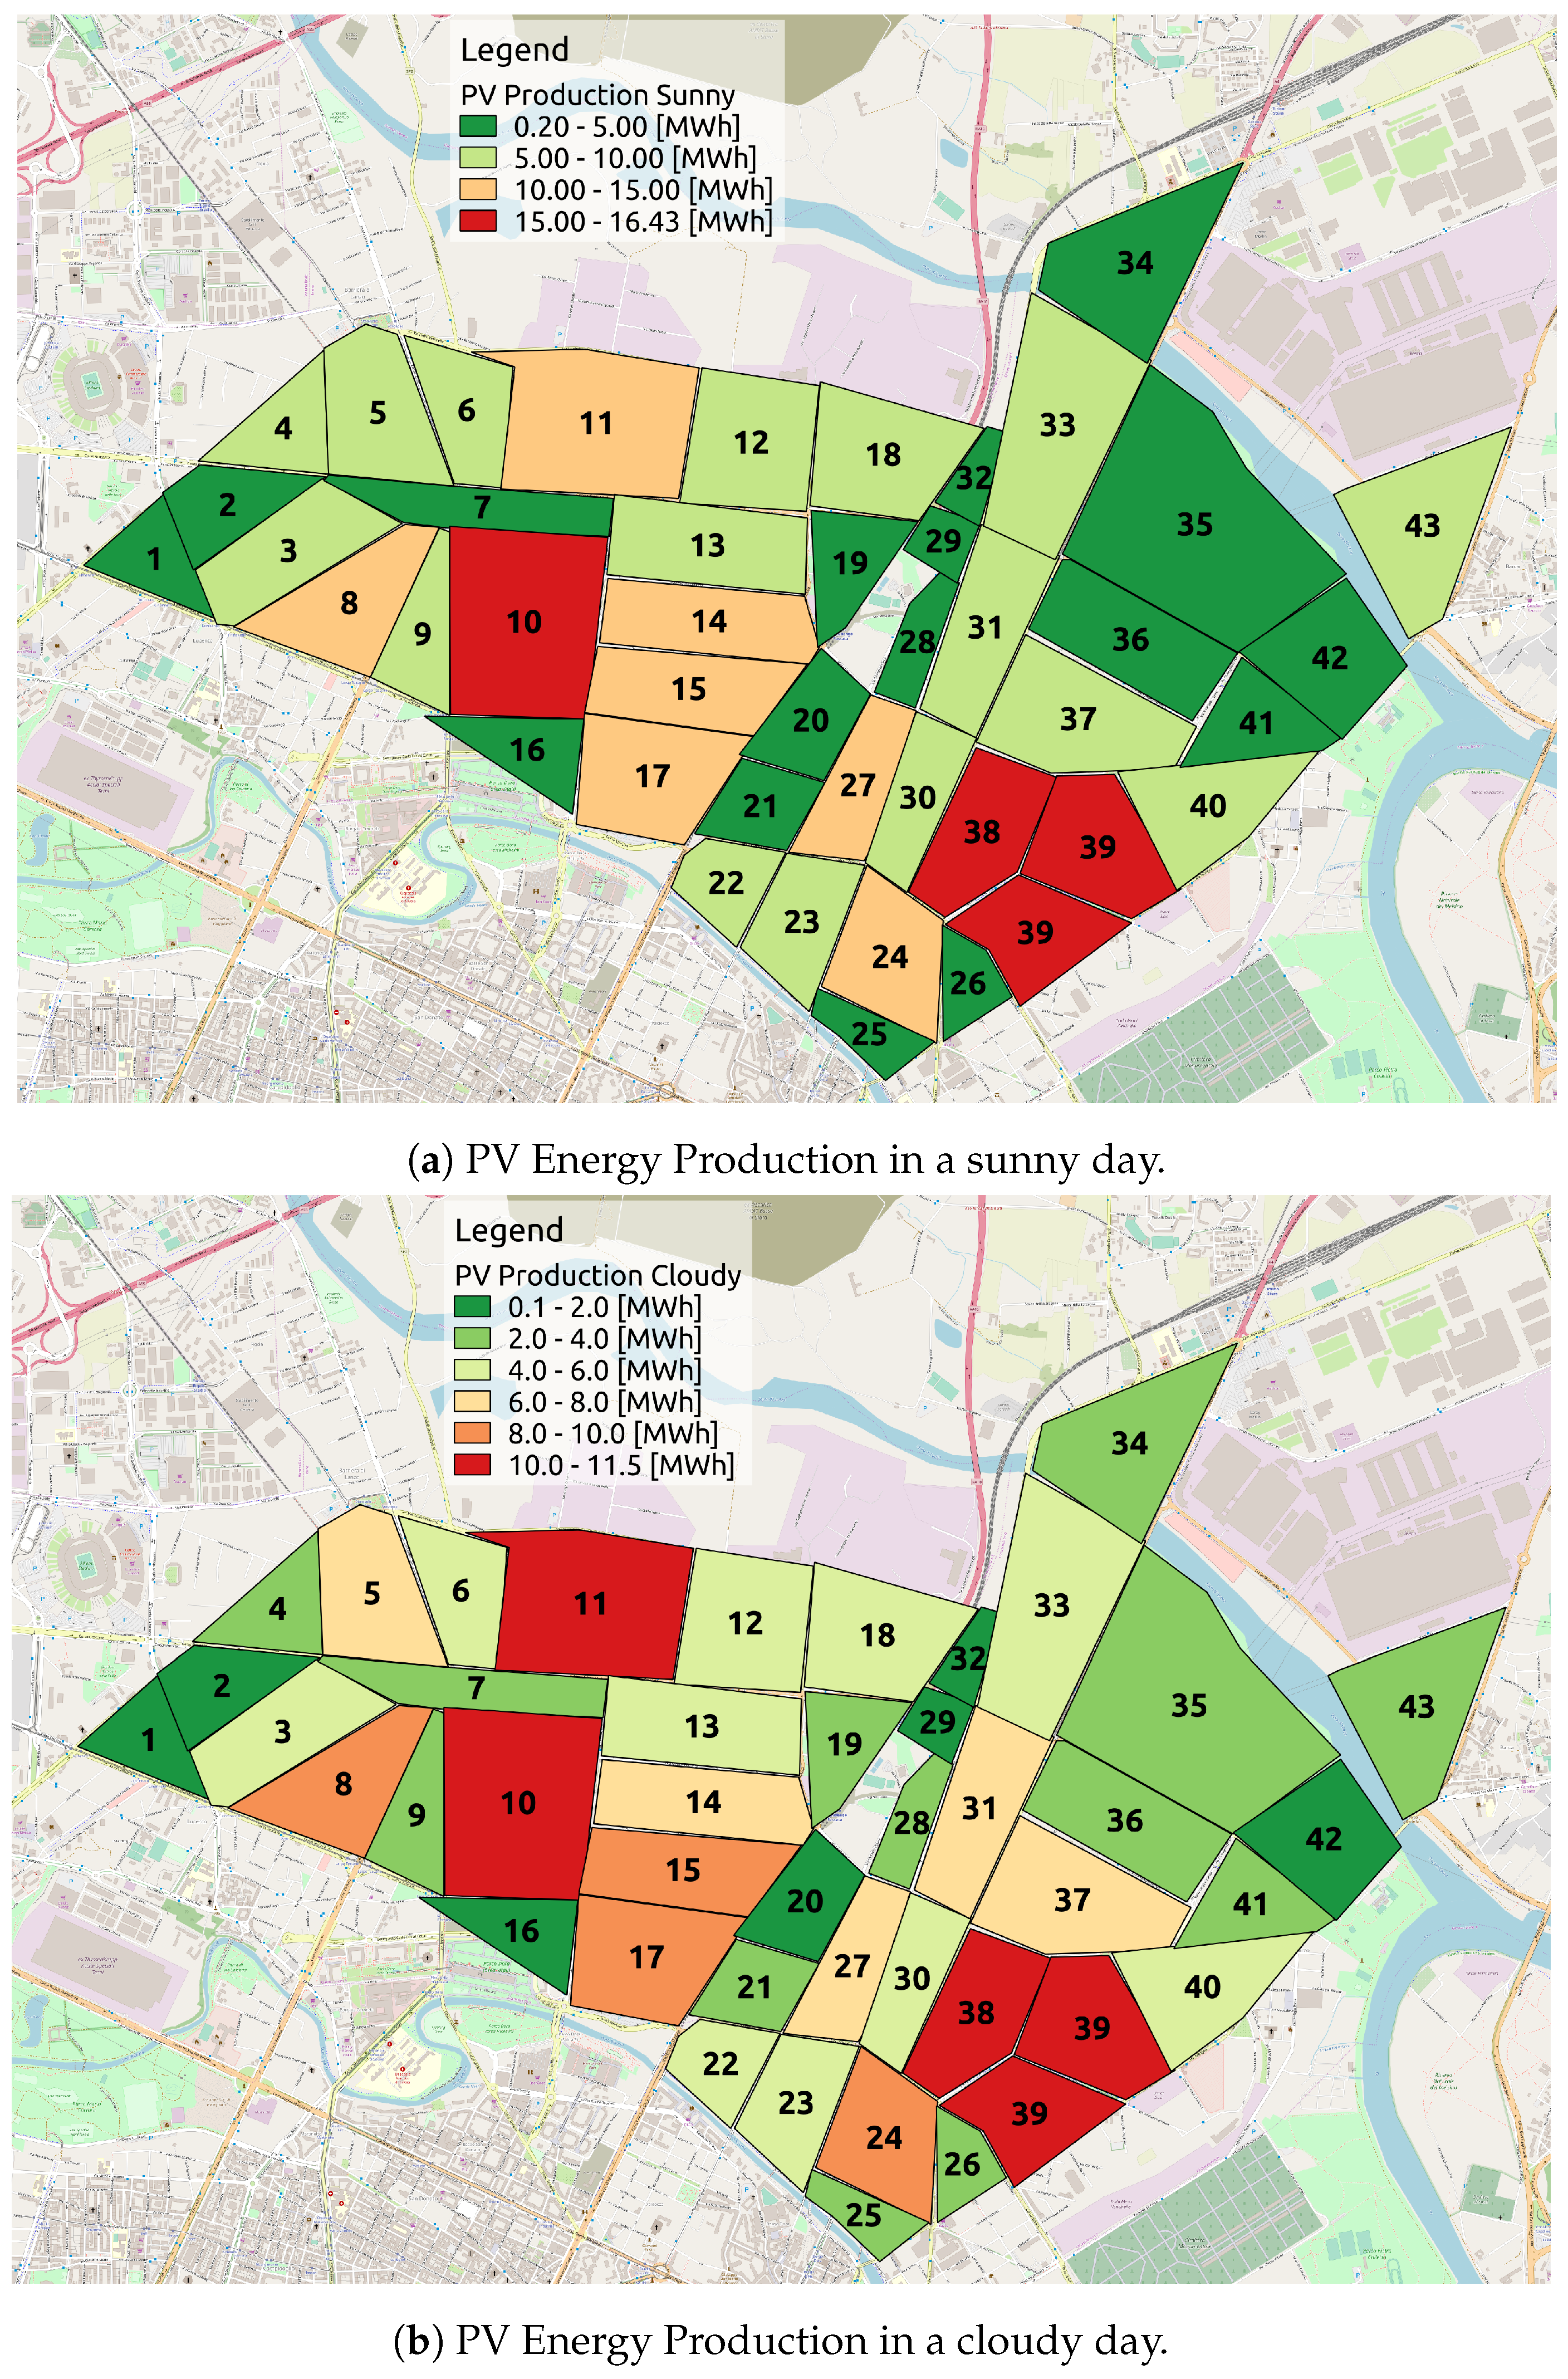
Figure 8b shows the energy produced for each of the 43 substations. As shown in the figure, the maximum energy, about
MW, is produced by PV systems at substation 10.
Figure 9a,b present our simulation results for two days with different meteorological conditions: sunny and cloudy, respectively. These figures would refer to our test system.
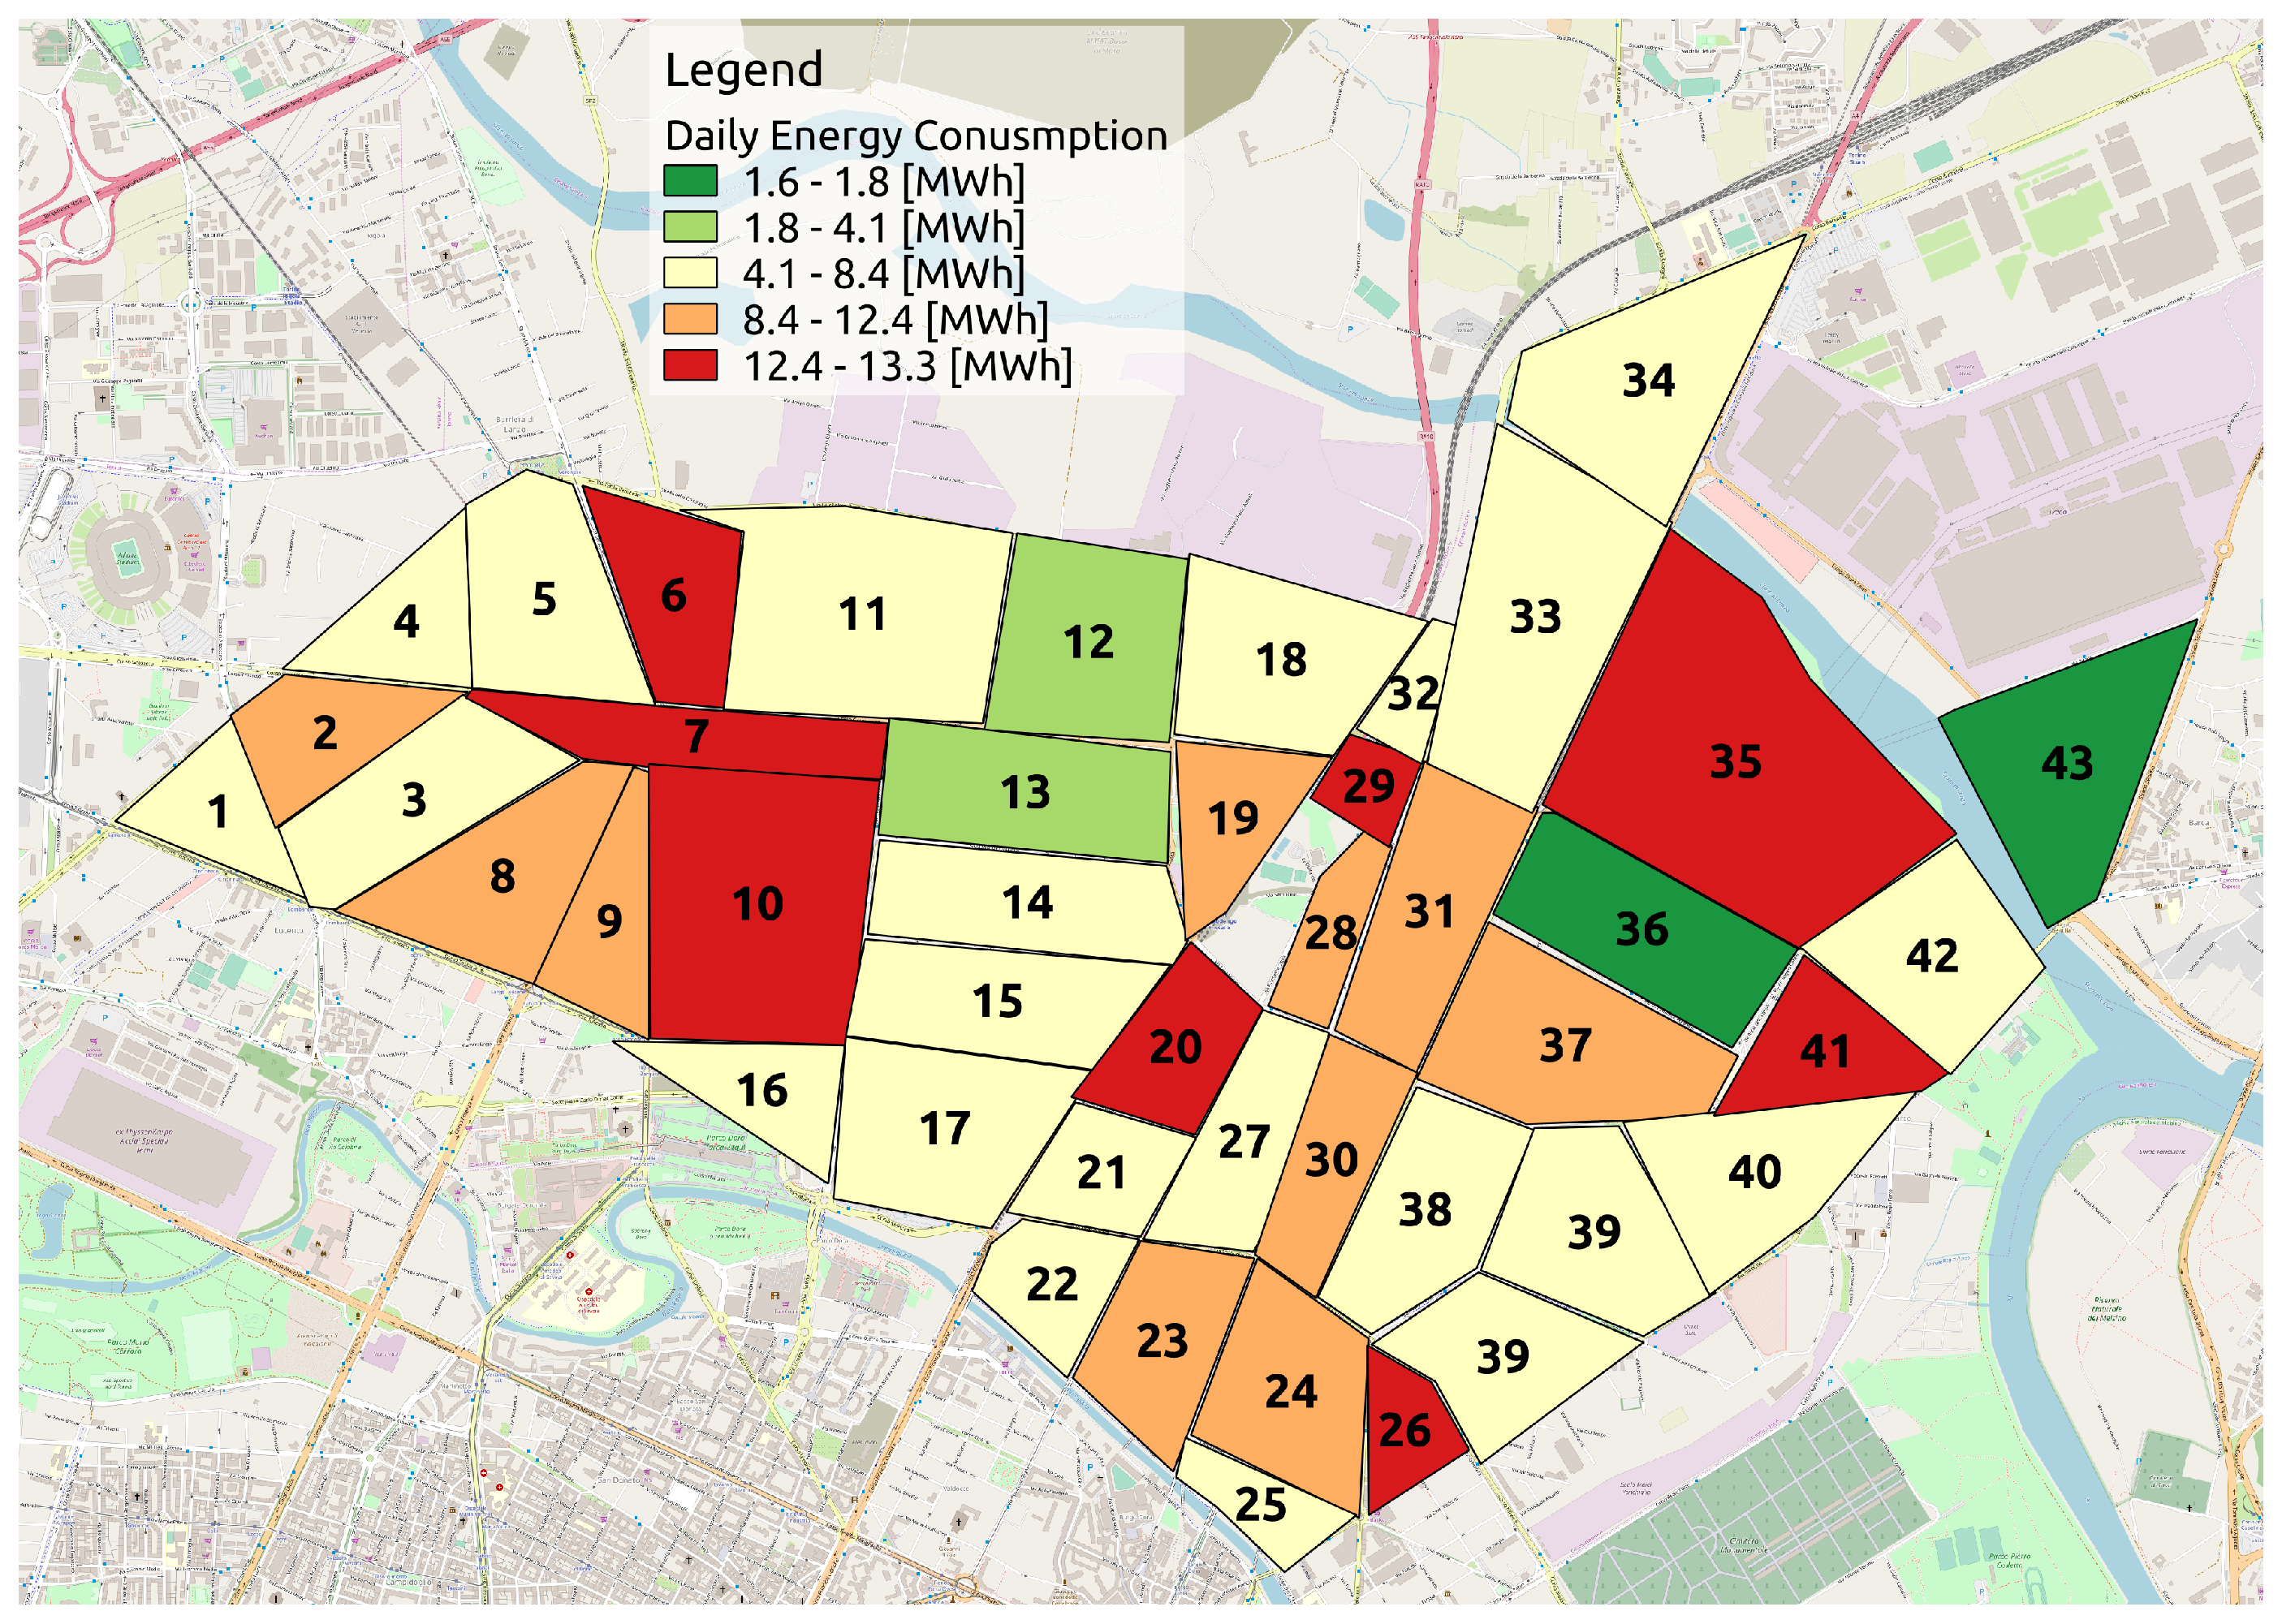
Figure 10 shows the map of the daily energy consumption of each substation. This is made based on the reference scenario of consumption with no errors (i.e., the reference system). It is possible to notice that the seven substations have the highest consumption that ranges between
MWh and
MWh. Just one substation has a level of consumption lower than
MWh and the majority of the substations have a consumption ranging between
MWh and
MWh.
In our simulations, we supposed that load data has an estimation error of about
. Two cases are considered to evaluate the proposed methods performance. In the first case, the test system is considered to be heavily loaded and weather is considered to be sunny.
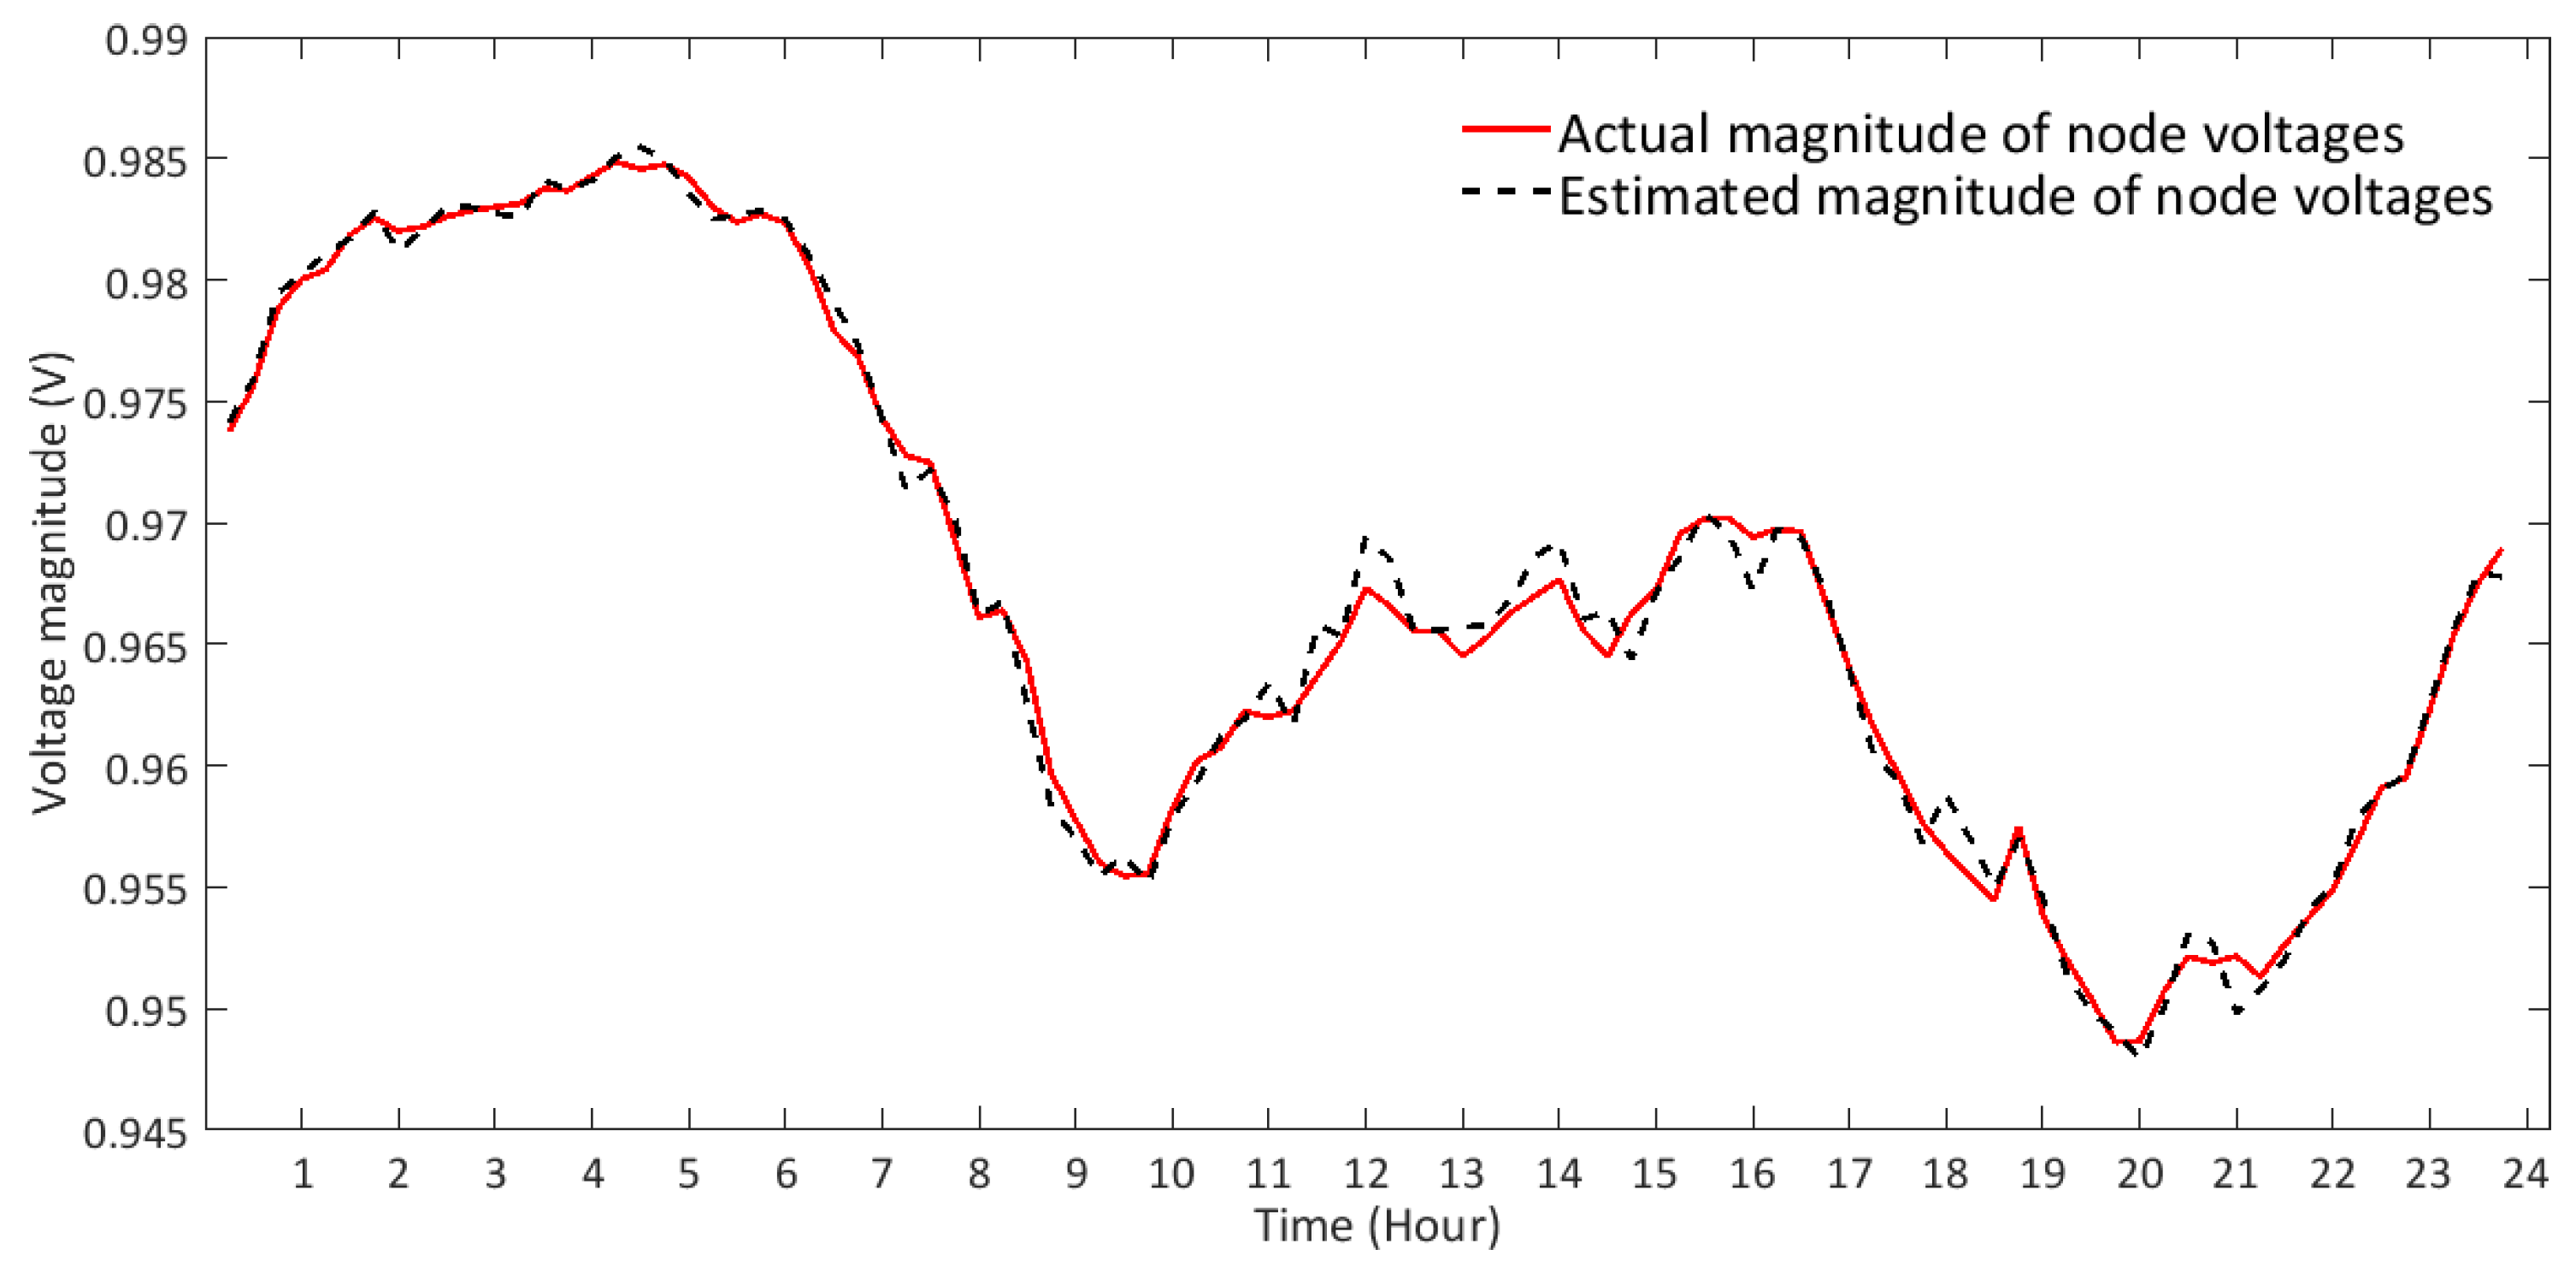
Figure 11 presents the estimated and actual voltage magnitudes of the last node of the test system longest feeder (refers to Chieri feeder in
Figure 4). This is because the last node highlights the effect of errors and it is more interesting to be used for validation of the algorithm. As shown in this figure, the estimated voltage profile perfectly matches the actual node voltage. The main contribution of the PV units is the middle of the day. In this period while the electricity consumptions are higher, the PV units help the network to keep the voltage levels in the standard range (0.95–1.05 p.u.).
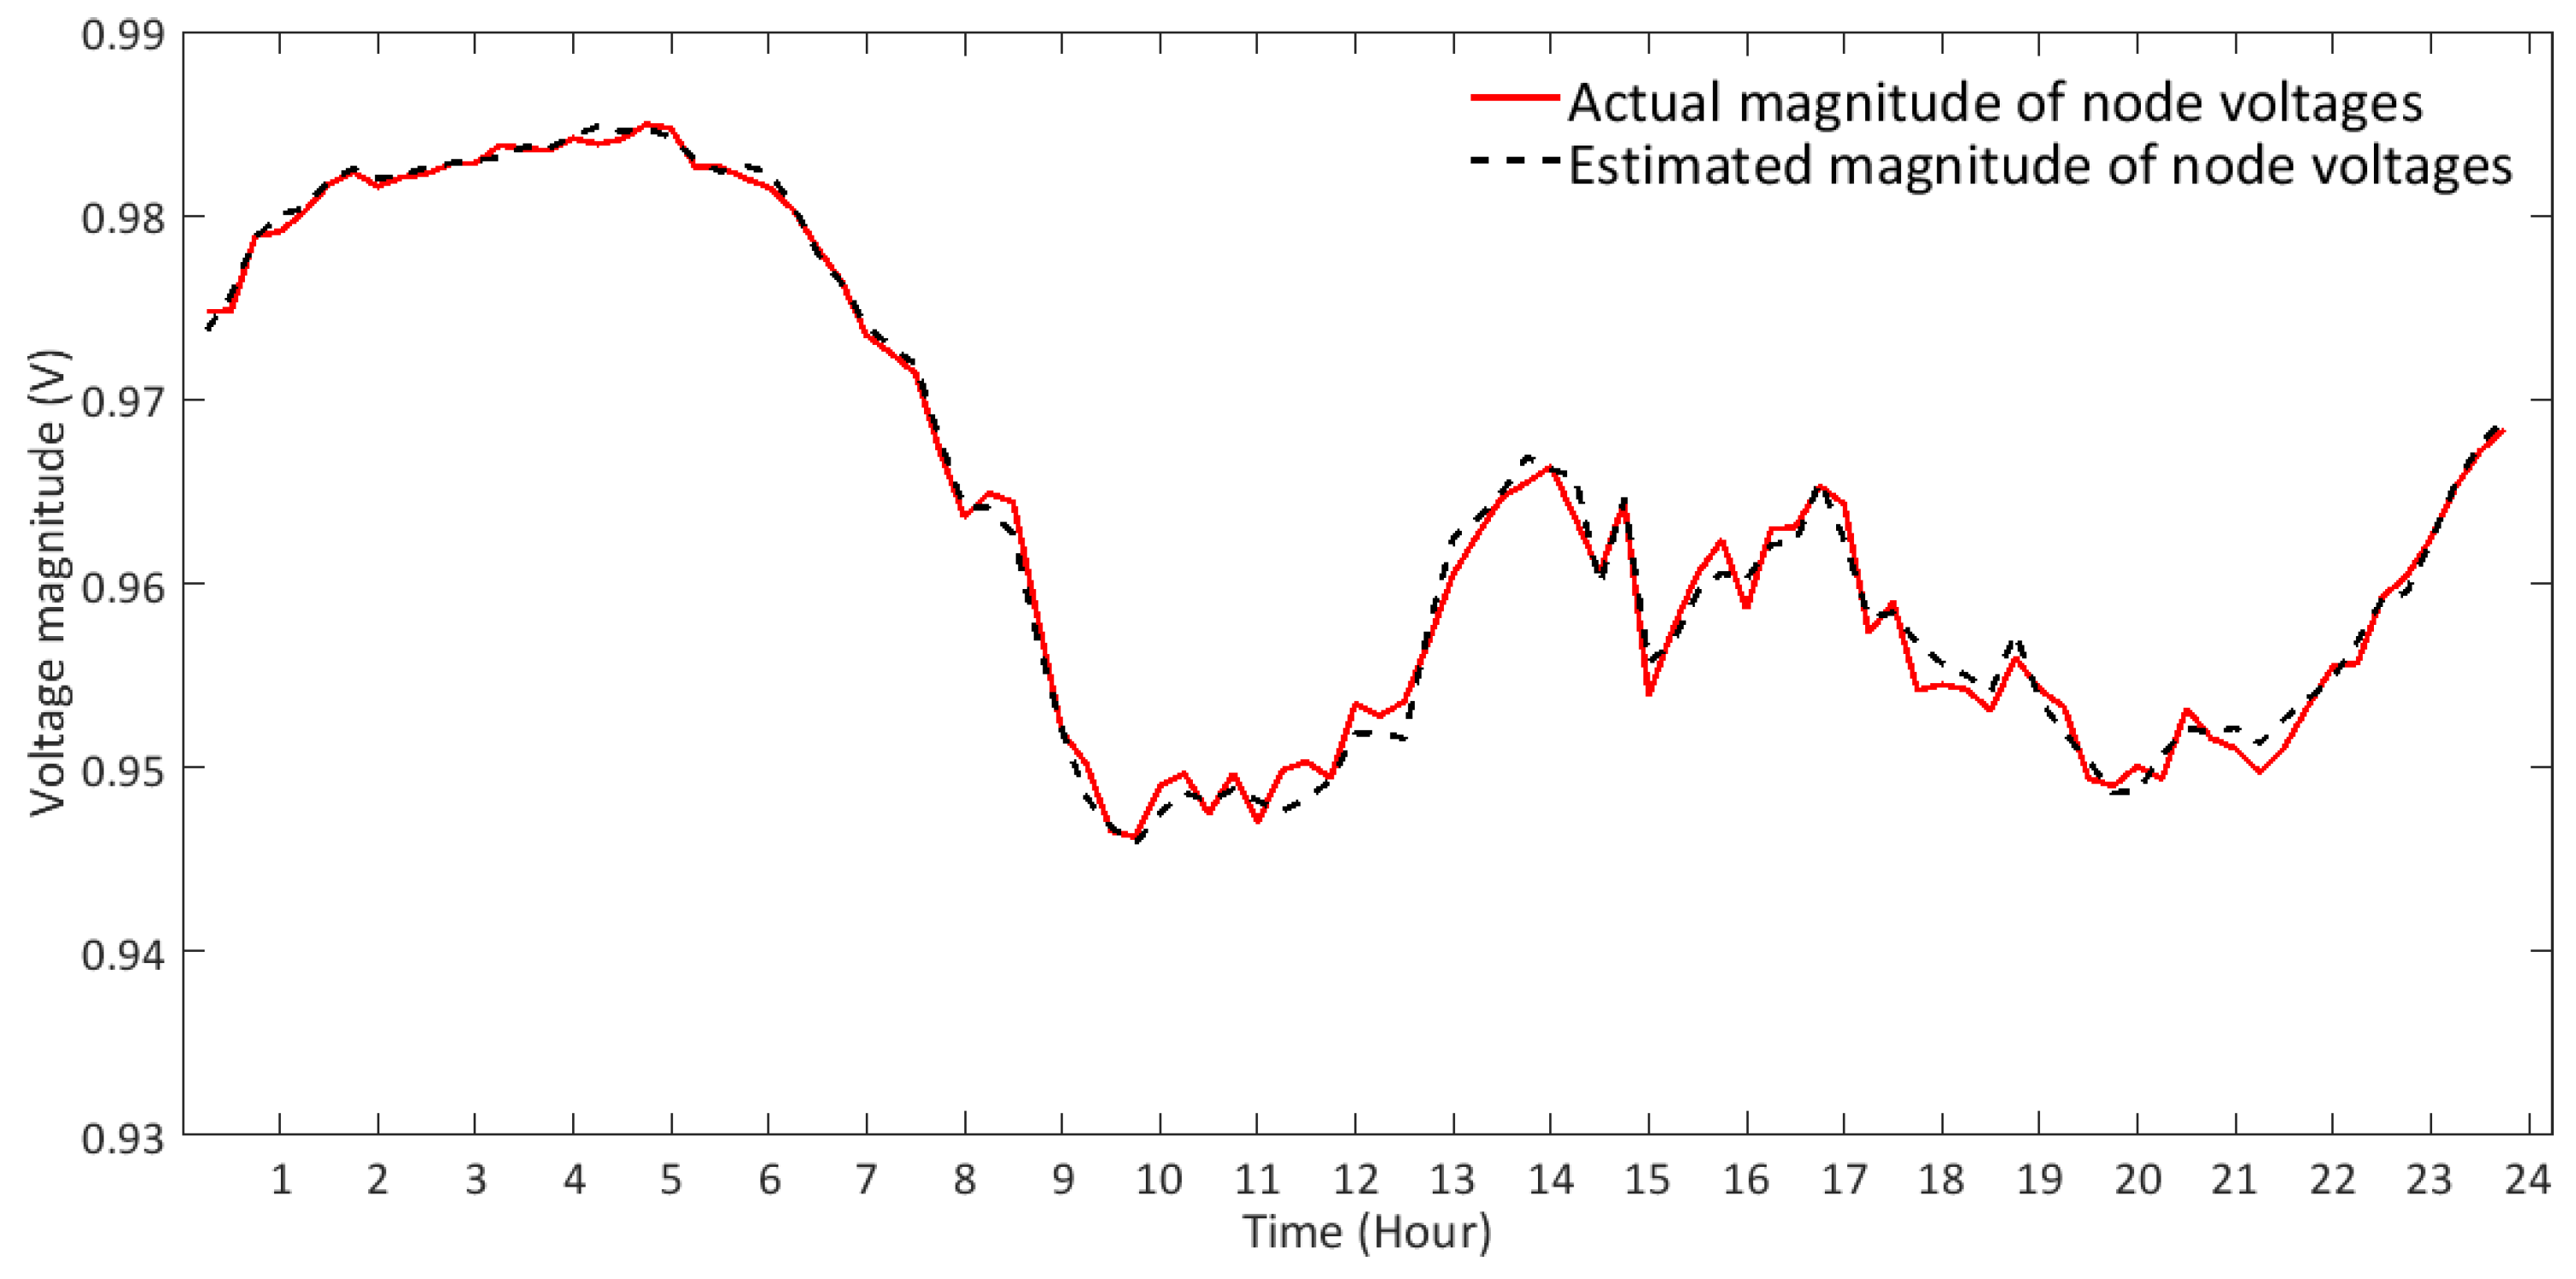
The same load profiles are considered for the second case for which the weather is considered to be cloudy. The voltage profile of the feeder last node under this case is presented in
Figure 12. As can be seen, also for this case, the difference between the estimated and actual voltages is acceptable and the accuracy is very high. This accurate results are confirmed by the performance indexes in
Table 1. Indeed, both
Correlation Coefficient and
Index of Agreement are
for both sunny and cloudy days, which indicates a high match between the actual and estimated voltages. It is interesting to note that the lower PV productions in
Figure 12 compared to
Figure 11, due to cloudy weather, have resulted in under voltage situation for some hours of the day.
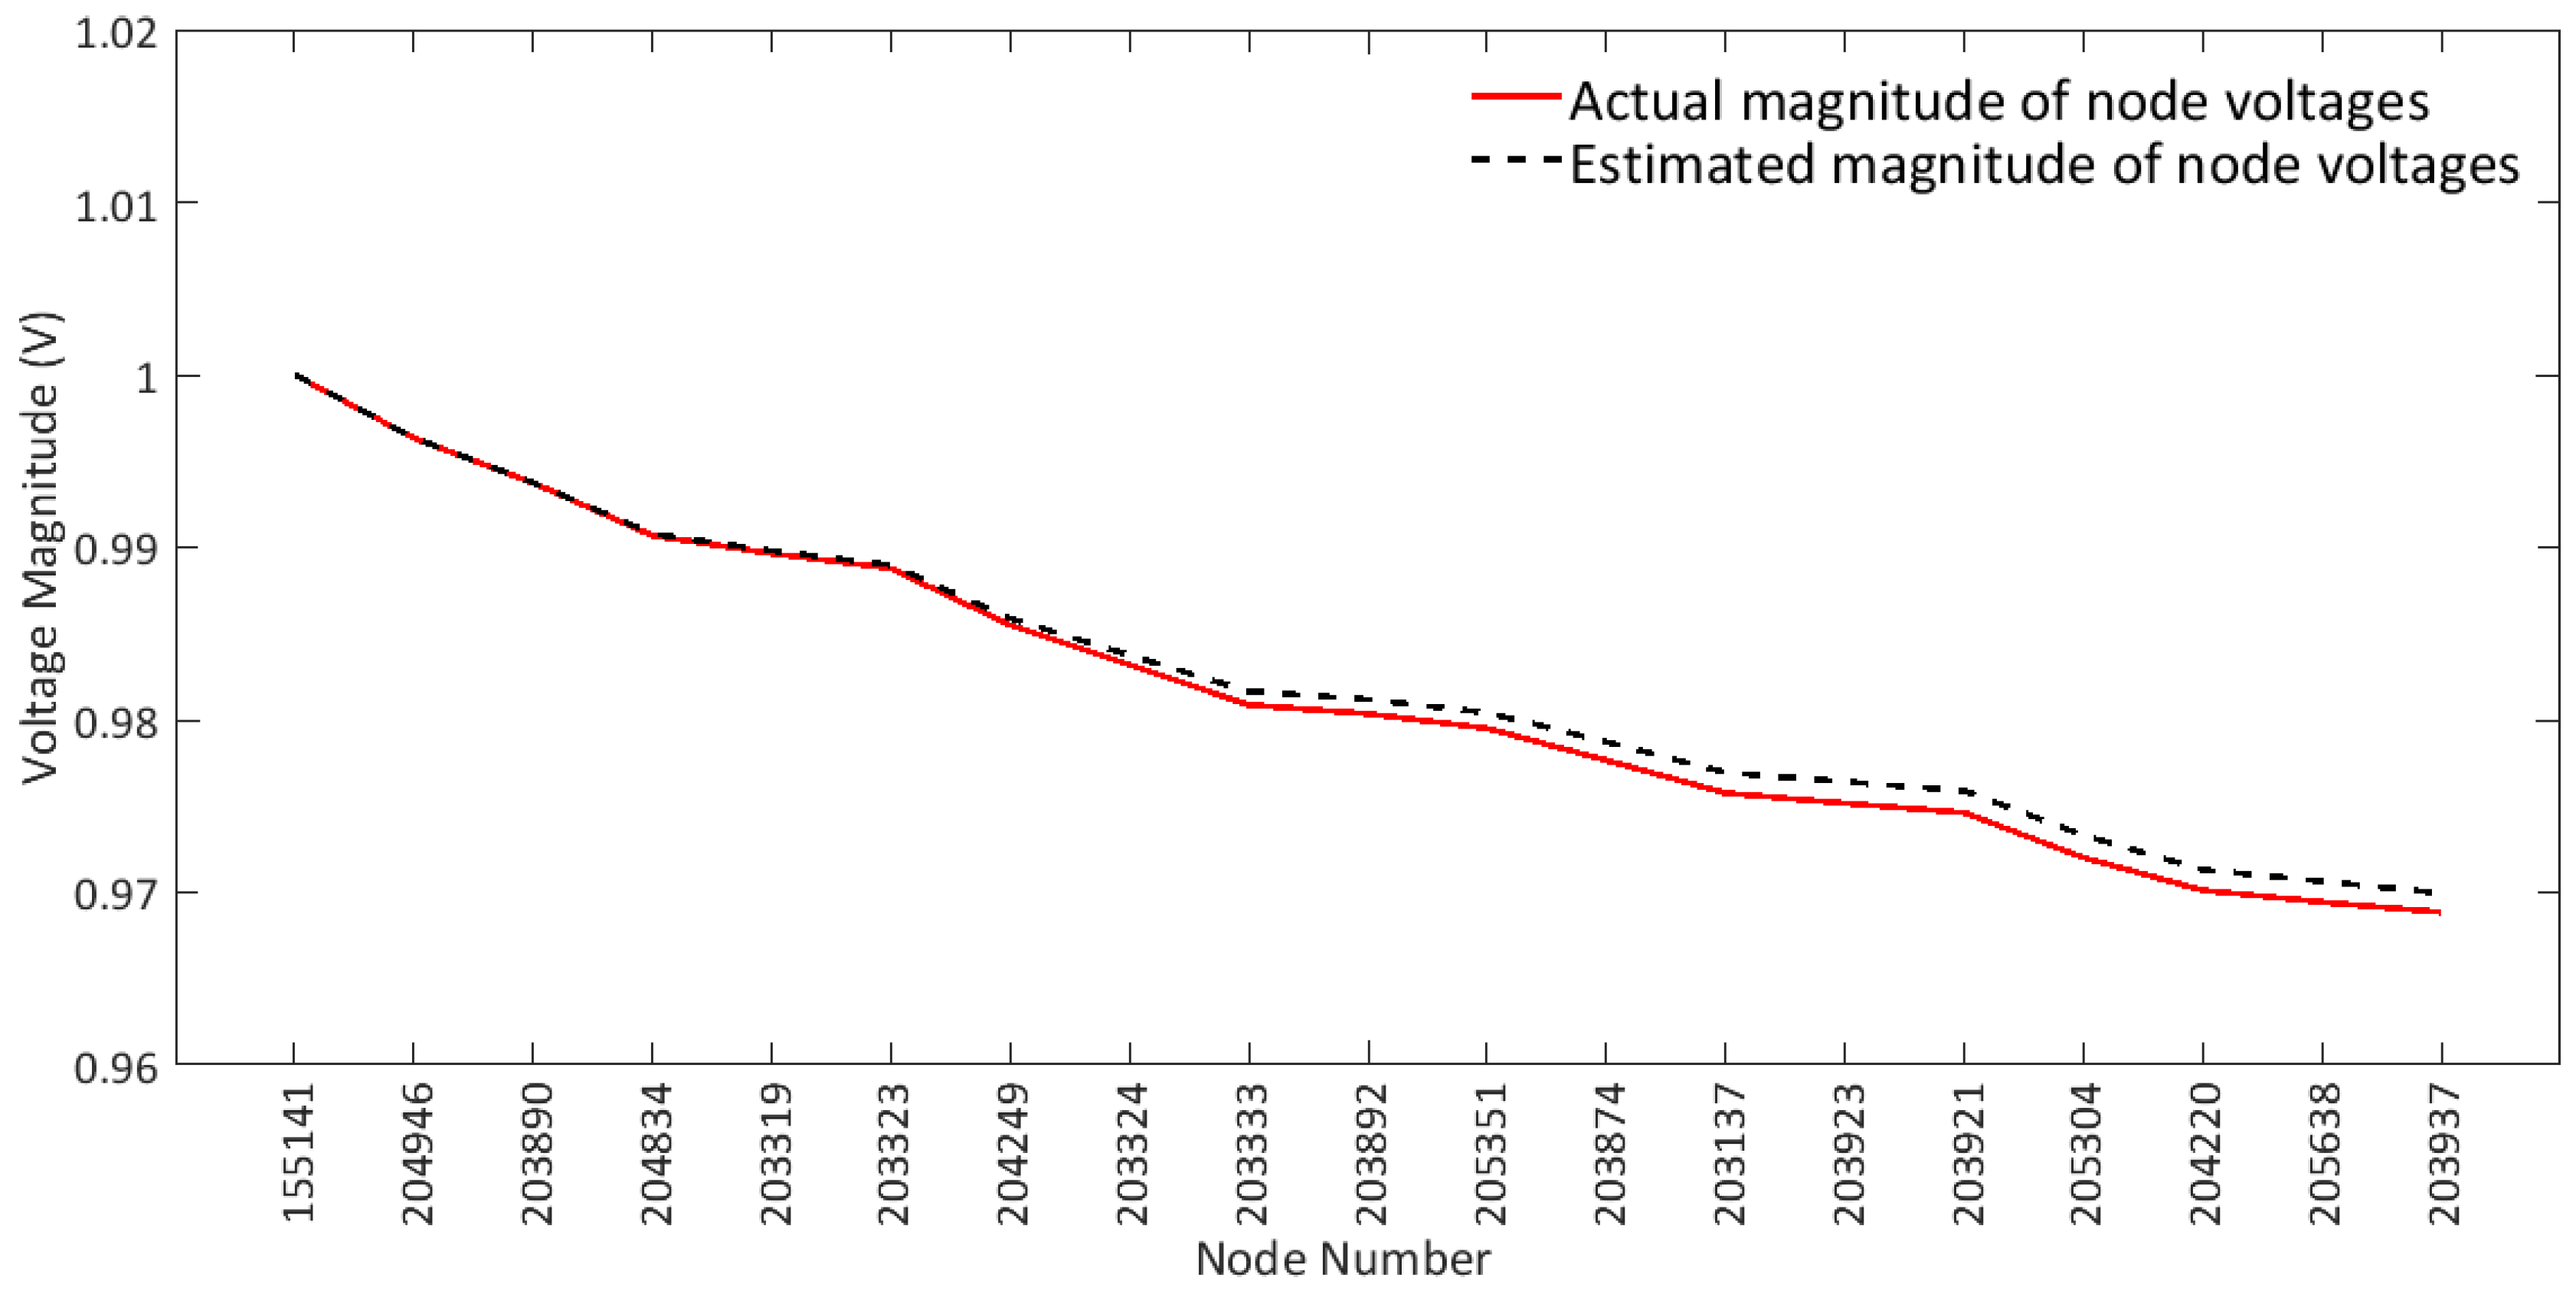
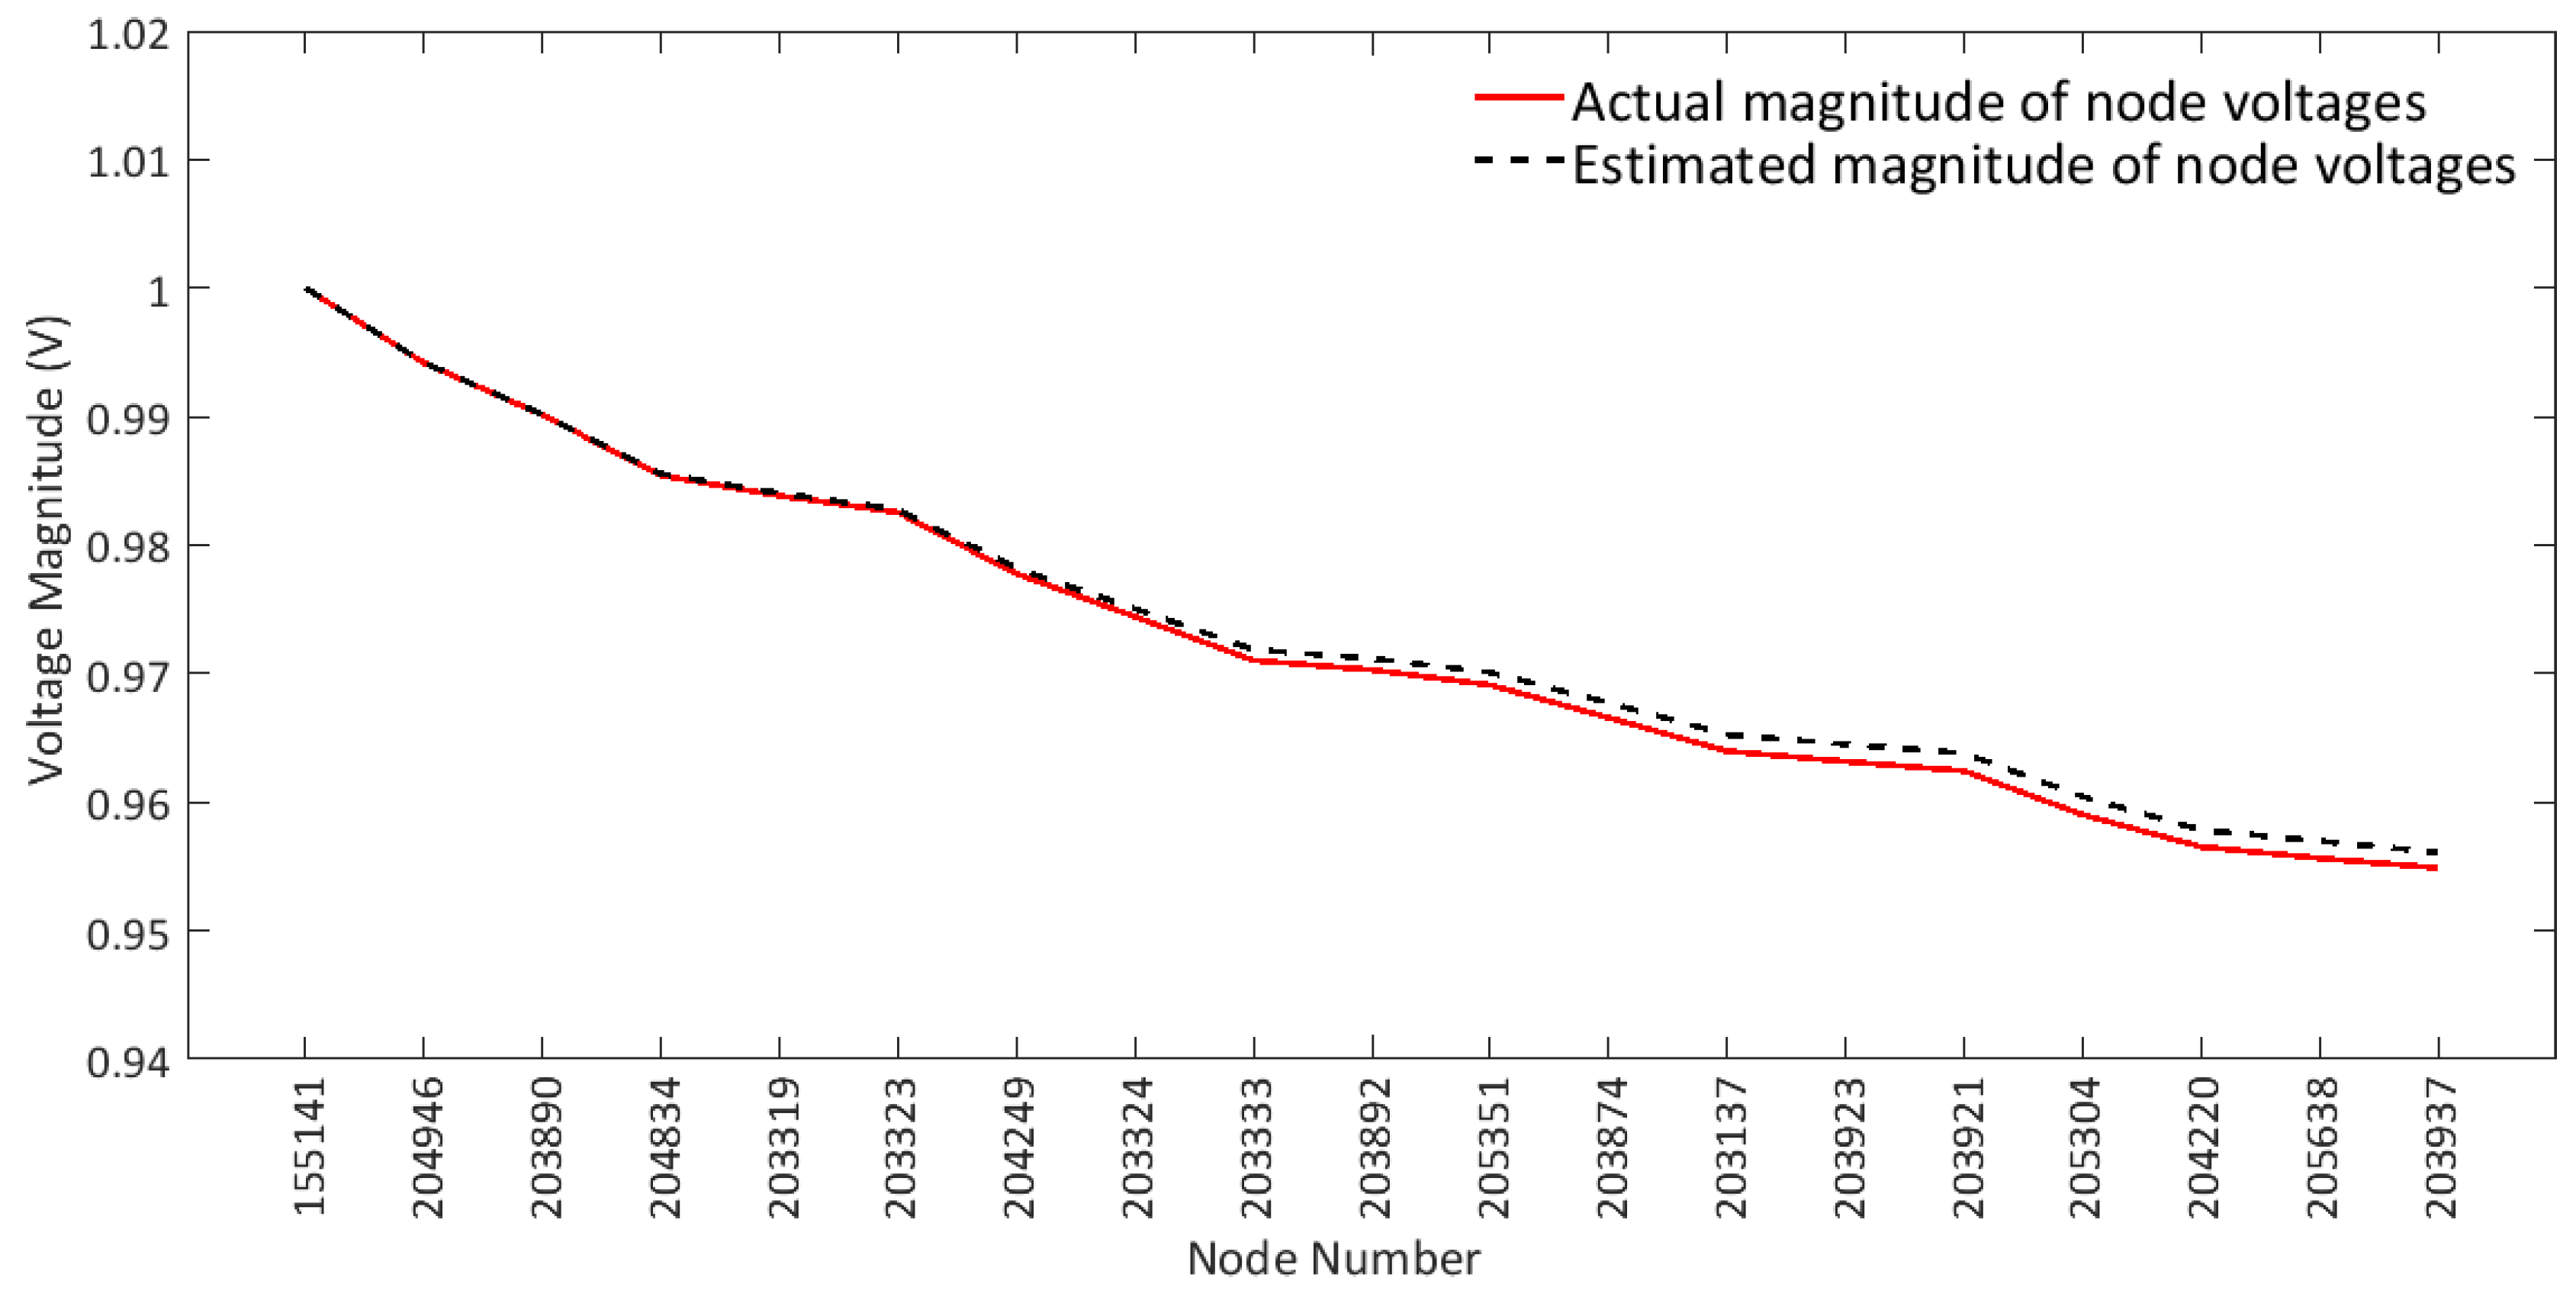
Node voltages are the parameters usually used to evaluate the accuracy of different state estimation methods. Therefore, the voltage of all nodes of the feeder are presented in
Figure 13 and
Figure 14 for both the sunny and cloudy day cases at 12:00 p.m. As shown, for both cases, there is a good match between the estimated and actual voltages. Regarding the performance of our distribution state estimation, although the scheme is designed for smart grids under high PV penetration, but even for the nodes with no PV connection, estimations are pretty accurate. These good performances are confirmed by the indexes for all 18 nodes in
Table 1, which indicate the overall performance for the whole feeder. Even in this case, both
Correlation Coefficient and
Index of Agreement are
for both sunny and cloudy days. Bias ranges between
and
. MAE and RMSD are about
and
, respectively. Thus, among the nodes in the feeder under analysis, the error rate is about
, which is very low.
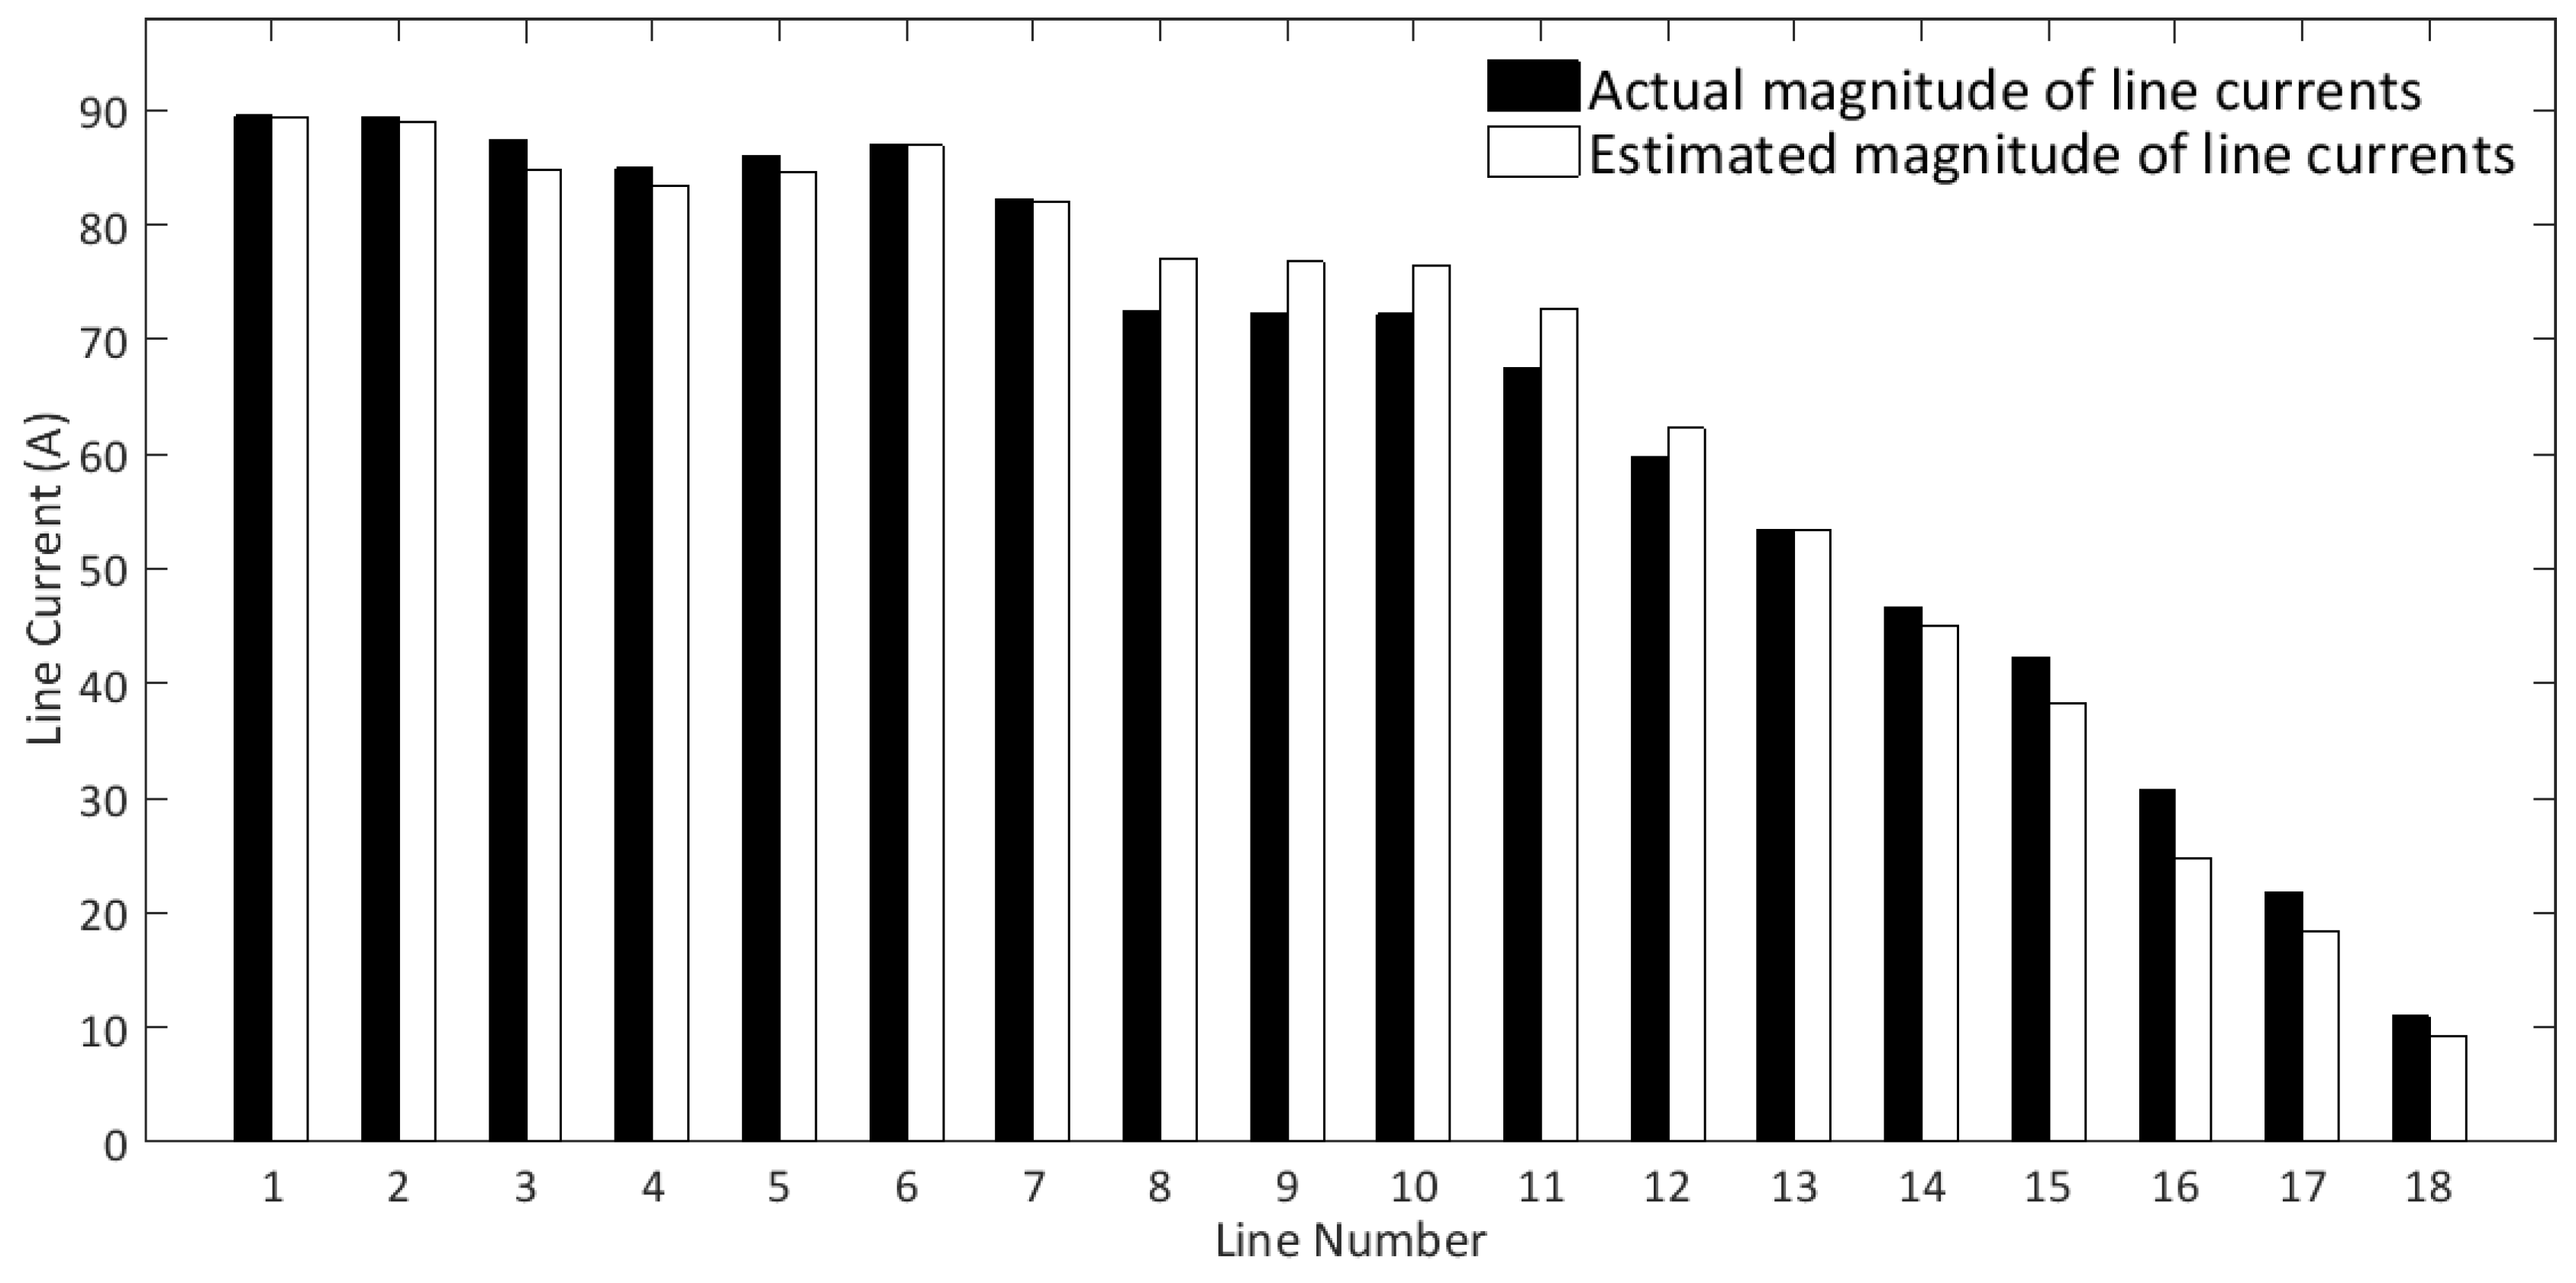
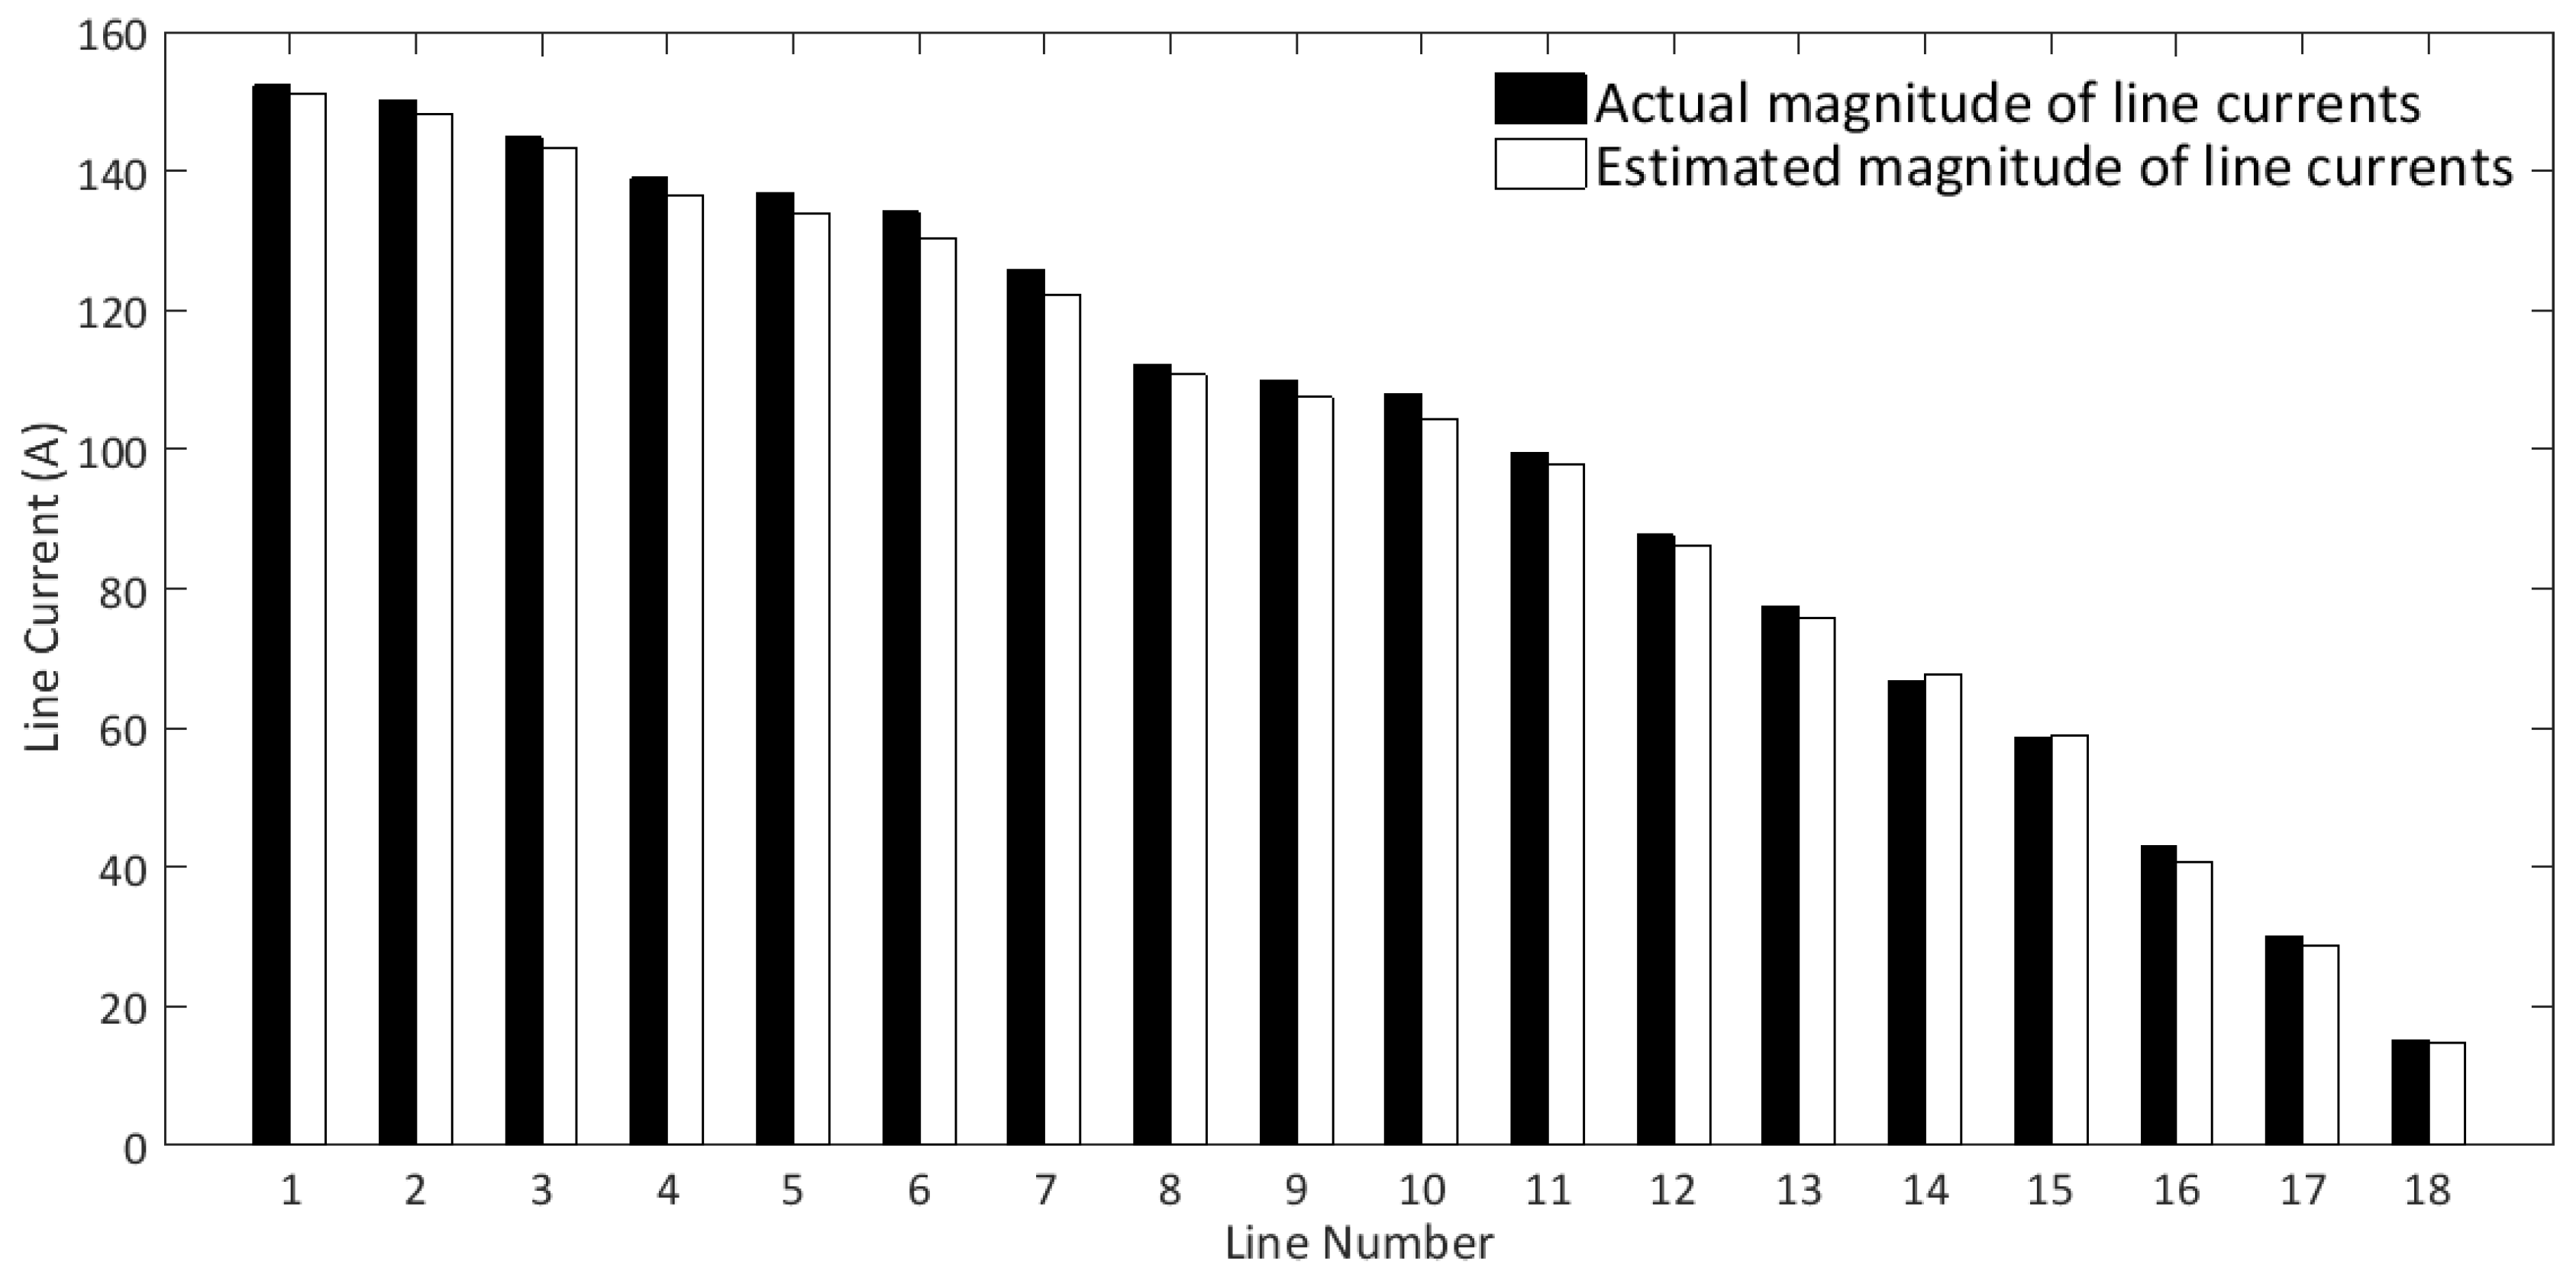
The feeder line currents at 12:00 p.m. for both sunny and cloudy days are presented in
Figure 15 and
Figure 16 for its 18 lines. For both cases, the system is considered to be heavily loaded. As shown in the figures, there is little difference between the estimated and actual line currents.
In case of sunny days, due to the increase in local power generation, the feeder line currents are decreased. However, in the case of cloudy days, the feeder has high line current values. As can be seen, the PV penetration level has considerably changed the line currents. The same effect can be seen in
Figure 13 and
Figure 14, where the decrease in local power generation in a cloudy day has resulted in lower voltage levels, compared to a sunny day.
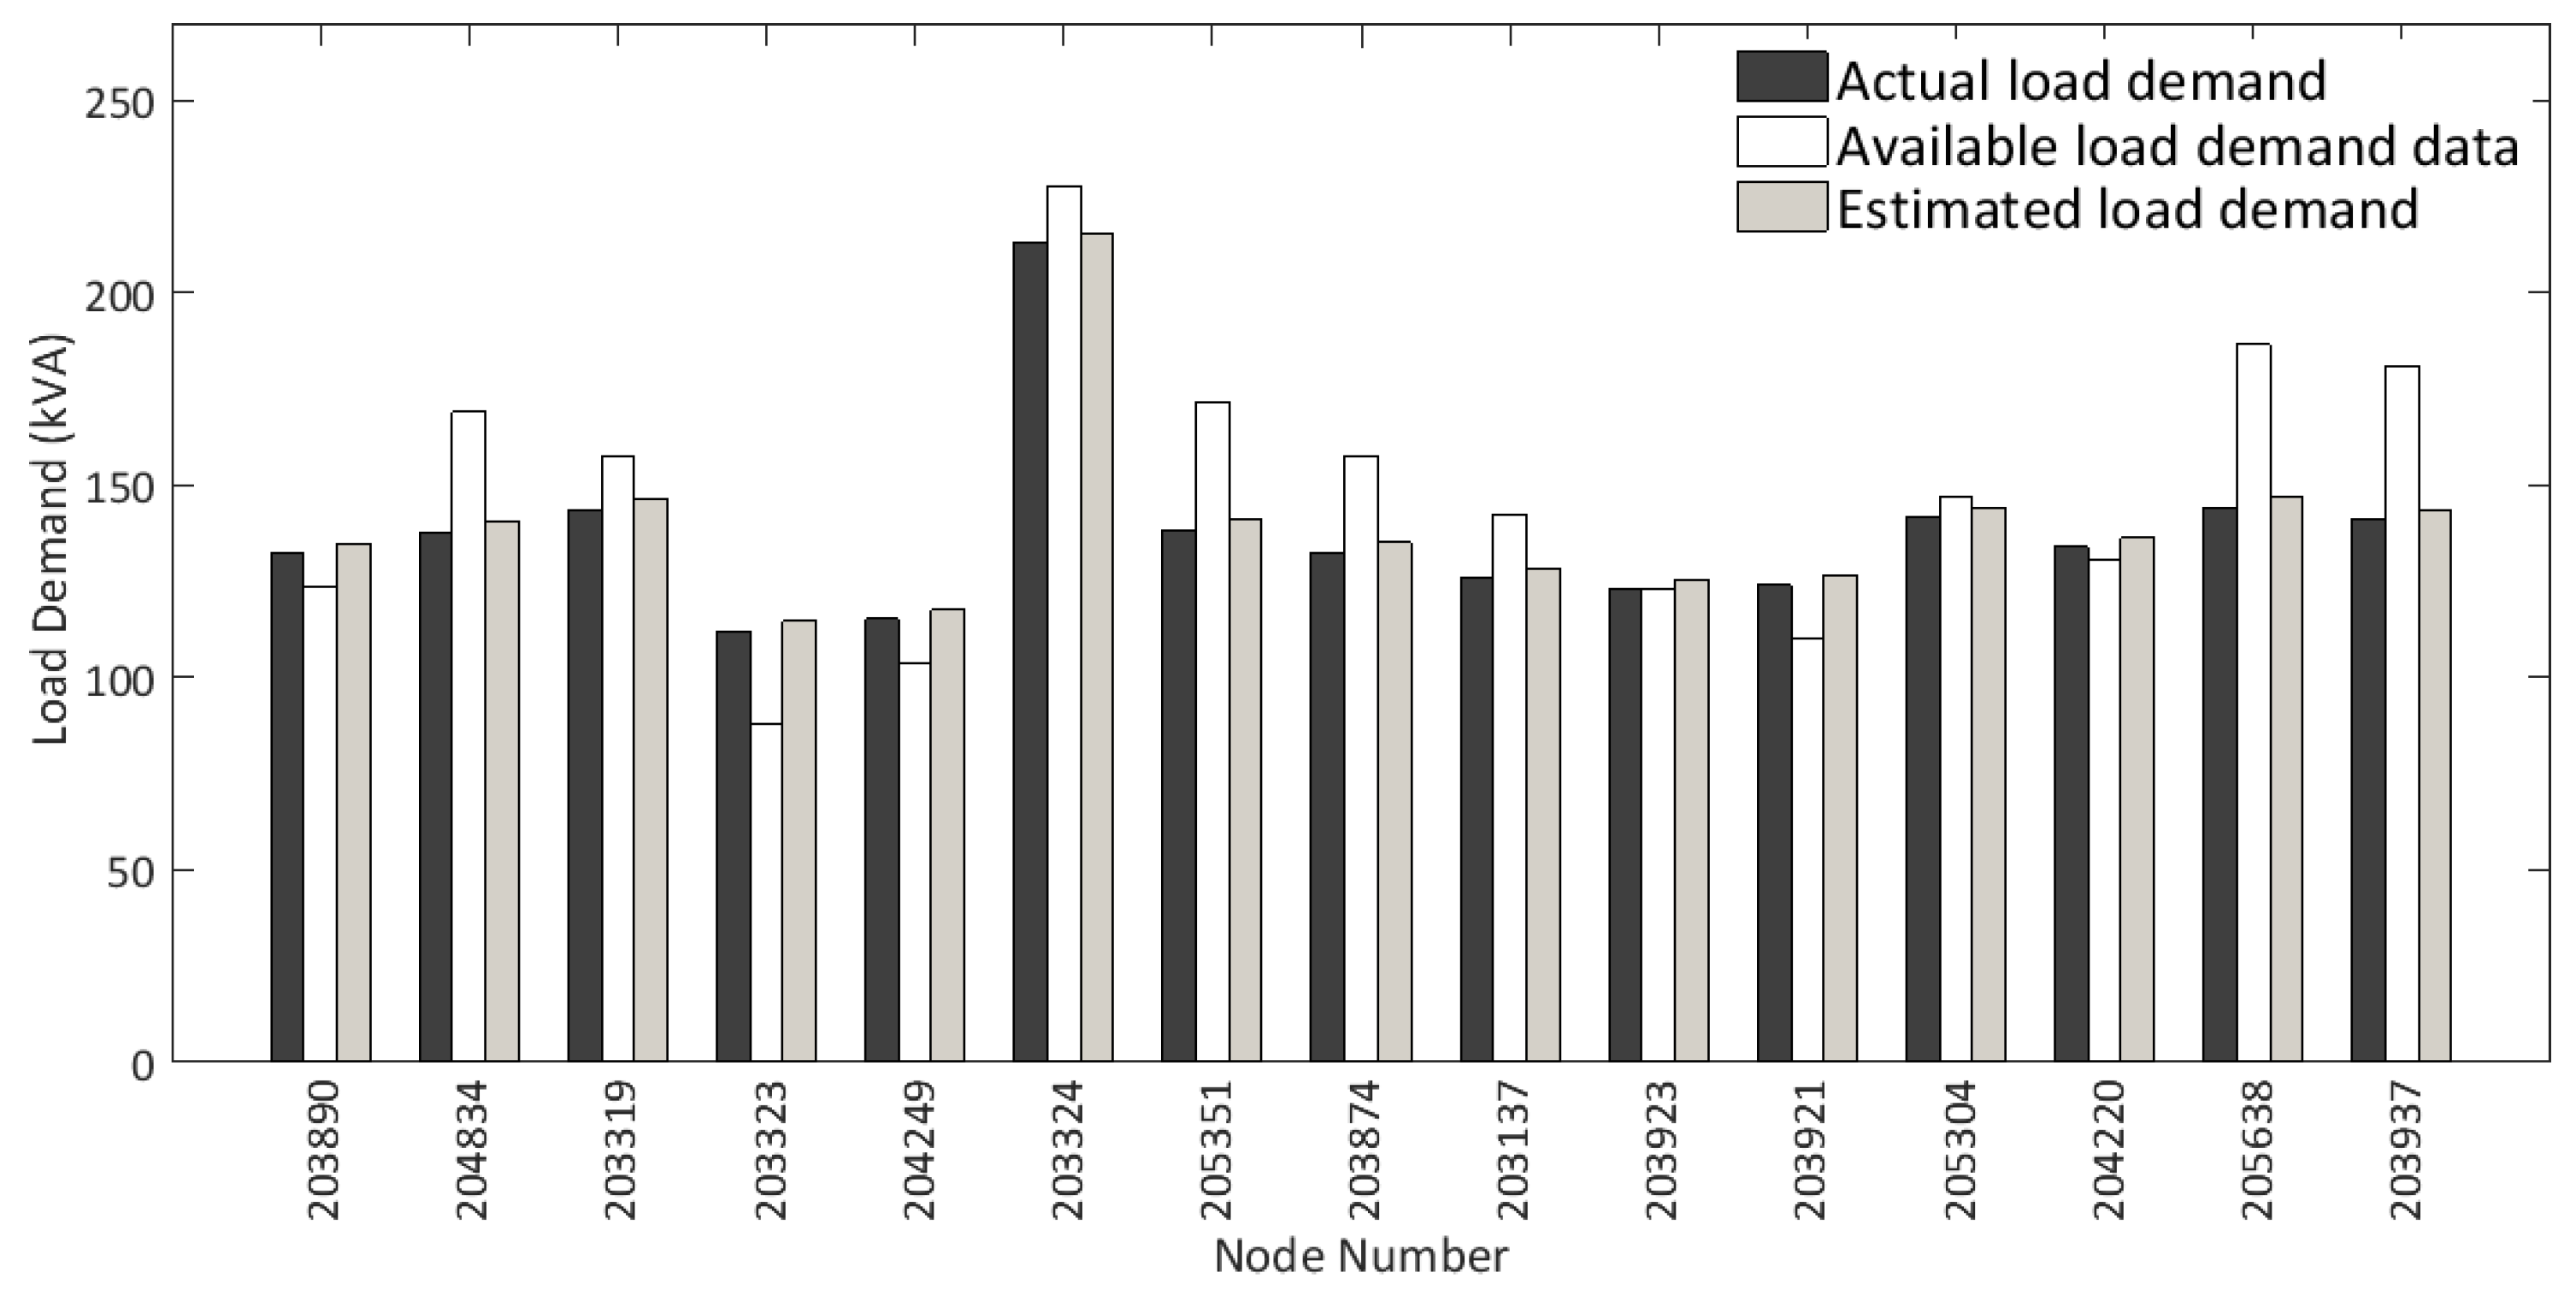
Such changes caused by variations of local power generation highlight the need for a monitoring scheme for electricity distribution systems with large-scale DG integration but no commensurate monitoring infrastructure. To highlight the potential of the proposed method for better grid monitoring,
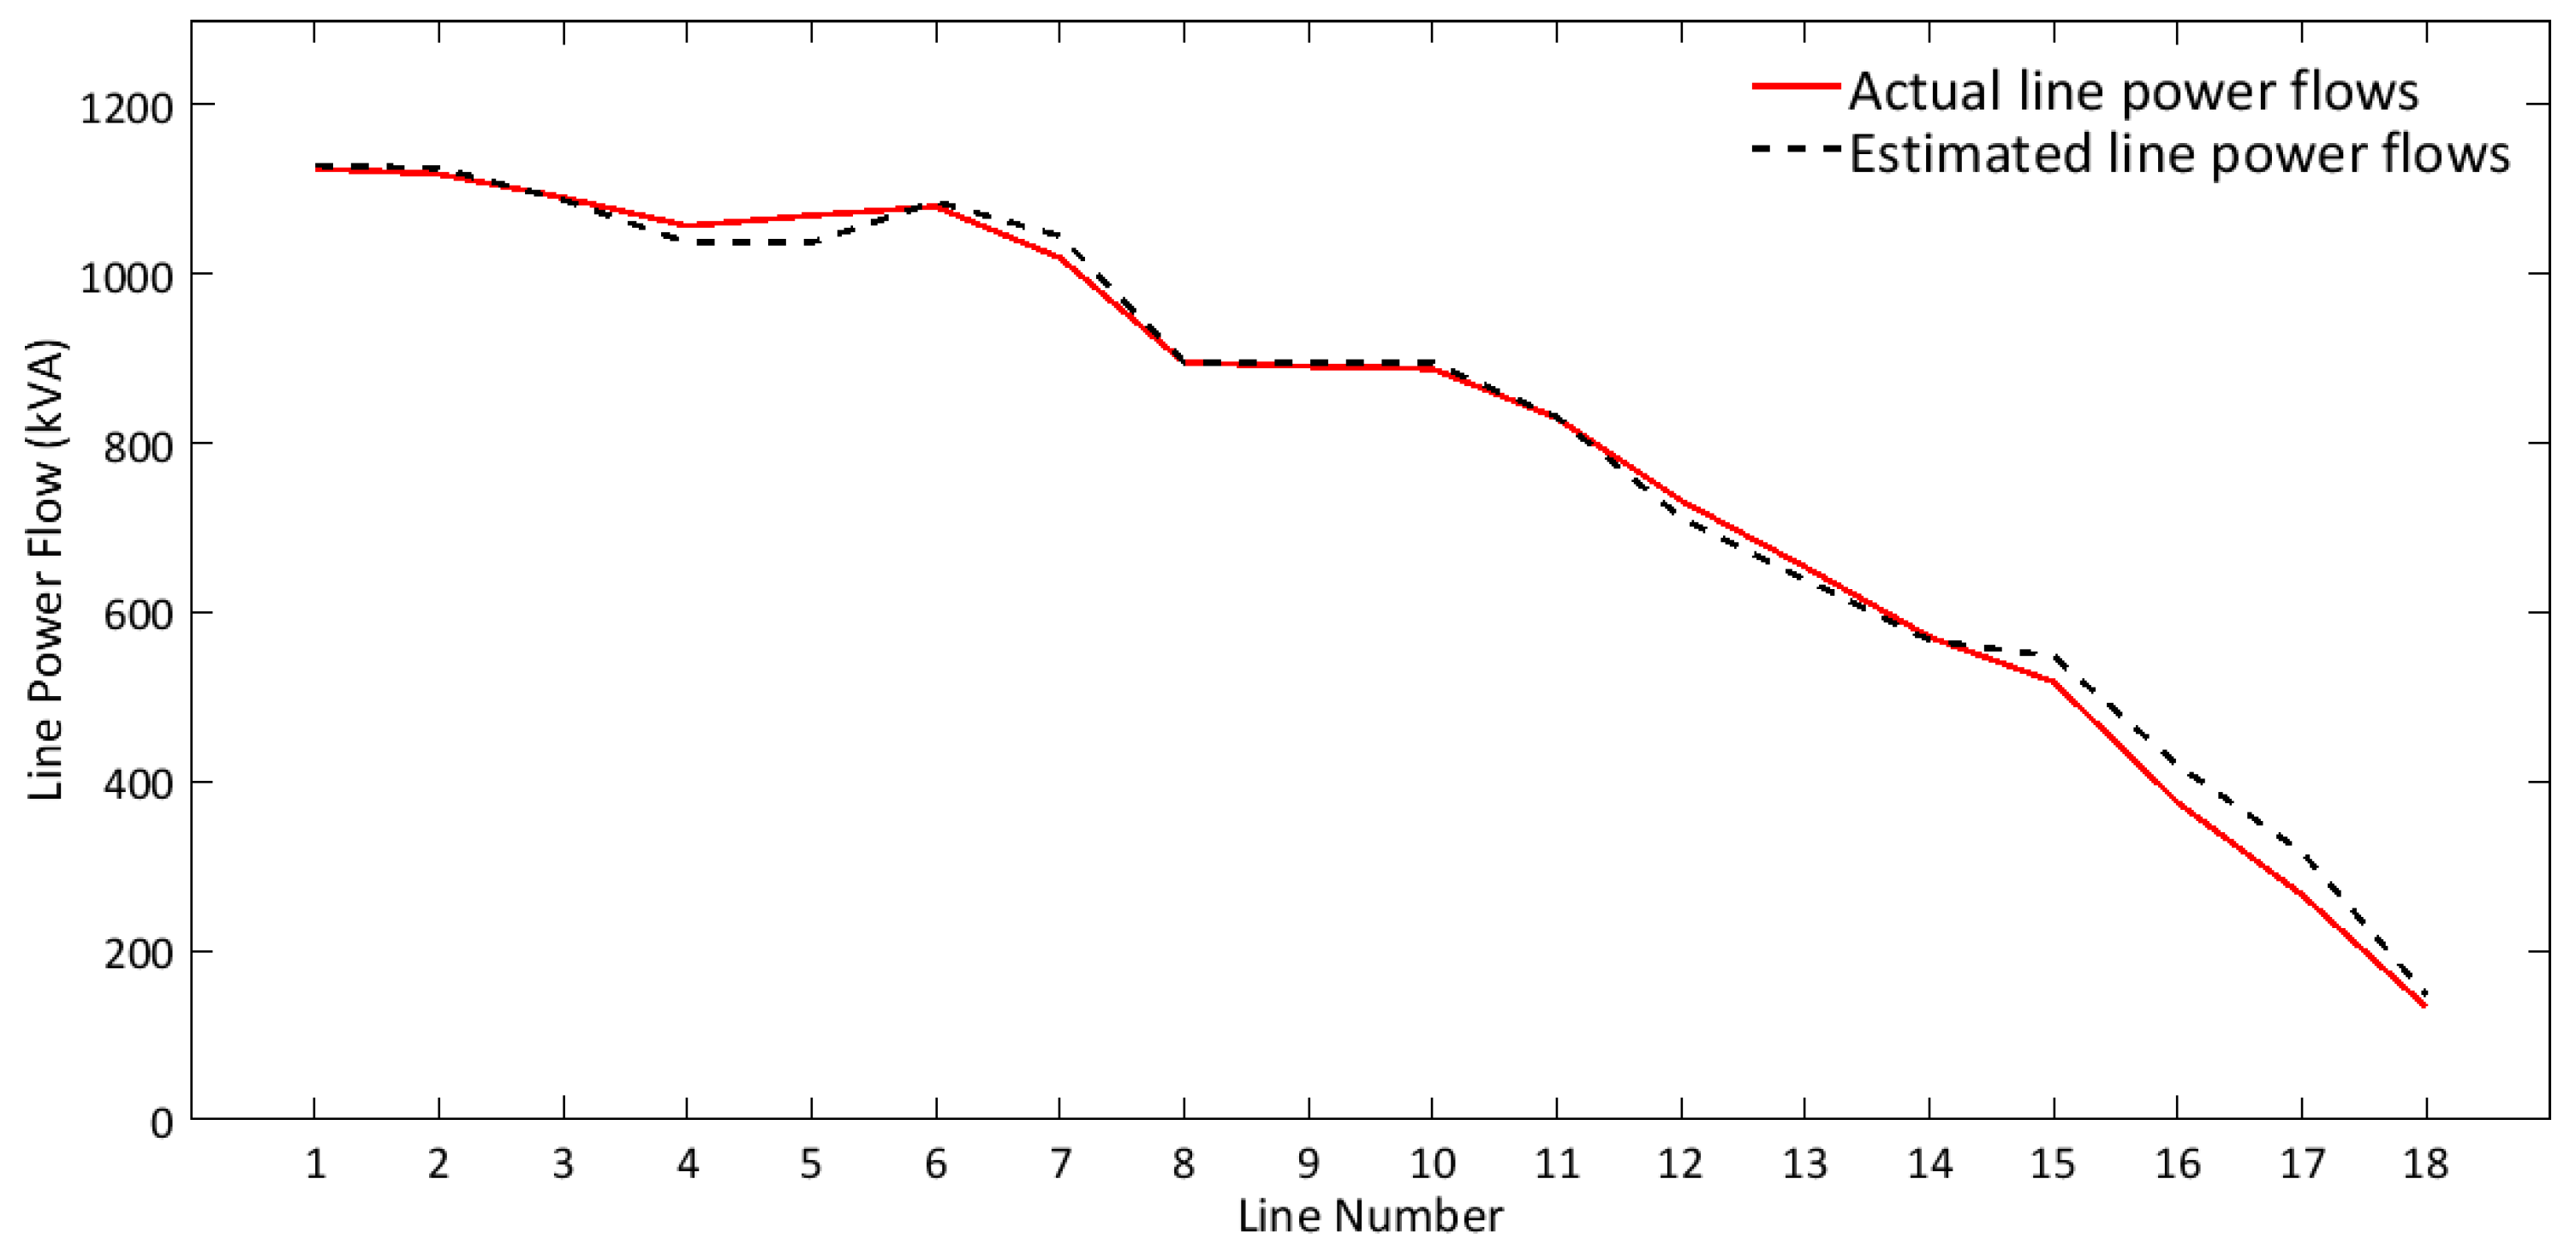
Figure 17 presents the feeder actual load demands, estimated load demands and the available erroneous load data employed for the estimations. As it can be seen from the plot, the proposed architecture helps making an accurate estimation of the actual system loading. Besides the load demands, estimating the line flows is important for grid control and management.
Figure 18 shows the estimated values of line power flows which match the actual line flows with acceptable accuracy.

 ,
, 


