Article

Investigating the Influence of Reaction Conditions and the Properties of Ceria for the Valorisation of Glycerol

Cardiff Catalysis Institute, School of Chemistry, Cardiff University, Main Building, Park Place, Cardiff CF10 3AT, UK
*
Authors to whom correspondence should be addressed.
Energies 2019, 12(7), 1359; https://doi.org/10.3390/en12071359
Submission received: 13 March 2019 / Revised: 2 April 2019 / Accepted: 5 April 2019 / Published: 9 April 2019

Abstract

:
The reaction of aqueous glycerol over a series of ceria catalysts is investigated, to produce bio-renewable methanol. Product distributions were greatly influenced by the reaction temperature and catalyst contact time. Glycerol conversion of 21% was achieved for a 50 wt.% glycerol solution, over CeO2 (8 m2 g−1) at 320 °C. The carbon mass balance was >99 % and the main product was hydroxyacetone. In contrast, at 440 °C the conversion and carbon mass balance were >99.9 % and 76 % respectively. Acetaldehyde and methanol were the major products at this higher temperature, as both can be formed from hydroxyacetone. The space-time yield (STY) of methanol at 320 °C and 440 °C was 15.2 and 145 gMeOH kgcat−1 h−1 respectively. Fresh CeO2 was prepared and calcined at different temperatures, the textural properties were determined and their influence on the product distribution at iso-conversion and constant bed surface area was investigated. No obvious differences to the glycerol conversion or product selectivity were noted. Hence, we conclude that the surface area of the CeO2 does not appear to influence the reaction selectivity to methanol and other products formed from the conversion of glycerol.

1. Introduction

The increased availability of glycerol; a by-product of first generation biodiesel production, has provided researchers with an opportunity to identify new routes to important platform chemicals and fuels from glycerol [1,2]. Production of biodiesel produces impure glycerol at approximately one tenth the mass of biodiesel [3] and consumes methanol derived from fossil fuels [4,5,6]. For this reason, it would be advantageous to develop a means of producing methanol directly from glycerol in a sustainable and economic manner.
To date, vapour phase reactions of dilute glycerol have been dominated by the solid acid catalysed production of acrolein [7,8,9,10]. The double dehydration of glycerol can produce acrolein in high yields and optimised catalysts can maintain this performance for >100 h [11]. Acrolein is a valuable intermediate for the production of acrylic acid [12], which is used in the manufacture of many plastics. Recently, Ueda and co-workers prepared an acid catalyst capable of producing acrylic acid from glycerol in one step [13].
Alternatively, hydroxyacetone [14,15], carbonates [16,17] and other polyols [17,18] can be produced from dilute glycerol, typically at reaction temperatures below 300 °C. The hydrogenolysis of glycerol to 1,2- and 1,3-propanediol in modest yields over CuO/ZnO [19], Rh based catalysts [20], Raney Ni [21,22], and Cu-based catalysts [23] under high hydrogen partial pressures have also been reported. Copper-based catalysts have been successful in achieving high hydroxyacetone yields [14,15,24]. Nimlos and co-workers [25] proposed several reaction pathways for glycerol dehydration under both neutral and protonated forms. When protonated, the barrier to acrolein formation is substantially reduced and hydroxyacetone is formed in large quantities. They concluded that the barrier to glycerol dehydration under neutral conditions is high, and can therefore only occur at relatively high temperatures. Antal et al. [26] reported formation of the decomposition products acetaldehyde and acrolein, amongst other gaseous products, formed from glycerol in supercritical water at 500 °C. Further experiments were conducted to understand the formation of the liquid products with an acid catalyst and it was concluded that dehydration via a carbonium ion was enhanced by the presence of acids. In contrast, the acid catalyst did not enhance the formation of acetaldehyde via radical based homolytic C-C cleavage, which occurs readily at high temperatures [26].
The formation of products such as 1,2-propandiol, methanol and hydroxyacetone from dilute glycerol feeds over basic catalysts has been reported by Chai et al. [27]. They concluded that over CeO2 and MgO, a high proportion of the product mixture was not identifiable and only small quantities of acrolein were observed. Furthermore, carbonaceous deposits were found to be 50 mg gcat1 over MgO at 315 °C, with 36.2 wt.% glycerol in water as the reaction solution. Velasquez et al. [24] reported the formation of methanol in very low yields (<1 %) over a La2CuO4 catalyst. The yield of the main product, hydroxyacetone was found to be very sensitive to the oxidation state of the Cu contained in the mixed metal oxide. Over La2O3 the yield of hydroxyacetone was low and the carbon mass balance was less than 50%.
We recently developed a novel method to utilise both crude and refined glycerol to produce a crude methanol mixture [28]. This reaction of glycerol with water over very simple basic or redox oxide catalysts produced methanol, and other useful chemicals, in a one-step low pressure process without the addition of hydrogen gas. We proposed that methanol formed via a radical mechanism from some of the reaction intermediates; hydroxyacetone and ethylene glycol [28]. This paper details efforts to further investigate the process conditions and study the influence of the surface area of CeO2 as redox catalysts, on their performance for glycerol conversion. Furthermore, the complex product mixture obtained over ceria and a total carbon content of a typical reaction is described in an attempt to close the carbon balance. The results presented here should then form the basis for future development work with ceria catalysts in order to achieve greater product yields to methanol, for example, through catalyst design.

2. Materials and Methods

2.1. Materials

Glycerol (≥99.5%), cerium(IV) hydroxide, cerium(III) nitrate hexahydrate (99.9% trace metals basis) were procured from Sigma-Aldrich (now Merck, Darmstadt, Germany). Ceria (CeO2) (99.9% trace metal basis) from Acros Organics (now VWR, Radnor, PA, USA) and argon gas was purchased from BOC (Guildford, UK). These materials were used with no further treatments. Deionised (DI) water was provided in-house. Silicon carbide (SiC, 98 %, Alfa Aesar, Ward Hill, MA, USA) of 40–50 mesh size was washed (DI water) and dried prior to use.

2.2. Catalyst Preparation

The precipitated ceria was prepared in the following way; a solution of cerium(III) nitrate hexahydrate was made (50 mL, deionised) and added to pre-heated deionized water under vigorous stirring (total 300 mL at 80 °C). The pH of the solution was monitored and ammonium hydroxide solution (1 M) was added dropwise until the pH reached 9. At this point, the slurry was immediately filtered and washed with warm deionised water (500 mL) and subsequently ethanol (200 mL). The recovered solid was dried (120 °C, 16 h) and calcined under static air at 400, 500, 600 or 700 °C for 5 h, after a temperature ramp of 10 °C min1 from ambient.

2.3. Catalyst Testing

Catalytic reactions were carries out using a gas-phase micro-reactor operating under continuous flow. Aqueous solutions containing glycerol (50 wt. %) were fed using an HPLC pump at flow rates of 0.016–0.048 mL min−1 into a preheater and vaporised (305 °C). The glycerol vapour passed through the reactor using a carrier gas; argon (15–45 mL min1). The reactor pipes were heated to prevent condensation of feedstock or reaction products. Catalysts were used with a uniform particle size (250–425 µm) and formed through pelleting, crushing and finally sieved. Typically, the catalyst samples (0.5 g) were diluted with silicon carbide to a uniform volume (2 mL) and placed into a stainless steel tube with an 8 mm inner diameter supported by quartz wool, above and below the bed. These conditions resulted in mass velocities and space velocities between 675–5400 L h1Ar kg1cat. and 1580–10,800 L h1Ar L1cat. respectively. A thermocouple was placed in the catalyst bed and used to control reaction temperature, typically between 320–480 °C. Reaction products (liquids) were collected using a stainless steel trap (held at ca. 0 °C). Gaseous products were collected in a gas bag that was attached at the exit line of the liquid trap.
Analysis of Liquid reaction products were performed offline using a CP 3800 gas chromatograph (GC1, Varian now Agilent Technologies, Santa Clara, CA, US; capillary column; ZB-Wax plus, 30 m × 0.53 mm × 1 µm). An external standard (cyclohexanol) was used. Gaseous, carbon based reaction products were analysed offline using a Varian 450-GC gas chromatograph (GC2; capillary column; CP-Sil5CB, 50 m × 0.32 mm × 5 µm). Non-carbon based gases; H2 and O2 were analysed using a Varian CP3380 gas chromatograph (GC3; Porapak Q column). Product selectivities (carbon mol. %) were calculated from the moles of carbon in a product recovered divided by the total moles of carbon in all products. Product yield (mol. %) was calculated from the moles of product recovered divided by the total number of moles of glycerol injected. Product list and retention times based on GC analysis is illustrated in Table S1. Additional qualitative analysis of the post reaction liquid sample was achieved with liquid chromatography-mass spectrometry (LCMS). Analysis was performed with a Bruker Amazon SL ion trap mass spectrometer, operated in a positive electrospray ion mode and paired to an Ultimate HPLC system (Thermo Fisher Scientific, Waltham, MA, USA). The HPLC (C-18 column and maintained at 40 °C) analysis used a gradient elution, consisting of 0.1% formic acid in H2O (A) and 0.1% formic acid in acetonitrile. The gradient elution was performed as reported in Table 1 on 10 μL samples of the reaction mixture.

2.4. Calculations

The glycerol conversion (CGLY) was calculated according to Equation (1) and based on the molar difference between carbon from glycerol fed into the reactor, gmi, and that detected at the outlet, gmo:
C G L Y   ( % ) = ( g m i g m o g m i )   ×   100
The product selectivity (Sp(x), carbon mol. %) for any product, x, was calculated from the moles of carbon recovered in x, xCm divided by the sum of moles of carbon in each product, yCm (Equation (2)):
S p ( x ) ( % ) =   ( x C m y y C m ) ×   100
The carbon balance can be obtained by comparing the moles of carbon accounted for in unreacted glycerol and in the identified products to the moles of carbon in glycerol entering the reactor:
B C ( % ) =   ( g m o + x x C m g m i ) ×   100
Functional group yield (Y, carbon mol. %) data were calculated by the sum of products containing that functional group as a function of their selectivities (SG), multiplied by conversion CGLY, multiplied by the carbon balance BC, omitting coke (Equation (3)).
Y   ( % ) = ( ( Σ   S G )   ×   C G L Y 100 )   ×   B C   ( % )  
The overall carbon balance BCtot was calculated (Equation (5)) by dividing the sum of the carbon moles of products xCm, coke xCcoke estimated from post reaction characterisation and unreacted glycerol gmo by the carbon moles of glycerol injected into the reactor gmi:
B C t o t = ( x x C m   +   x C c o k e   +   g m o g m i ) ×   100
The hydrogen balance BH was calculated (Equation (6)) by dividing the sum of the hydrogen moles of products xH, hydrogen gas (GC3) xHgas and moles of hydrogen in unreacted glycerol gHmo by the moles of hydrogen in glycerol injected into the reactor gHmi.
B H = ( x H p   +   x H g a s   +   g H m o g H m i ) ×   100
The oxygen balance BO was calculated (Equation (7)) by dividing the sum of the oxygen moles of products xO, oxygen gas (GC3) xOgas and moles of oxygen in unreacted glycerol gOmo by the moles of oxygen in glycerol injected into the reactor gOmi:
B O = ( x O   +   x O g a s   +   g O m o g O m i ) ×   100
Carbon deposition, referred to as coke on the catalyst was calculated dividing the mass loss as analysed by TGA of the used catalyst mLOST, by the carbon moles of glycerol feed over the catalyst gmi (Equation (8)):
C o k e   ( % ) = ( m L O S T g m i )   ×   100
The methanol space-time-yield STYMeOH, was calculated (Equation (9)) from the mass of methanol mMeOH, produced per h (reaction time Rt), per mass of catalyst (mcat, kg):
S T Y M E O H =   ( m M E O H   ( g ) R t   ( h )   ×   m c a t   ( k g ) )

2.5. Catalyst Characterisation

Powder X-ray diffraction (XRD) analysis of the catalysts was carried out on a PANalytical X’pert Pro powder diffractometer (Malvern Panalytical, Malvern, UK) using a Cu source operated at 40 KeV and 40 mA with a Ge (111) monochromator to select Kα1 X-rays. Patterns were analysed from measurements taken over the 2θ angular range 10–80° (step size of 0.016°).
Thermal gravimetric analysis (TGA) and differential thermal analysis (DTA) were carried out using a Labsys 1600 instrument (Setaram, Caluire, France). Alumina crucibles containing the samples (20–50 mg) were loaded into the instrument and heated to 900 °C (5 °C/min) under synthetic air (50 mL min−1). To exclude buoyancy effects, for specified TGA runs a blank experiment was subtracted from the relevant data.
Surface area analysis was carried out using the Brunauer Emmett Teller (BET) method with a QUADRASORBevo™ surface area and pore size analyser (Quantachrome a brand of Anton Parr, Boynton Beach, FL, USA). A forty point (20 adsorption and 20 desorption points) analysis was carried out using an adsorbate gas (N2 at −196 °C). Samples (300 mg) were degassed under vacuum for 3 h at 110 °C prior to analysis.
Raman spectroscopy was performed using an inVia microscope (Renishaw, Gloucestershire, UK) operated at a wavelength of 514 nm. 10 acquisitions were performed per sample with an exposure time of 10 s; the laser was employed at 1% power.

3. Results and Discussion

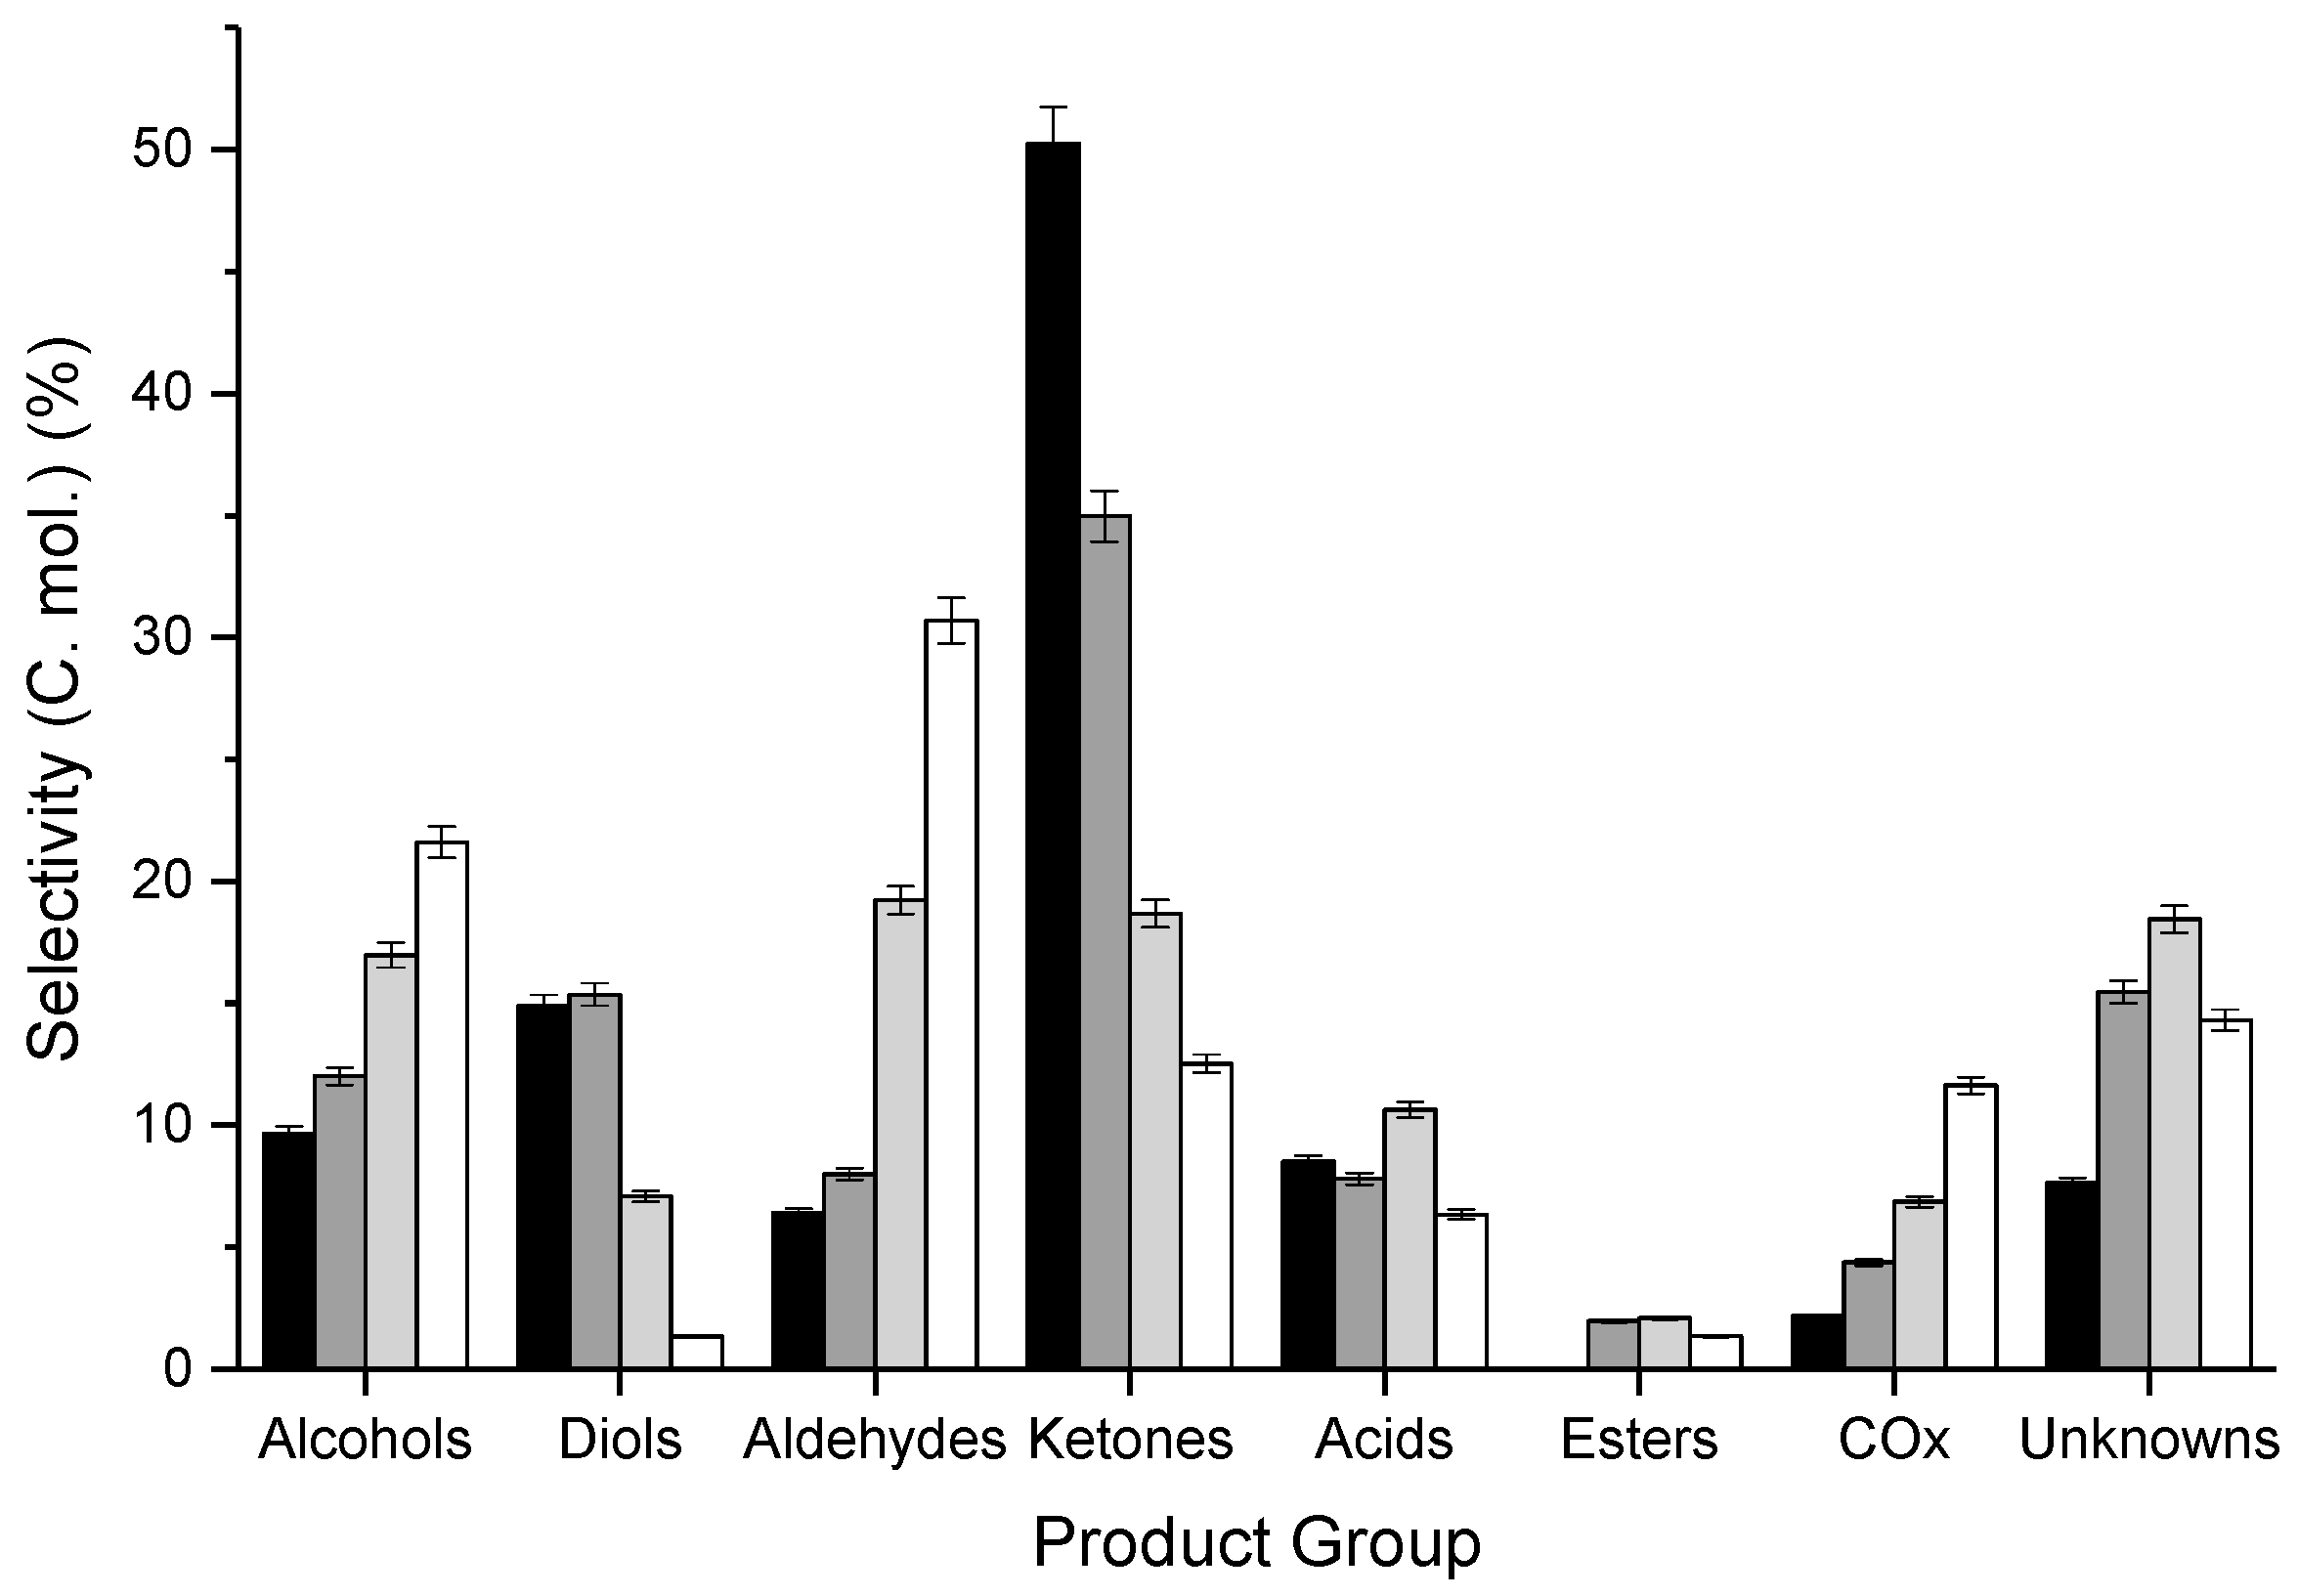
3.1. Influence of Contact Time and Reaction Temperature

To ensure consistency across batches, commercially available CeO2, obtained from Acros Organics, (8 m2 g−1) was used as a catalyst to examine the influence of contact time and reaction temperature on the conversion of glycerol. Figure 1 illustrates the effect of the contact time on the product yield per gram of the catalyst, for reactions at 320 °C with a 50 wt.% aqueous glycerol feed, over 0.5, 1.5 and 4 g of CeO2. Increasing the catalyst mass, increased the bed volume accordingly, which was determined to be 0.25, 0.65 and 1.7 mL for the reactions with 0.5, 1.5 and 4 g of CeO2 respectively. This consequentially effected the GHSV, which ranged from 10,800 to 1588 h−1. The glycerol conversion increased from 5, to 21, to 56 % with the increasing catalyst bed volume. The carbon mass balance remained high (>99 %) over the 0.5 g and 1.5 g catalyst samples. Over 4 g of catalyst, the mass balance was 92%. We consider the high carbon mass balances observed are due to the low relative glycerol conversion and the nature of the products formed, i.e., a low yield of aldehydic molecules.
Comparing the product selectivities from the experiments collected in Figure 1 is challenging, given that the glycerol conversions observed are notably different. These reactions do however, offer a means to understand the broad influence of catalyst contact time. The full product distributions for these experiments are complex and the full range of products are displayed in the supplementary information (Table S2). Over 1.5 g of ceria, the main products observed were hydroxyacetone, 1,2-propanediol and methanol with carbon mole selectivities of 45.4%, 6.0% and 6.0% respectively. Here we classify hydroxyacetone as a ketone despite its dual functionality, according to the most oxidised group taking precedent. Previously [28,29], we reported that a number of the products, including; methanol, acetaldehyde and 2,3-butanedione, originate from secondary reactions, which we proposed were formed from hydroxyacetone. As such, it would be rational to consider that as the contact time increases, the abundance of these products should also increase. However, in general the product yields per gram of catalyst remained similar.
Over 1.5 g and 4 g of ceria, the yield per gram of hydroxyacetone was slightly reduced and an increase in the yield of an ester was also observed, along with a modest decrease in the yield of carboxylic acids. This result suggests that the catalyst surface, may promote the conversion of acids to esters. Interestingly, when the product yields are normalised to account for changes in the catalyst mass, the observed loss of acid products does not appear to account for the significant increase in esters and other unidentified products that could now be present (Figure 1). However, we consider that the modest reduction of hydroxyacetone selectivity in combination with the loss of acids could account for the generation of esters. Chen et al. [30] reported the possibility of the esterification of a primary alcohol with a carboxylic acid, which suggests that hydroxyacetone reacted with acetic acid for example. Consequently, the increase in the yield of 2-oxopropyl acetate (Scheme 1), can be related to the increased contact time over high mass catalyst beds, where products can react further.
The methanol STYs calculated from the experiments conducted over 0.5 and 1.5 g of ceria is comparable; 15.8 and 15.2 gMeOH kgcat−1 h−1 respectively. However, over 4 g of ceria this reduces to 11.6 gMeOH kgcat−1 h−1, which we attribute to the increased contact time and an increased potential for product re-adsorption and subsequent reaction, demonstrated by the increased quantity of unknowns produced. In contrast, the space-time-yield of hydroxyacetone was comparable over 1.5 and 4 g of ceria, and calculated to be 84.2 and 85.5 ghydroxyacetone kg−1 and h−1 respectively, compared with 63.3 ghydroxyacetone kg−1 h−1 over 0.5 g of ceria.
A reaction temperature of 320 °C, does not appear to be high enough to significantly promote secondary reactions involving hydroxyl containing intermediates, such as hydroxyacetone, ethylene glycol or 1,2-propanediol, which can undergo sequential reactions that lead to the formation of methanol. As we noted previously [28], the STY of methanol is highly dependent on the reaction temperature, which we previously postulated to be due to the conversion of intermediate products such as hydroxyacetone. Table 2 contains the product yields, and Figure 2 the product selectivities collated into major functional groups, as a function of the reaction temperature. The individual product selectivities from these reactions are given in Table S3. At lower reaction temperatures; below 400 °C, the formation of hydroxyacetone, 1,2-propanediol and ethylene glycol predominate. At reaction temperatures above 400 °C, the yield of ketones decreases from 18.3 to 12.5%, and the production of alcohols and aldehydes increases from 16.6 to 21.6% and 18.8 to 30.7% respectively. The yield of COx also increases to 11.6 % and the carbon mass balance decreases to 77% as the reaction temperature is increased.
Very little hydroxyacetone was observed for the reactions conducted at temperatures above 400 °C. However, increases in the quantity of acetone and 2,3-butanedione were observed as the reaction temperature was raised. These products are also considered to originate from hydroxyacetone, which correlates with the substantial increase in the quantity of both acetaldehyde and methanol [28]. Methanol accounts for the vast majority of the total alcohol products and is considered to be relatively stable at the higher reaction temperatures used (Table S4). The quantity of diols; 1,2-propanediol, ethyl glycol and 1,3-propanediol, also reduced in a similar fashion to hydroxyacetone (<1% selectivity) over the catalyst at 440 °C. The STY of methanol increases when the reaction temperature is increased; from 15.8 to 59.8 to 100.2 to 145.7 gMeOH kgcat−1 h−1 at 320, 360, 400 and 440 °C respectively. The differences in the product distributions at lower and high reaction temperatures strongly suggest that many of the C2+ oxygenates, predominantly formed at low temperatures, are likely to be reaction intermediates. More specifically, it appears that C2 and C3 molecules containing one or more hydroxyl groups can undergo both C-O and C-C dissociation at higher temperatures.
The decrease of the carbon mass balance from 100 to 77 % as the reaction temperature increases, coincides with an increase in the quantity of aldehydes observed. The stability of aldehydes over ceria has been studied on polycrystalline materials [31] and thin films with a (111) surface [32,33]. These studies indicated that the ceria surface can dramatically influence the acetaldehyde reactivity. Idriss et al. [31] reported that acetaldehyde can undergo many reactions on the surface of ceria, which can result in the desorption of products such as CO2, CH4 and C4 olefins at similar temperatures to those used in the present study (400 °C). Acetaldehyde has been reported to chemisorb weakly on oxidised ceria, however, it was found to bind strongly as a carbanion to reduced ceria [32]. This carbanion species will likely partake in sequential reactions to form other products or be retained on the surface as coke, and hence, lower the carbon mass balance. Surface-bound organic molecules or coke, only contribute to approximately 2% of the overall carbon mass balance, which was determined from TGA of the post-reaction samples.

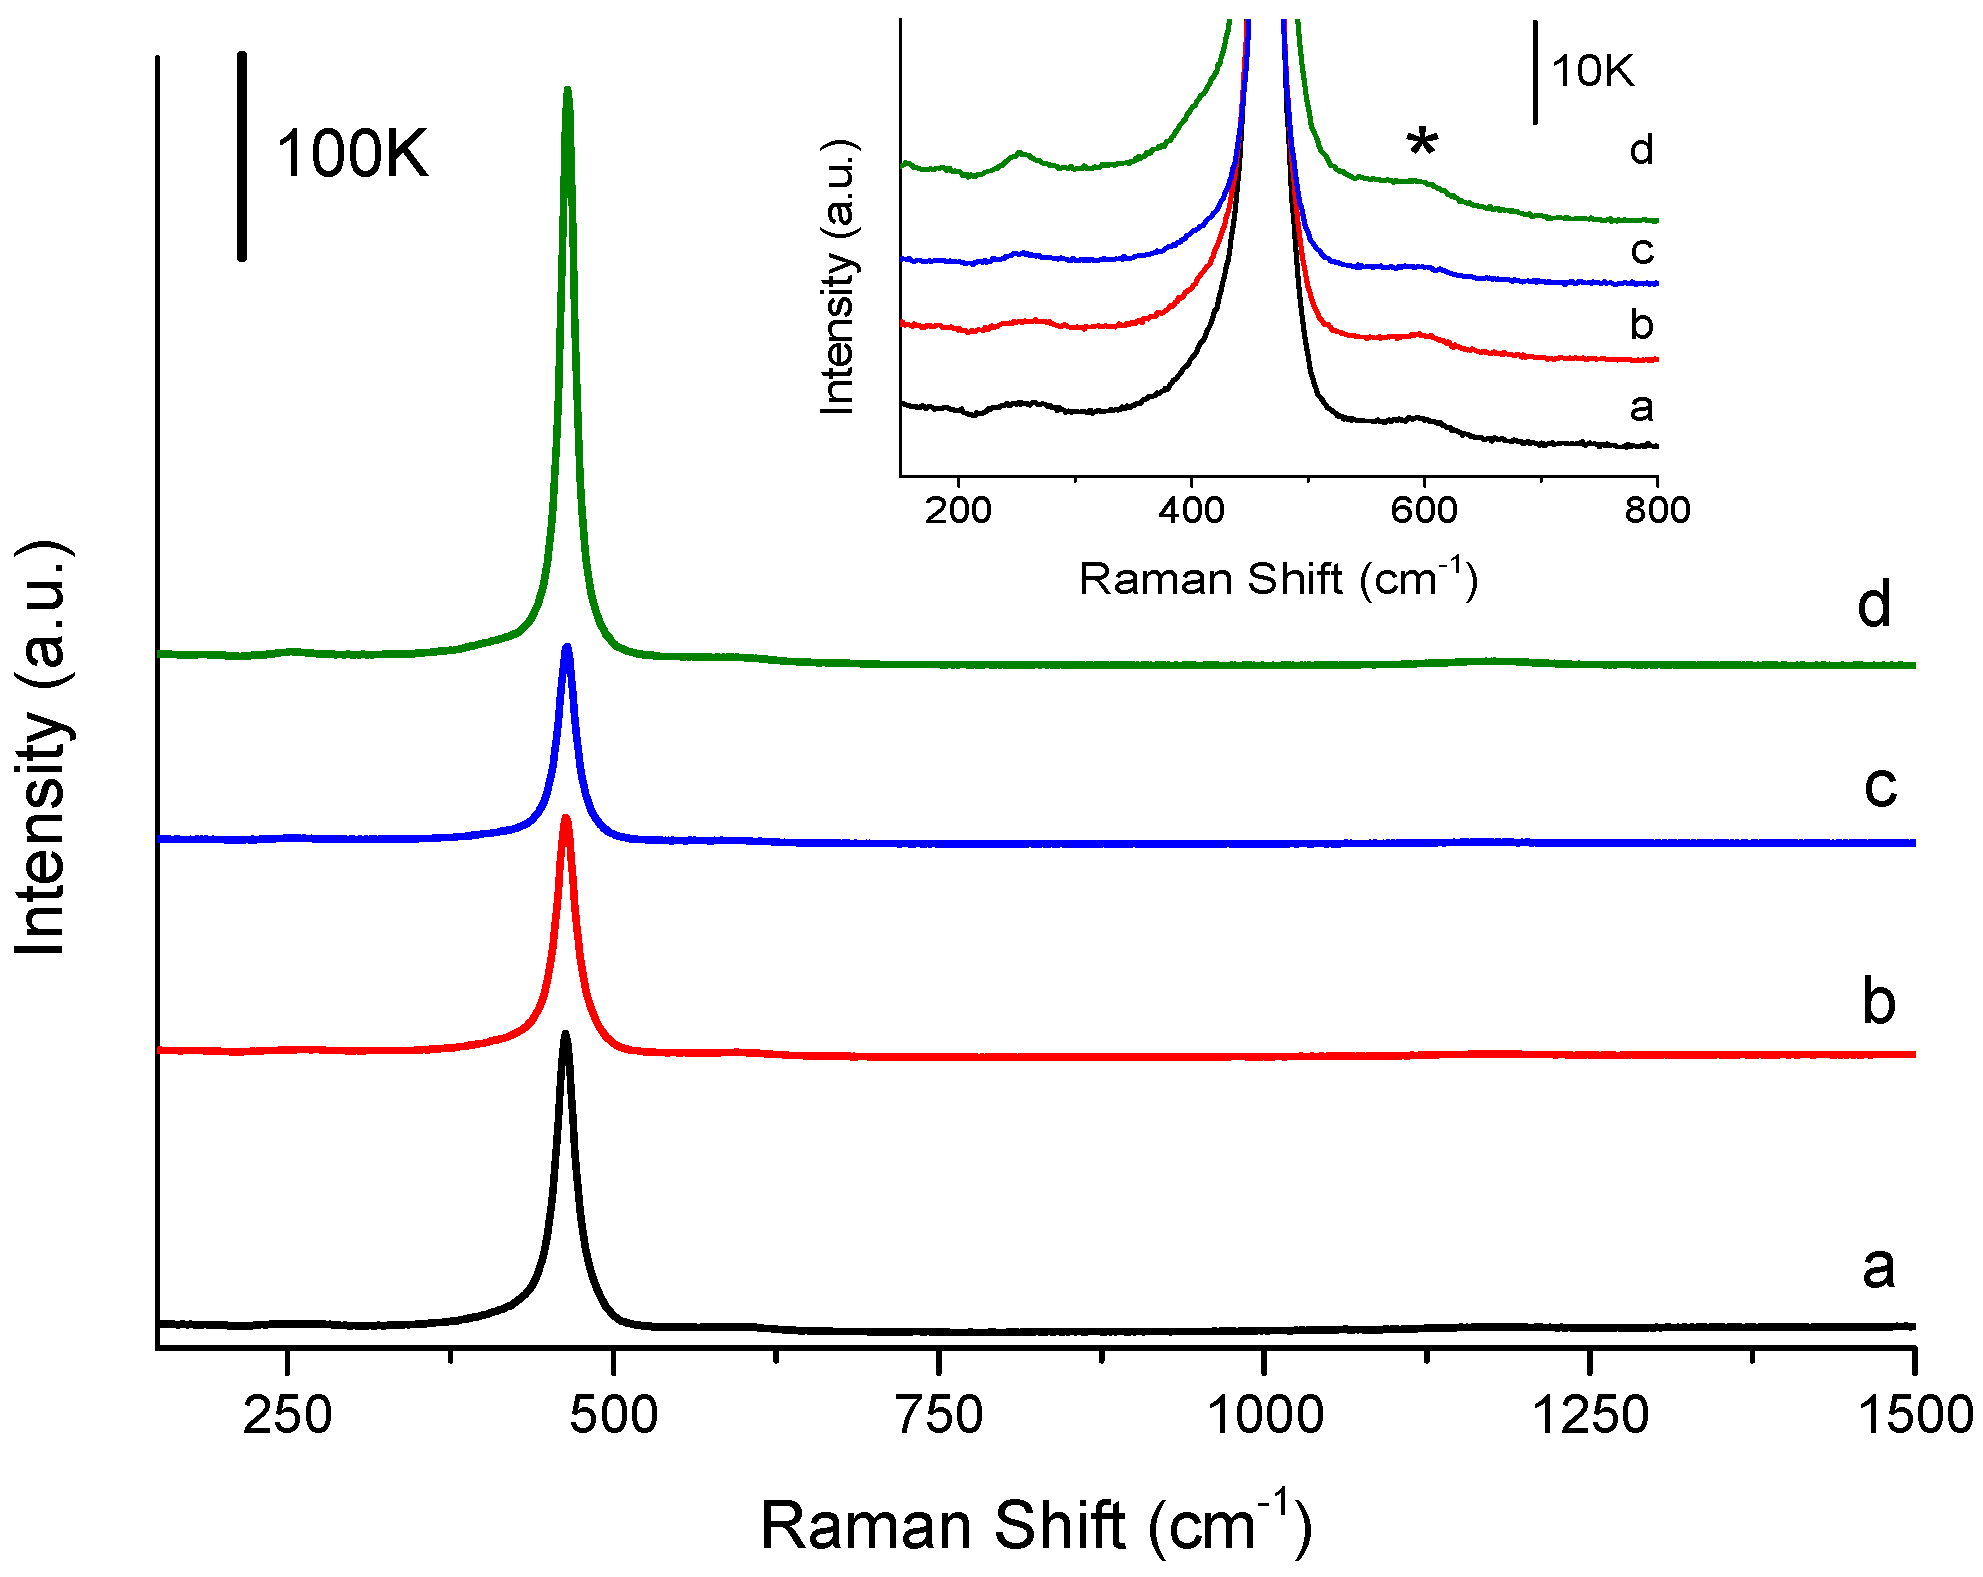
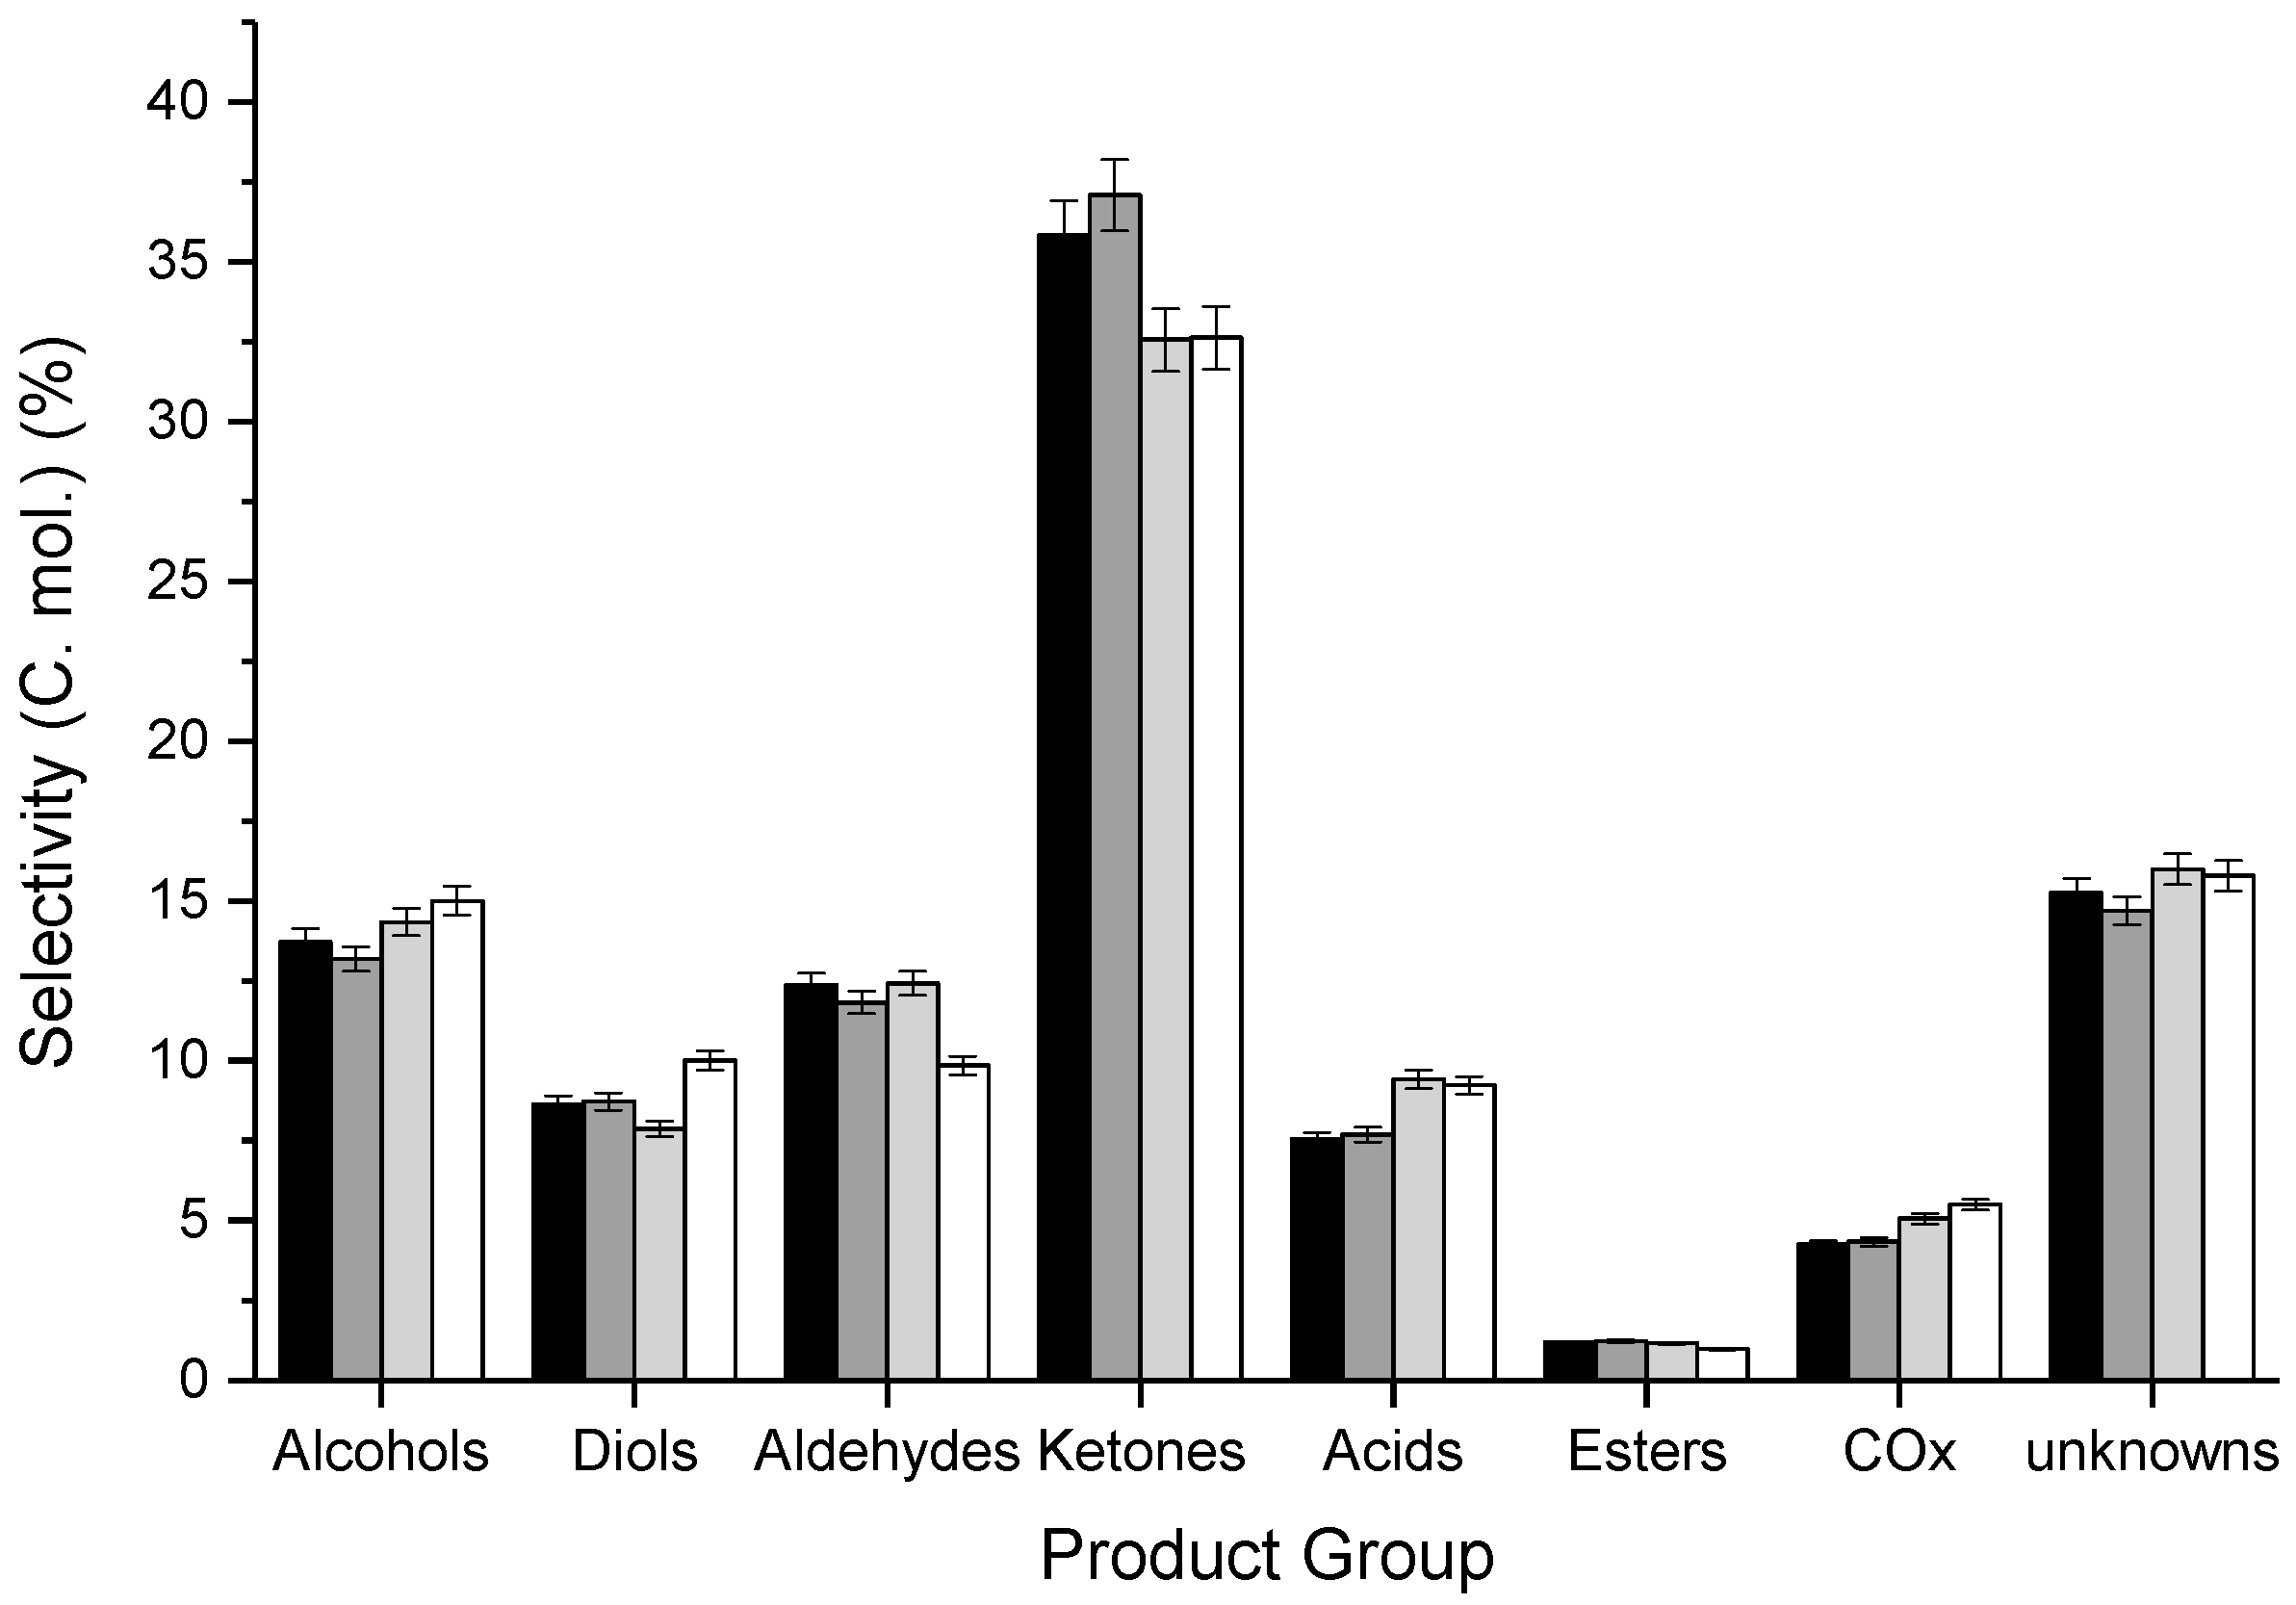
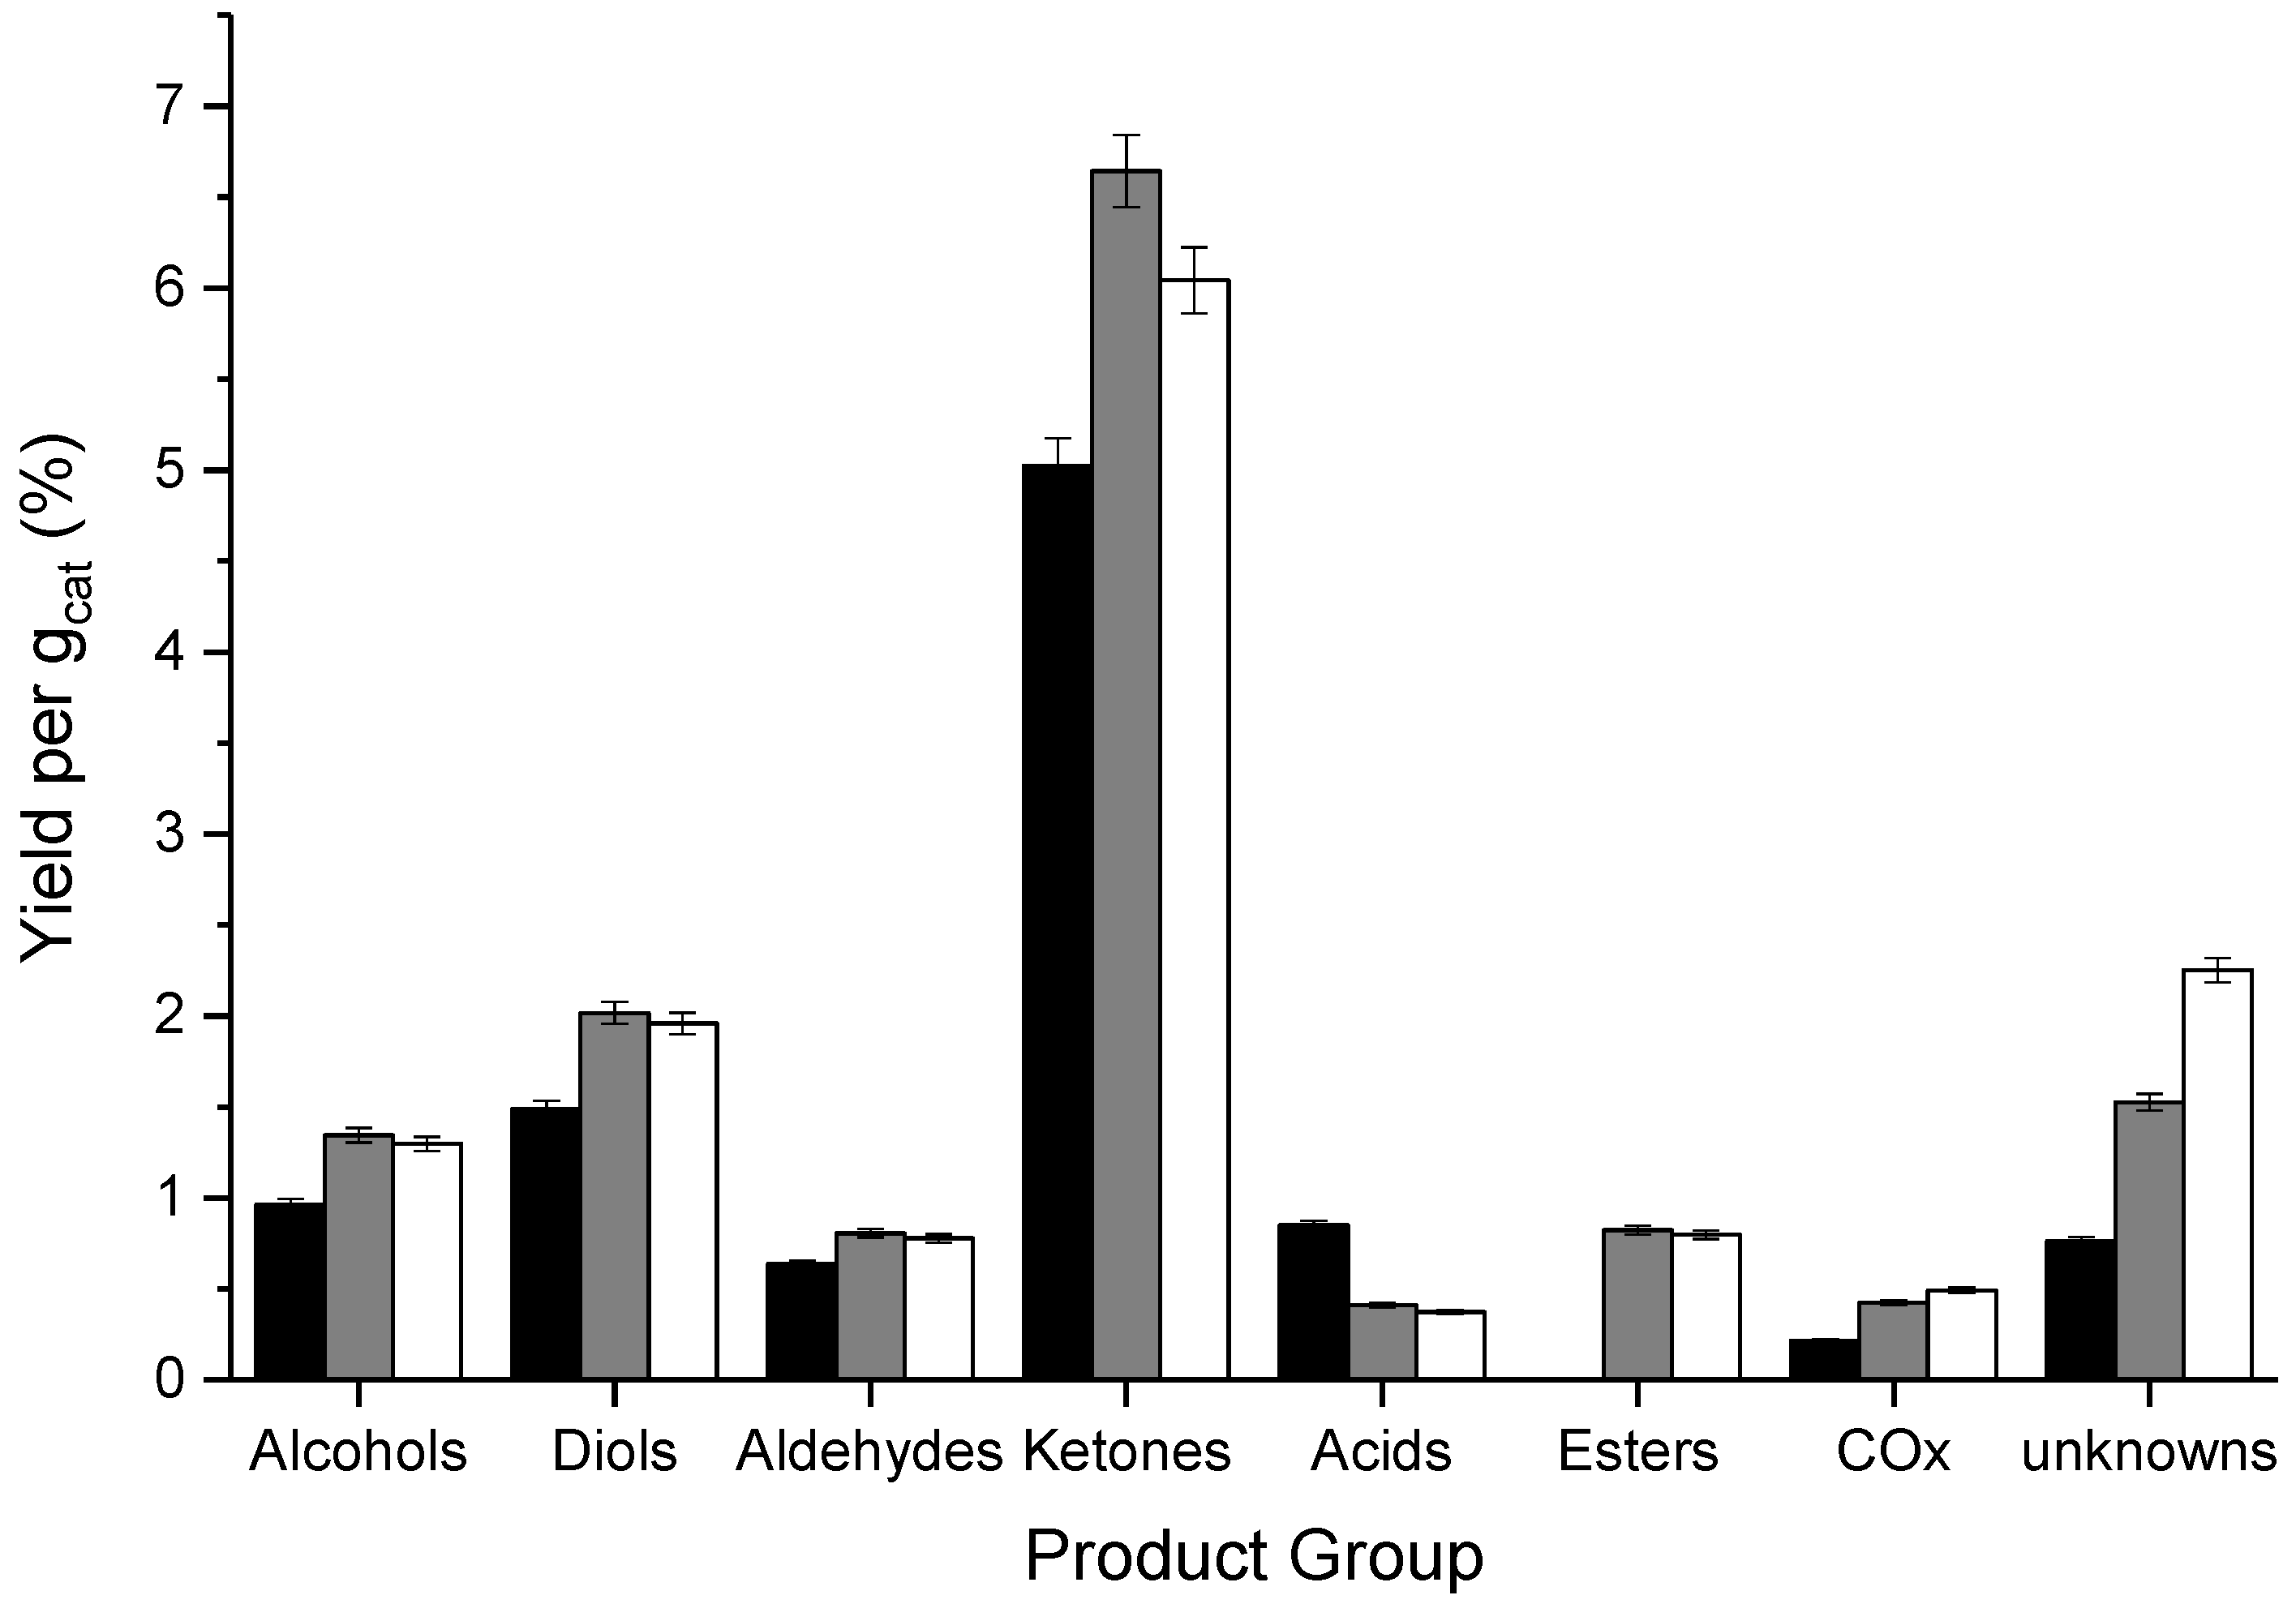
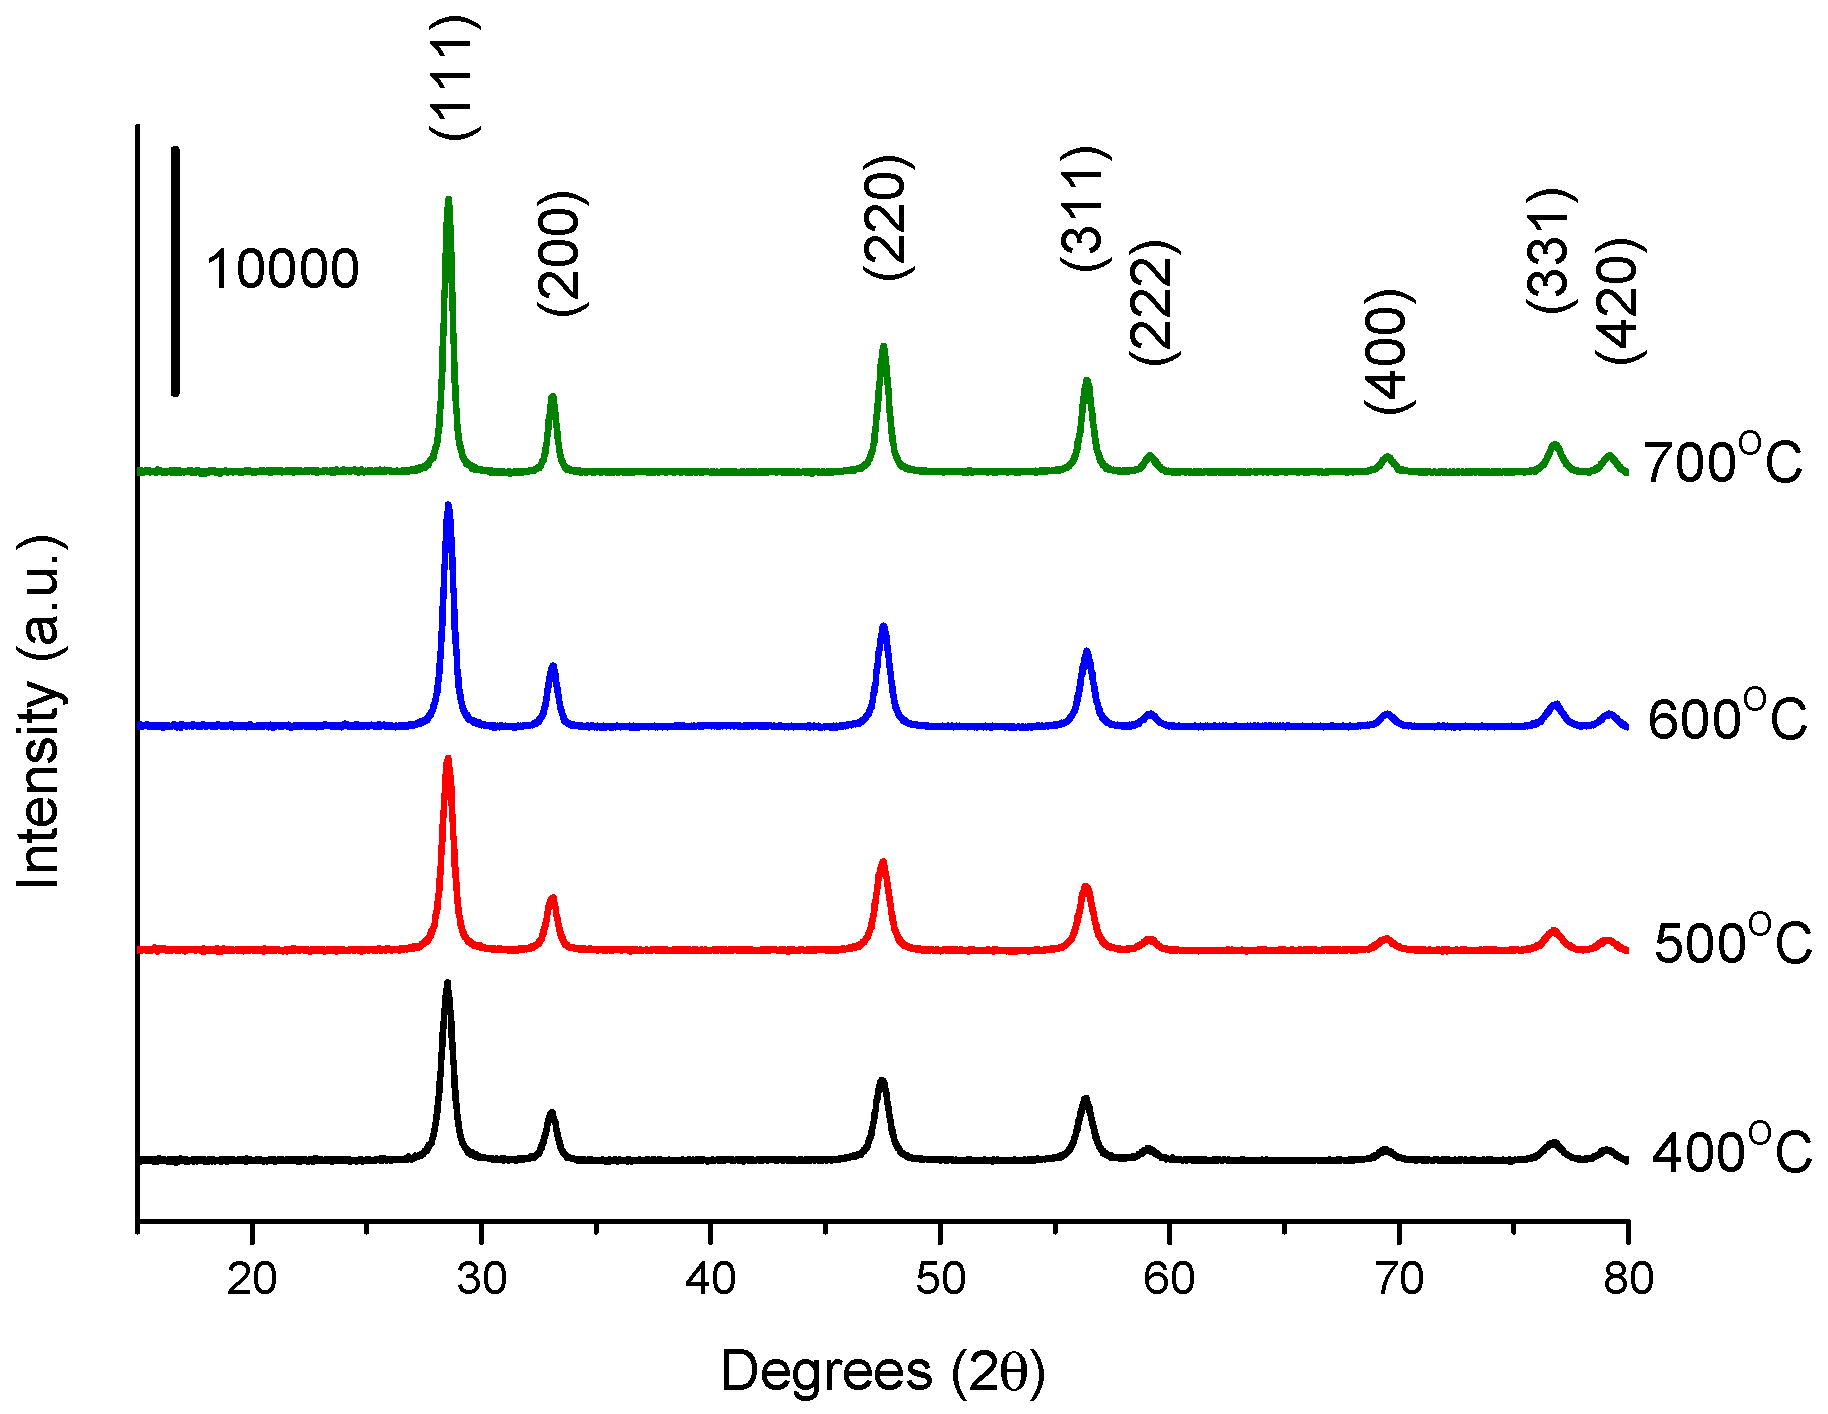
3.2. Influence of Catalyst Calcination Temperature

Low surface area ceria has been shown to be an effective catalyst for the conversion of glycerol to methanol, but typically requires a high reaction temperature (>400 °C). However, at these temperatures the selectivity to methanol is compromised by an increased production of aldehydic molecules such as acetaldehyde (Table S3). Modifications to the ceria surface area may allow for a greater methanol selectivity at lower reaction temperatures. For this reason, the influence of ceria calcination temperature on product selectivity was investigated, and the influence of the surface area and crystallite size with respect to the catalytic activity and methanol STY was established. A cerium hydroxide catalyst precursor was prepared from Ce(NO3)3∙9(H2O) by precipitation with NH4OH. The precursor was calcined at 400, 500, 600 and 700 °C and characterised by powder XRD, Raman spectroscopy and N2 adsorption; to determine the crystallite size, defect density and BET surface area respectively. These materials were subsequently tested at 340 °C with a 50 wt.% aqueous glycerol feed.
The powder XRD patterns of the CeO2 materials calcined at different temperatures are displayed in Figure 3. All the reflections can be indexed to a cubic fluorite structure (JCPDS no. 34-0394) and are characteristic of an Fm-3m space group. The intensity of diffraction peaks increase and the peak widths decrease with increasing calcination temperature, and consequently the crystallite size increases (Table 3). The crystallite size was calculated with the Scherrer equation, however, we take the values as a guide due to the cubic nature of the CeO2 particles within this polycrystalline material. Mamontov et al. also observed an increase in crystallite size according to an increasing calcination temperature, and determined that this change was permanent upon cooling [34]. Concurrent with this increase of crystallite size is an expected loss of surface area. The ceria calcined at 400 °C exhibited a surface area of 38 m2 g−1 which decreases to 22 m2 g−1 when calcined at 700 °C (Table 3). Additionally, the defect density generally decreases according to the increasing calcination temperature (Table 3). The defect density was calculated from Raman spectroscopy by considering the ratio of the peak areas at ca. 465 cm−1 (F2g) and the mode at ca. 590 cm−1, which indicates the presence of intrinsic oxygen vacancies giving rise to a Ce3+ defect mode [35,36]. The F2g mode represents the symmetrical stretching of the oxygen atoms about Ce4+. The ratio of the Raman lines can be used to estimate the defect density. The material calcined at 400 °C has a defect density of 0.58 %, which increases to 0.83 % when calcined at 500 °C. At higher calcination temperatures, this decreases significantly to 0.05 % after calcination at 700 °C, and can be attributed to the increase in the crystallinity of the structure. The intensity of the F2g mode initially decreases with increasing calcination temperature, however, when calcined at 700 °C the intensity significantly increases due to the restructured crystallites. The defect density has been strongly linked to redox catalytic activity of ceria through its oxygen storage capacity [35,37,38]. All the ceria materials in this study, typically possess low quantities of defects (Table 3) compared to CeO2 materials doped with rare-earth metals such as Pr3+ or Sm3+ [39].
The corresponding glycerol conversions and product yields for ceria catalysts calcined at varying temperature are displayed in Table 4. These reactions were carried out using differing catalyst masses to maintain a consistent catalyst bed surface area. Furthermore, the argon gas flows was adjusted such that the GHSV in each of the experiments was comparable; approximately 3450 h−1 based on a uniform catalyst bed volume. The glycerol partial pressure changed from 47 to 29 Pa over the catalysts in Table 4, and represents ca. 0.05 % of the total system pressure. The glycerol conversion was ca. 83% over each of the CeO2 catalysts tested (Table 4). Therefore, if any changes in the product selectivity (Figure 5) are observed, this can be assigned to surface features of the different CeO2 catalysts. We reported previously on the influence of the SiC diluent and we consider that the minor changes to the mass of SiC in this set of experiments will not significantly impact the product distribution [29]. The collective product yields produced in these experiments are listed in Table 4 and are comparable for each of the catalysts tested.
The carbon mole selectivity to hydroxyacetone over each of the catalysts calcined at 400–700 °C was 32.1, 33.0, 28.8 and 29.1% respectively, with a standard deviation of 1.8% (Table S5). The deviation of other major products such as acetaldehyde, methanol and ethylene glycol was also minimal, and calculated to be <1%. Therefore, we consider the reaction selectivities reported in Figure 5 and Table S5 to be comparable. The carbon mass balance across the samples tested was similar (ca. 82%), and for all catalysts the degree of fouling by carbon deposition was low (ca. 20 mgCoke g−1). This result implies that the surface area differences, crystallite size and defect density do not appear to direct the product selectivities at iso-conversion. This observation suggests that the surface crystallite facets may have more influence on product selectivity and work is underway to investigate this.
Carbon deposition on the catalyst during the reactions was determined to be insignificant (<3%), even when reactions were conducted at high temperatures. Total organic carbon analysis was performed on the post-reaction effluent and was determined to be 95% over the CeO2 catalyst calcined at 600 °C. As such, we conclude that the remaining 5% of the missing carbon is attributed to reactor fouling. The carbon mass balance based on liquid and gas phase products, as quantified by GC1 and 2, along with any catalytic carbon deposition, was 85%, with 79% comprised of liquid phase products (Table S6). The inference is that chemical species are present which cannot be analysed by GC totalling ca. 10% of the carbon moles injected into the reactor. Consequently, LC-MS analysis was utilised to qualitatively monitor the presence of species with high molecular weights. Fragments were analysed between 100 and 1000 m/z. The reaction performed at 340 °C, over 0.7 g of ceria calcined at 600 °C, was analysed by LC-MS (Figure S2). A blank sample (D.I. water) was also analysed to exclude any column bleed, which may be observed at the end of the trace. The corresponding chromatogram was very complex, with numerous peaks detected, making product identification very challenging. However, whilst specific products cannot be identified, the use of LC-MS confirms the presence of high molecular weight fragments, which may form through base-catalysed condensation reactions, indicating the presence of undesirable side products. Therefore, we attribute the difference between the TOC observed post reaction (95%) and the corresponding carbon mass balance (85%) to a proportion of heavy products produced during the reaction, which are not visible by GC.

4. Conclusions

The conversion of glycerol over ceria catalysts is a complex process, consisting of numerous reaction routes which can result in a wide variety of products. Both the temperature and catalyst contact time heavily influence the product distribution, with higher temperatures required to achieve higher space-time-yields of methanol. Increasing reaction temperatures resulted in a reduction in hydroxyacetone, potentially via its participation in sequential catalytic reactions; leading to increased quantities of acetaldehyde, COx, coke and other undetectable products. A subsequent investigation was conducted in order to establish the relationship between some physicochemical properties of CeO2 and product distribution. In order to test these materials at comparable GHSVs, the quantity of catalyst used in these experiments was normalised to account for their variations in surface area. There appears to be no clear relationship between the quantity of CeO2 defect sites and the reactivity of glycerol and its intermediates. As such, we propose that the reactivity of glycerol and its intermediates in this reaction are predominantly driven by the morphology of the catalyst, which will provide a foundation for future work in this area.

Supplementary Materials

The following are available online at https://www.mdpi.com/1996-1073/12/7/1359/s1, Figure S1: Nitrogen adsorption and desorption isotherms for ceria calcined at 400, 500, 600 and 700 °C, Figure S2: LC-MS chromatogram corresponding to the post reaction solution of a reaction run over CeO2 for 6 h. Table S1: Liquid and gas product list, Table S2: Influence of contact time on dilute glycerol reaction, Table S3: Influence of reaction temperature on dilute glycerol reaction, Table S4. Methanol stability over commercial CeO2 at 400°C, Table S5: Influence of CeO2 calcination temperature on dilute glycerol reaction with GHSV ca. 3450 h−1, Table S6: The total carbon content (%) observed in a reaction over CeO2 for 6 h at GHSV ca. 3600 h−1.

Author Contributions

Conceptualization, N.F.D., S.H.T. and G.J.H.; Data curation, P.J.S. and L.S.; Investigation, D.W.K.; Methodology, N.F.D., M.H. and S.H.T.; Supervision, D.J.W., S.H.T. and G.J.H.; Writing—original draft, N.F.D. and S.H.T.; Writing—review & editing, M.D., D.J.W., D.W.K. and G.J.H.

Funding

This research was funded by EPSRC, grant number EP/P033695/1 and EP/L027240/1.

Acknowledgments

The authors would also like to thank Exeter Analytical UK Ltd. for the Total Organic Content analysis. We would also like to acknowledge Thomas Williams for his assistance with the operation of and processing of the LC-MS data. Information on the data underpinning the results presented here can found in the Cardiff University data catalogue at http://doi.org/10.17035/d.2019.0067888810.

Conflicts of Interest

The authors declare no conflict of interest.

References

  1. Gu, Y.; Jerome, F. Glycerol as a sustainable solvent for green chemistry. Green Chem. 2010, 12, 1127–1138. [Google Scholar] [CrossRef]
  2. Sun, D.; Yamada, Y.; Sato, S.; Ueda, W. Glycerol as a potential renewable raw material for acrylic acid production. Green Chem. 2017, 19, 3186–3213. [Google Scholar] [CrossRef]
  3. Otera, J. Transesterification. Chem. Rev. 1993, 93, 1449–1470. [Google Scholar] [CrossRef]
  4. Twigg, M.V.; Spencer, M.S. Deactivation of supported copper metal catalysts for hydrogenation reactions. Appl. Catal. A 2001, 212, 161–174. [Google Scholar] [CrossRef]
  5. Wainwright, M.S. Catalytic processes for methanol synthesis—Established and future. Stud. Surf. Sci. Catal. 1988, 36, 95–108. [Google Scholar]
  6. Thompson, J.C.; He, B.B. Characterization of crude glycerol from biodiesel production from multiple feedstocks. Appl. Eng. Agric. 2006, 22, 261. [Google Scholar] [CrossRef]
  7. Katryniok, B.; Paul, S.; Capron, M.; Dumeignil, F. Towards the Sustainable Production of Acrolein by Glycerol Dehydration. ChemSusChem 2009, 2, 719–730. [Google Scholar] [CrossRef] [PubMed]
  8. Chai, S.-H.; Wang, H.-P.; Liang, Y.; Xu, B.-Q. Sustainable production of acrolein: Gas-phase dehydration of glycerol over 12-tungstophosphoric acid supported on ZrO2 and SiO2. Green Chem. 2008, 10, 1087–1093. [Google Scholar] [CrossRef]
  9. Wang, F.; Dubois, J.-L.; Ueda, W. Catalytic dehydration of glycerol over vanadium phosphate oxides in the presence of molecular oxygen. J. Catal. 2009, 268, 260–267. [Google Scholar] [CrossRef]
  10. Ott, L.; Bicker, M.; Vogel, H. Catalytic dehydration of glycerol in sub- and supercritical water: A new chemical process for acrolein production. Green Chem. 2006, 8, 214–220. [Google Scholar] [CrossRef]
  11. Haider, M.H.; Dummer, N.F.; Zhang, D.; Miedziak, P.; Davies, T.E.; Taylor, S.H.; Willock, D.J.; Knight, D.W.; Chadwick, D.; Hutchings, G.J. Rubidium- and caesium-doped silicotungstic acid catalysts supported on alumina for the catalytic dehydration of glycerol to acrolein. J. Catal. 2012, 286, 206–213. [Google Scholar] [CrossRef]
  12. Magatani, Y.; Okumura, K.; Dubois, J.-L.; Devaux, J.-F. Catalyst and process for preparing acrolein and/or acrylic acid by dehydration reaction of glycerin. Patent WO2011033689A1, 24 March 2011. [Google Scholar]
  13. Omata, K.; Matsumoto, K.; Murayama, T.; Ueda, W. Direct oxidative transformation of glycerol to acrylic acid over Nb-based complex metal oxide catalysts. Catal. Today 2016, 259, 205–212. [Google Scholar] [CrossRef]
  14. Sato, S.; Akiyama, M.; Takahashi, R.; Hara, T.; Inui, K.; Yokota, M. Vapor-phase reaction of polyols over copper catalysts. Appl. Catal. A Gen. 2008, 347, 186–191. [Google Scholar] [CrossRef]
  15. Chiu, C.-W.; Dasari, M.A.; Suppes, G.J.; Sutterlin, W.R. Dehydration of glycerol to acetol via catalytic reactive distillation. AICHE J. 2006, 52, 3543–3548. [Google Scholar] [CrossRef]
  16. Sonnati, M.O.; Amigoni, S.; Taffin de Givenchy, E.P.; Darmanin, T.; Choulet, O.; Guittard, F. Glycerol carbonate as a versatile building block for tomorrow: Synthesis, reactivity, properties and applications. Green Chem. 2013, 15, 283–306. [Google Scholar] [CrossRef]
  17. Behr, A.; Eilting, J.; Irawadi, K.; Leschinski, J.; Lindner, F. Improved utilisation of renewable resources: New important derivatives of glycerol. Green Chem. 2008, 10, 13–30. [Google Scholar] [CrossRef]
  18. Tomishige, K.; Nakagawa, Y.; Tamura, M. Selective hydrogenolysis and hydrogenation using metal catalysts directly modified with metal oxide species. Green Chem. 2017, 19, 2876–2924. [Google Scholar] [CrossRef]
  19. Bienholz, A.; Schwab, F.; Claus, P. Hydrogenolysis of glycerol over a highly active CuO/ZnO catalyst prepared by an oxalate gel method: Influence of solvent and reaction temperature on catalyst deactivation. Green Chem. 2010, 12, 290–295. [Google Scholar] [CrossRef]
  20. Furikado, I.; Miyazawa, T.; Koso, S.; Shimao, A.; Kunimori, K.; Tomishige, K. Catalytic performance of Rh/SiO2 in glycerol reaction under hydrogen. Green Chem. 2007, 9, 582–588. [Google Scholar] [CrossRef]
  21. Yin, A.-Y.; Guo, X.-Y.; Dai, W.-L.; Fan, K.-N. The synthesis of propylene glycol and ethylene glycol from glycerol using Raney Ni as a versatile catalyst. Green Chem. 2009, 11, 1514–1516. [Google Scholar] [CrossRef]
  22. Maglinao, R.L.; He, B.B. Catalytic Thermochemical Conversion of Glycerol to Simple and Polyhydric Alcohols Using Raney Nickel Catalyst. Ind. Eng. Chem. Res. 2011, 50, 6028–6033. [Google Scholar] [CrossRef]
  23. Dasari, M.A.; Kiatsimkul, P.-P.; Sutterlin, W.R.; Suppes, G.J. Low-pressure hydrogenolysis of glycerol to propylene glycol. Appl. Catal. A Gen. 2005, 281, 225–231. [Google Scholar] [CrossRef]
  24. Velasquez, M.; Santamaria, A.; Batiot-Dupeyrat, C. Selective conversion of glycerol to hydroxyacetone in gas phase over La2CuO4 catalyst. Appl. Catal. B Environ. 2014, 160–161, 606–613. [Google Scholar] [CrossRef]
  25. Nimlos, M.R.; Blanksby, S.J.; Qian, X.; Himmel, M.E.; Johnson, D.K. Mechanisms of Glycerol Dehydration. J. Phys. Chem. A 2006, 110, 6145–6156. [Google Scholar] [CrossRef] [PubMed]
  26. Antal, M.J.; Mok, W.S.L.; Roy, J.C.; Raissi, A.T.; Anderson, D.G.M. Pyrolytic sources of hydrocarbons from biomass. J. Anal. Appl. Pyrolysis 1985, 8, 291–303. [Google Scholar] [CrossRef]
  27. Chai, S.-H.; Wang, H.-P.; Liang, Y.; Xu, B.-Q. Sustainable production of acrolein: Investigation of solid acid-base catalysts for gas-phase dehydration of glycerol. Green Chem. 2007, 9, 1130–1136. [Google Scholar] [CrossRef]
  28. Haider, M.H.; Dummer, N.F.; Knight, D.W.; Jenkins, R.L.; Howard, M.; Moulijn, J.; Taylor, S.H.; Hutchings, G.J. Efficient green methanol synthesis from glycerol. Nat. Chem. 2015, 7, 1028–1032. [Google Scholar] [CrossRef] [PubMed] [Green Version]
  29. Smith, L.R.; Smith, P.J.; Mugford, K.S.; Douthwaite, M.; Dummer, N.F.; Willock, D.J.; Howard, M.; Knight, D.W.; Taylor, S.H.; Hutchings, G.J. New insights for the valorisation of glycerol over MgO catalysts in the gas-phase. Catal. Sci. Technol. 2019, 9, 1464–1475. [Google Scholar] [CrossRef]
  30. Chen, J.; Cai, Q.; Lu, L.; Leng, F.; Wang, S. Upgrading of the Acid-Rich Fraction of Bio-oil by Catalytic Hydrogenation-Esterification. ACS Sustain. Chem. Eng. 2017, 5, 1073–1081. [Google Scholar] [CrossRef]
  31. Idriss, H.; Diagne, C.; Hindermann, J.P.; Kiennemann, A.; Barteau, M.A. Reactions of Acetaldehyde on CeO2 and CeO2-Supported Catalysts. J. Catal. 1995, 155, 219–237. [Google Scholar] [CrossRef]
  32. Chen, T.L.; Mullins, D.R. Adsorption and Reaction of Acetaldehyde over CeOX(111) Thin Films. J. Phys. Chem. C 2011, 115, 3385–3392. [Google Scholar] [CrossRef]
  33. Calaza, F.C.; Xu, Y.; Mullins, D.R.; Overbury, S.H. Oxygen Vacancy-Assisted Coupling and Enolization of Acetaldehyde on CeO2(111). J. Am. Chem. Soc. 2012, 134, 18034–18045. [Google Scholar] [CrossRef] [PubMed]
  34. Mamontov, E.; Egami, T.; Brezny, R.; Koranne, M.; Tyagi, S. Lattice Defects and Oxygen Storage Capacity of Nanocrystalline Ceria and Ceria-Zirconia. J. Phys. Chem. B 2000, 104, 11110–11116. [Google Scholar] [CrossRef]
  35. Qiao, Z.-A.; Wu, Z.; Dai, S. Shape-Controlled Ceria-based Nanostructures for Catalysis Applications. ChemSusChem 2013, 6, 1821–1833. [Google Scholar] [CrossRef]
  36. McBride, J.R.; Hass, K.C.; Poindexter, B.D.; Weber, W.H. Raman and X-ray studies of Ce1−xRExO2−y, where RE = La, Pr, Nd, Eu, Gd, and Tb. J. Appl. Phys. 1994, 76, 2435–2441. [Google Scholar] [CrossRef]
  37. Hua, G.; Zhang, L.; Fei, G.; Fang, M. Enhanced catalytic activity induced by defects in mesoporous ceria nanotubes. J. Mater. Chem. 2012, 22, 6851–6855. [Google Scholar] [CrossRef]
  38. Nolan, M.; Parker, S.C.; Watson, G.W. Reduction of NO2 on Ceria Surfaces. J. Phys. Chem. B 2006, 110, 2256–2262. [Google Scholar] [CrossRef]
  39. Guo, M.; Lu, J.; Wu, Y.; Wang, Y.; Luo, M. UV and Visible Raman Studies of Oxygen Vacancies in Rare-Earth-Doped Ceria. Langmuir 2011, 27, 3872–3877. [Google Scholar] [CrossRef]
Figure 1. Influence of contact time on the yield of product groups per gram of catalyst over 0.5 g (black bar, conversion 5%), 1.5 g (grey bar, conversion 21%) and 4 g (white bar, conversion 56%) of ceria at 320 °C. Respective GHSV; 10800 h−1, 4154 h−1 and 1588 h−1.
Energies 12 01359 g001
Scheme 1. Condensation reaction of hydroxyacetone and acetic acid to form 2-oxopropyl acetate. Similar reactions could account for the increase in unidentifiable products at high contact times over CeO2.
Energies 12 01359 sch001
Figure 2. Influence of the reaction temperature on the product group selectivity at 320 °C (black bar), 360 °C (dark grey), 400 °C (light grey) and 440 °C (white bar). Reaction conditions; CeO2 (8 m2 g−1) 1.5 g, GHSV 4154 h−1, 50 wt.% Gly/H2O, Ar 45 mL min−1.
Energies 12 01359 g002
Figure 3. Powder XRD pattern of CeO2 calcined at different temperatures (400–700 °C); reflections match the cubic fluorite structure of ceria (Fm-3m).
Energies 12 01359 g003
Figure 4. Raman spectra of the ceria samples calcined at different temperatures with F2g mode at ca. 465 cm−1; (a) 400, (b) 500, (c) 600 and (d) 700 °C. Insert highlights the relative intensity of the defect mode (*) at ca. 590 cm−1.
Energies 12 01359 g004
Figure 5. The product group selectivity over CeO2 calcined at different temperatures where the catalyst mass and Ar flow rate has been adjusted to maintain a consistent catalyst bed surface area; 400 °C (black bar), 500 °C (dark grey), 600 °C (light grey) and 700 °C (white bar). Reaction conditions; 340 °C, 50 wt.% Gly/H2O, GHSV ca. 3450 h−1.
Energies 12 01359 g005
Table 1. The makeup of the mobile phase for the gradient elution.
Time (min)A 1 (%)B 2 (%)
0.0982
1.0982
15.0298
17.0298
18.0982
20.0982
1 A = 0.1 % formic acid in H2O and 2 B = 0.1 % formic acid in acetonitrile.
Table 2. Glycerol conversion and product distribution for reactions over CeO2 at different temperatures.
RT a/°CCGLYb/%Mol. Balance c/%Yield/% e
BCdBHBOAlc.DiolsAld.Ket.Ac.Est.COxUnk.
3202110097952.03.13.110.61.80.00.51.6
3608487787210.112.912.929.46.61.73.713.0
4009880686216.66.96.918.310.42.06.718.1
44010077625721.61.31.312.56.31.311.614.3
a Reaction temperature; b Glycerol conversion; c Carbon, hydrogen and oxygen mass balance (±3 %) of products detected in GC1 and GC2; d Carbon balance, values in parenthesis include coke from TGA measurements; e yield of products by functional group detected in GC1 and GC2; Alc., alcohols; Ald., aldehydes; Ket., ketones; Ac., acids; Est., esters; Unk., unidentified products (Full product list in Table S2). Reaction conditions; CeO2 (8 m2 g−1) 1.5 g, GHSV 4154 h−1, 50 wt.% Gly/H2O, Ar 45 mL min−1.
Table 3. Textural properties of CeO2 catalysts calcined at different temperatures.
Calcination Temperature/°CBET Surface Area a/m2 g−1Crystallite Size b/nmDefect Density c/%Defect Density per Surface Area c/×10−3 % m−2FWHM d of F2g Mode
40038140.581.517.96
50034150.832.418.03
60027160.110.416.61
70022190.050.313.35
a calculated from N2 adsorption measurements at −196 °C (adsorption/desorption isotherm Figure S1); b calculated from the Scherrer equation using the (111) reflection in Figure 3; c Calculated from Raman spectroscopy in Figure 4 by ID/IF2g where ID is the integrated area of the band at ca. 590 cm−1 and IF2g is the integrated area of the F2g band at 460 cm−1; d Full width at half maximum.
Table 4. Glycerol conversion and product yield distribution for reactions over CeO2 calcined at different temperatures (CT) at a uniform catalyst bed surface area.
CT/°CCatalyst Mass/gAr Flow Rate/mL min−1CGLYa/%Mol. Balance/% bYield d/%STYMeOHe/g1 h−1 kg−1Carbon Deposition/mgCoke g−1
BCcBHBOAlc.DiolsAld.Ket.Ac.COxEst.Unk.
4000.4998158382 (83)75677.96.08.524.75.22.90.711.384.317
5000.5497158380 (81)72667.45.97.924.95.22.90.710.780.021
6000.6995208084 (86)76708.15.38.425.26.43.40.611.759.319
7000.8508258481 (84)74677.76.96.822.46.33.80.511.551.122
a Glycerol conversion; b Carbon, hydrogen and oxygen mass balance (±3 %) of products detected in GC1 and GC2; c Carbon balance, values in parenthesis include coke from TGA measurements; d yield of products detected in GC1 and GC2; Alc., alcohols; Ald., aldehydes; Ket., ketones; Ac., acids; Est., esters; Unk., unidentified products (Full product list in Table S5); e methanol space time yield. Reaction conditions; 340 °C, 50 wt.% Gly/H2O, GHSV ca. 3450 h−1.

