Article

Ground-Source Heat Pumps with Horizontal Heat Exchangers for Space Cooling in the Hot Tropical Climate of Thailand

1
Renewable Research Center, National Institute of Advanced Industrial Science and Technology, Japan 2-2-9 Machiikedai, Koriyama-shi, Fukushima-ken 963-0298, Japan
2
Department of Geology, Faculty of Science, Chulalongkorn University 254 Phayathai Rd, Patumwan, Bangkok 10330, Thailand
3
Mining Museum, Akita University, 43 Tegatahebino, Akita-shi, Akita-ken 010-0851, Japan
4
Research Program on Controls of Hazardous Contaminants in Raw Water Resources for Water Scarcity Resilience, Center of Excellence on Hazardous Substance Management (HSM), Chulalongkorn University, Bangkok 10330, Thailand
5
Research Unit Control of Emerging Micropollutants in Environment, Chulalongkorn University, Bangkok 10330, Thailand
6
Department of Mineral Resources (DMR) King Rama VI Road, Ratchatewi 10400, Bangkok
*
Author to whom correspondence should be addressed.
Energies 2019, 12(7), 1274; https://doi.org/10.3390/en12071274
Submission received: 25 February 2019 / Revised: 22 March 2019 / Accepted: 29 March 2019 / Published: 2 April 2019

Abstract

:
The cooling of spaces in tropical regions, such as Southeast Asia, consumes a lot of energy. Additionally, rapid population and economic growth are resulting in an increasing demand for space cooling. The ground-source heat pump has been proven a reliable, cost-effective, safe, and environmentally-friendly alternative for cooling and heating spaces in various countries. In tropical countries, the presumption that the ground-source heat pump may not provide better thermal performance than the normal air-source heat pump arises because the difference between ground and atmospheric temperatures is essentially low. This paper reports the potential use of a ground-source heat pump with horizontal heat exchangers in a tropical country—Thailand. Daily operational data of two ground-source heat pumps and an air-source heat pump during a two-month operation are analyzed and compared. Life cycle cost analysis and CO2 emission estimation are adopted to evaluate the economic value of ground-source heat pump investment and potential CO2 reduction through the use of ground-source heat pumps, in comparison with the case for air-source heat pumps. It was found that the ground-source heat pumps consume 17.1% and 18.4% less electricity than the air-source heat pump during this period. Local production of heat pumps and heat exchangers, as well as rapid regional economic growth, can be positive factors for future ground-source heat pump application, not only in Thailand but also southeast Asian countries.

1. Introduction

Southeast Asian countries have experienced rapid economic growth, at an average rate of 5.2% per year since 2000. The rapid growth has been followed by an increase in the energy demand. In 2016, the total primary energy consumption in the region reached 643 million tons of oil equivalent. While Southeast Asian countries may not be considered a major global CO2 contributor, the CO2 emissions of those countries rose from 711 MT in 2000 to 1288 MT in 2015 [1,2]. The total generation of electricity in the region increased from 370 TWh in 2000 to 868 TWh in 2015. By 2015, 83.4% of electricity was generated by burning fossil fuels (i.e., coal, natural gas, and oil). Serious action must therefore be taken immediately, in order to reduce the fossil fuel dependency [3].
Thailand accounts for 21.7% of the primary energy demand in Southeast Asia [1]. By 2015, the national primary energy consumption and total electricity generation were respectively 135 million tons of oil equivalent and 178 TWh, with fossil fuel accounting for 80.7% and 91.6%, respectively. In 2017, the generation of electricity emitted 96.035 MT of CO2 [2]. Air conditioners consume much of a household’s electricity demand. According to a report published by The Japan Refrigeration and Air Conditioning Industry Association, Thailand’s domestic total air conditioner demand in 2016 was 1.56 million units, the third largest demand in southeast Asia after Indonesia and Vietnam [4]. Data published by the Ministry of Energy of Thailand suggest that the residential sector consumed 20.4% of national electricity, 46% and 17% of which were used for air conditioning and refrigeration, respectively [2]. These sectors have high potential energy savings [2,5,6]. Governments of Southeast Asian countries are aware of this problem, and are thus considering several actions that promote the higher efficiency of air conditioners in this region [7,8]. The residential energy growth in Thailand is greatly determined by the increasing number of households, as well as an increasing income per capita. The use of energy-efficient products is an important way of restraining the household energy demand. However, the market prices of energy-efficient products, such as five-star-rated energy-saving air conditioners, tend to be higher than those of regular products [9,10].
Meanwhile, it has been shown that the increase in the energy demand in Thailand accelerate climate change and the urban heat island (UHI) phenomena [11,12,13]. Arifwidodo and Chandrasiri have estimated that the annual increase of average temperature in an urban area (Bangkok) and a sub-urban area (Pathumthani) are increasing as a result of UHI. The UHI severity index has been found to be higher than those of other major cities in the world, such as Shanghai, San Diego, and San Francisco, and within a similar range as Tokyo [13]. On the other hand, other studies have found possible countermeasures of UHI in the Tokyo area by utilizing a district heating-cooling system and ground-source heat pumps (GSHPs) [14,15].
The government of Thailand begun to improve the energy efficiency of air conditioners in the 1990s, and started labeling the ratings of air conditioners by the mid-1990s. End consumers are thus supposed to be well aware of the labeling system. The efficiency of air conditioners was improved by the introduction of an inverter, although its market penetration rate and market share remain low. Meanwhile, the high demand for air conditioning units has offset efficiency improvements [6].
Among various alternative energy sources, the ground-source heat pump (GSHP), which utilizes a relatively constant ground temperature, is widely applied for the cooling and heating of spaces. Instead of exchanging heat with the outdoor environment, as in the case of a normal air-source heat pump (ASHP), the GSHP uses the ground as a heat sink (for the cooling of spaces) and a heat source (for the heating of spaces).
GSHP systems are generally classified as open-loop and closed-loop systems. Closed-loop systems can be further classified into systems having vertical and horizontal arrangements of the ground heat exchanger (GHE). The vertical closed-loop system has higher thermal efficiency, and the heat transfer rate can be further improved through the convective heat transfer of groundwater flow. Although the required site area for this system is small, the system has a high initial cost for drilling and installation of the GHE. Meanwhile, the horizontal (shallow) closed-loop system is relatively inexpensive, as it requires no vertical borehole and just shallow trenches that can be dug through manual (human) labor or mechanical means, such as the use of a mini-excavator [16,17,18]. However, this system requires a larger footprint for installation. The drilling cost of a vertical GHE in Japan is USD 6700 for a 50 m borehole, while the same borehole costs USD 3000 in Thailand. In Thailand, meanwhile, the average wage for manual (human) labor is around USD 13 per day. The horizontal system thus has a great advantage in terms of the initial cost.
In most cases, however, the thermal performance of the horizontal closed system is lower than that of the vertical closed system, as the soil temperature at a shallow depth fluctuates and is strongly affected by the ambient temperature and near-surface heat flux [18]. Thus, for a high cooling load demand, such as in the case of the central cooling of an office or public building with a GSHP, a horizontal heat exchanger may not be adequate.
The horizontal closed system is increasingly being studied. Several studies have compared shallow linear, helical, and slinky GHEs in numerical simulation, and have found that the helical configuration has the best performance [16,17,19]. They have also found that the thermal conductivity surrounding a GHE and the flowrate of the heat transfer fluids are the most important parameters. Fujii et al. performed numerical simulations of slinky GHEs installed at different depths, simplifying the GHEs as thin flat plates [20]. Their simulation results agreed well with experimental data. In subsequent work, they presented the results of a slinky GHE field test during heating (winter) and numerical simulations of double- and single-layer arrangements, and found that the double layer has a lower energy cost per unit of site area, owing to its better performance [21]. Recent studies have also remarked the importance of soil properties, moisture content, environmental parameters, and installation design to heat-pump performance [22,23,24,25,26].
Recent research on GSHPs also has focused on the hybrid system. The GSHP hybrid system incorporates another thermal system, i.e., a desiccant or solar thermal energy. The hybrid GSHP–desiccant system allows better and more effective means of controlling space humidity and air temperature [27,28,29]. By taking direct solar heat energy, the efficiency of a GSHP during heating can be significantly improved. The hybrid GSHP–solar system offers higher thermal performance for applications, such as water heating, heat storage, or drying [30,31,32,33].
Unlike the case of most GSHP applications in a four-season climate, the cooling load is predominant in a tropical climate. The application of the GSHP in a tropical climate thus uses the ground mainly as a heat sink to remove heat from a building. Furthermore, the difference between ground and air temperatures is negligible.
To the extent of our knowledge, only few studies have focused on the application of the GSHP in tropical climates. One study showed that GSHP are expected to replace underperforming air-cooled condensers in Singapore [34]. Permchart and Tanatvanit used the ground as a heat sink for direct-expansion GSHP, by directly burying the refrigerant piping exiting the compressor of the heat pump [35]. Yasukawa et al. identified regional variation in the subsurface temperature by investigating the vertical temperature variation in several observation wells around the Chao Phraya Plain in Thailand and the Red River Plain in Vietnam [36]. In several areas, they observed subsurface temperatures lower than the monthly mean air temperature, while in other areas, subsurface temperatures were higher, but still lower than the monthly maximum air temperature. Furthermore, the authors emphasized that the application of GSHPs in these areas could take advantage of advective heat transfer due to groundwater flow. Following their study, a GSHP system was installed in Kamphaengphet, Thailand [37]. The system uses a single 56 m borehole with a double U-tube GHE. Long-term performance results show that an average coefficient of performance (CoP) of 3 can be achieved. Additionally, during successive operation, the borehole temperature increased, but recovered to its initial temperature after a week, and there was no long-term increase in the subsurface temperature after more than a year of operation. Uchida et al. conducted subsurface groundwater surveys and a stable isotope evaluation on the Chao Phraya Plain [38]. Their results show differences in the subsurface thermal gradient between lower and upper plains, due to thermal conduction by regional groundwater flow. Furthermore, they remarked that GSHPs installed in areas with different groundwater thermal conduction characteristics may have different performance efficiencies. The most recently published research on the application of GSHPs in Bangkok with vertical boreholes and a single U-tube configuration showed advantages in terms of energy savings compared with a normal ASHP [39].
Various economic analyses can be applied to assess the economic value of GSHPs—e.g., present value (PV) analysis, internal rate-of-return analysis, net-benefit analysis, payback analysis, and benefit-to-cost ratio analysis [40]. Noorollahi et al. performed a numerical simulation and economic evaluation using the PV for the application of GSHPs to the energy supply of greenhouses in Iran [41]. The annual cost has been used to evaluate the feasibility of GSHP application in Turkey [42]; it was concluded that the GSHP system is economically preferable to the ASHP system for cooling purposes. Esen et al. [43] conducted a techno-economic assessment of GSHPs for heating in Turkey. Go et al. [44] evaluated the economic feasibility of various configurations of the shallow spiral coil loop heat exchanger, using the PV, internal rate of return, and savings-to-investment ratio. Zu et al. analyzed the economic application of GSHPs in hot and humid climates using the PV [45].
Owing to aforementioned concerns, the objectives of present work are (i) to demonstrate the applicability of GSHPs, using shallow heat exchangers compared to the ASHP, through the experimental results in the hot tropical climate of Thailand; and (ii) to highlight important financial considerations by analyzing the prevailing factors that must be considered in order to make GSHP application in Thailand and other Southeast Asian countries economically attractive.

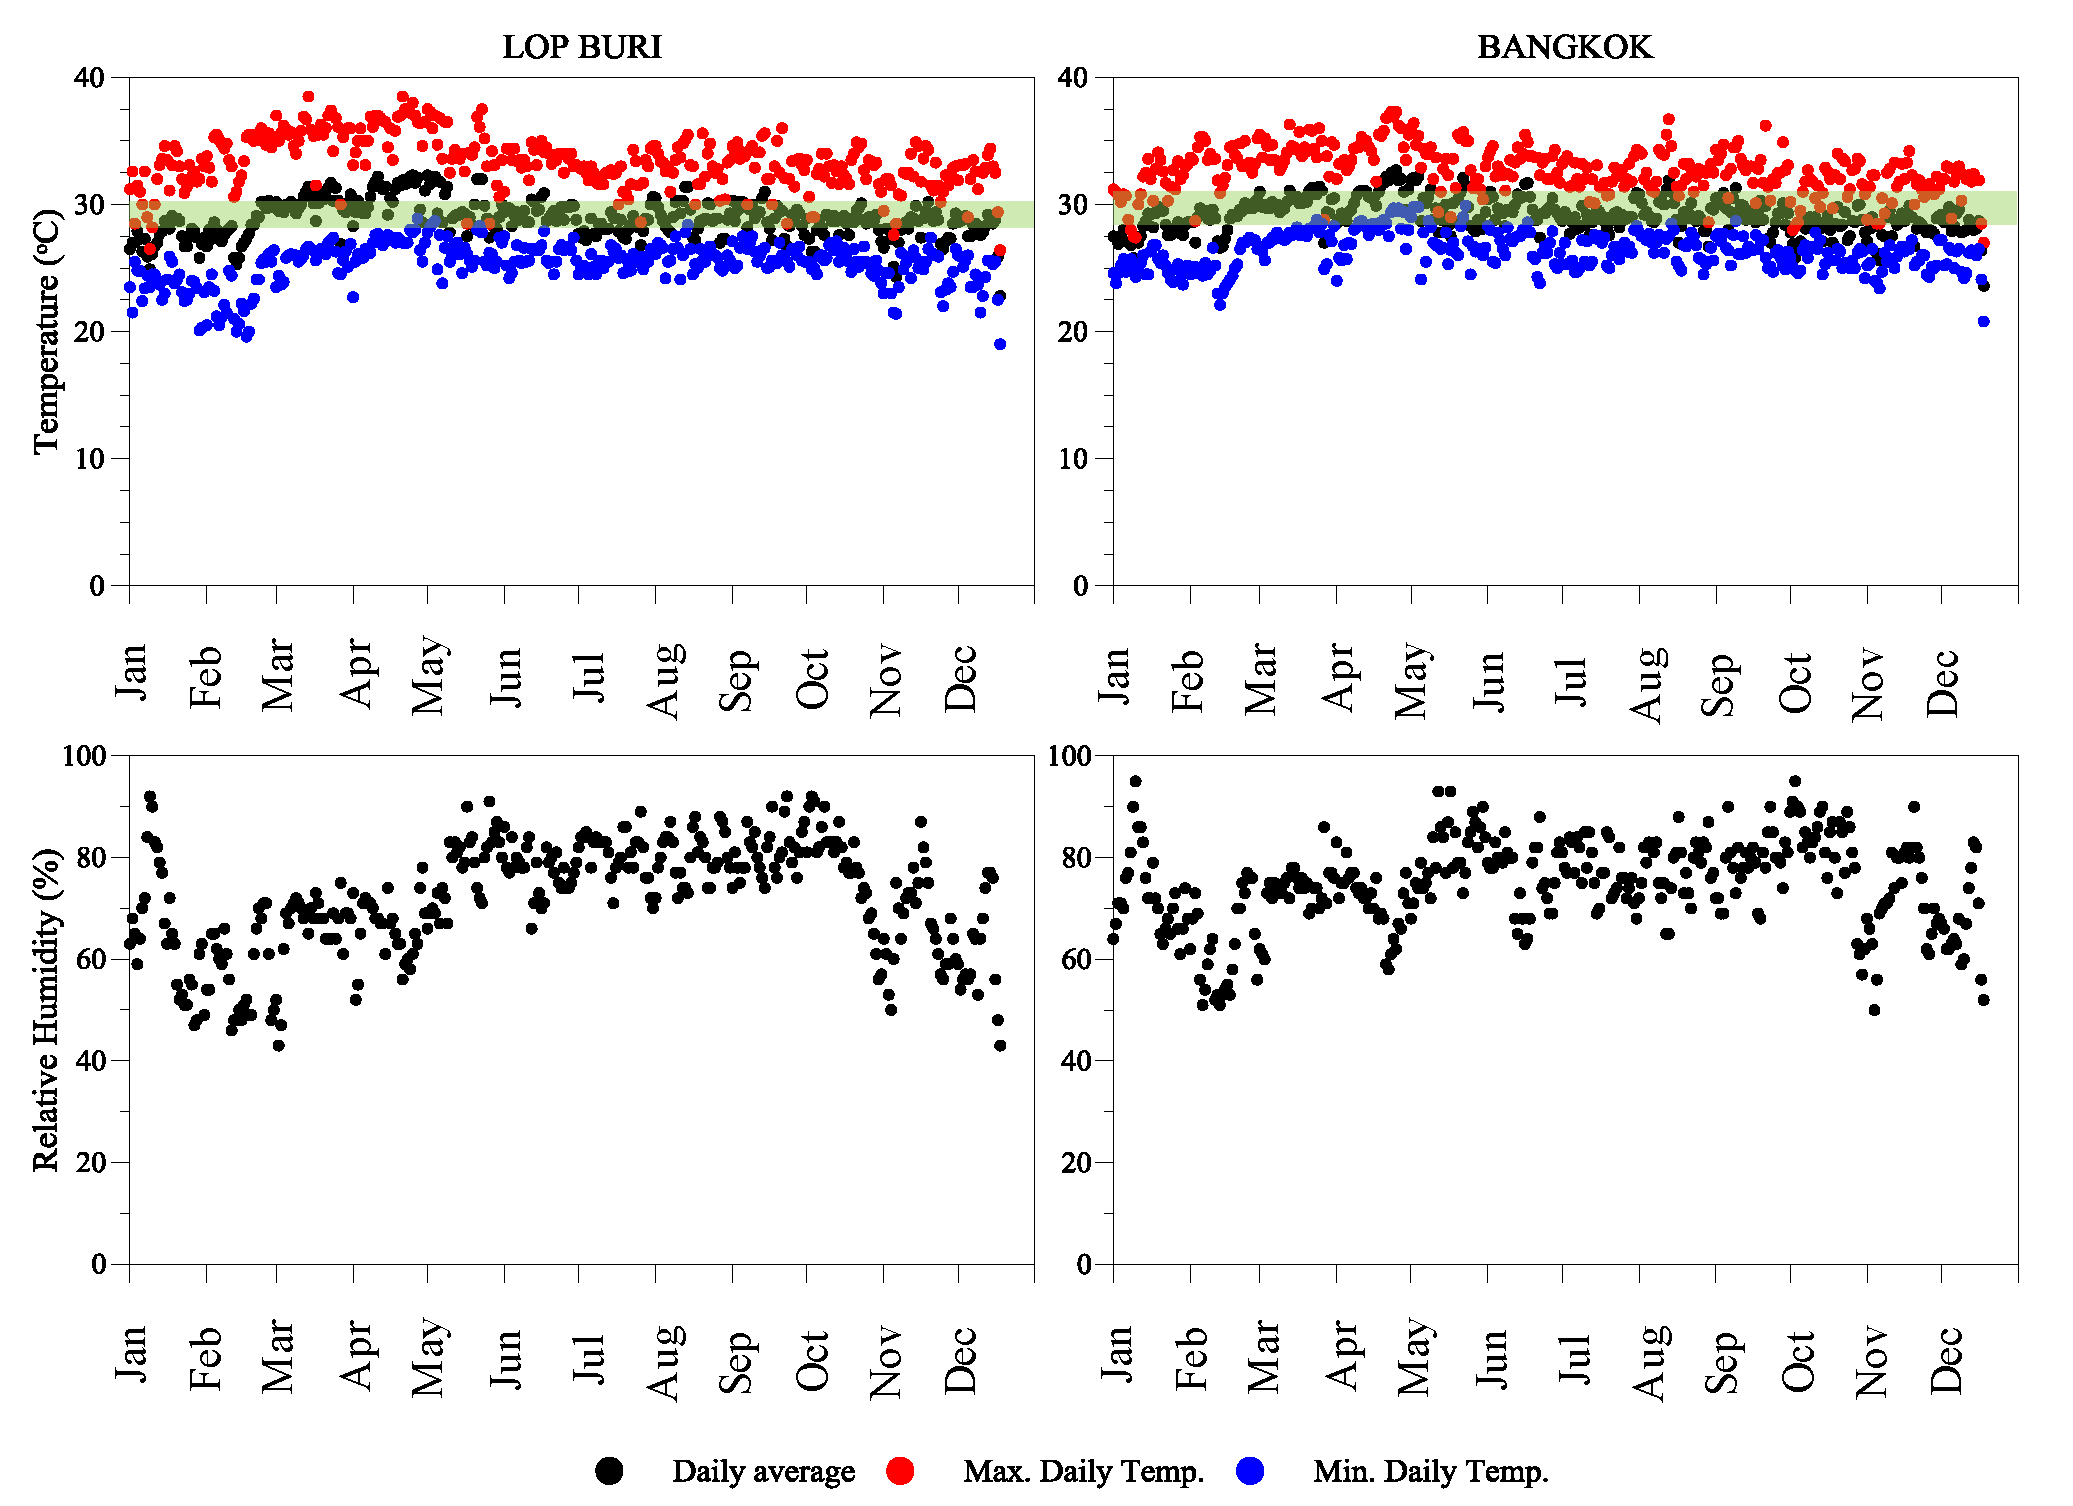
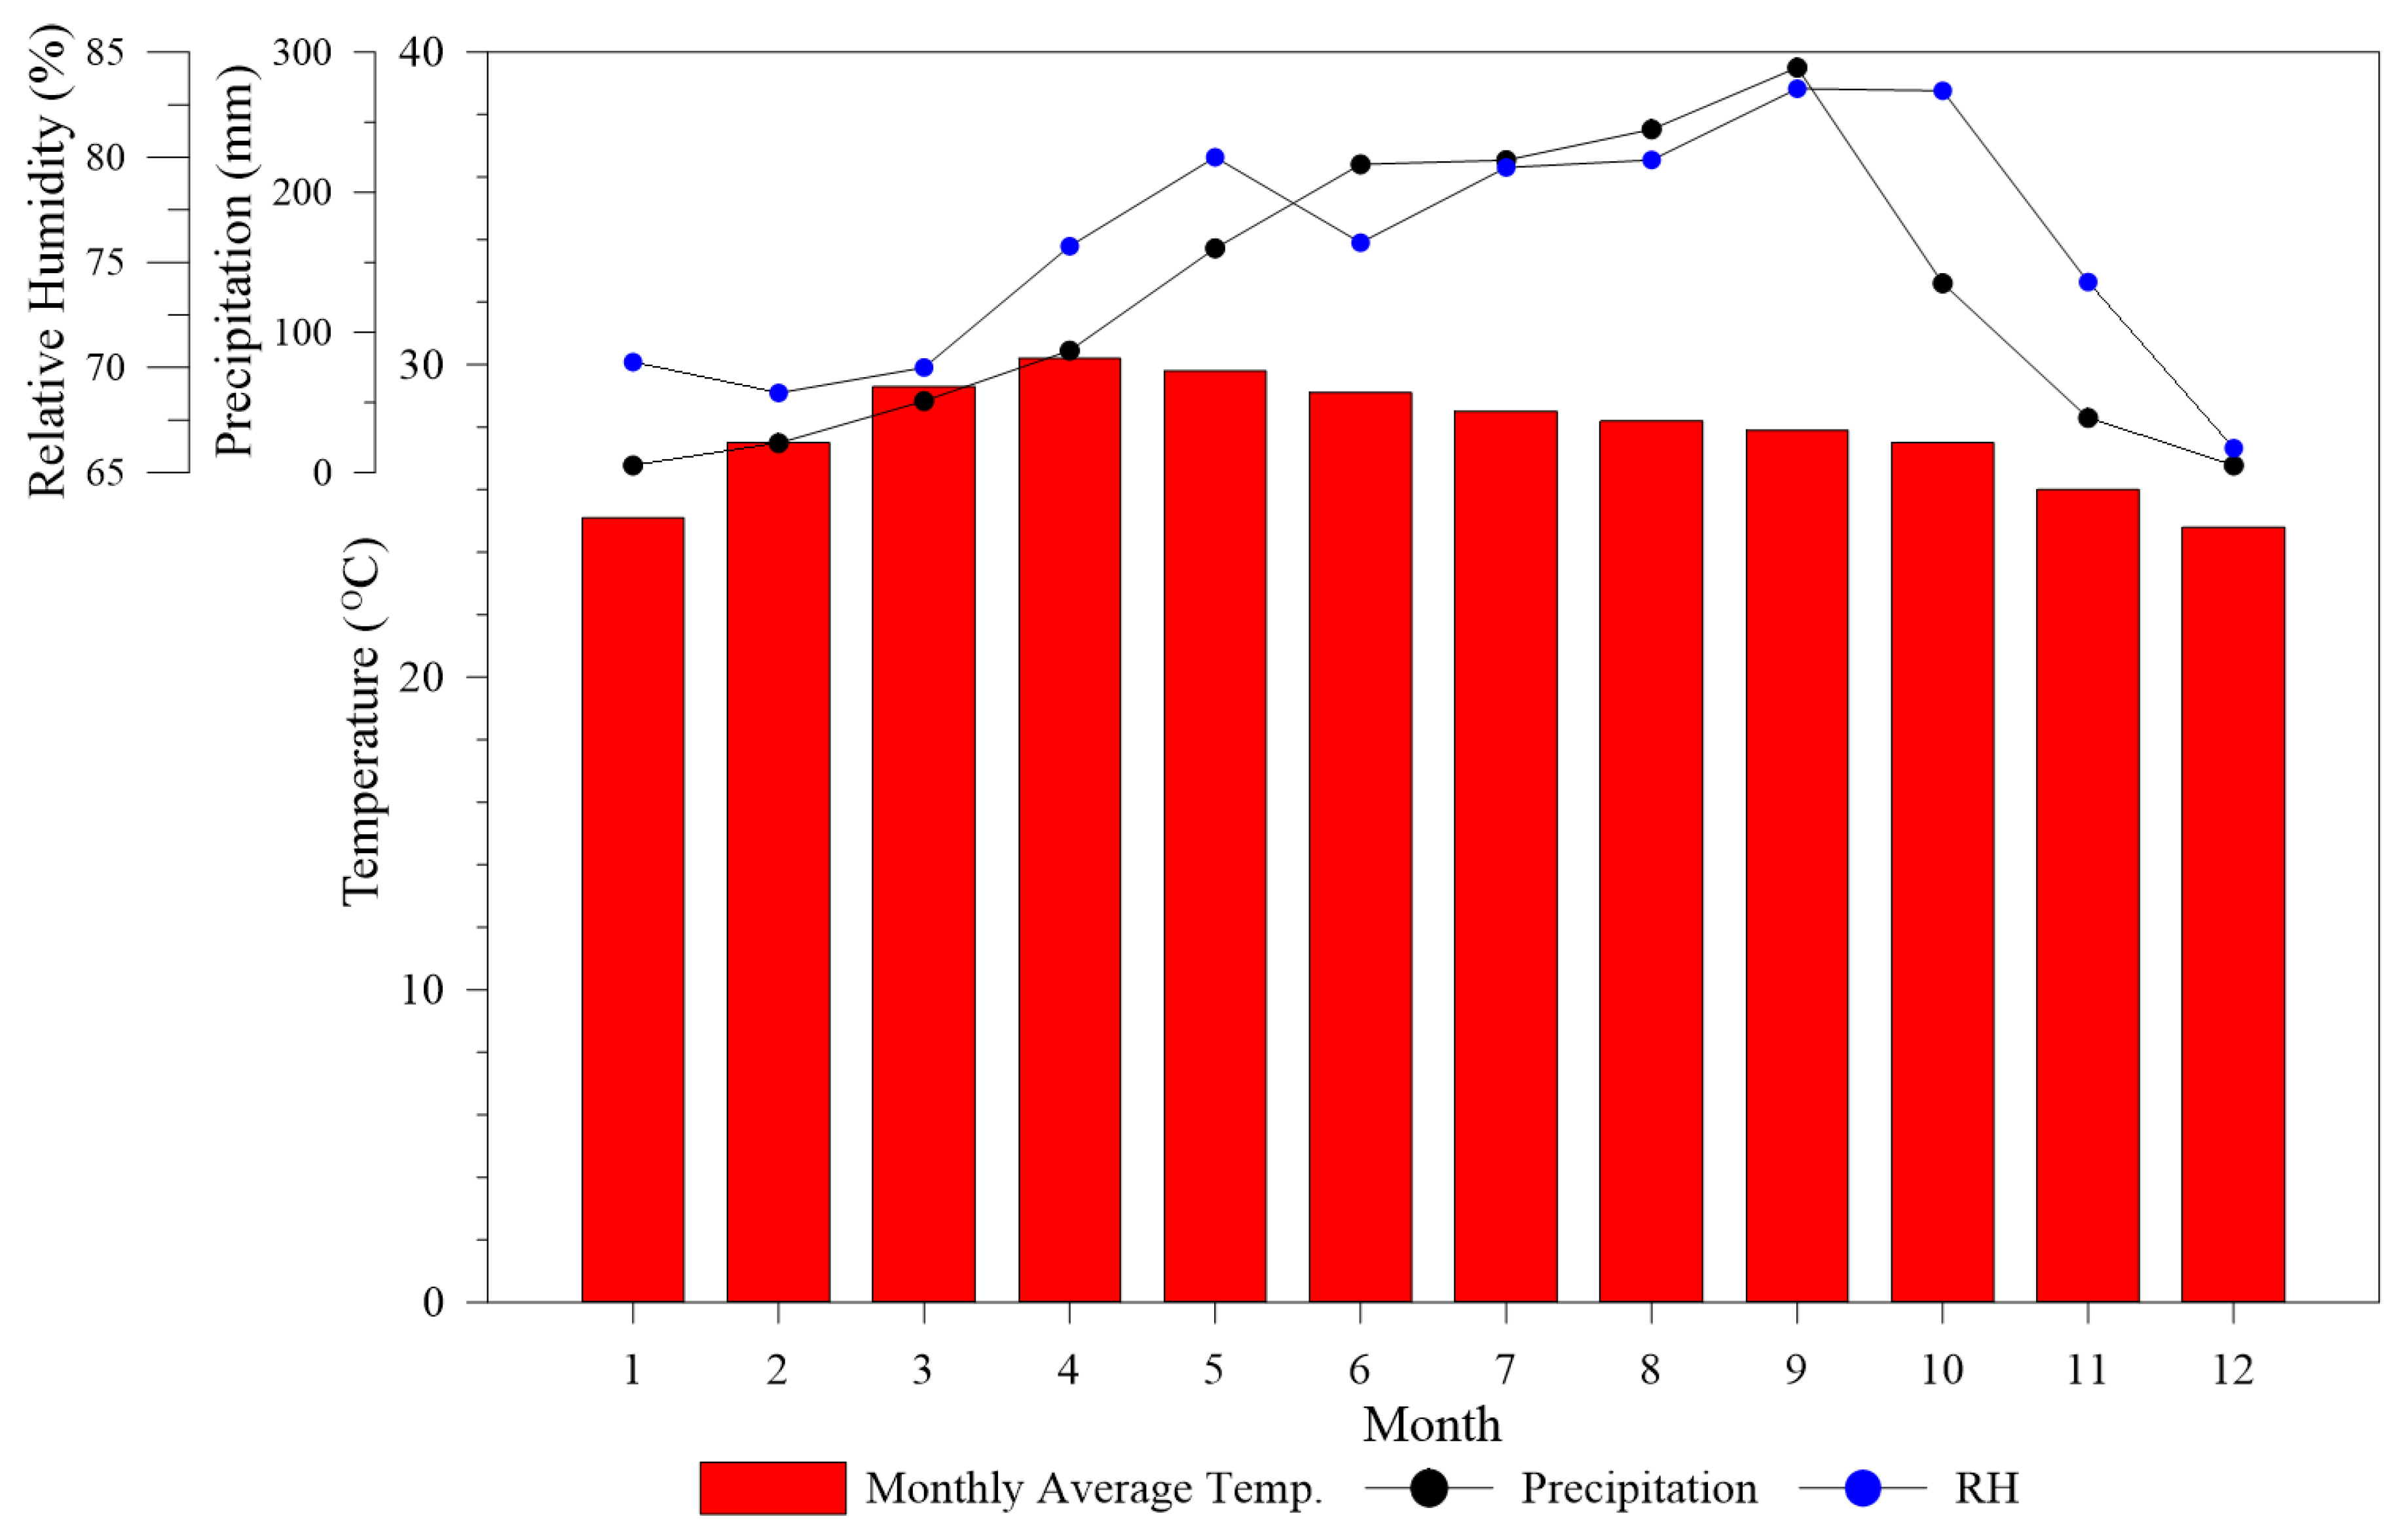
2. Climate of Thailand

Located in a tropical area, Thailand has a topography that can be divided into five areas and two regions. The upper (higher latitude) region is comprised of northern, northeastern, central, and eastern areas, while the lower region is comprised of the southern area. According to the Koppen climate classification, the upper region has a tropical monsoon climate, while the lower region has a tropical savanna/wet climate, with an equatorial climate in a small part of southern Thailand. The year is divided into three seasons. The rainy season of the southwest monsoon is from mid-May to mid-October, with the rainfall being highest from August to September. Winter of the northeast monsoon is from mid-October to mid-February. The summer or pre-monsoon season is from mid-February to mid-May.
In contrast with the upper region, which has high temperatures and a long warm period, the lower region has milder temperatures and higher humidity, as well as less diurnal and seasonal temperature variation [46]. Figure 1 shows the daily average, minimum and maximum temperatures, and average relative humidity recorded in 2017 at two measuring stations located in Bangkok (13°45′09″ N) and Lopburi (14°48′00″ N), ±150 km northeast of Bangkok. The recordings indicate that there are only small seasonal temperature variations, with the temperatures being highest during April–May. Note that Bangkok has slightly lower annual temperatures but higher humidity than Lopburi, as Bangkok is located at a lower latitude and close to the Gulf of Thailand. The green shading in the figure indicates average underground temperatures recorded in observation wells [36]. It is also important to note that there is almost no difference between the annual average temperature and ground temperature. However, Bangkok has a slightly higher underground temperatures with a wider range compared with Lopburi.

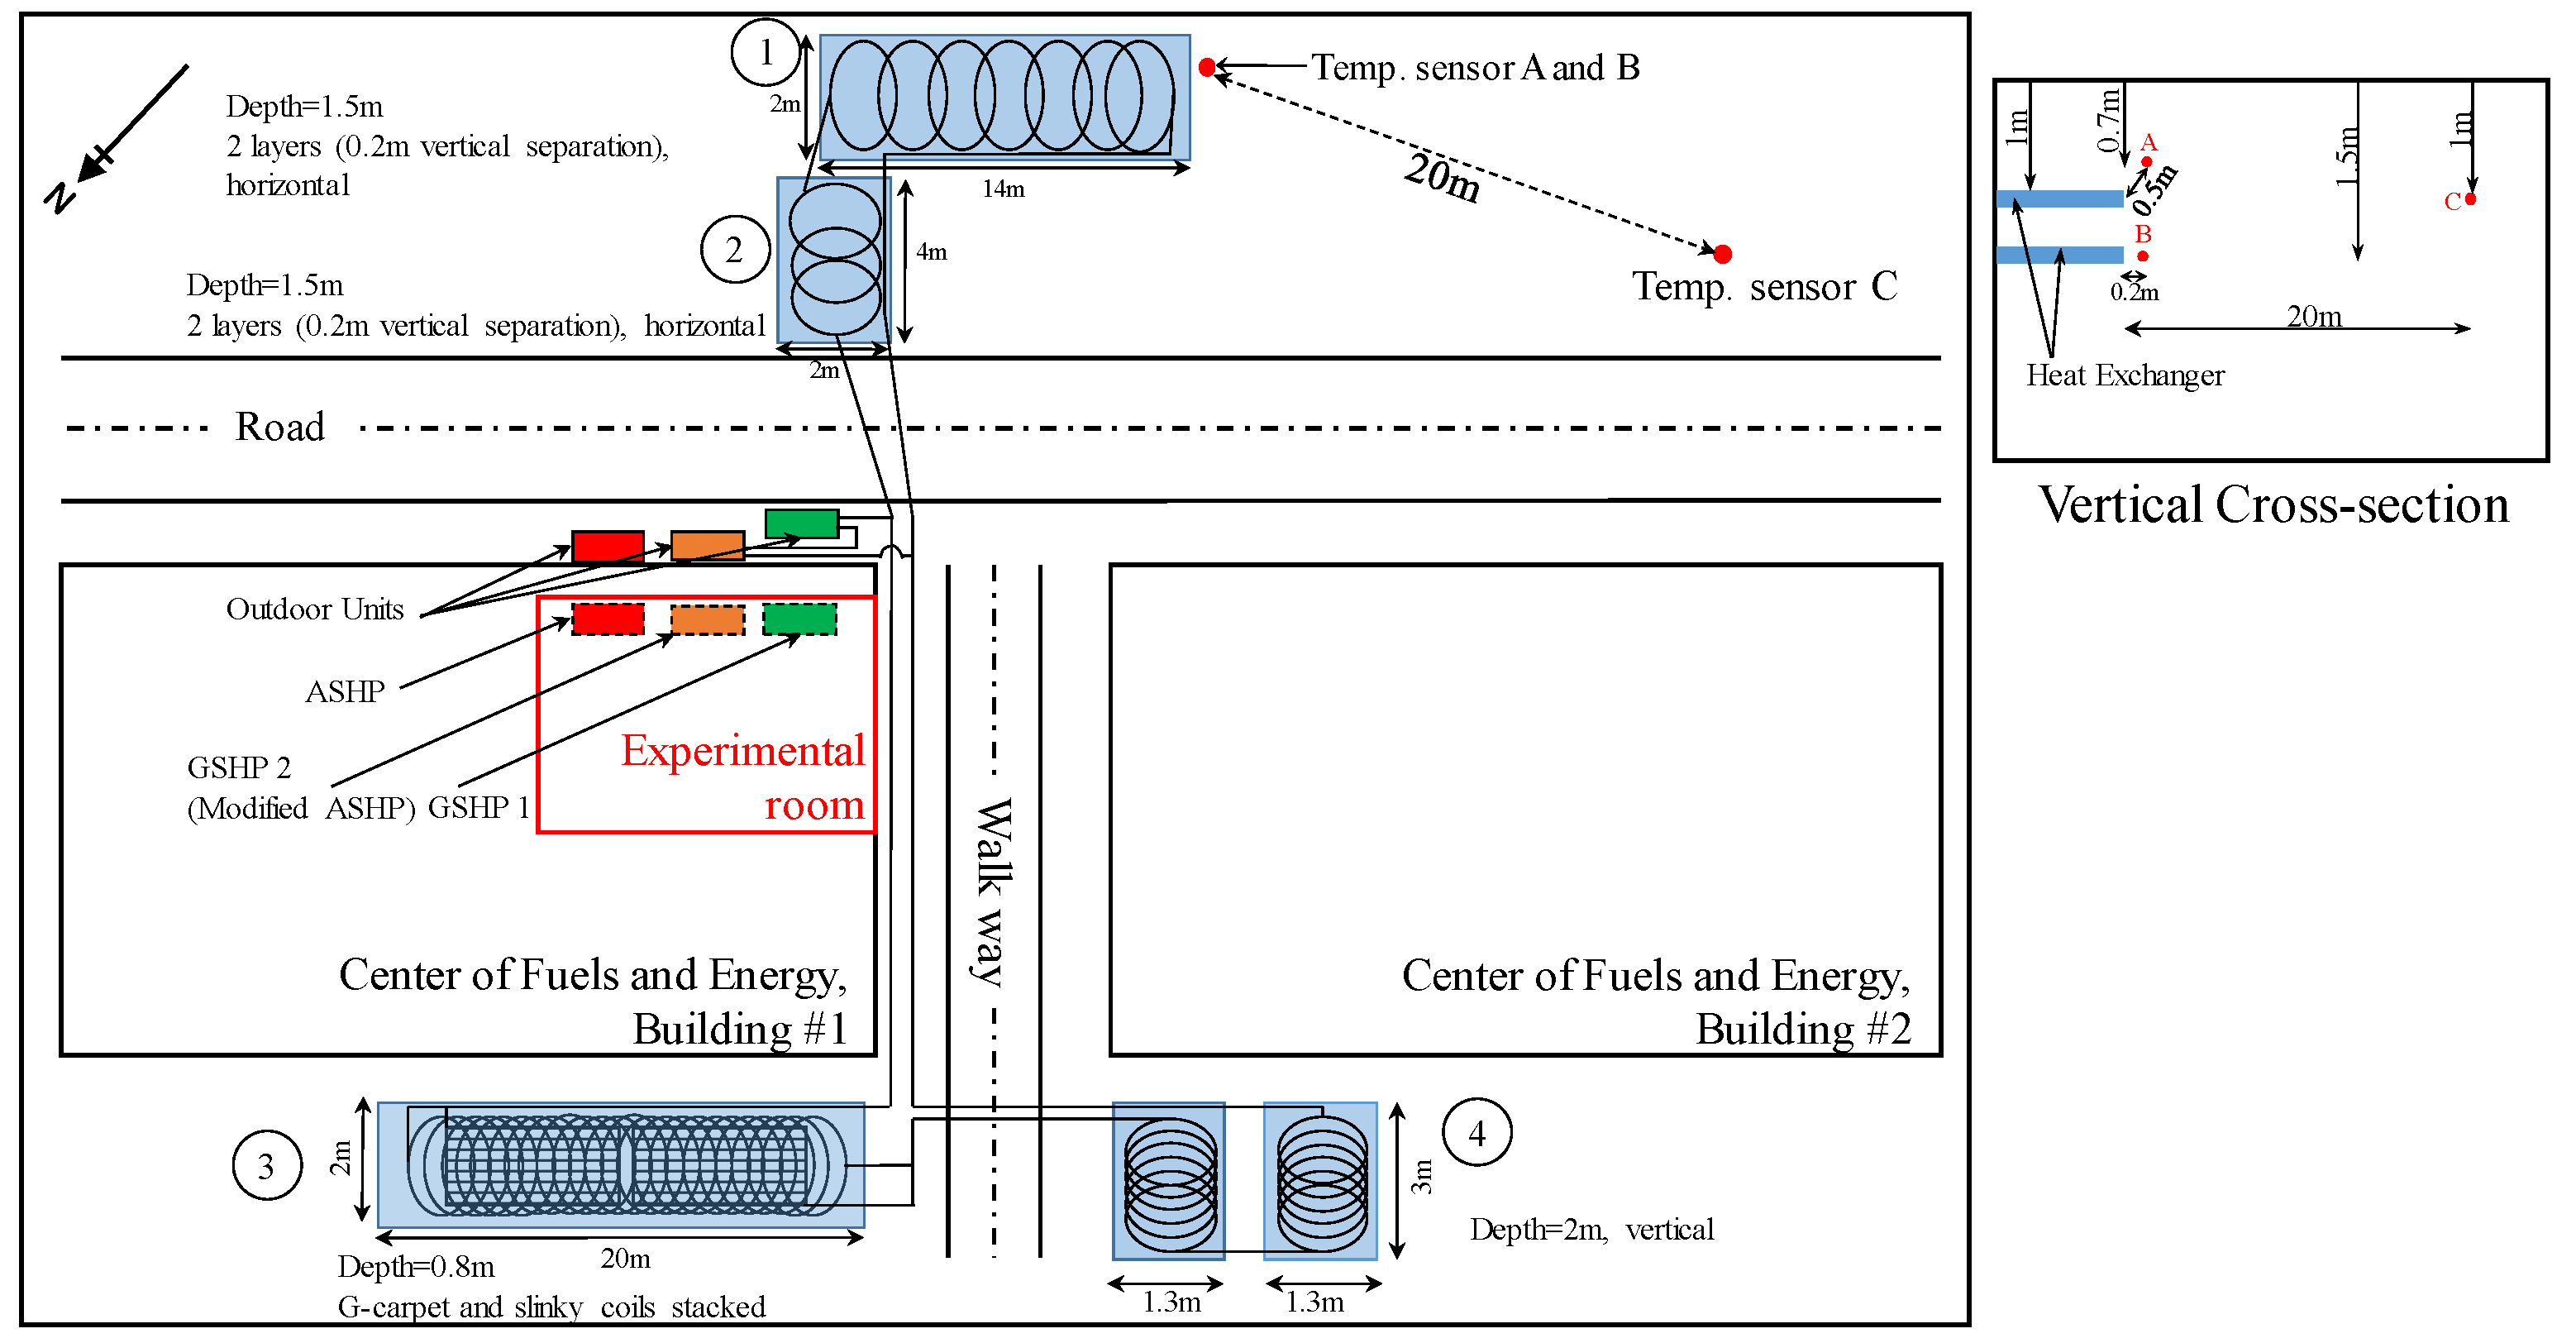
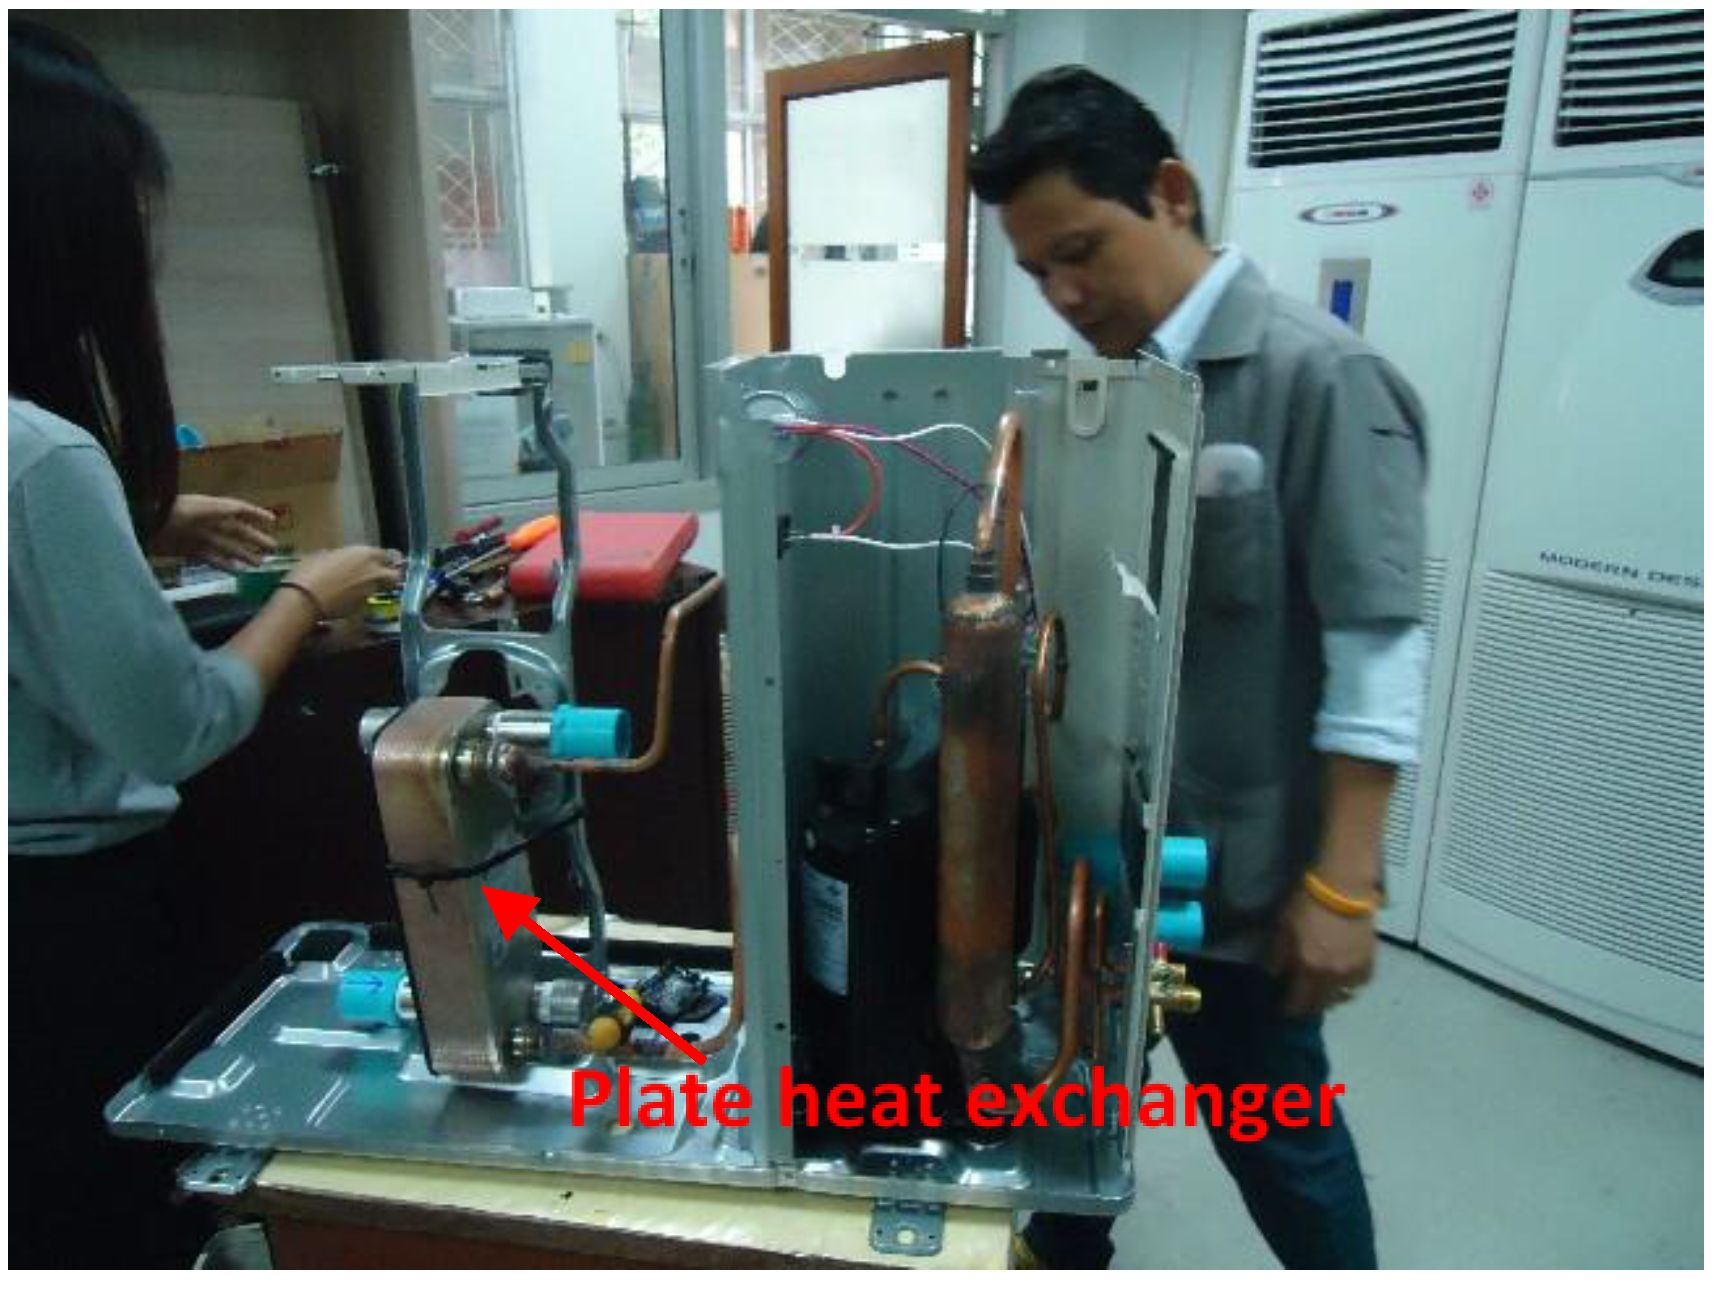
3. Configuration of the Heat Pump System

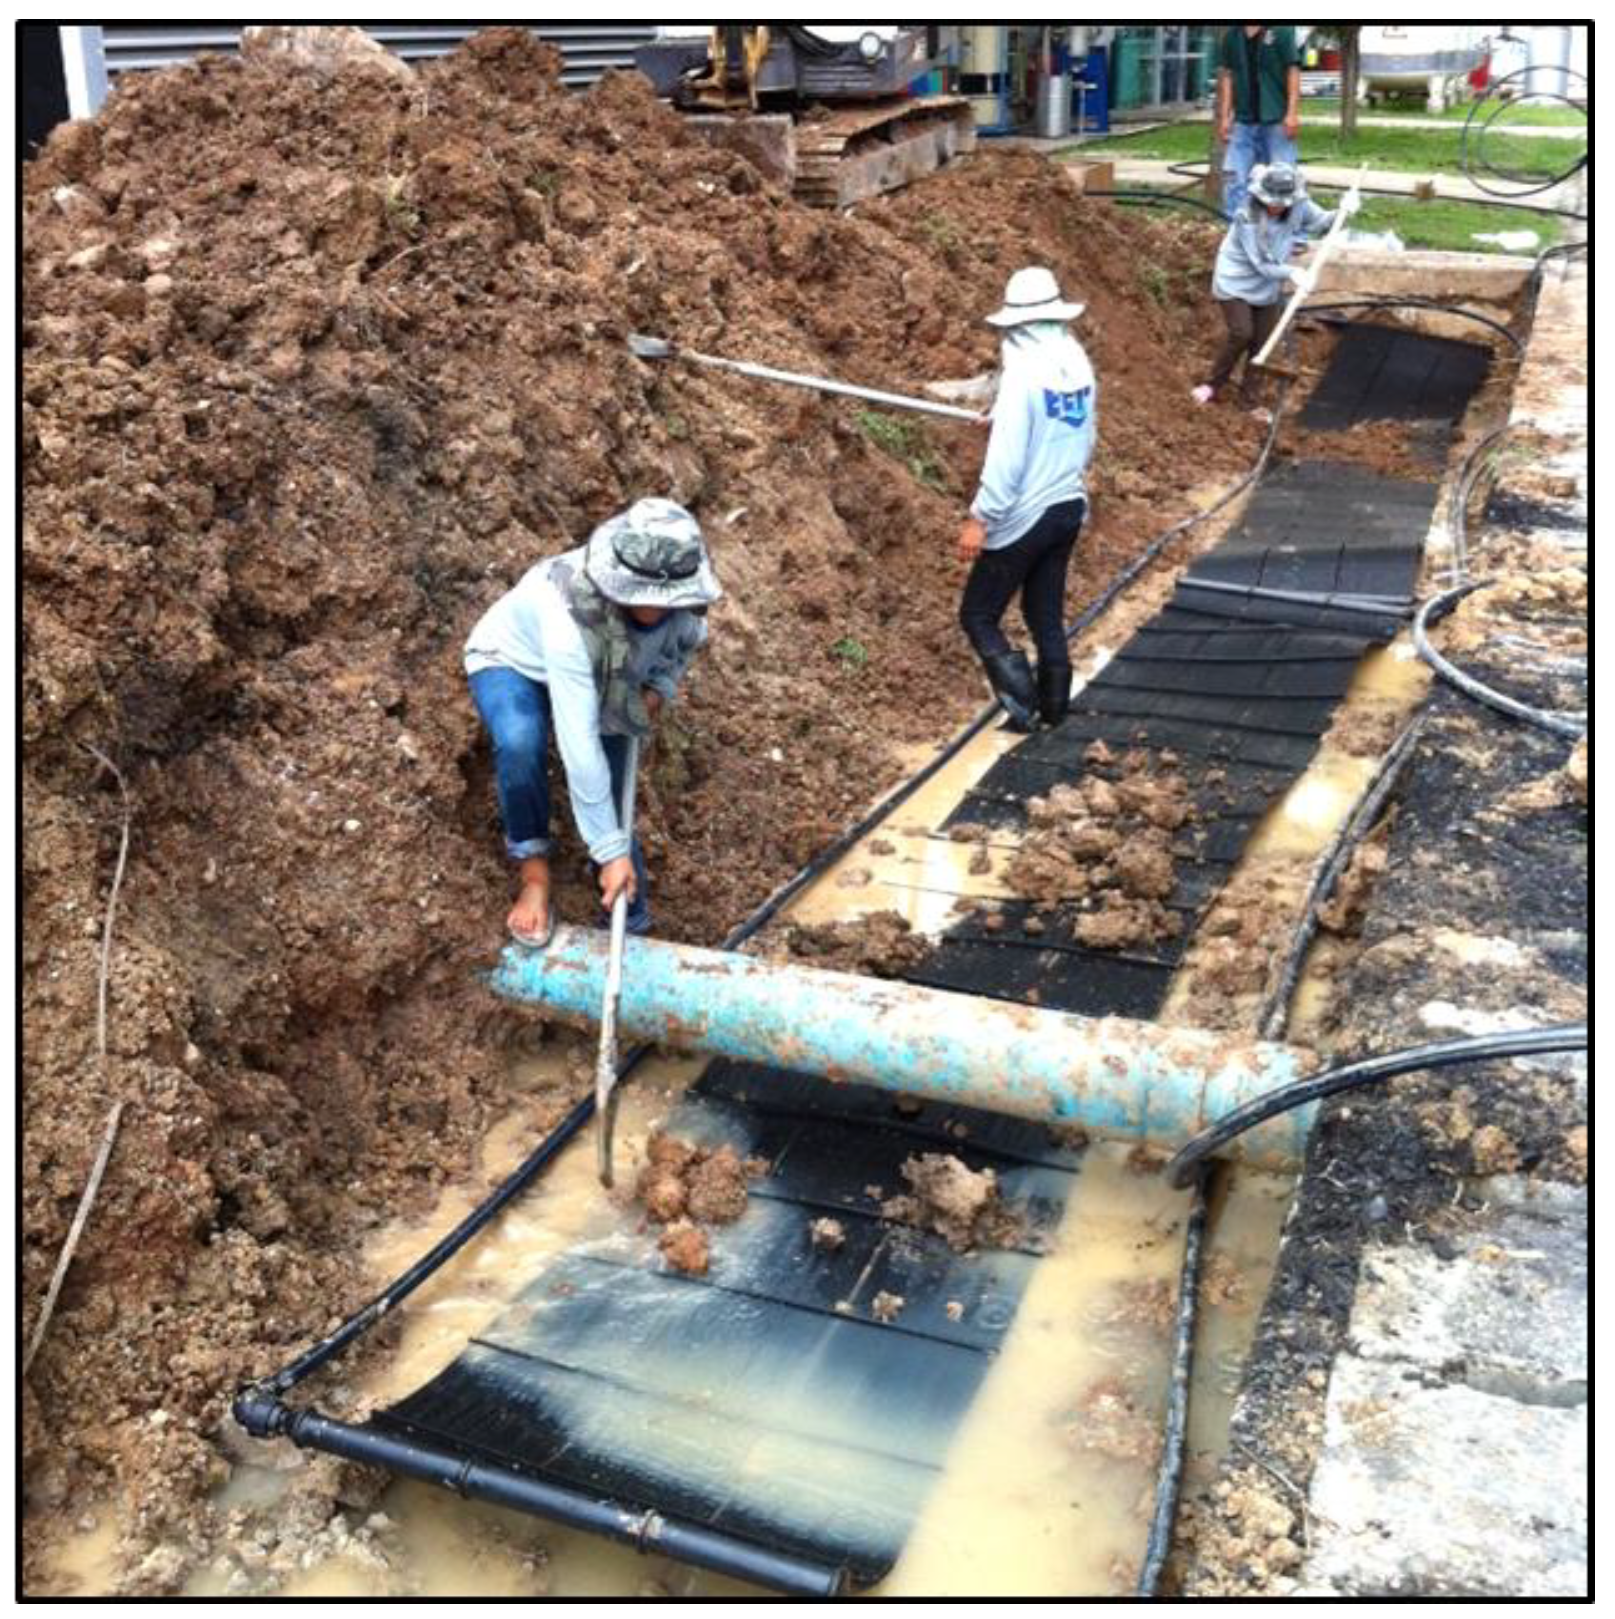
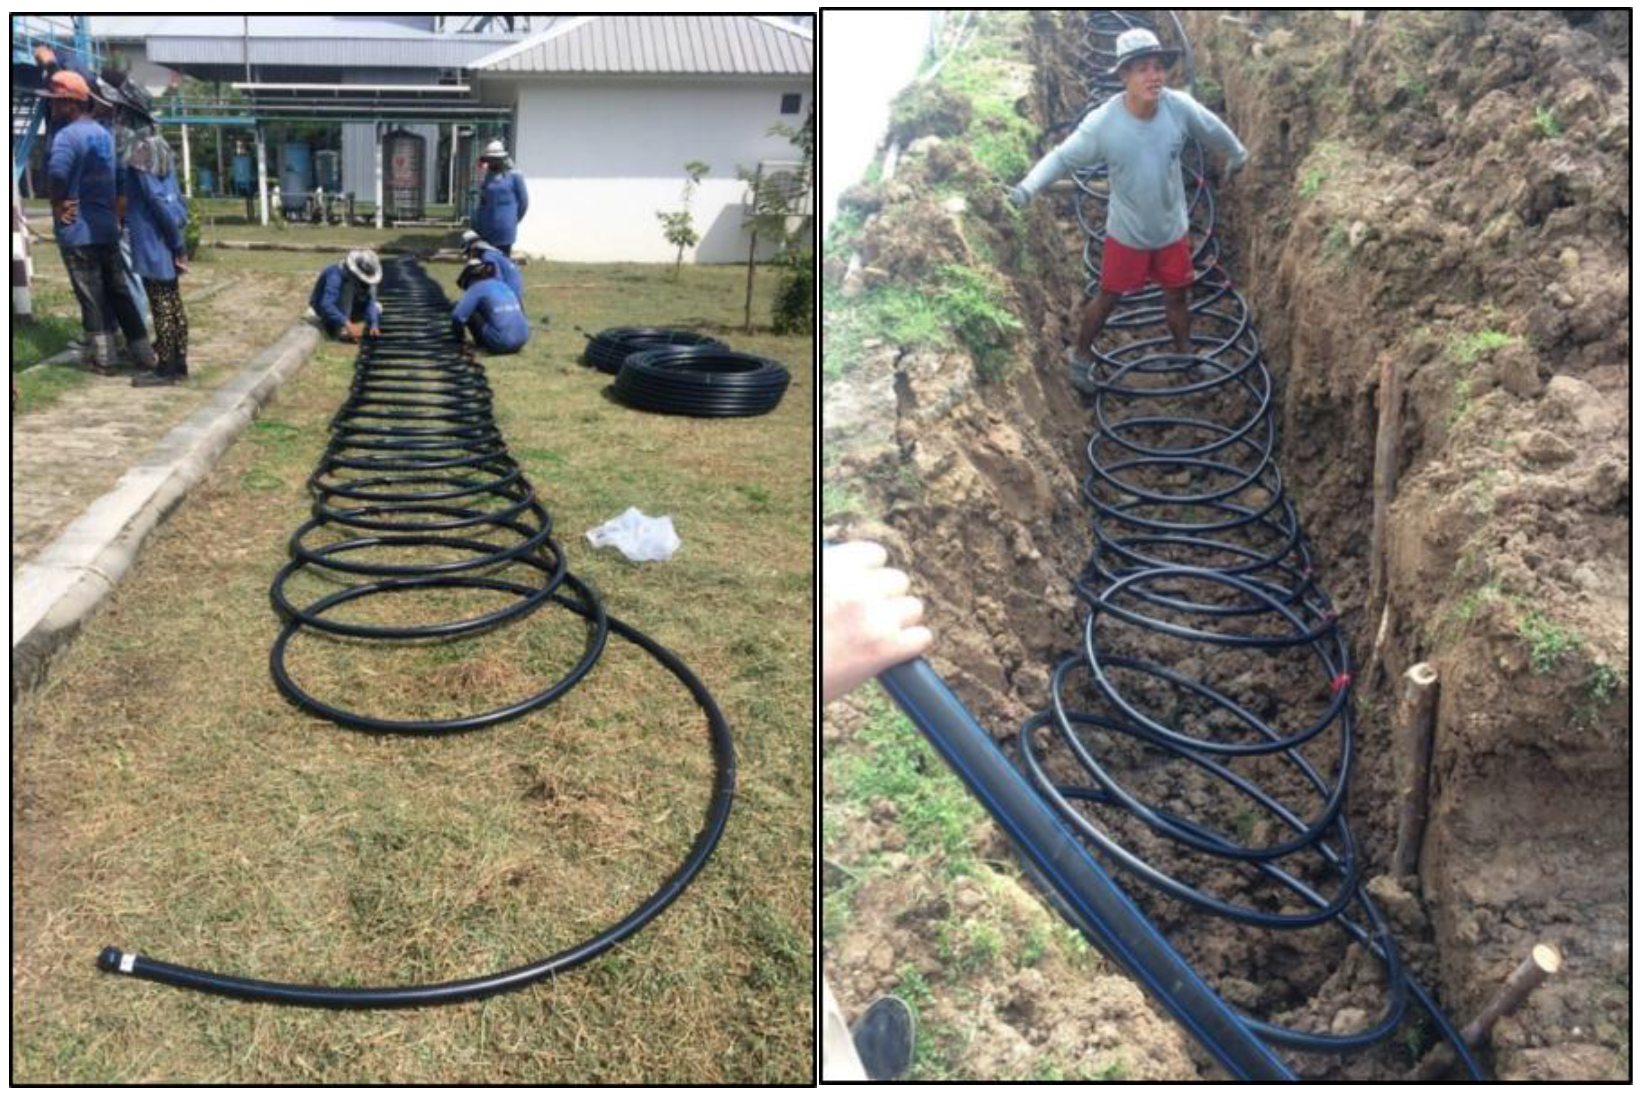
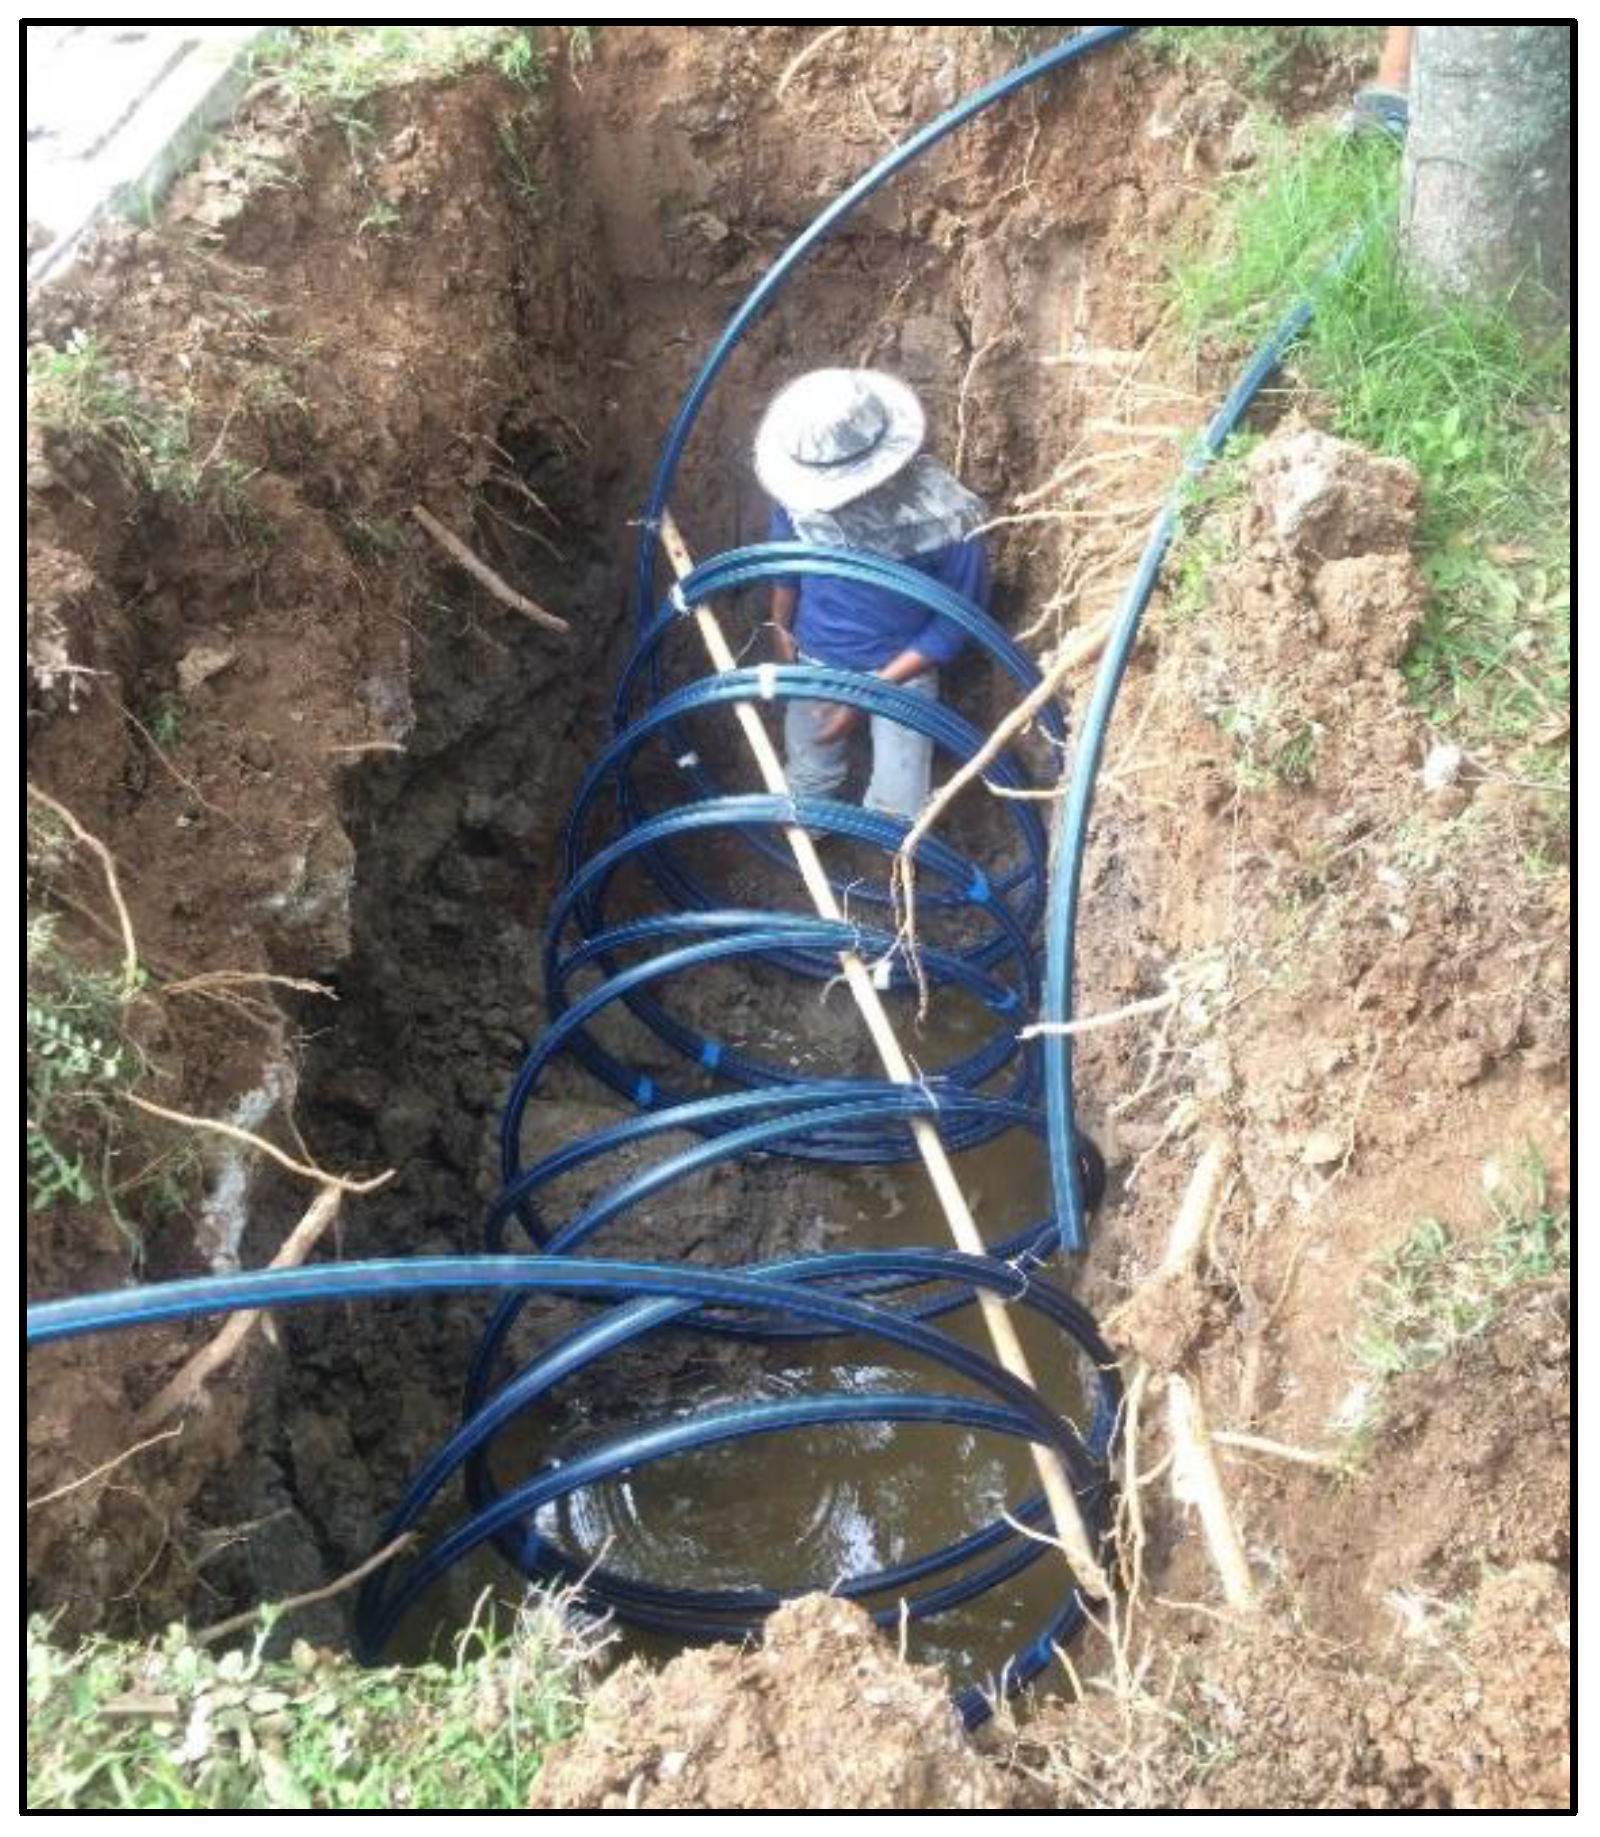
3.1. Shallow Ground Heat Exchanger

Shallow horizontal heat exchangers were installed at the Saraburi Campus of Chulalongkorn University. The campus (14°31′17.4′′N 101°1′07.1′′E) is located in Saraburi province, northeast of Bangkok, as shown in Figure 2. The upper soil is comprised of mainly volcanic-derived, clayey-sandy soil.
There were four groups of heat exchangers, as shown in Figure 3. Two types of heat exchanger were used, namely sheet-type (carpet-type) and high-density polyethylene (HDPE) pipe GHEs. The carpet-type heat exchanger had overall dimensions of 5.6 m × 0.9 m and is comprised of 117 small HDPE tubes (with an outer diameter of 6 mm), as shown in Figure 4. HDPE pipes with a diameter of 3.2 cm and thickness of 2.4 mm were used in both slinky and helical arrangements, as shown in Figure 5 and Figure 6. In total, 500 m of HDPE pipe and two carpet-type heat exchangers were installed over a footprint of 73.8 m2. The ground heat exchangers were not influenced by the groundwater. The detailed setups of GHEs were as follows.
In Group 1, two layers of 100 m of HDPE slinky pipes were installed in the bottom of a trench having dimensions of 14 m × 2 m × 1.5 m (depth), with a vertical separation of 50 cm. Figure 5 shows the preparation and installation of the Group 1 heat exchanger.
In Group 2, two layers of 50 m of HDPE slinky pipes were installed in the bottom of a trench having dimensions of 4 m × 2 m × 1.5 m (depth), with a separation of 50 cm.
In Group 3, two layers of GHEs were installed in the bottom of a trench having dimensions of 20 m × 2 m × 0.8 m (depth). The bottom layer was comprised of two carpet-type heat exchangers connected in a series, while a slinky-pipe heat exchanger was installed 0.3 m above the bottom layer. Figure 4 shows the installation of the carpet-type heat exchanger.
Lastly, in Group 4, two 50-m HDPE pipes in a helical configuration were installed in the bottom of two trenches having dimensions of 3 m × 1.3 m × 2 m (depth). The two pipes were connected in a series. Figure 6 shows the installation of this heat exchanger.

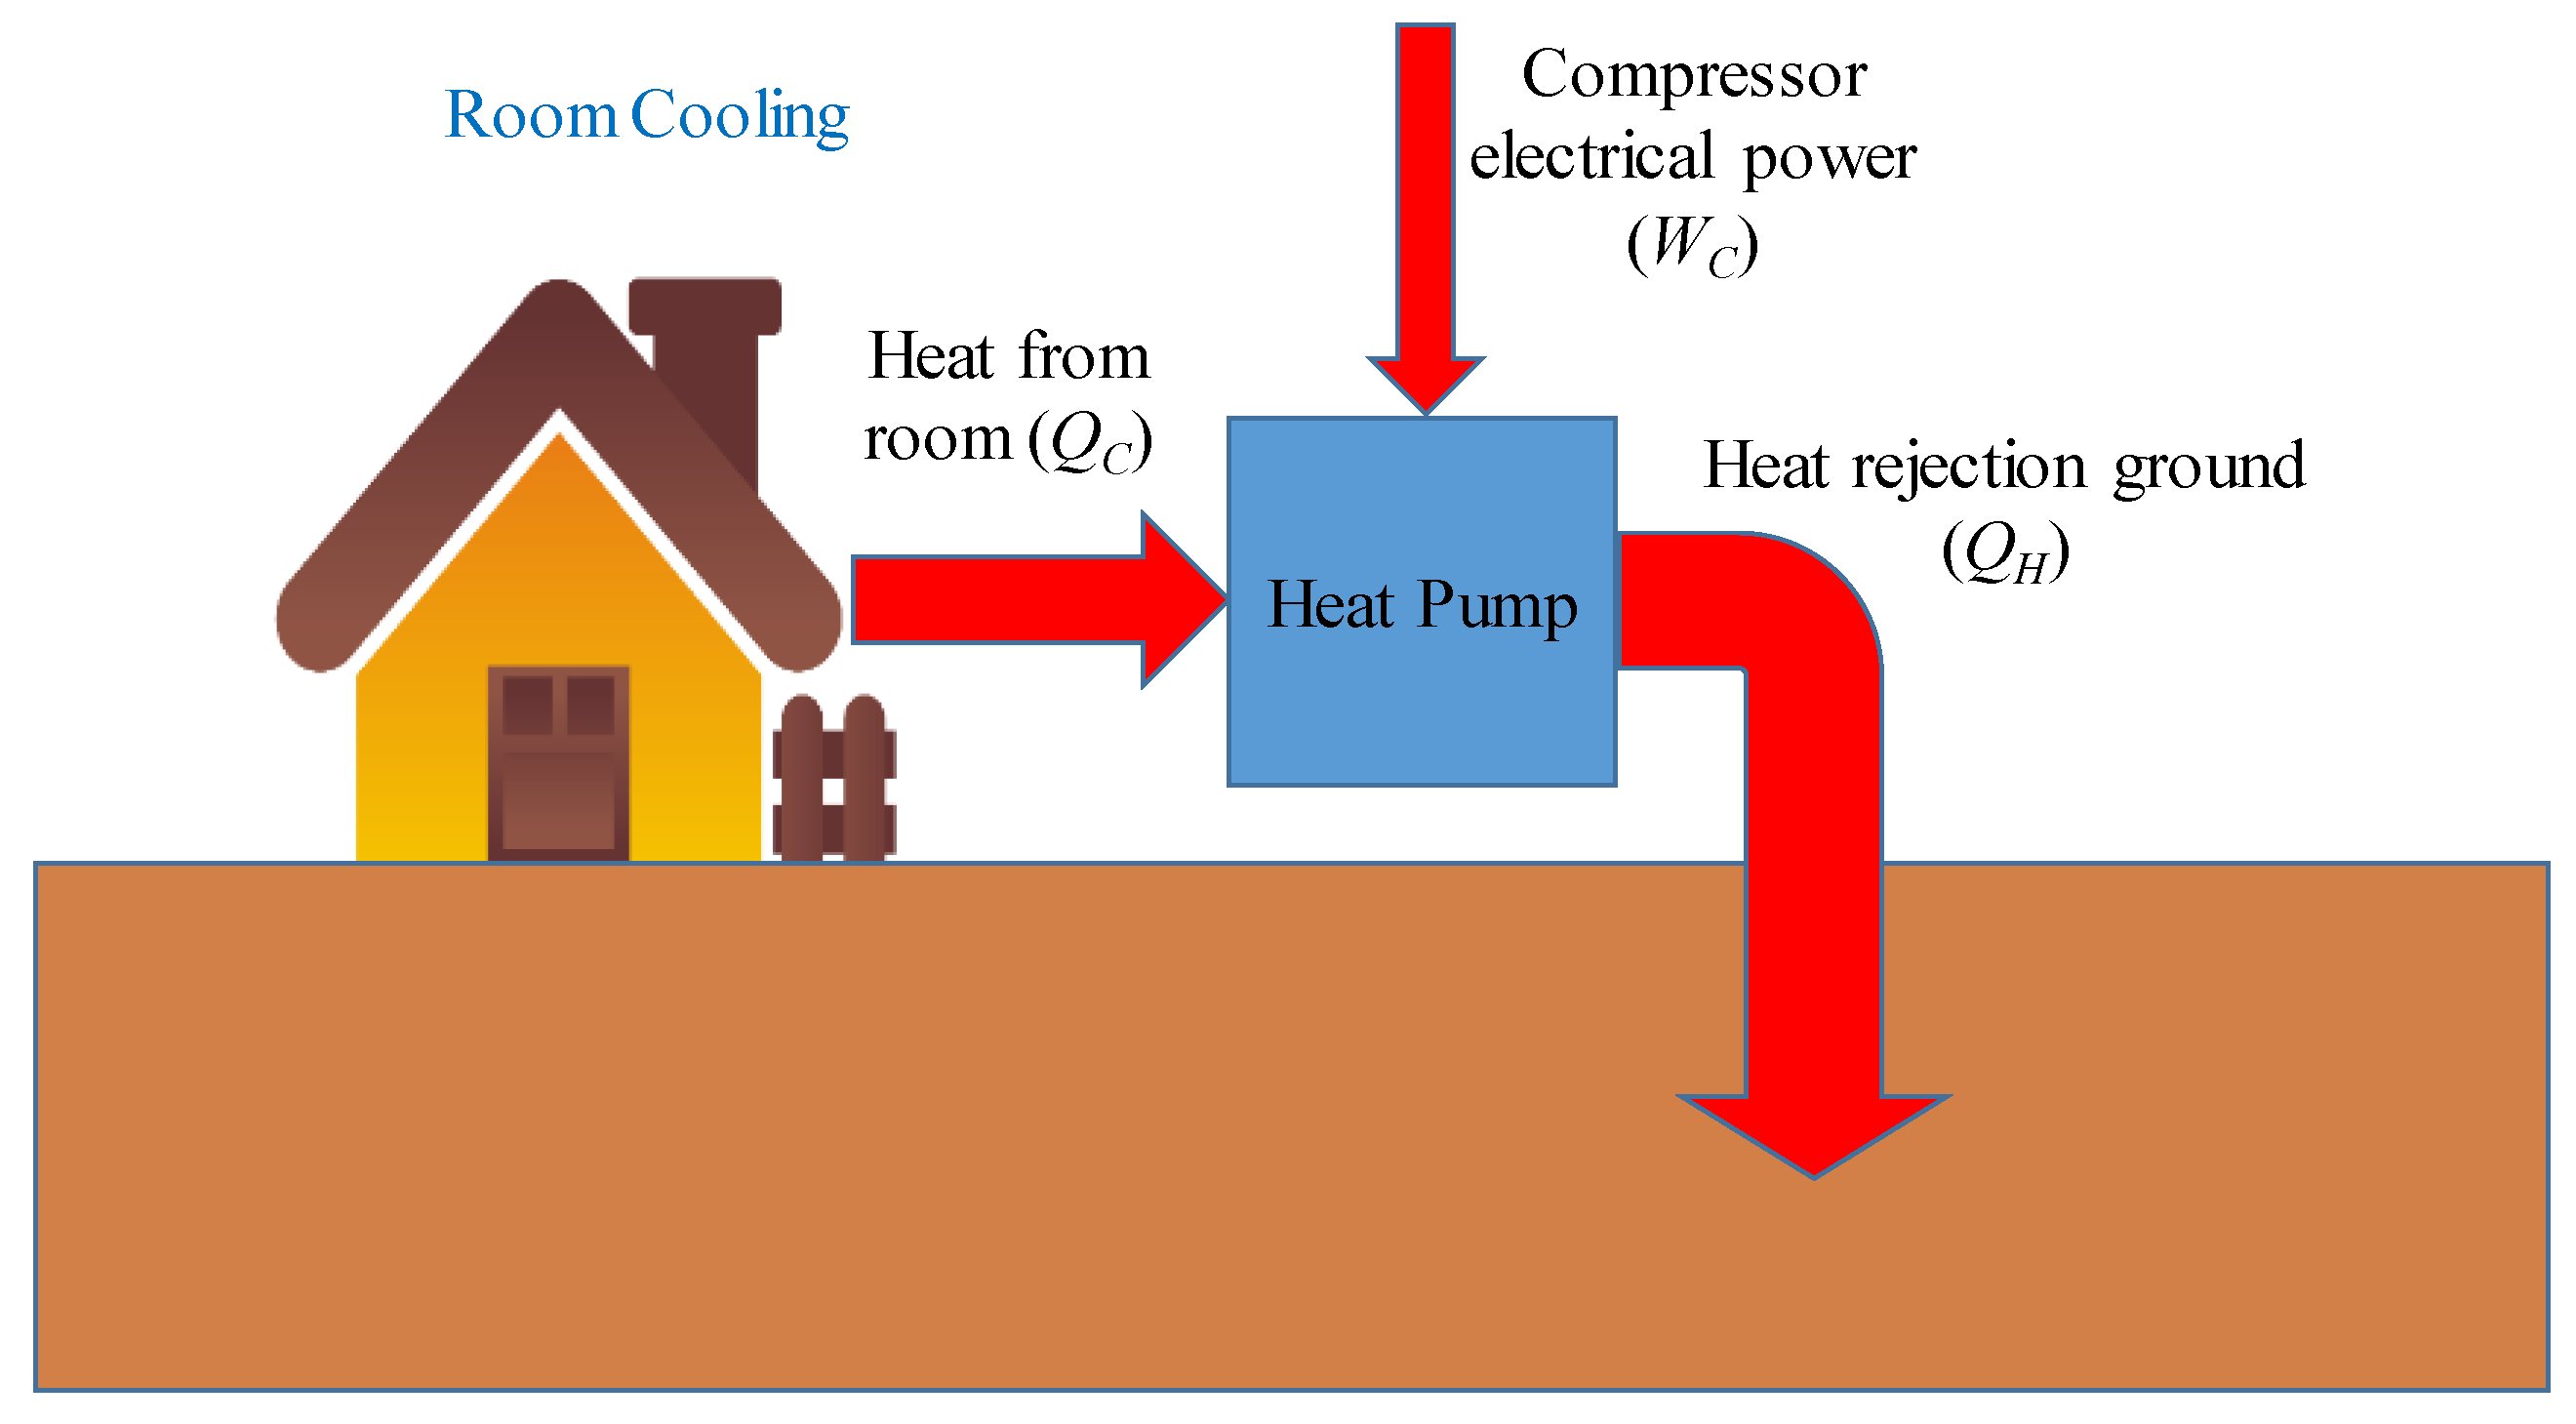
3.2. Room Cooling Experiment

An experimental room (having dimensions of 3 m × 8 m × 2 m) in Building 1 of the Center of Fuels and Energy was used for an operational cooling test. The material of the building’s wall was fiber cement board having thermal conductivity of λ = 0.14 Wm−1K−1 and heat capacity C = 600 Jkg−1K−1 [47]. Three fan coil units (FCUs)—one ASHP and two GSHP (GSHP 1 and GSHP 2) systems—were installed. Both GSHPs use antifreeze solution (40% propylene glycol) as ground heat transfer fluid. The antifreeze solution was used in order to reduce the risk of corrosion. GSHP 1 was a Japanese GSHP with reversible functions for cooling and heating. GSHP 2 was an ASHP, modified by changing the original heat exchanger with a plate heat exchanger (Kaori-K050X22, 7.03 kW) to allow heat exchange between the R410A refrigerant fluid and ground-loop circulation fluid. Figure 7 shows the heat exchanger replacement work of the modified GSHP. Specifications for each system are presented in Table 1. Both GSHPs were connected in a series to GHEs, as shown in Figure 3. A Graphtec GL240 logger recorded data from the power meter and thermocouples that measured the outdoor, indoor, and circulation-fluid inlet and outlet temperatures at 10-min intervals. For the ASHP, only the power consumption and outdoor and indoor temperatures were recorded. The thermocouples used for measurements are described in Table 2.

4. Data Analysis

The CoP is the ratio of heat removed from the room (see Figure 8) to the work required:
CoP   =   Q C W T
Here, Qc (in W) is the rate of heat removed from the building and WT (in W) is the total electrical power consumption, calculated as
W T   =   W C + W F + W P
where WC, WF, and WP are the electrical power for the compressor, fan, and circulation pump, respectively.
As the heat pump performance data record the temperature and flowrate of GHE fluid inlet and outlet from the GSHP, Equation (1) can be rewritten as
CoP   =   Q C W T = Q H W C W T
Here, QH (in W) is the rate of heat rejection into the ground, expressed as
Q H   =   ( T o u t T i n ) ρ c V m
where Tout and Tin (in C) are, respectively, the heat exchange fluid temperatures at the GSHP outlet and inlet, while ρ (kg/m3), c (J/(kgC), and Vm (m3/s) are, respectively, the density, specific heat capacity, and flowrate of the heat exchange fluid.
The variation of data within the operational period of each heat pump is quantified in simple standard deviation analysis as
σ = i = 1 N ( x i x ¯ ) 2 N 1 ,
where xi is the observed value, x ¯ is the average value, and N is the number of data points.

5. Results and Discussion

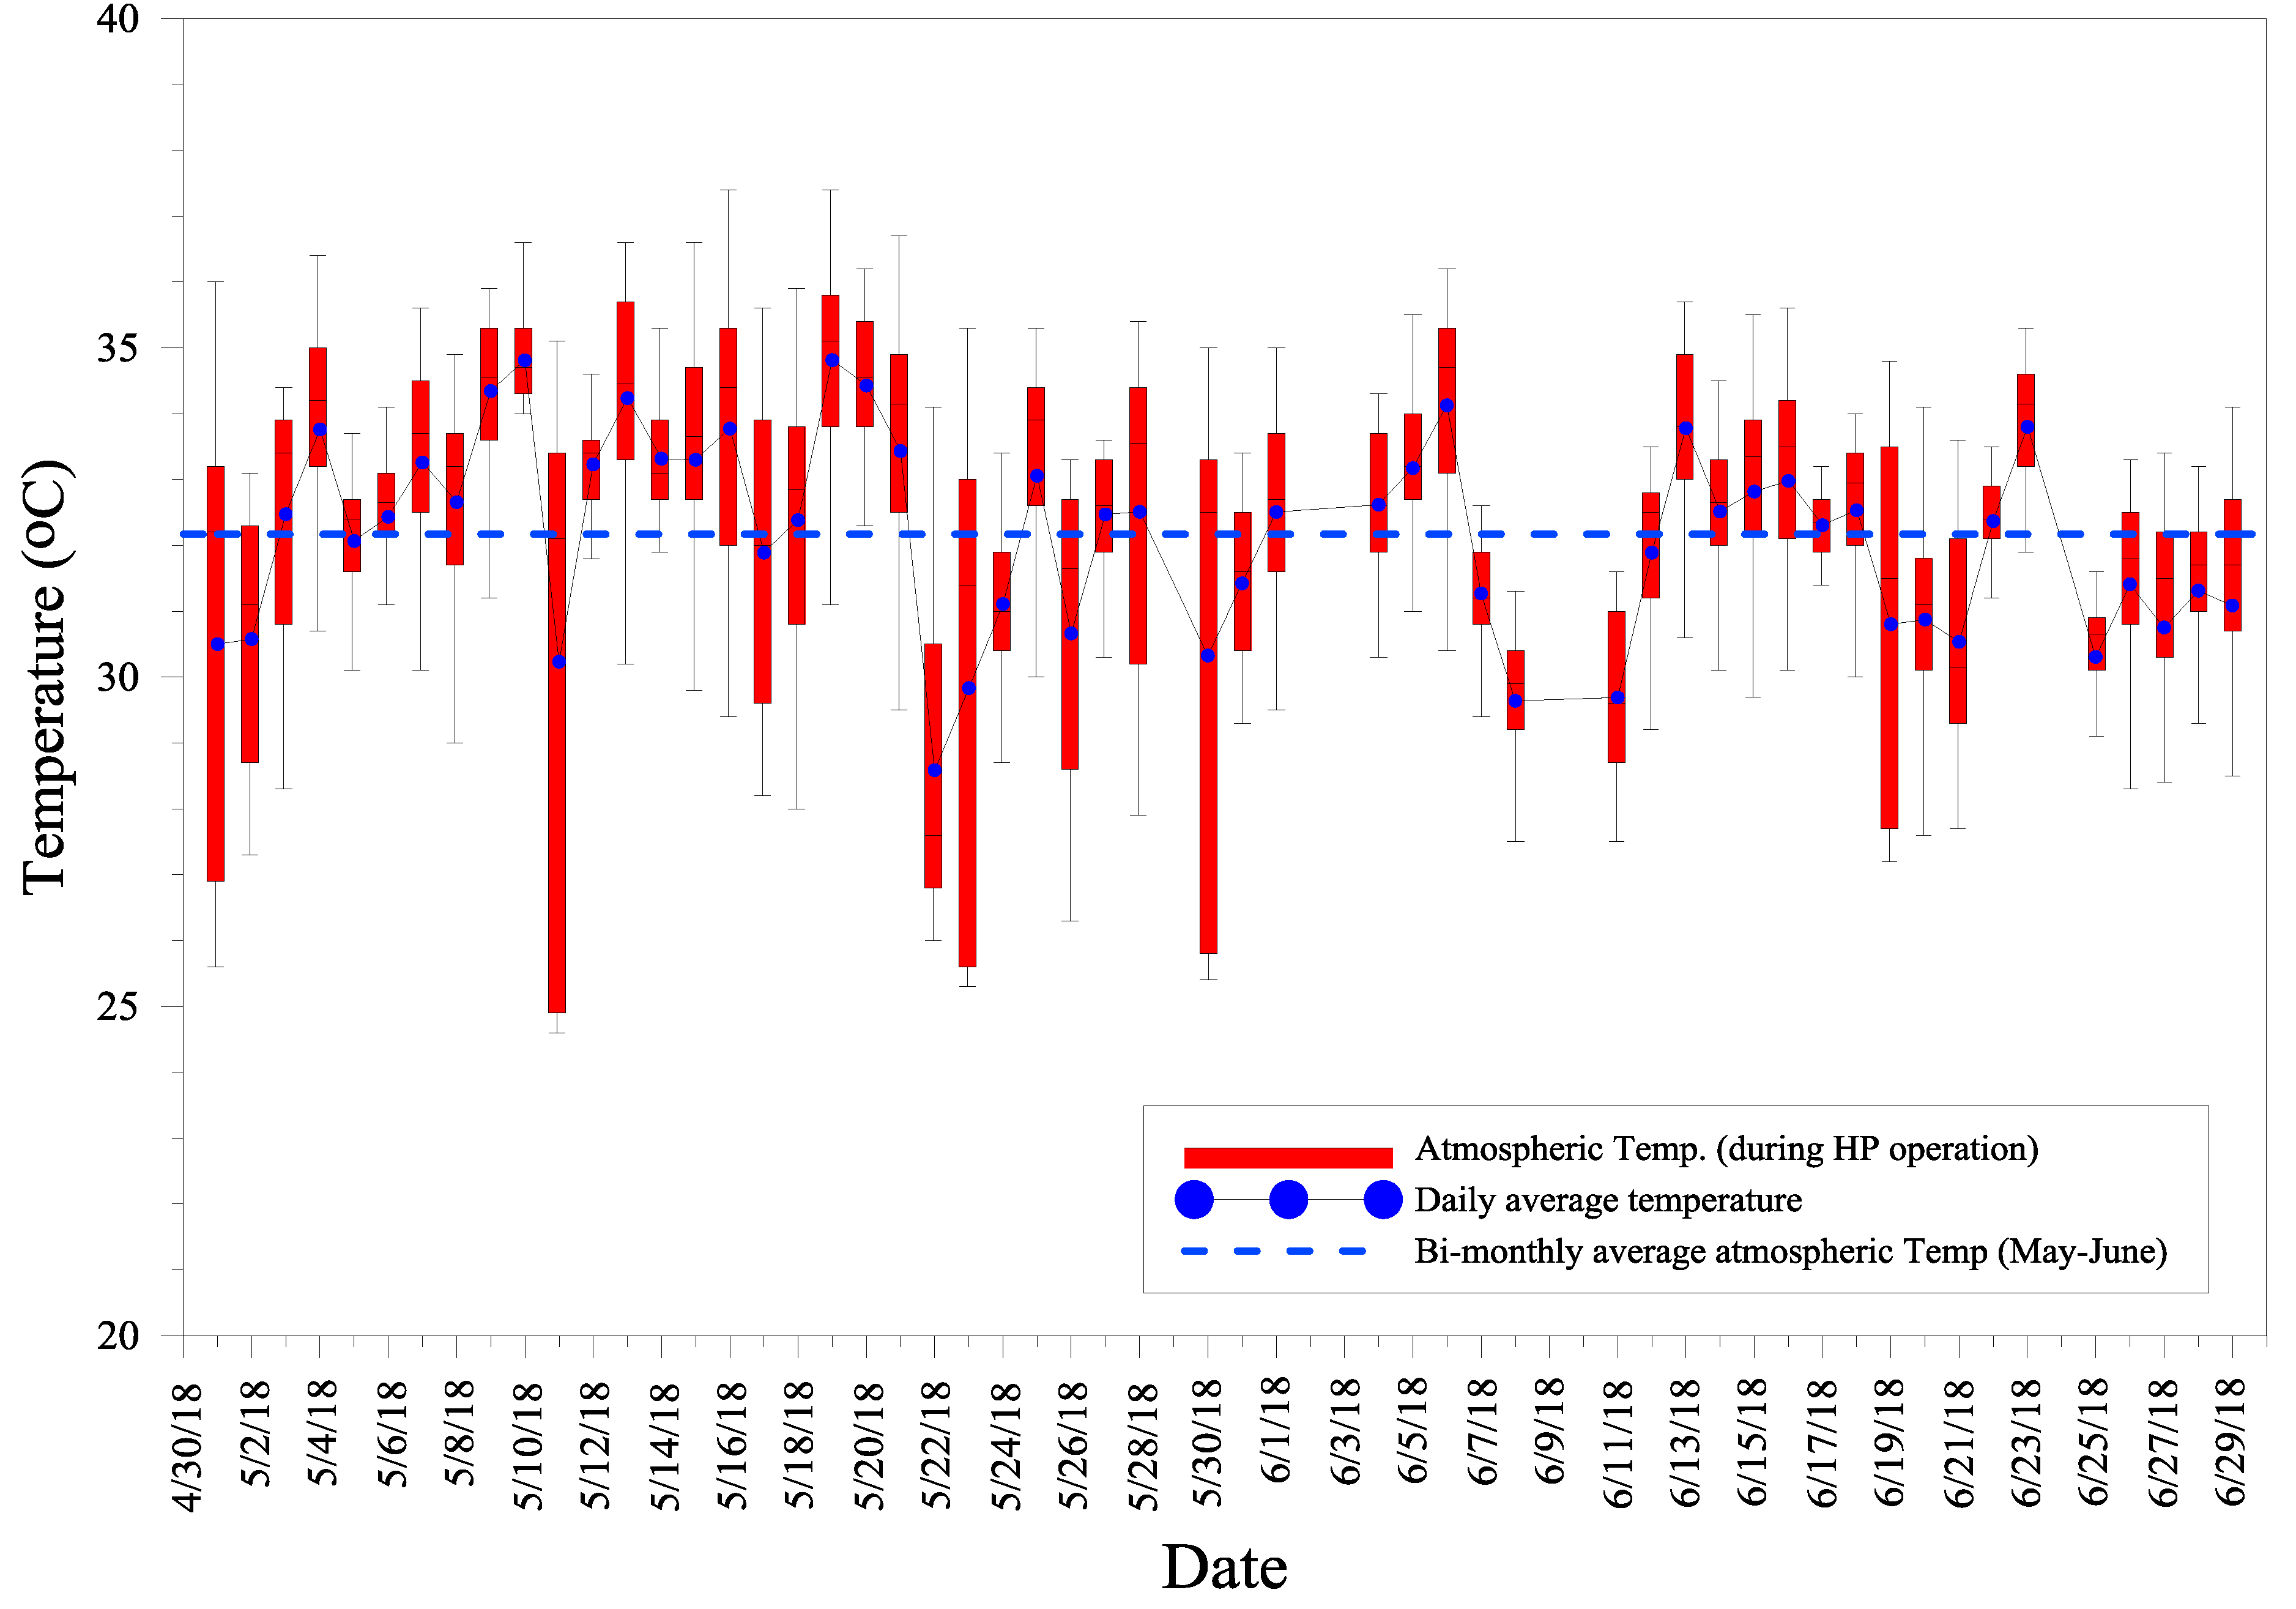
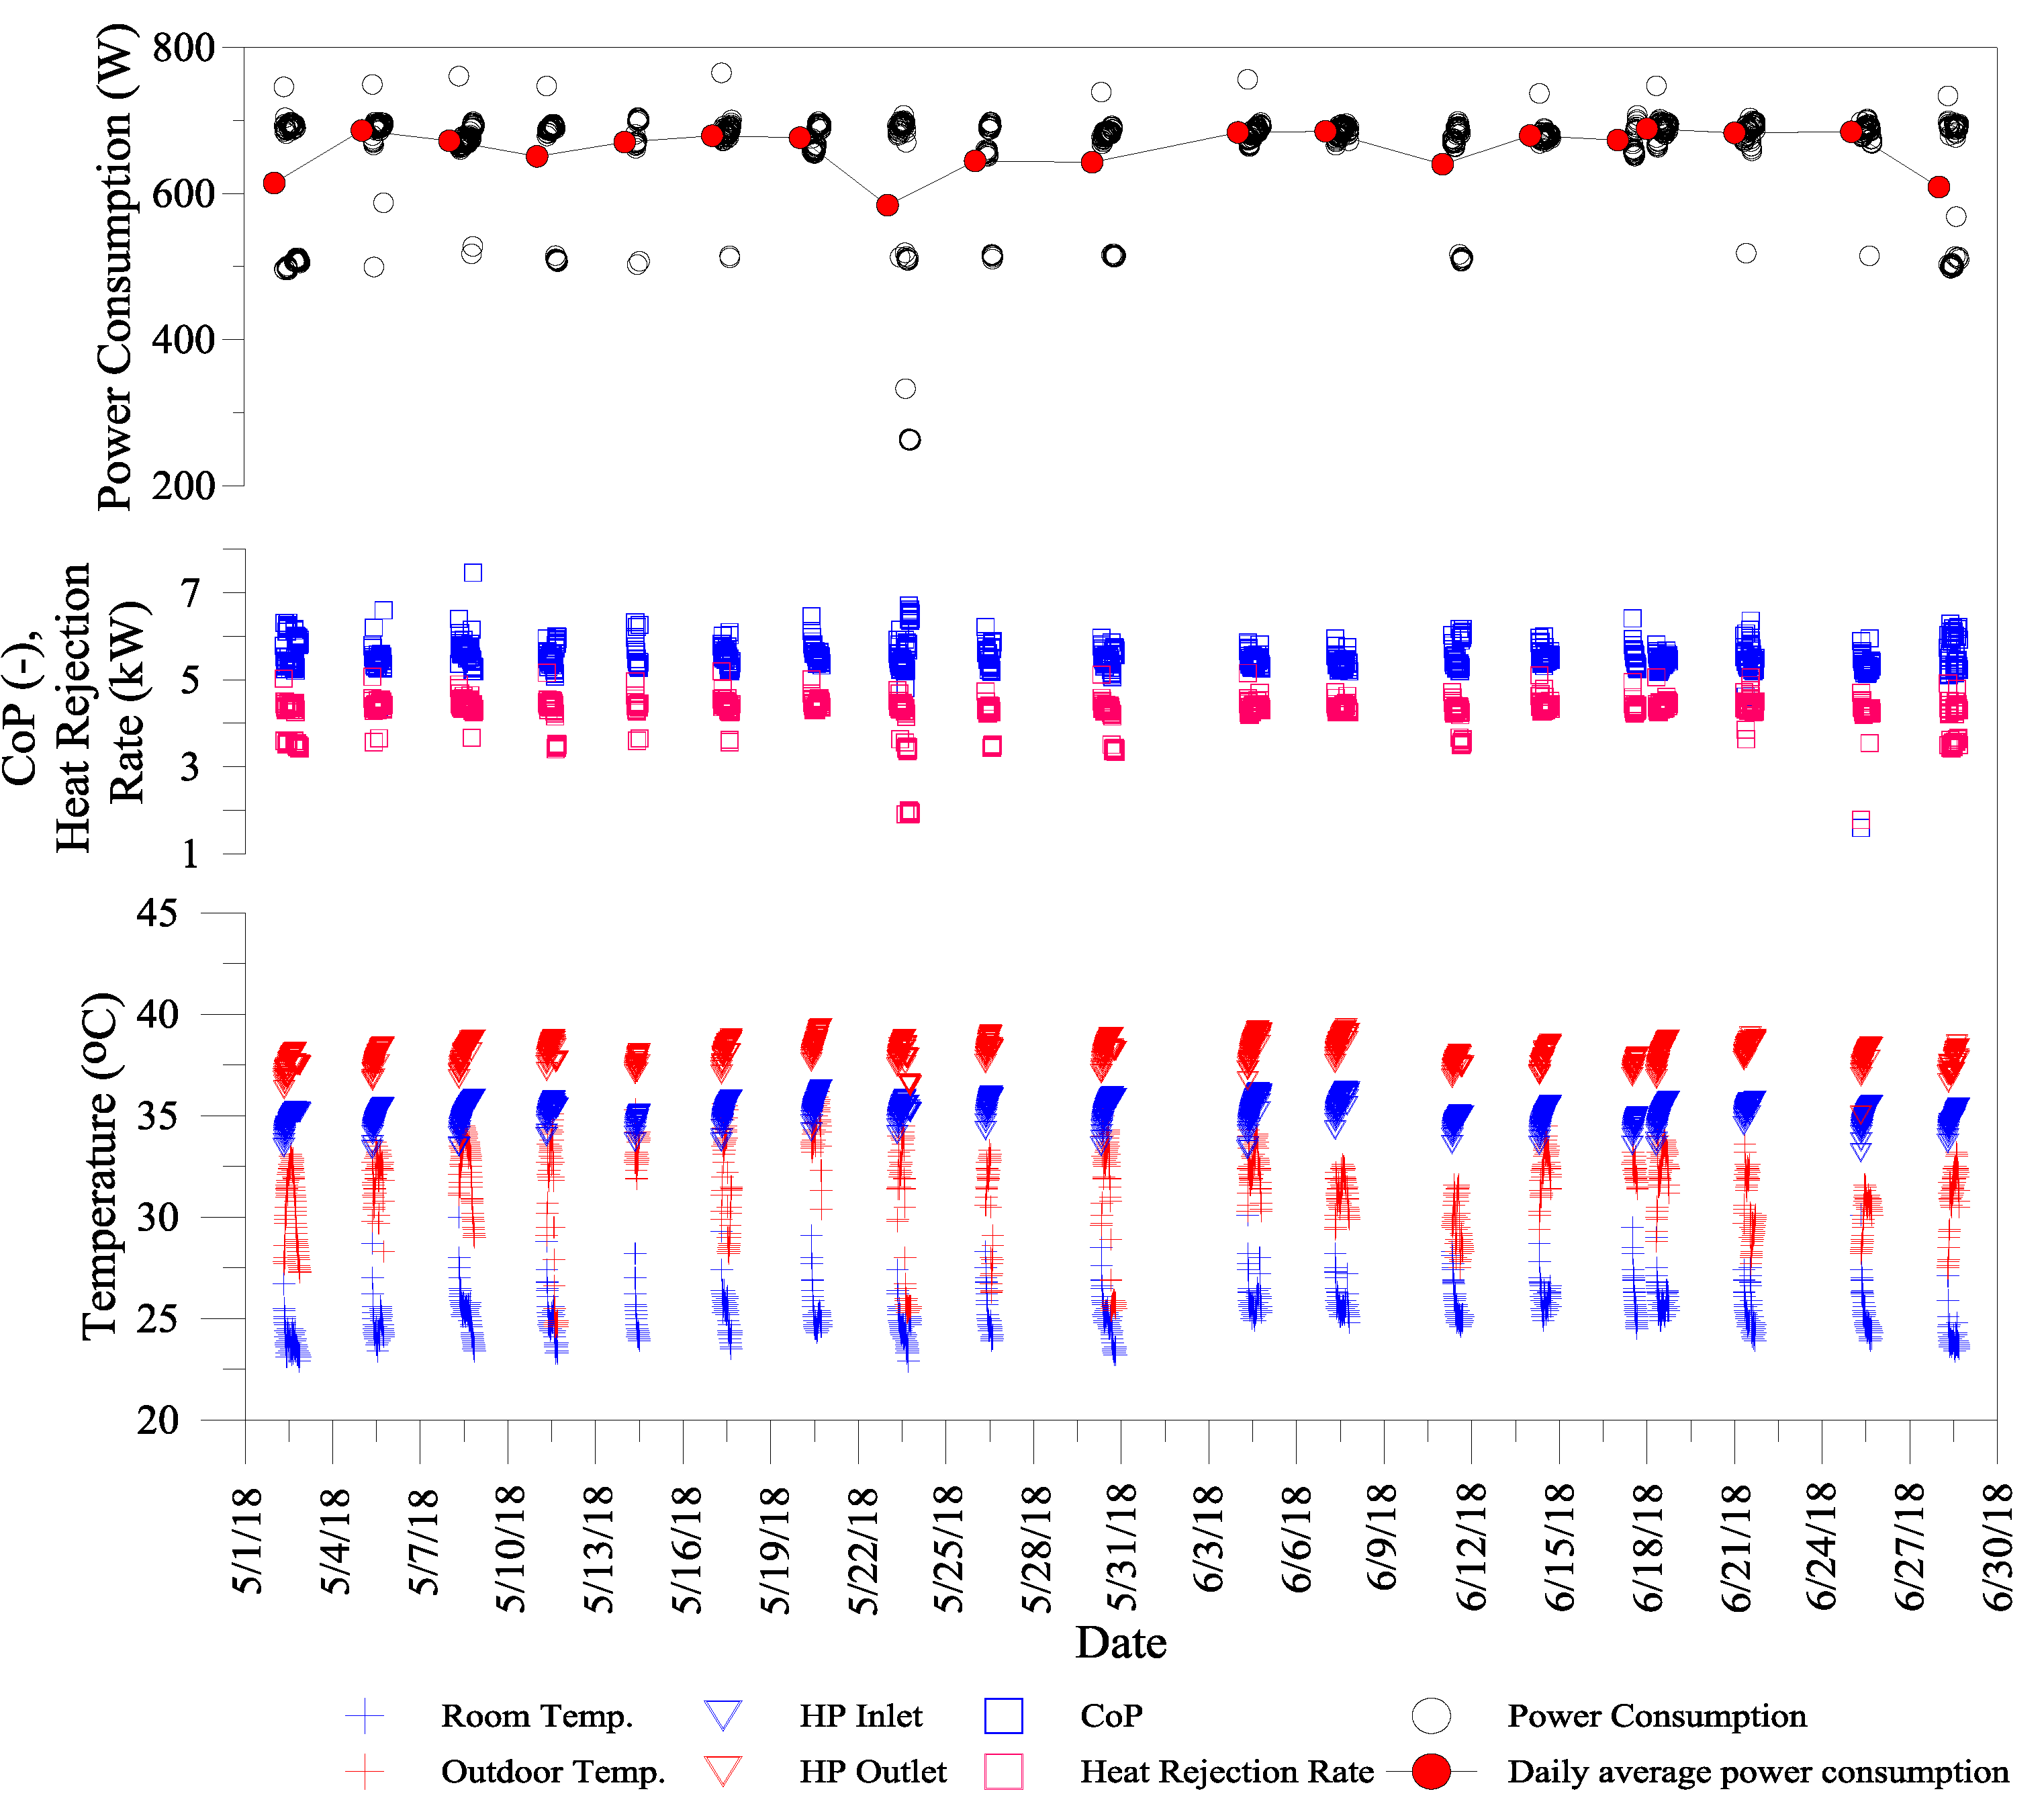
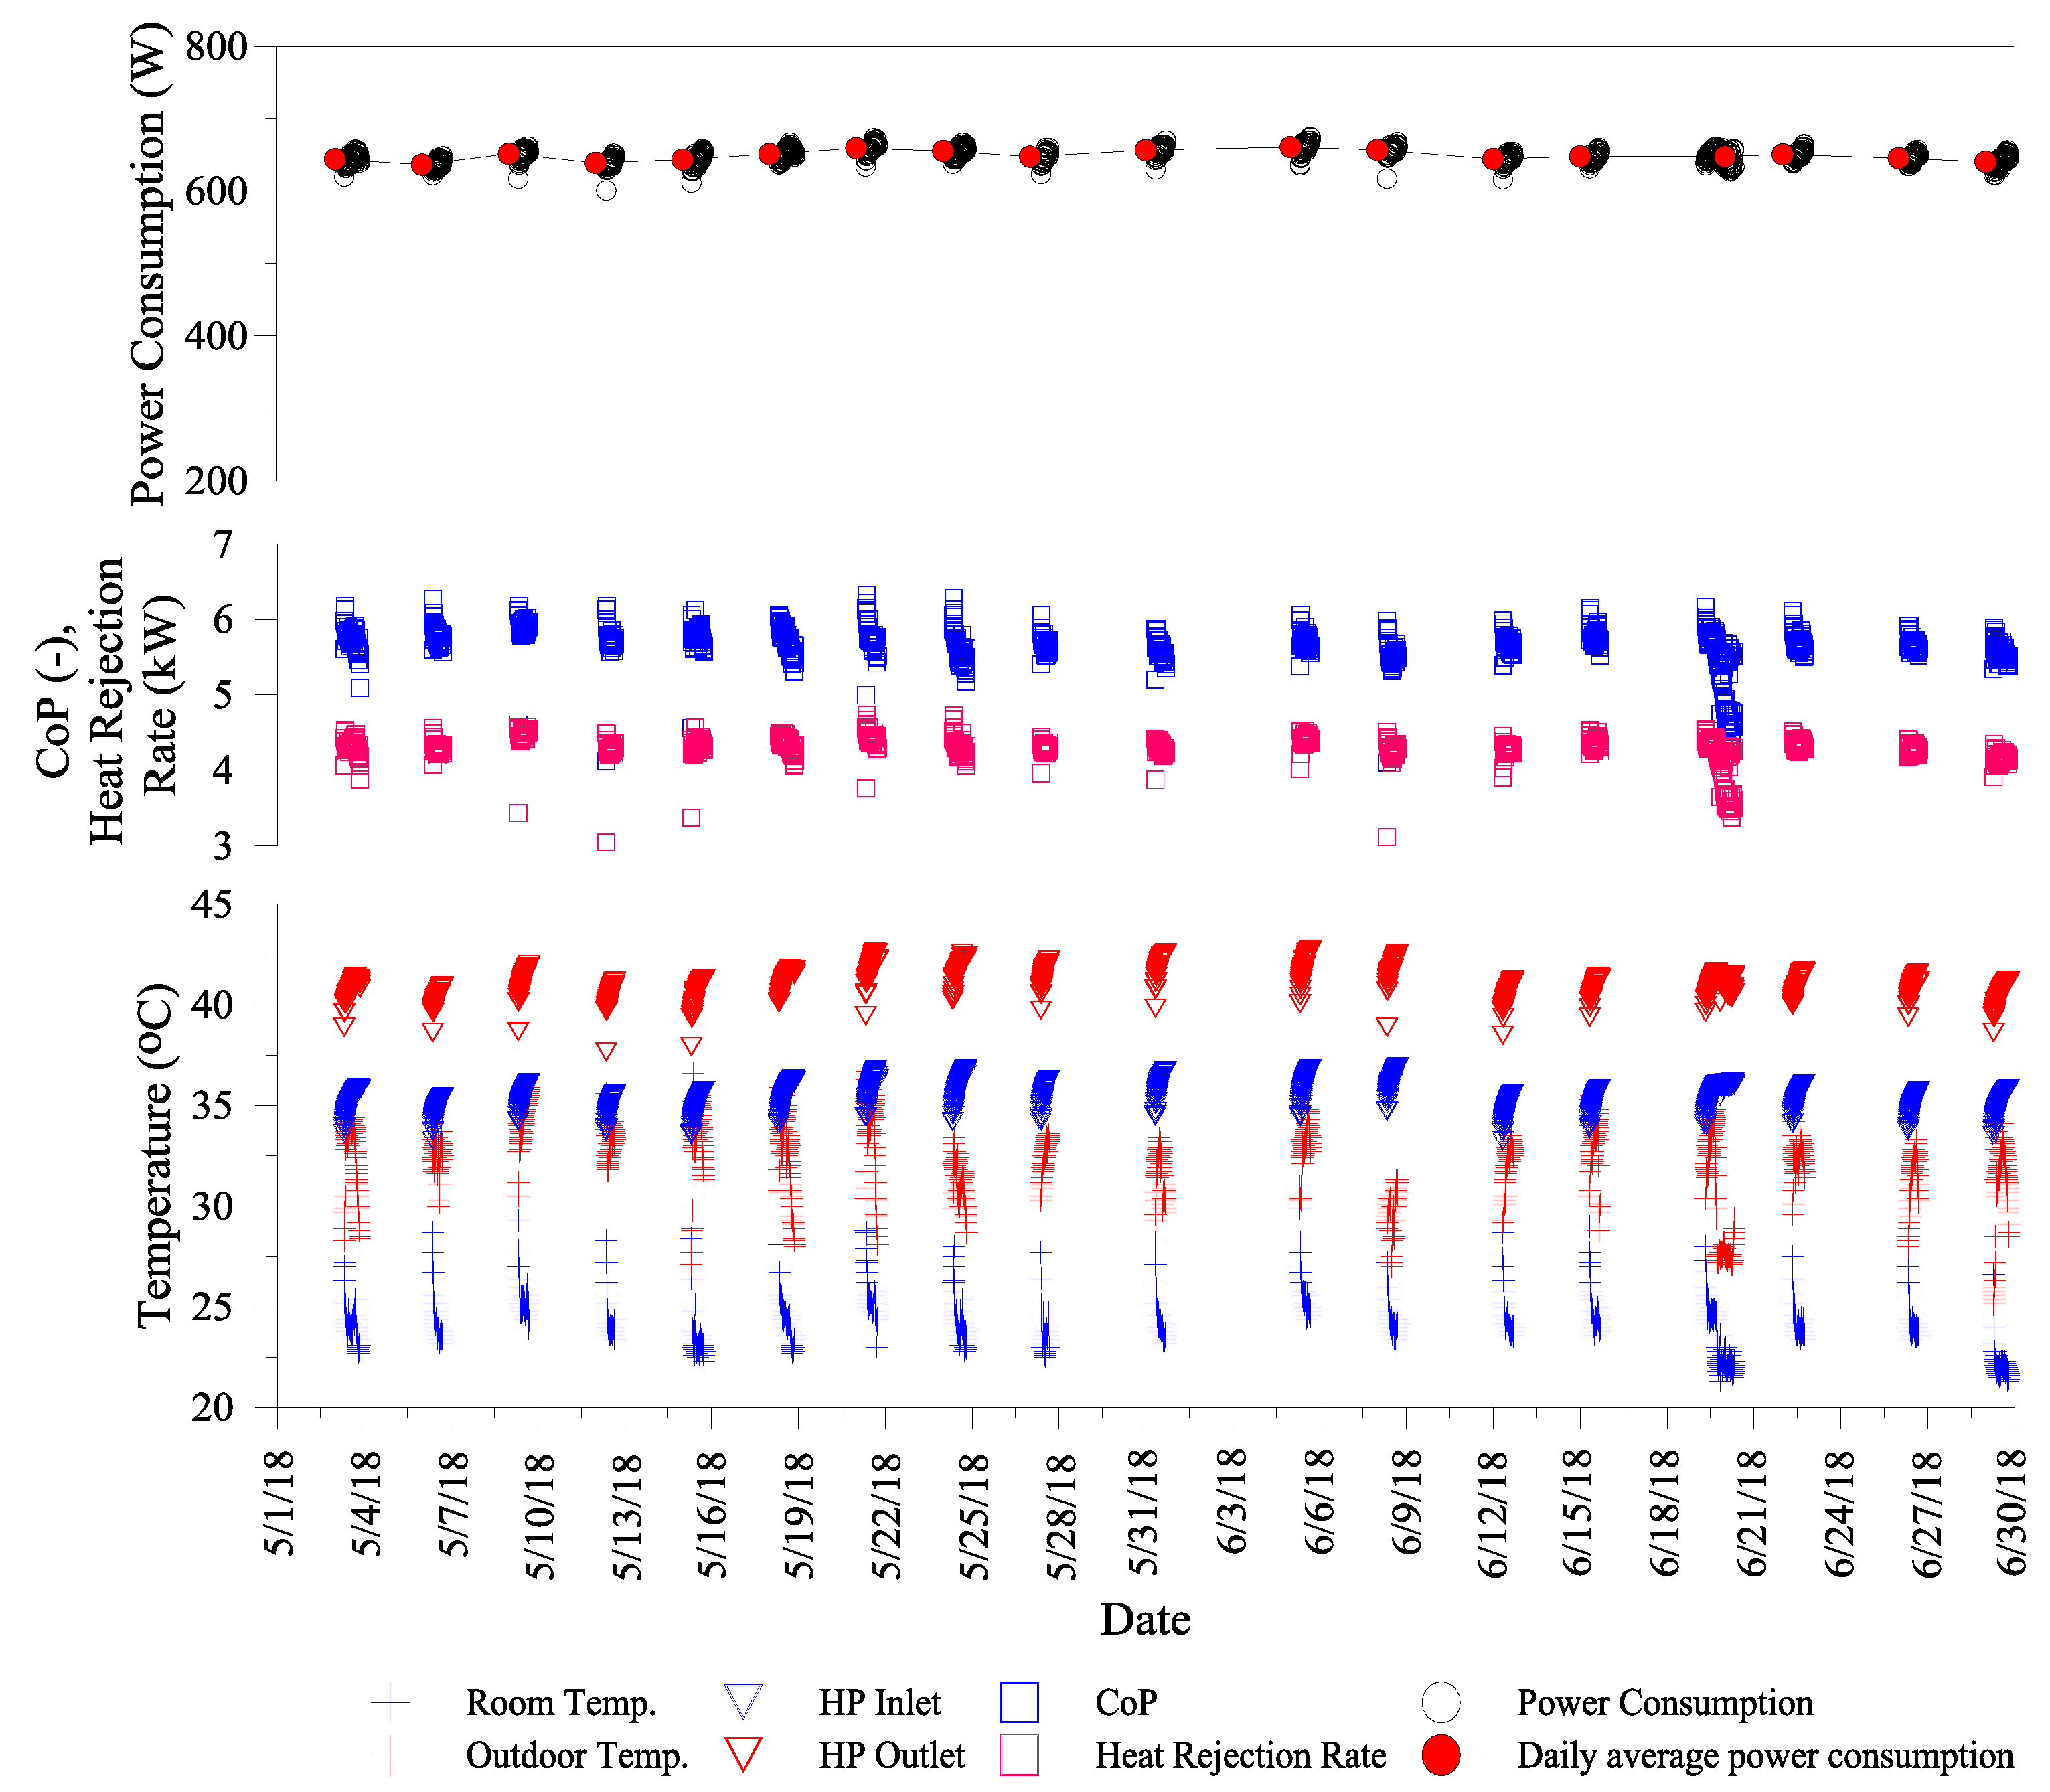
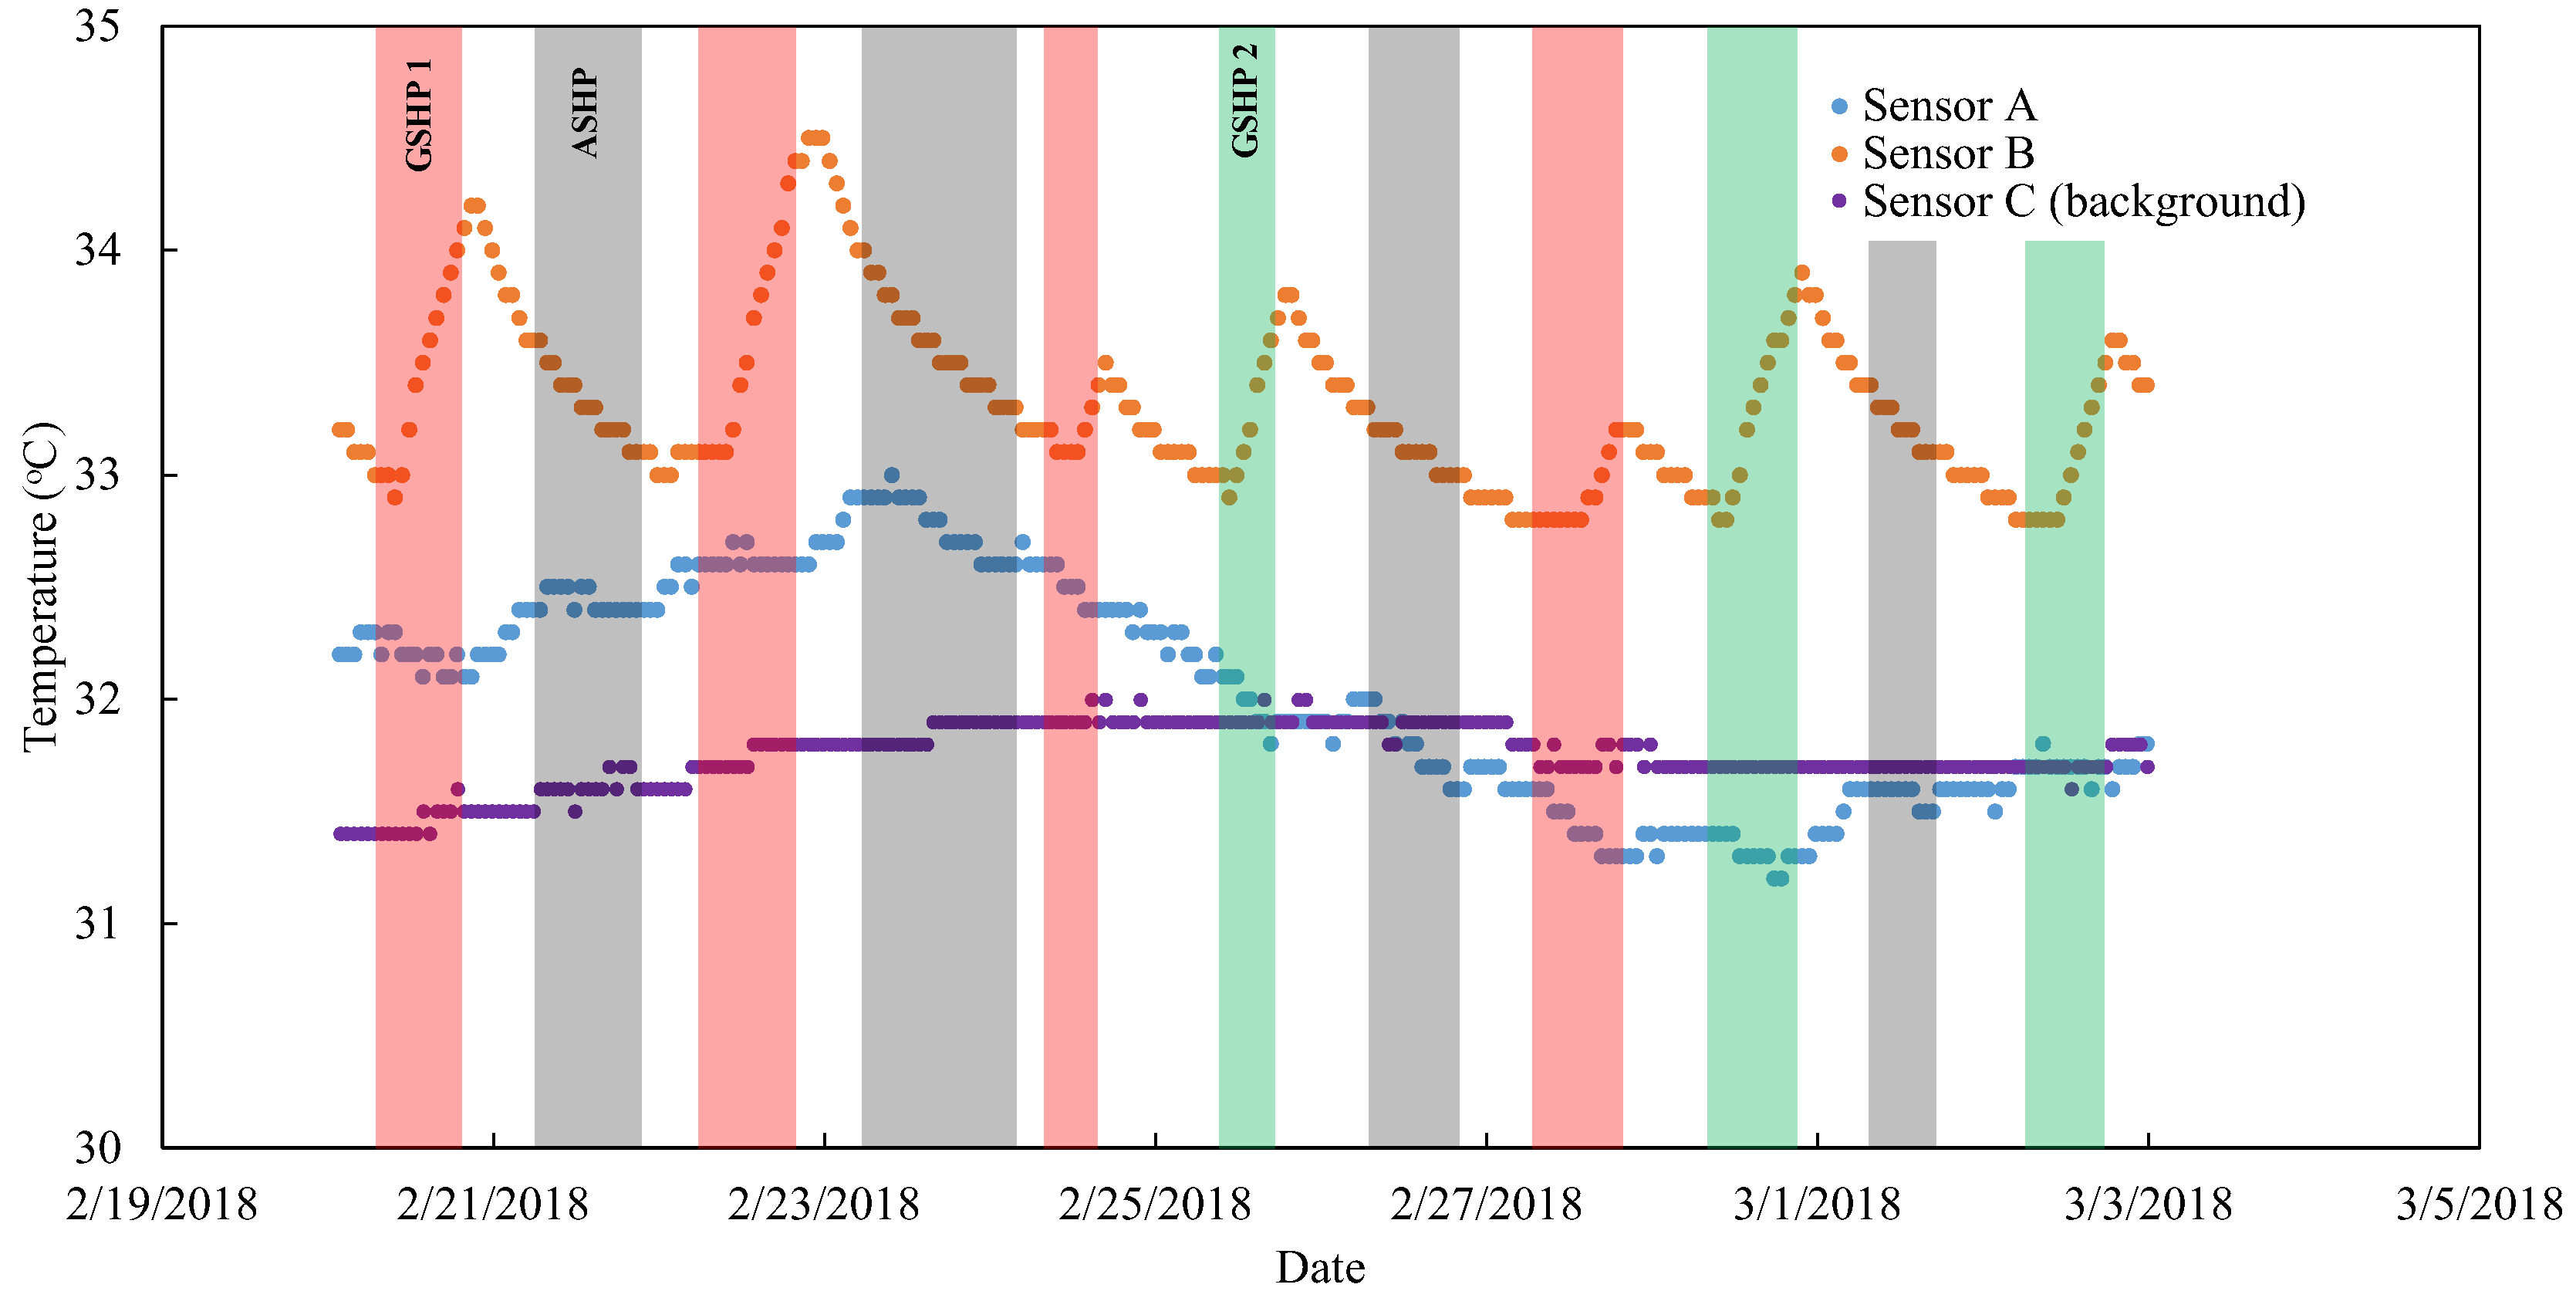
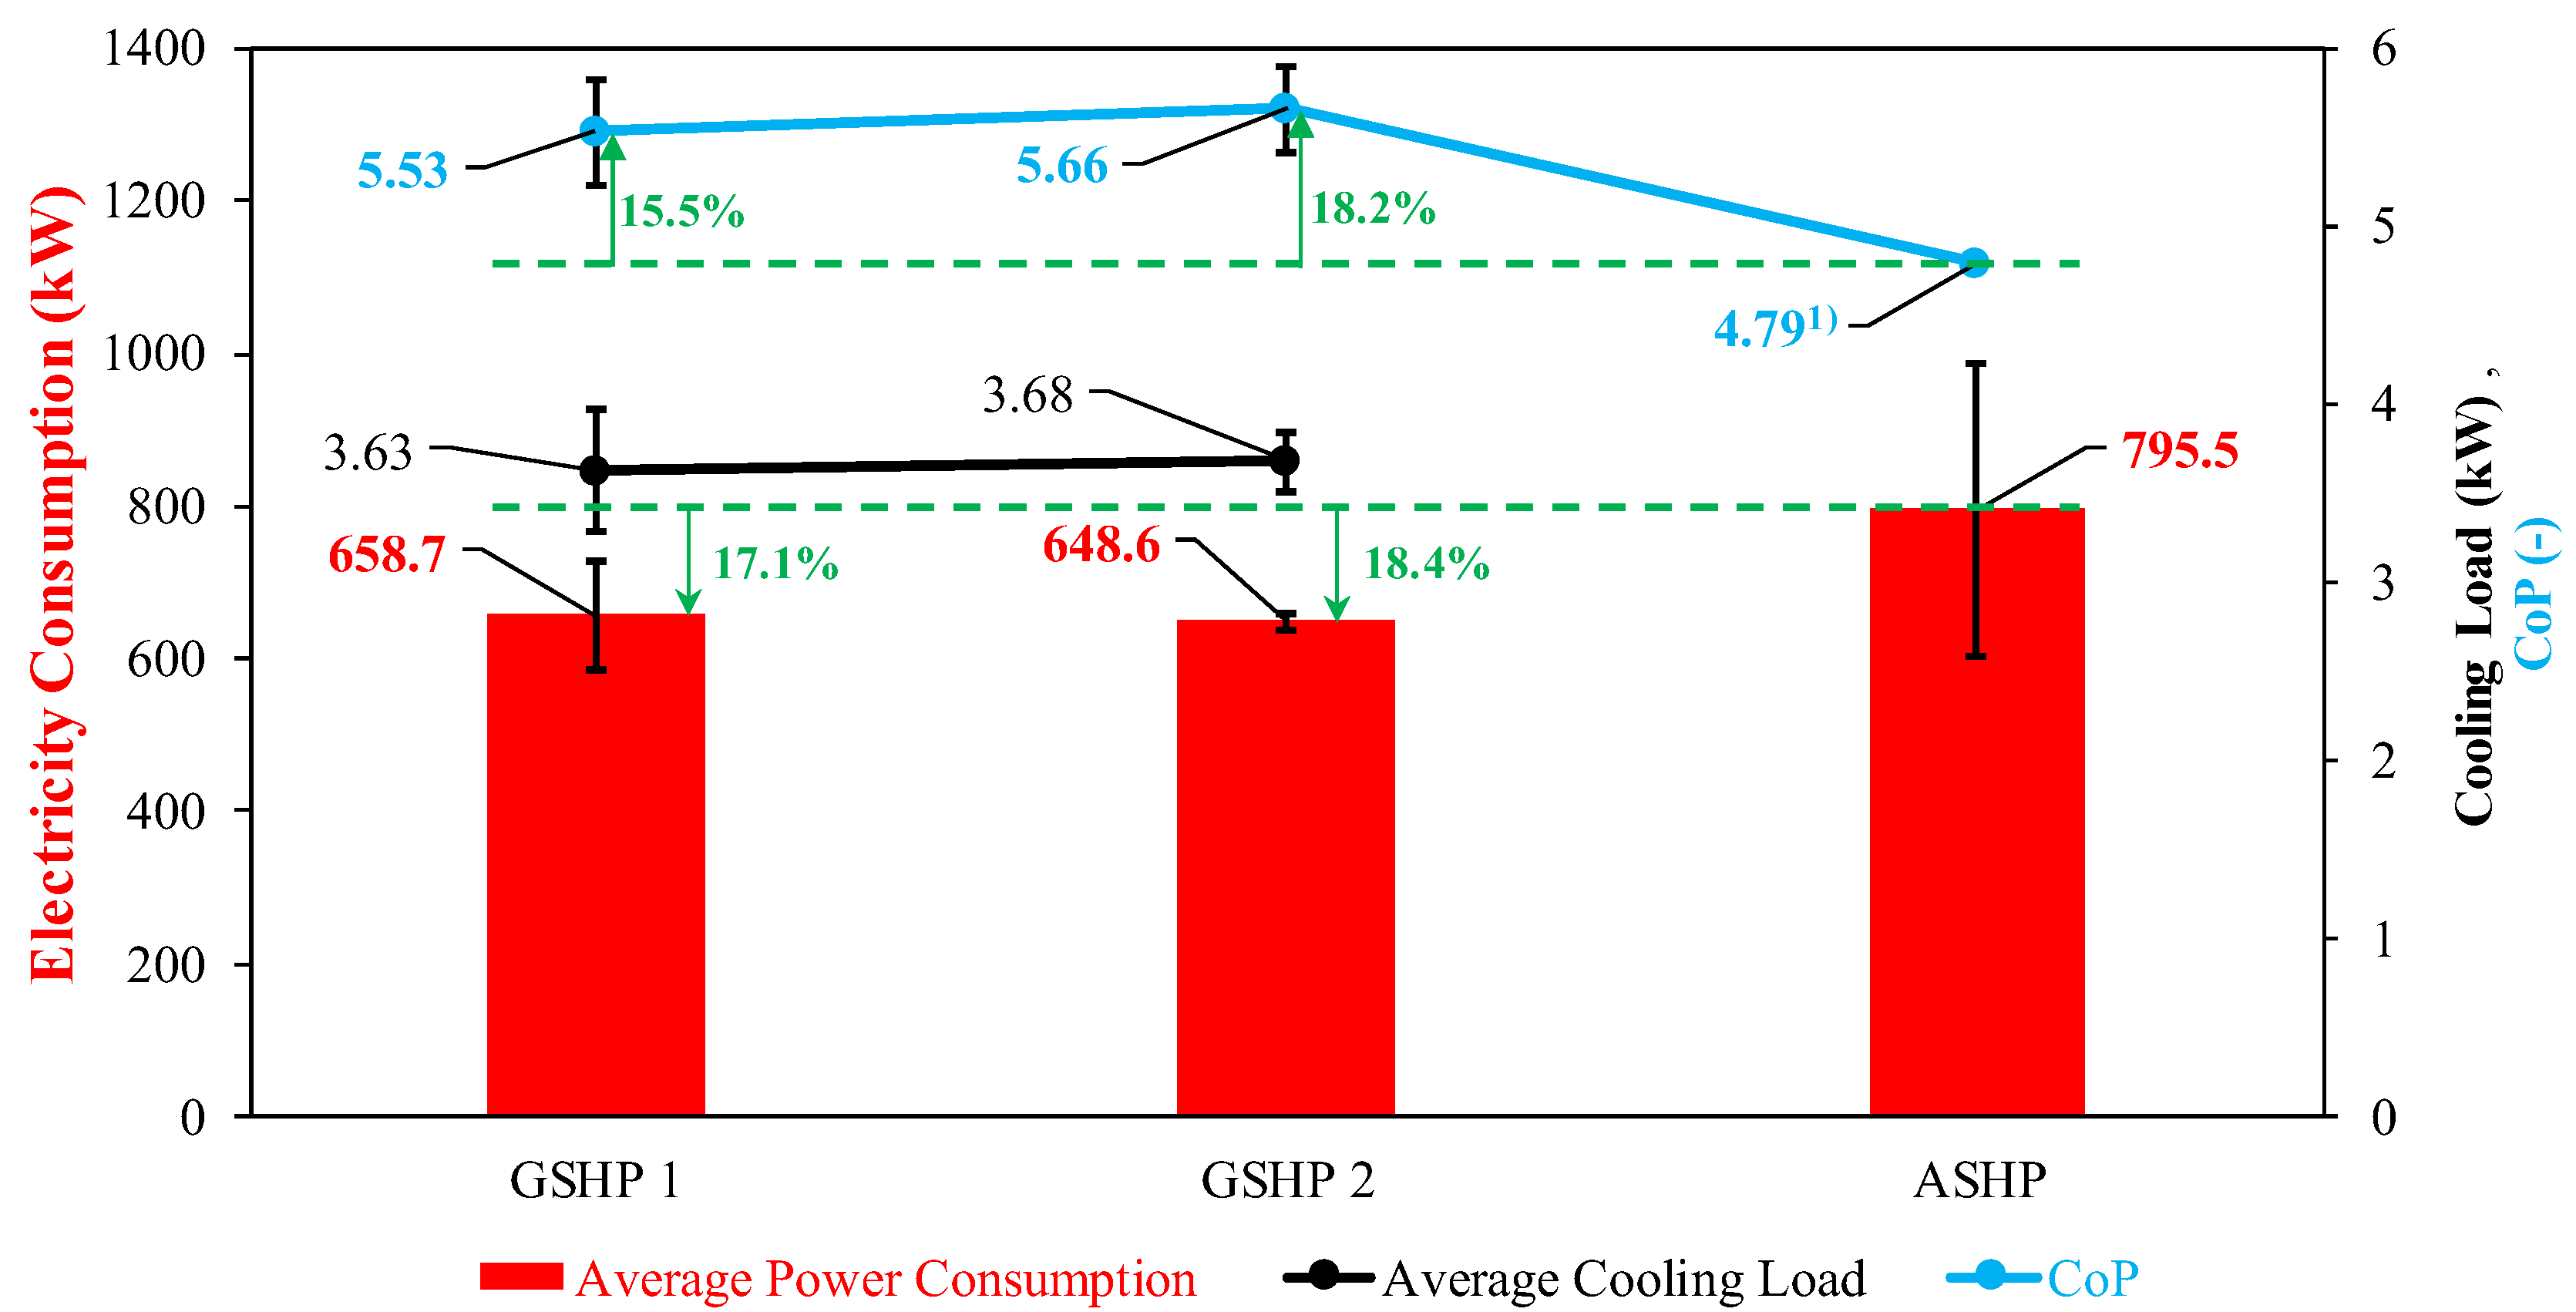
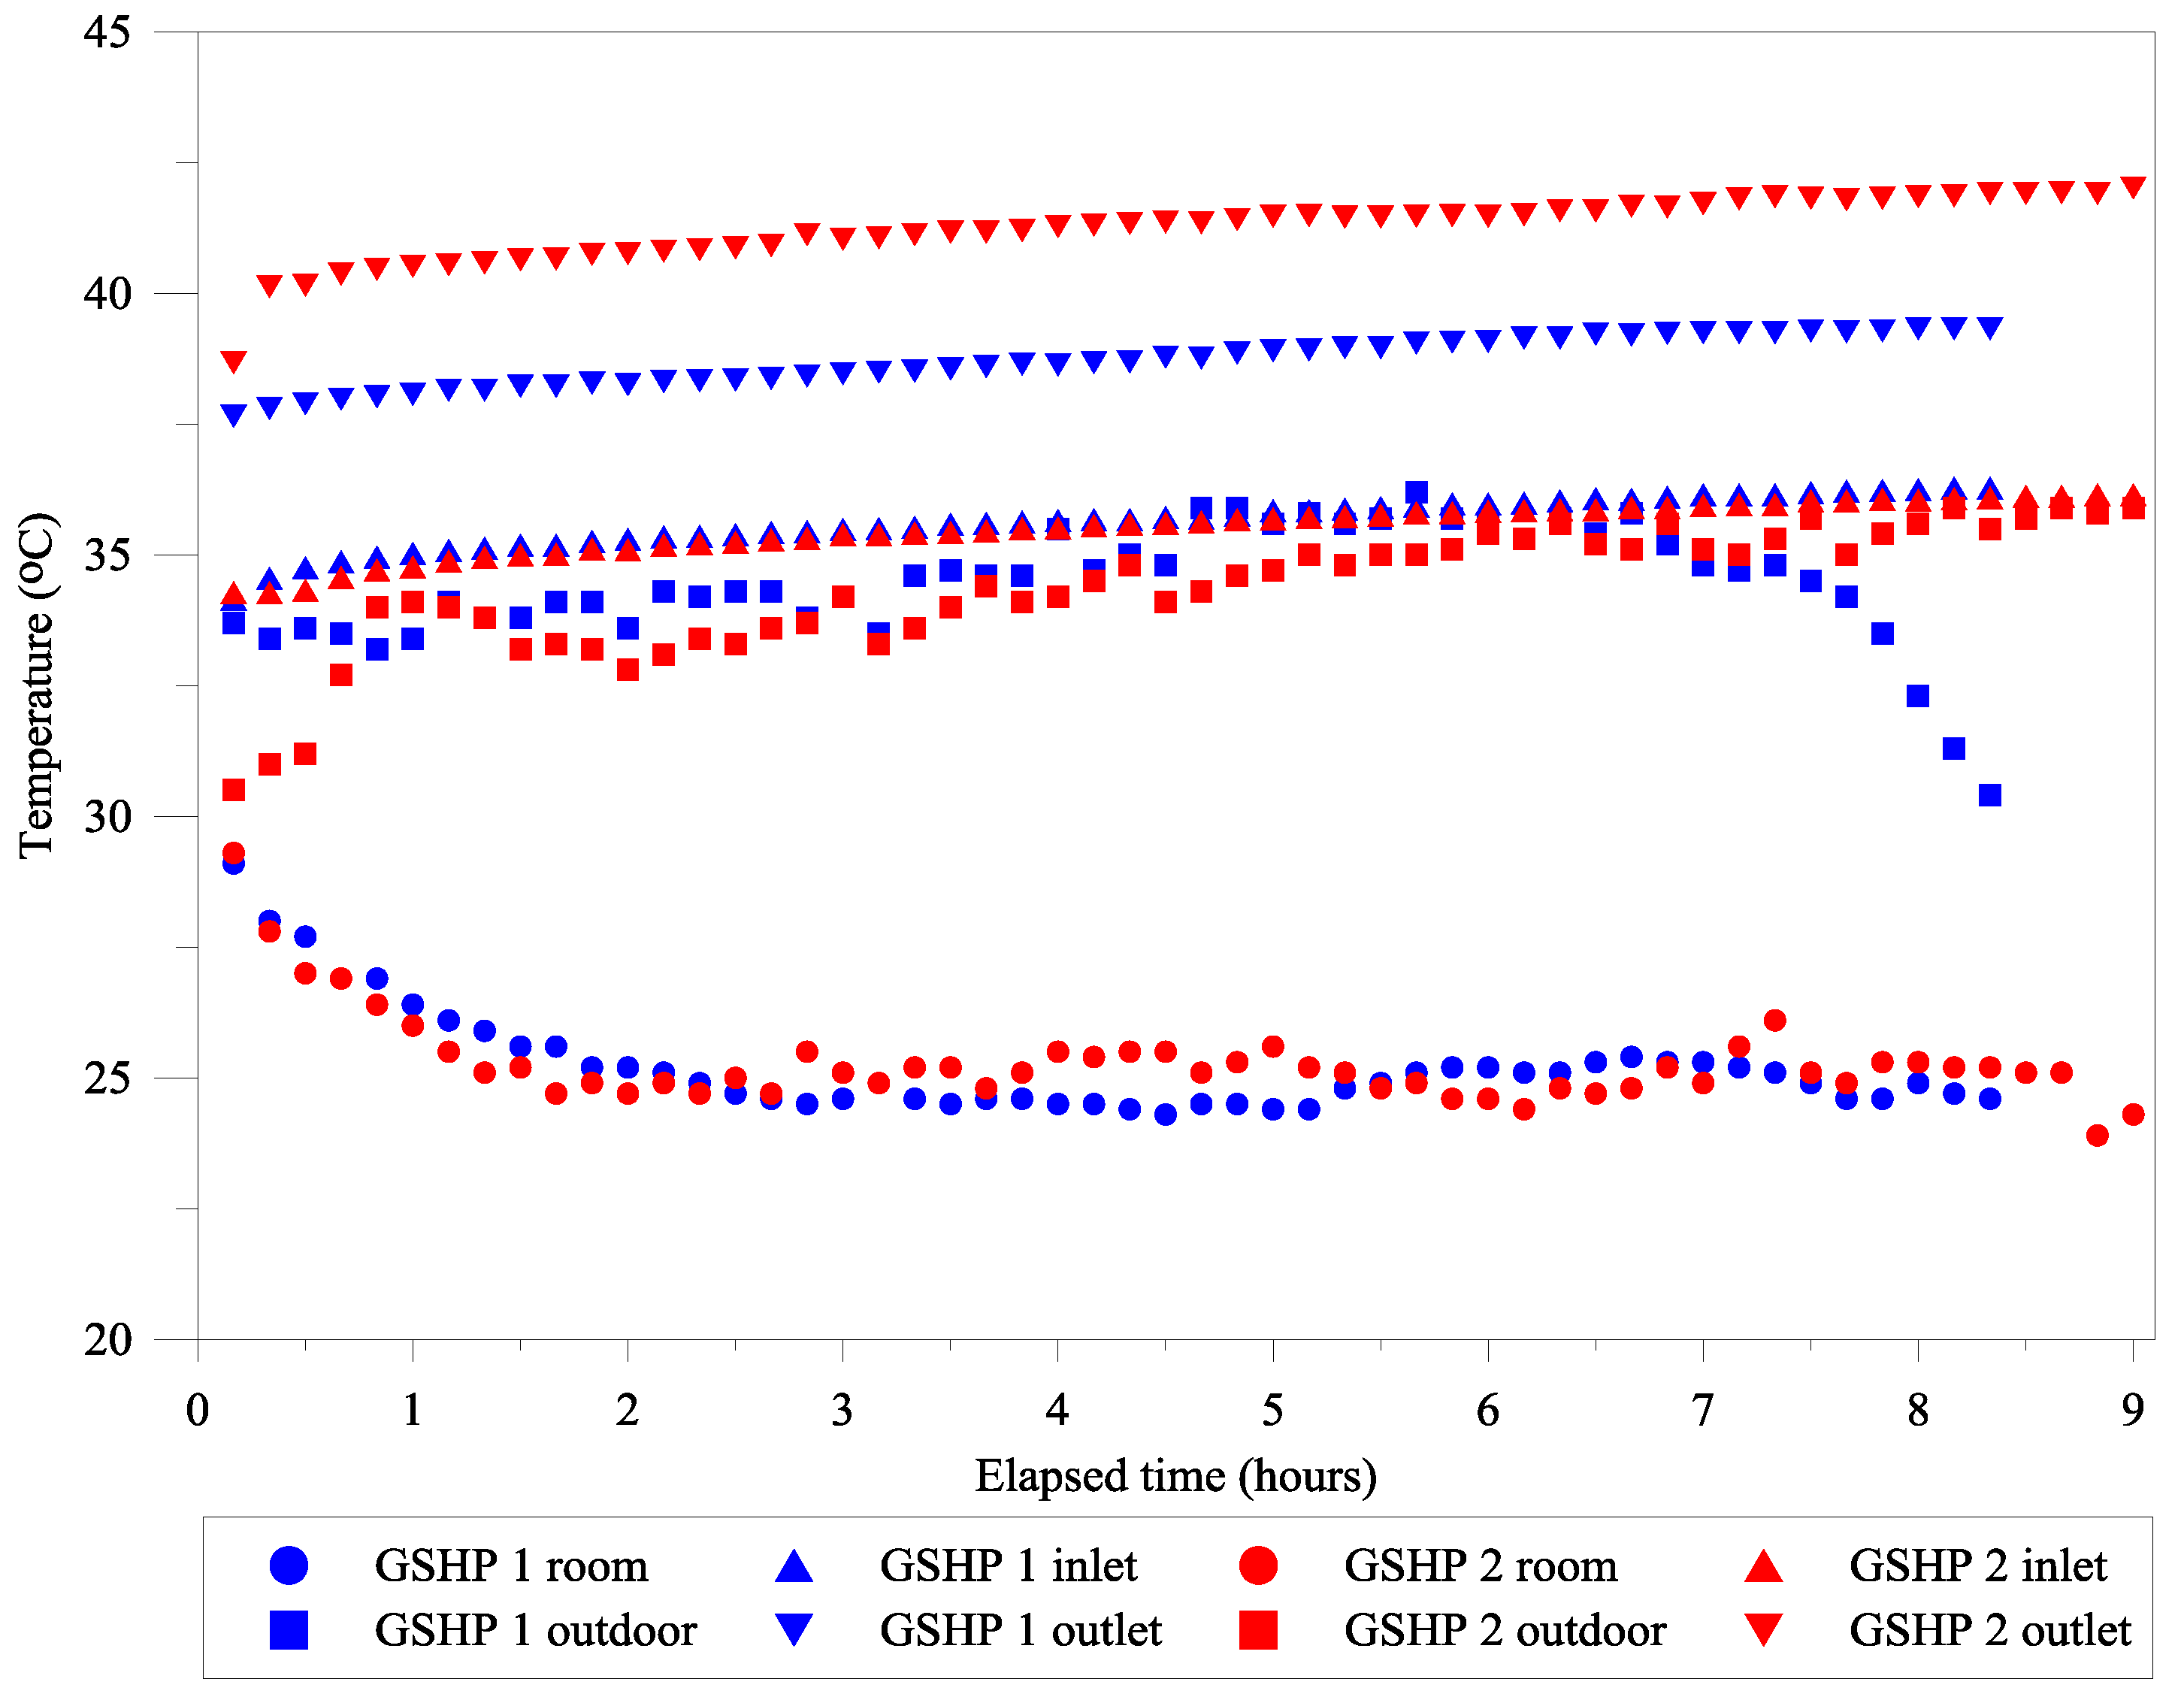
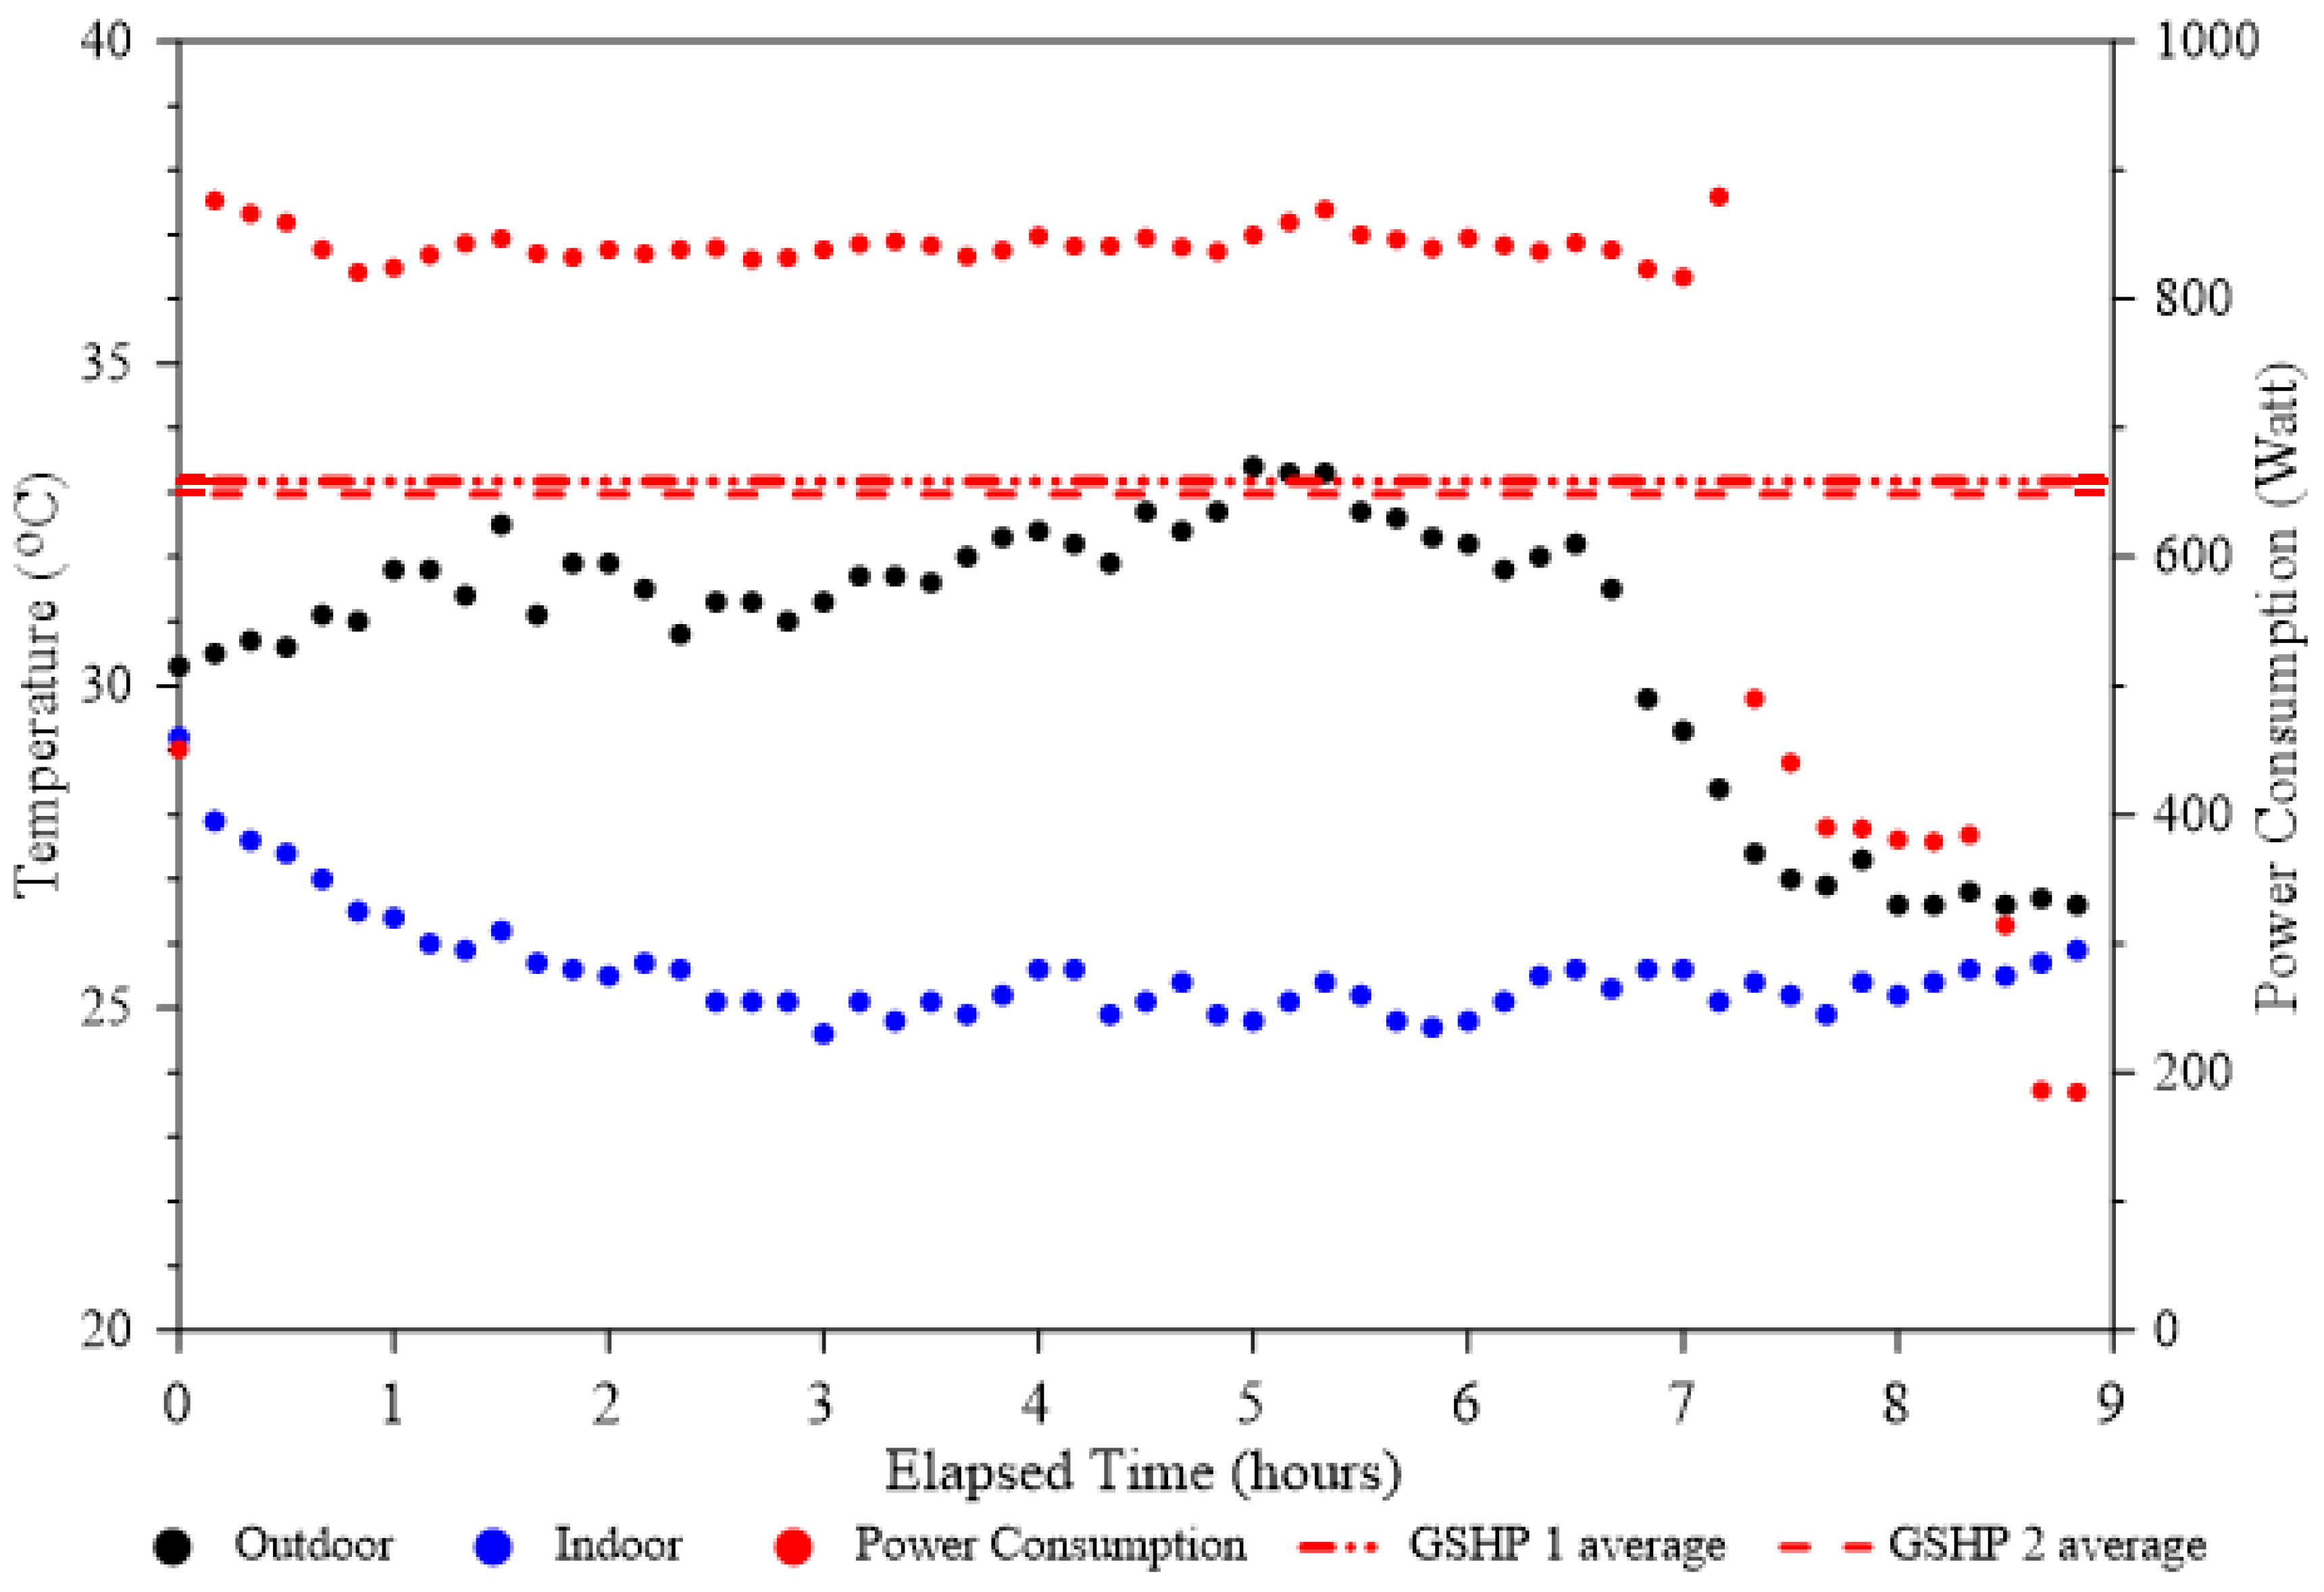
5.1. Experiment and Analysis

The heat pump performance data presented in this paper were recorded during May–June 2018. The heat pumps were used for intermittent cooling during the operational period.
Figure 9 shows that the temperature was highest in April, while May and June are among the hottest months of the year. Meanwhile, the rainfall and humidity were highest in September. This suggests that the thermal loads of heat pumps vary through the year. There was a high sensible cooling load around April, and a high latent cooling load around September.
From May to June 2018, GSHP 1, GSHP 2, and the ASHP respectively, operated for 19, 18, and 17 days, with the daily average operational period being 9.6 hours; it should be noted that the start–stop schedule was not fixed at an exact time. The experiment was conducted on a daily basis during weekdays and sometimes during the weekend, in case the experimental room was being used. Apart from the automated logging system, personnel who turned the heat pumps on and off wrote down the start/stop time, as well as the analog energy meter readings in a logbook. The data gathered from the data logger were then cross-validated against the logbook data. The room temperature was set at a constant 25 °C for all heat pumps. The average heat exchange circulation flowrate of GSHP 2 was 11.56 L/min (= 1.92 × 10⁻⁴ m3/s), owing to the low-capacity circulation pump, in contrast to 22.27 L/min (= 3.71 × 10⁻⁴ m3/s) for GSHP 1. Figure 10 shows the variation in the outdoor temperature during the operational time. Average operational temperatures were 32.4 and 31.9 °C for May and June, respectively.
The logged temperatures and power consumption during the operation of GSHP 1, GSHP 2, and the ASHP are presented in Figure 11, Figure 12 and Figure 13. In addition to ASHP data, calculations of the CoP and heat rejection rate are shown. A comparison of the performances of GSHP 1 and GSHP 2 reveals that even though the circulation flow rate of GSHP 1 was half that of GSHP 2, there was no appreciable difference in the heat rejection rate—i.e., 4.26 kW for GSHP 1 versus 4.29 kW for GSHP 2. This is attributed to differences in the inlet and outlet temperatures of the GSHPs.
Further analysis indicates that for two months of operation, during which GSHPs were used for 37 days, there was no increase in the daily final inlet temperature. This suggests that there was no long-term rise in the background temperature, at least during the experimental period. Different inlet and outlet temperatures on GSHP operational days were simply due to different cooling loads resulting from variations in the outdoor temperature.
GSHP 1 and the ASHP showed scattered (wide range) values of power consumption, compared with steady values for GSHP 2. This was due to the ability of the inverter to regulate the compressor speed and precisely control the evaporator outlet temperature [48]. The variations can be explained by evaluating the standard deviations of the room temperature, power consumption, and heat rejection rate.
Figure 14 compares the performances of all heat pumps. Each error bar represents the standard deviation of data. The standard deviations of the power consumptions of GSHP 1 and the ASHP were larger, indicating larger variations, while the temperature data of GSHP 1 and the ASHP had smaller standard deviations in comparison with the standard deviations for GSHP 2. A comparison of the average electrical consumption shows that the GSHPs required less electrical input than the ASHP. The average electrical consumptions of GSHP 1 and GSHP 2 were 658.7 and 648.6 W, respectively, being 17.1% and 18.4% less, respectively, than the electrical consumption of 795.5 W for the ASHP.
The ASHP consumed more electricity than the GSHPs, with most of the data extending within 800 W or more. However, when the average outdoor temperature was low (e.g., see May 1, May 22, and June 27 in Figure 10 and Figure 13), the ASHP operated with low electric power, owing to the low cooling load and inverter control. The calculated cooling loads of the two GSHPs had similar values despite having different standard deviations. Furthermore, supposing that the average cooling load during the two-month period did not change greatly, the cooling load calculated for a GSHP (3.65 W) was used to estimate the CoP of the ASHP, as shown in Figure 14.
Figure 15 compares temperature data of GSHP 1 and GSHP 2 for similar operational outdoor temperatures (see also Figure 10) on May 20 and May 9, respectively. GSHP 1 operated for 8.33 hours, while GSHP 2 operated for 9 hours. GSHP 2 began operation earlier in the morning, while GSHP 1 stopped operation later in the evening. This can be seen from the low outdoor temperature of GSHP 2 at the beginning of operation, in contrast to the low outdoor temperature of GSHP 1 at the end of operation. The results reveal that the outlet temperature of GSHP 2 was higher than that of GSHP 1, although the operating conditions were nearly the same. The inlet and outlet temperatures of the two systems rose over time, following a similar linear trend. It is interesting that even though the outlet temperature of GSHP 2 was roughly 5 °C higher than that of GSHP 1, the difference in average power consumption for the two heat pumps was not great. From the current standpoint, bearing in mind that the current GHE circulation flow rate was low, a higher flow rate may be considered to increase the performance of GSHP 2.
Figure 16 shows the performance of the ASHP. During operation at a high outdoor temperature, the ASHP required a power input higher than the average power consumption of GSHP 1 and GSHP 2. However, as soon as the outdoor temperature dropped below 27.5 °C, after about 7 hours of operation, the power consumption fell below the average value for GSHP 1 and GSHP 2. This temperature range is a turning point, where one may consider that the application of a GSHP has no advantage over the application of an ASHP. There is a close relationship between thermal comfort and occupants’ psychological and physical considerations [49,50,51]. The personal comfort zone may thus be different from the standard definition of thermal comfort [5,8,51,52]. Studies focusing on indoor thermal comfort found that people living in the tropics tend to have an acceptable temperature comfort zone higher than that of ASHRAE standard 55 [5,50,52,53,54,55,56]. Thus, at this temperature, people may require only the circulation of air through the use of a fan to obtain an acceptable comfort level.

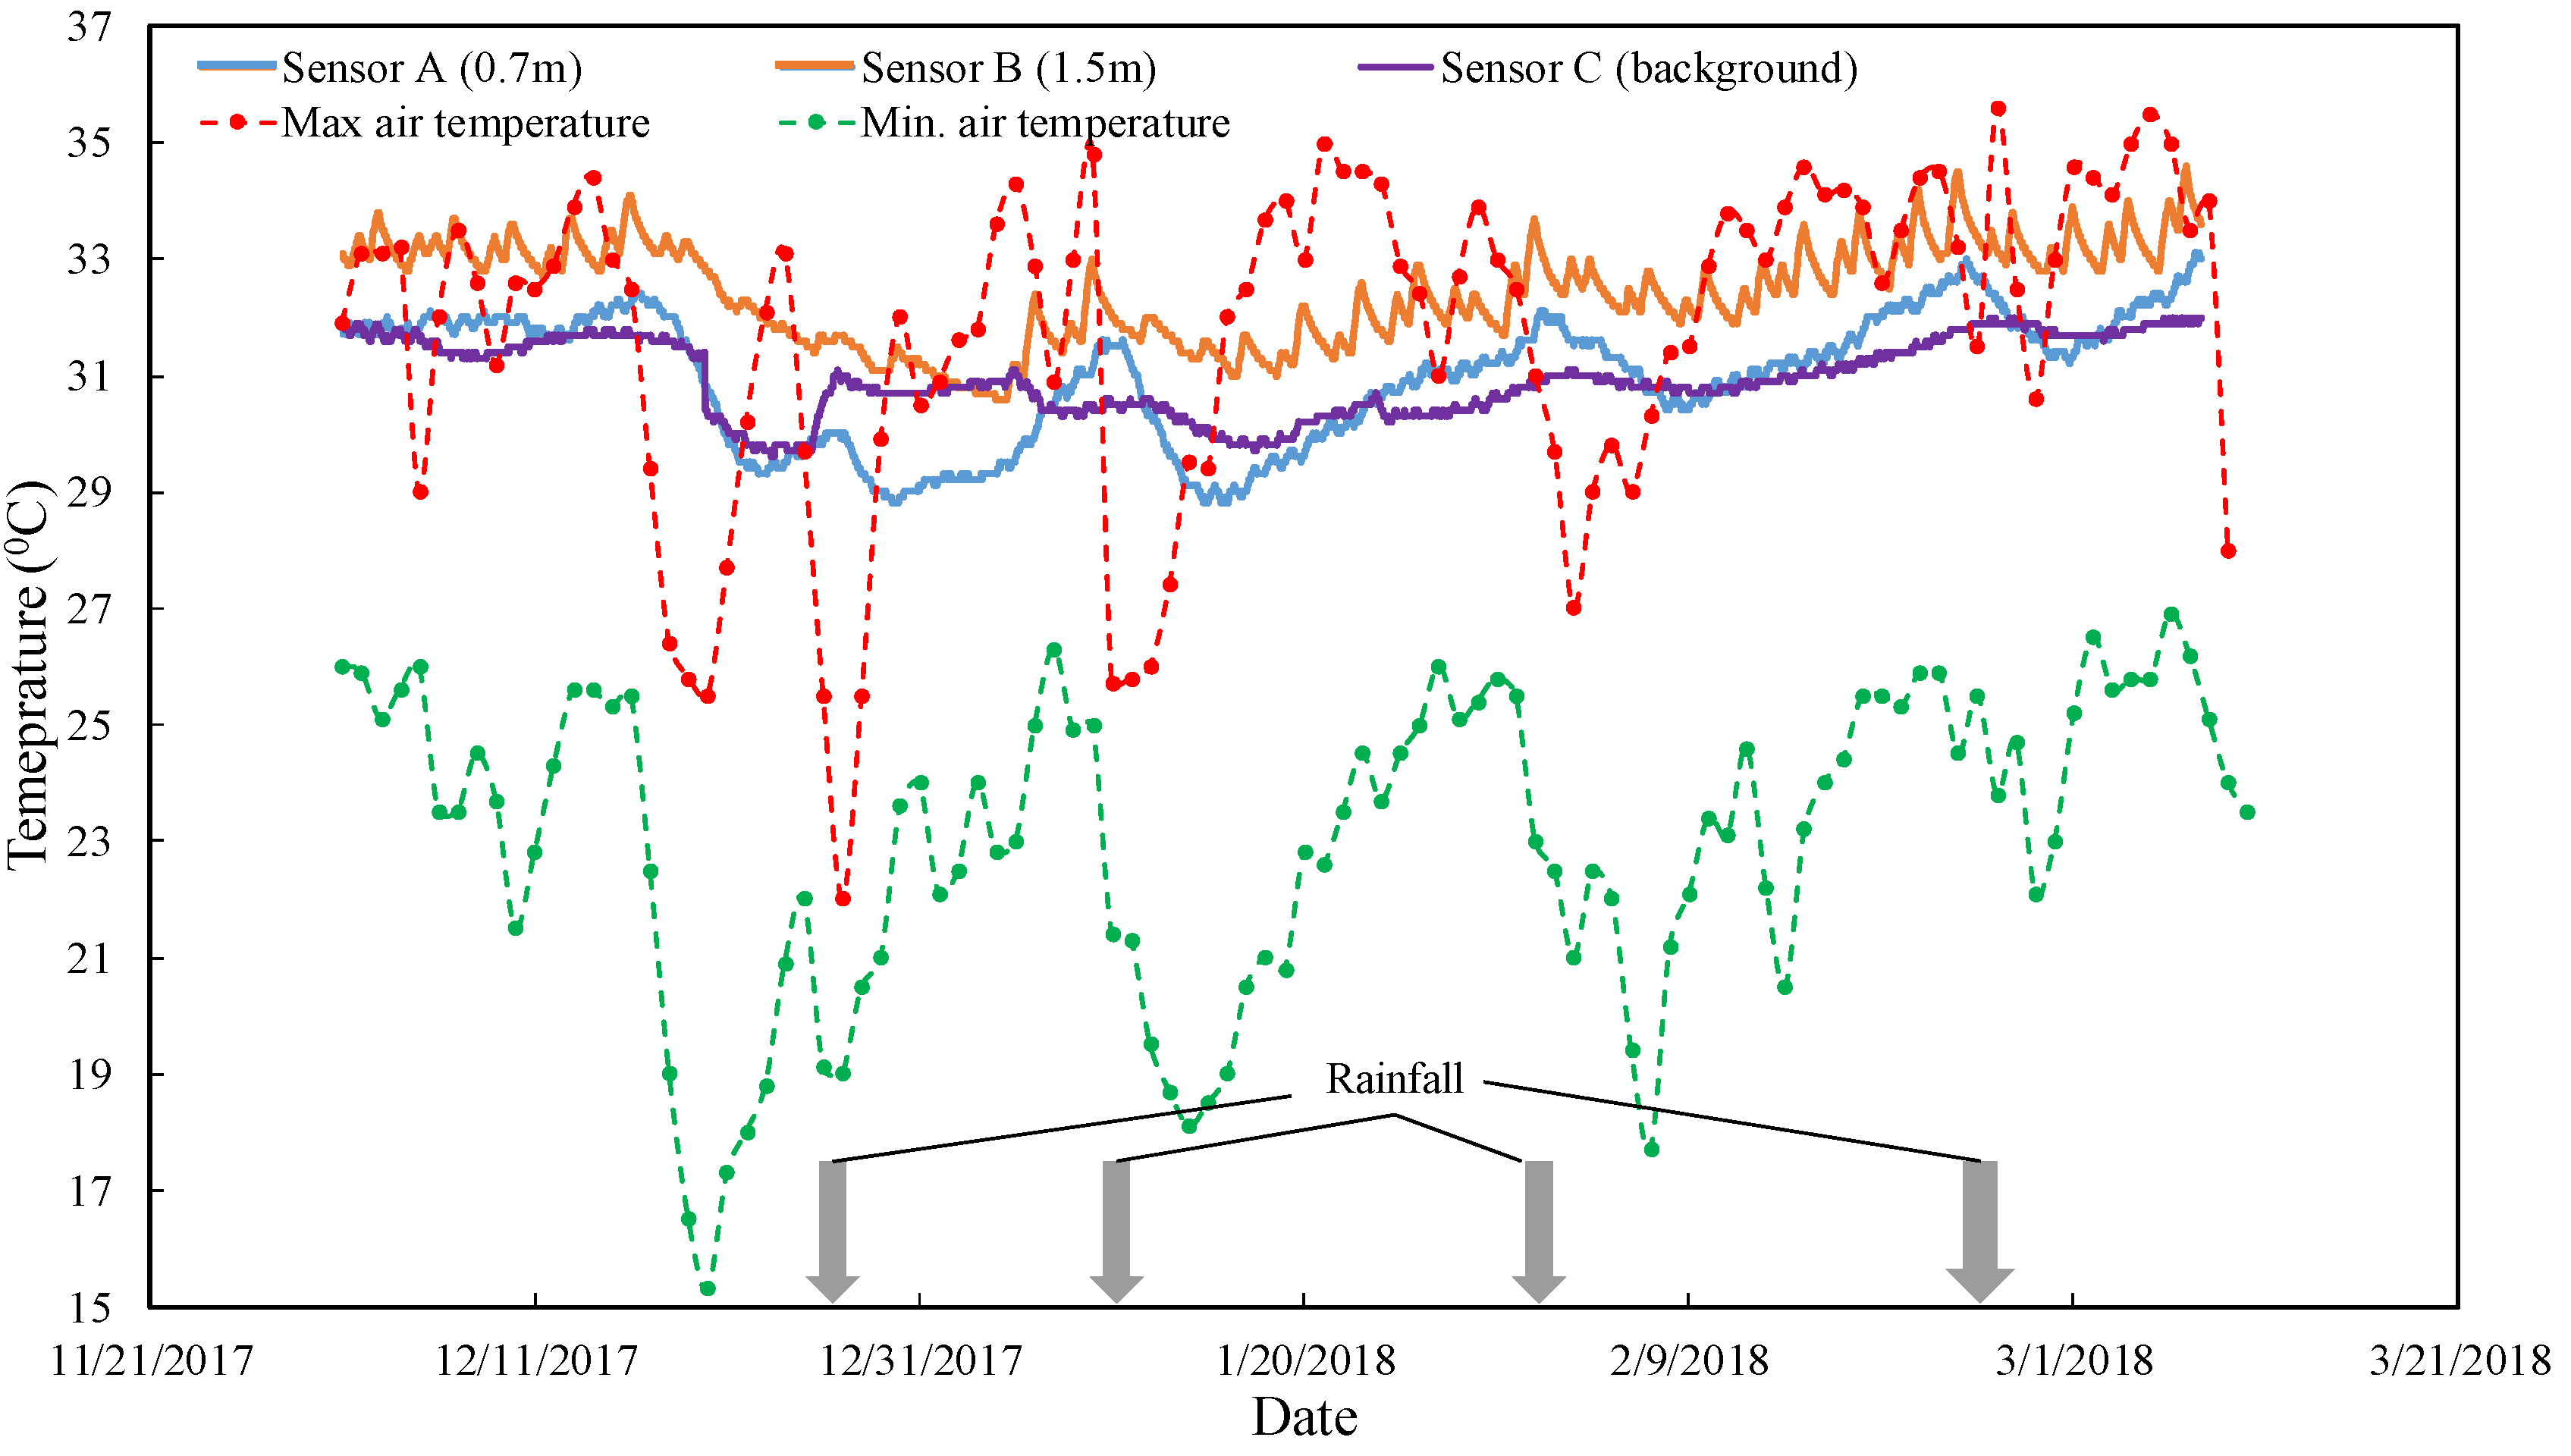
5.2. Ground Temperature Data

One of the most important parameters that affects the performance of GSHP is the soil temperature. It fluctuates due to both the heat transfer from/to the heat exchangers and the natural heat transfer from the surrounding environment [57,58,59,60,61,62].
Three ground temperature sensors were installed in the experimental site. Sensor A and B were installed at depths of 0.7 m and 1.5 m, respectively, in a single vertical hole, close to the end of the Group 1 heat exchanger (see Figure 3), with a 60-min sampling interval. Sensor C was installed 20 meters away, to measure the background temperature. However, from middle of March 2018 onward, no data were recorded, due to broken underground wiring. Figure 17 shows the recorded temperatures between 1 December 2017 and 13 March 2018. During this period, a similar intermittent experimental pattern was carried out. Broken lines show the daily maximum and minimum temperatures during the same period. The general trend of the ground temperature could be divided into two periods, i.e., the declining ground temperature before January, followed by the increasing temperature after January. The declining temperature can be observed during December as the average air temperature decreases. During this month, the ground temperature fluctuations, as can be observed from sensors A and B, were lower, due to the fact that the thermal load of GSHP was low, resulting in the low heat rejection rate. It is also clear that the temperatures from all three sensors show that the ground temperatures are close to those of the maximum daily temperature. Temperature fluctuation could be observed from all sensors. Fluctuations shown by sensor C indicated that the ground temperature fluctuations at 1 m of depth, due to the daily variation of air temperatures. A sharp fluctuation pattern can be observed from sensor B, due to the increasing ground temperature followed by the declining temperature during the GSHP’s operation cycle. However, positioned further away from heat exchanger, less fluctuation is observed at position A.
Looking closely at Figure 17 and Figure 18, the temperature pattern of sensor B indicated that the intermittent use of GSHP and ASHP could provide enough of a period for stabilizing ground temperature and preventing excessive ground temperature rise, which could eventually lower the GSHP performance. It is likely that the use of GSHP alone will not provide better thermal performance compared to its present intermittent use with ASHP.
It is interesting to note that the ground temperature at position A was strongly affected by the rainfall infiltration. When rain occurred, the temperature at this position (0.7 m depth) started to decline by about 2–3 °C. The declining temperature at this depth was prolonged for 2–4 days after the rainfall. Figure 18 shows the detail of ground temperatures from February 20–March 3. After the rain occurred in February 23, the temperature at sensor position A started to decline. However, the temperature at the background (position C, 1 m depth) seemed to be unaffected by the rain, except more rain on February 27, in the morning, when a slight temperature decline was observed. In relatively dry conditions, the ground temperature at position B (1.5 m depth) increased during the heat rejection period. In contrast, the soil at position A increased after the heat rejection was finished. A similar pattern also can be observed during the soil desaturation period after the rainfall (February 28). During the soil saturation process (February 23–27) following the rainfall, such an occurrence was not observed.
Rainwater is in thermal equilibrium with the atmospheric temperature when it reaches the ground’s surface. It infiltrates the ground surface at a lower temperature, in contrast to the upper ground temperature. The heat transfer at shallow depths involves a complex mechanism, including conduction by soil matrix, convection by liquid water, and sensible and latent heat transfer by water vapor movement [60,63,64,65]. However, further analysis on heat and moisture transfers at shallow depths and their effect on the performance of GSHPs are not discussed in this paper, due to the absence of the performance data of heat pumps and soil moisture, i.e., soil hydraulic parameters, volumetric water content, degree of saturation, and pore–water pressure. It has been remarked in previous studies that soil thermal conductivity is strongly related to soil water saturation [62,66,67,68,69]. Go et al. evaluated the effects of rainfall infiltration on the performance of GSHP, with shallow horizontal heat exchangers via numerical analysis [69]. Their study remarked on the free convective heat transfer at the upper region of a shallow heat exchanger during heat rejection, due to both air density and temperature gradients. They pointed out the relationship between increasing thermal conductivity due to rain infiltration and GSHP thermal performance. Ground heat exchanger performance prediction accuracy is significantly affected by soil moisture transfer and properties [62].

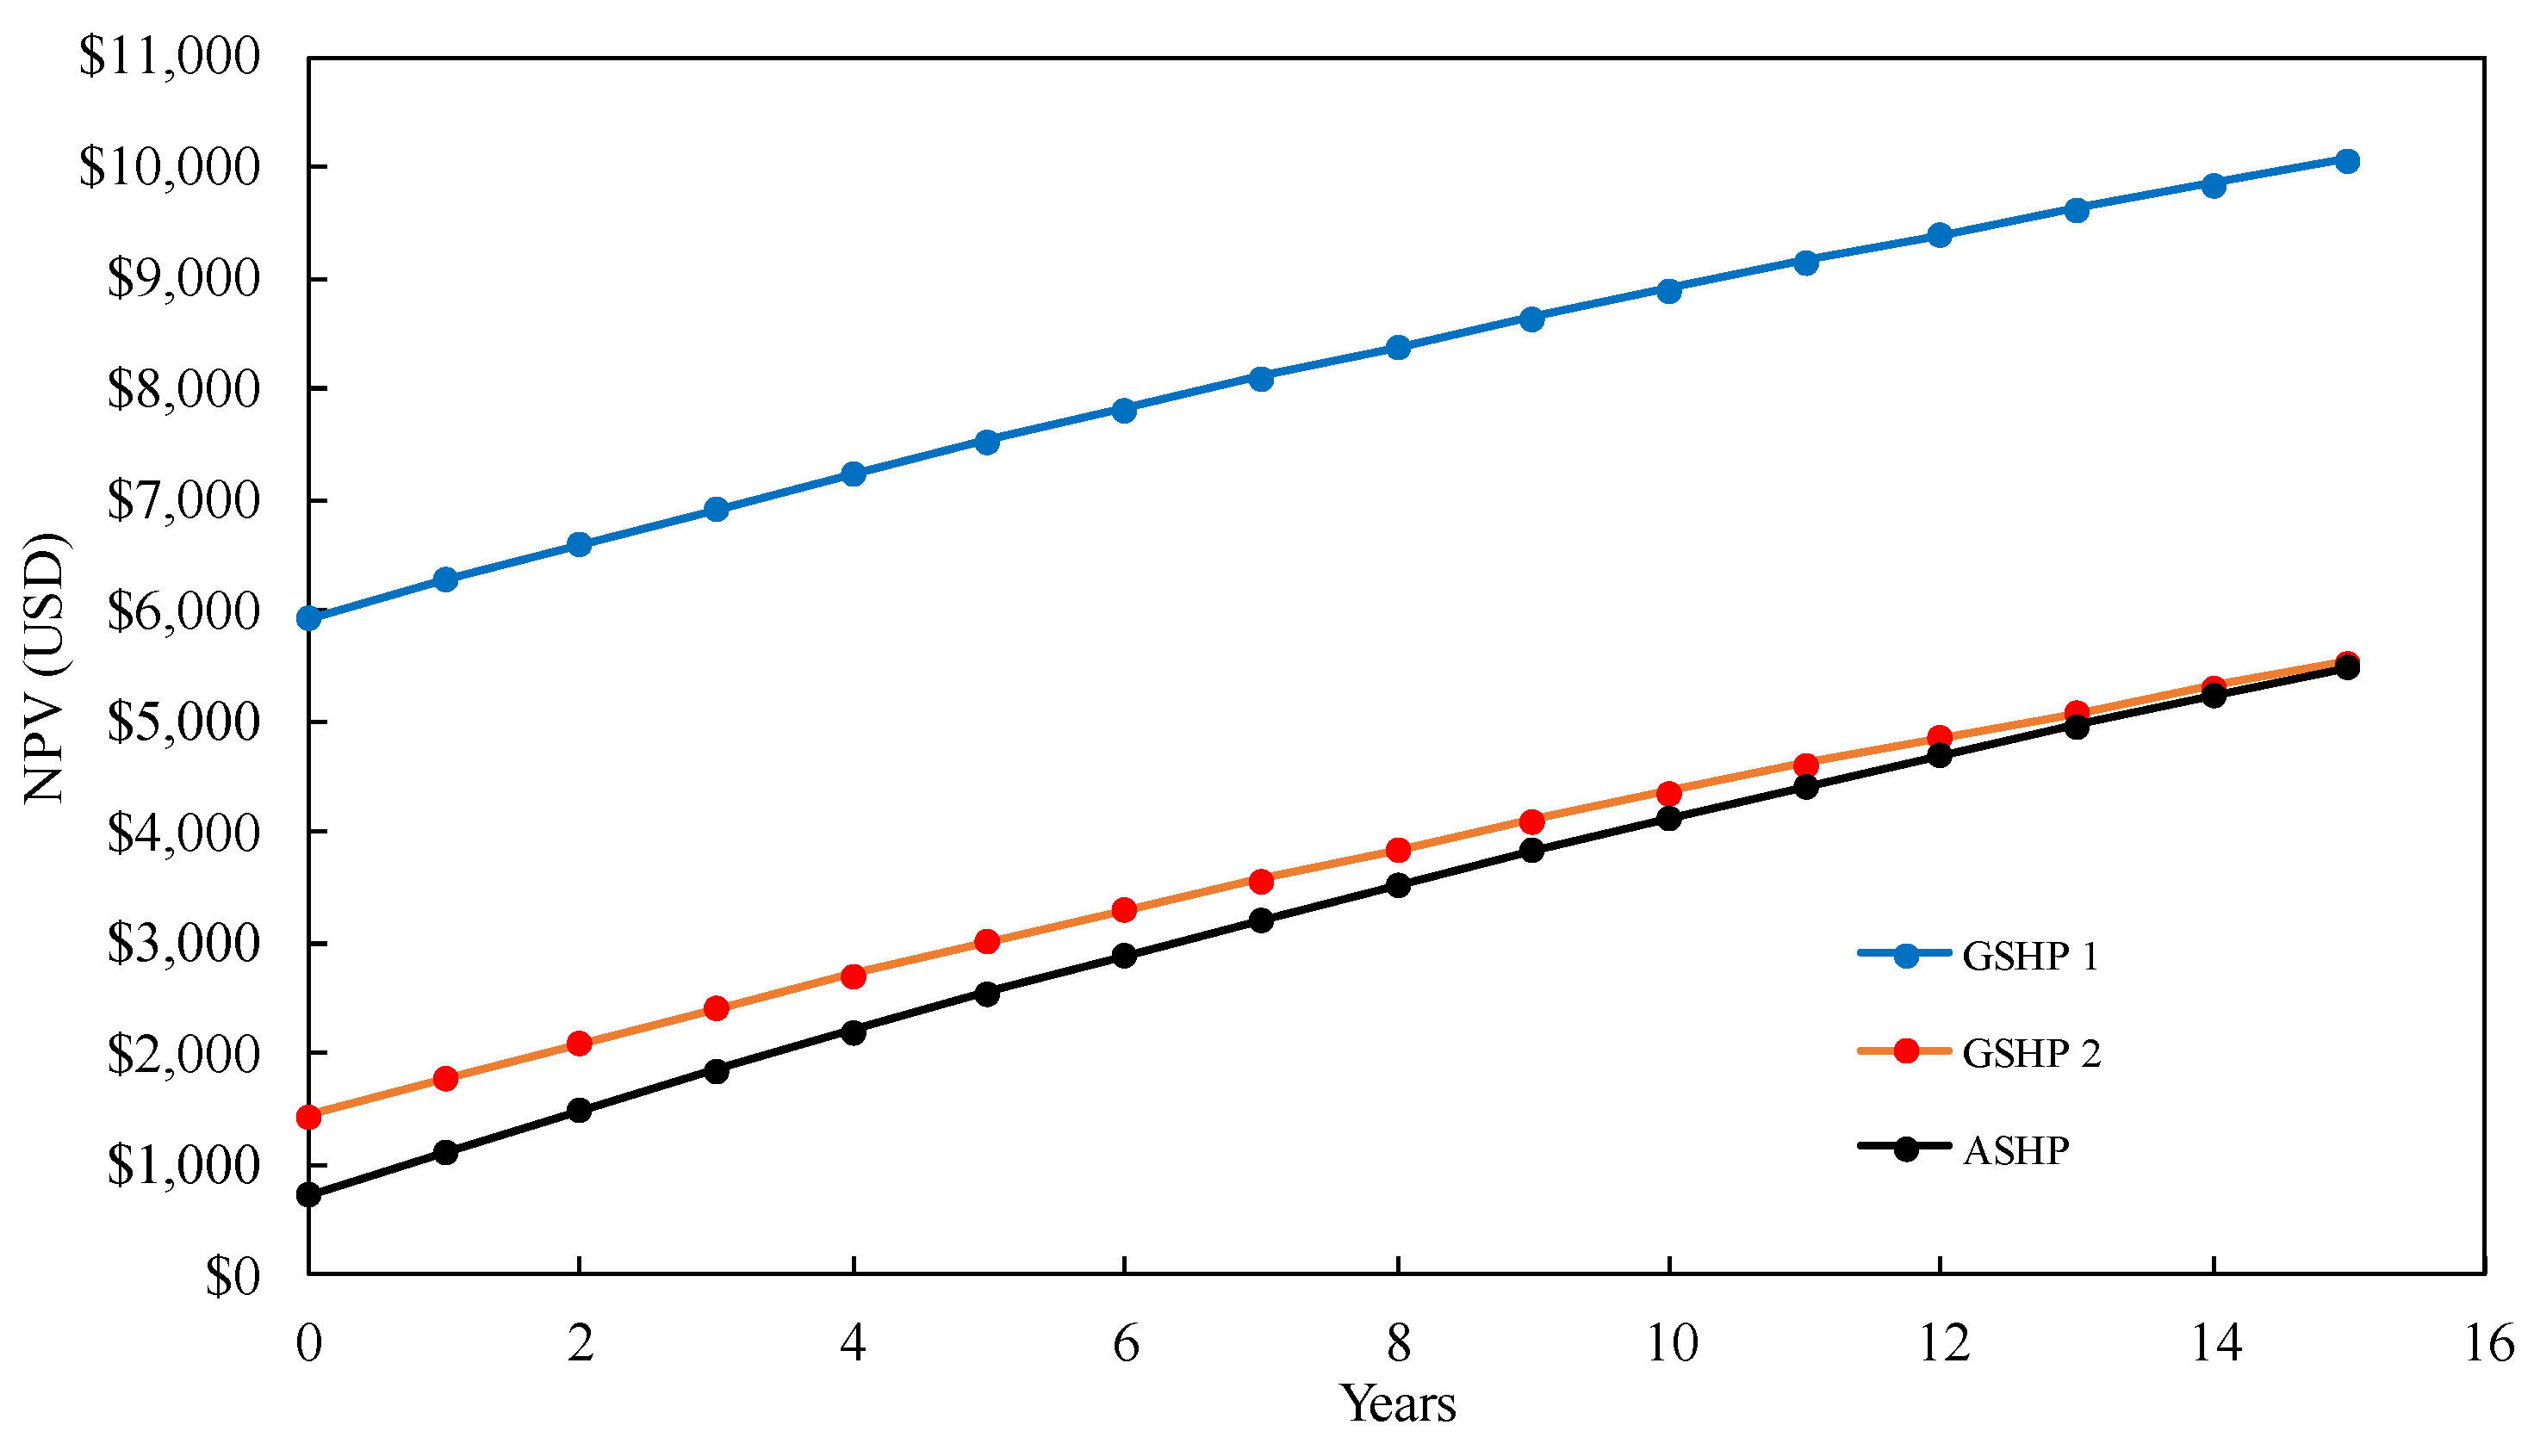
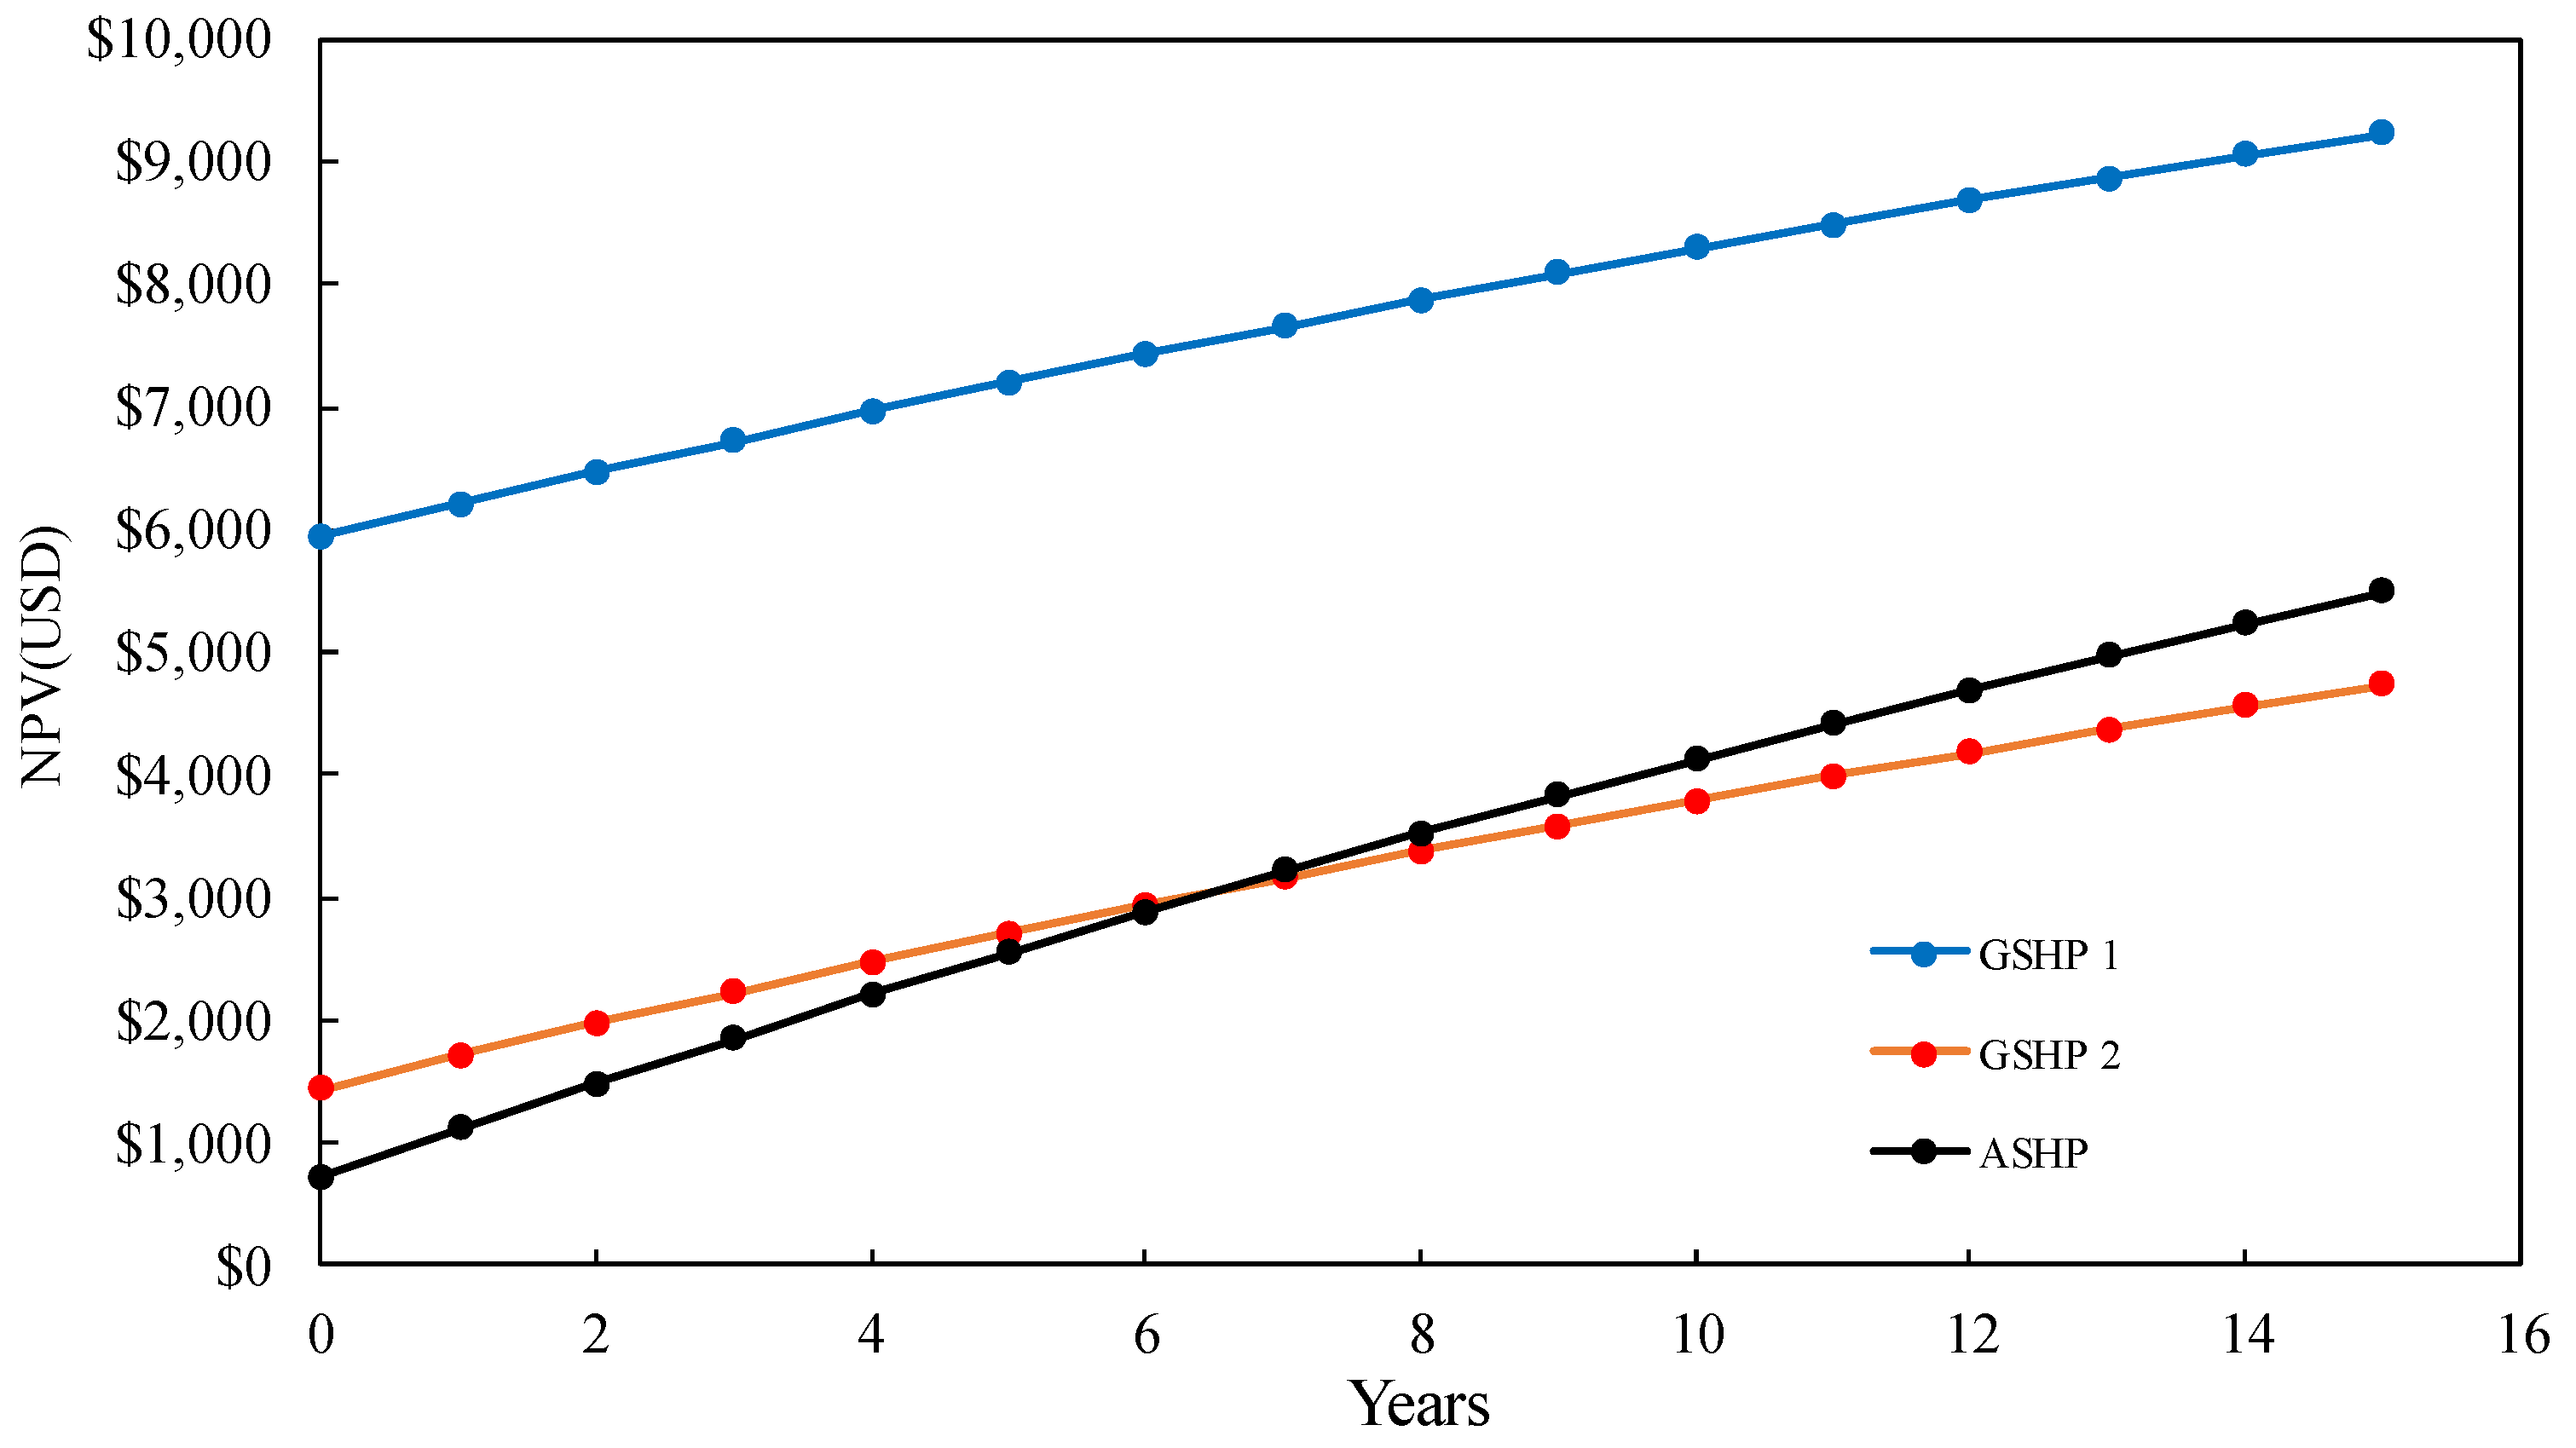
5.3. Life-Cycle Cost Analyses of the Potential Annual CO2 Reduction

In order to make GSHP application gain attention among people in southeast Asian countries, it is important to understand the economic benefits of its application.
The present study conducts a life-cycle cost analysis using the PV. The PV is defined as the current value of future cash flows:
PV t = C ( 1 + i + j ) t t = 1 , 2 n T
The lifetimes of the heat pumps are assumed to be nT = 15 years, and both the interest rate i and inflation rate j are set at 1.5%. The net present value (NPV) is the total PV for the given period of investment:
NPV = t = 1 n T PV t
Heat pumps are assumed to operate on average for 9 h per day and 320 days per year. Further assumptions are that the land cost can be ignored and that no taxation is imposed. The annual CO2 emission generated in running the heat pumps is calculated by considering an annual emission intensity (2017) of 0.471 kg/kWh [2]. Under the aforementioned operating period and experimental results, the annual CO2 emission is 1078.4 kg CO2/year for the ASHP, and 894.16 and 880 kg CO2/year for GSHP 1 and GSHP 2, respectively.
The costs used in the life-cycle cost analyses are presented in Table 3. The table shows that the cost of GSHP 1 is 4.3 times that of the ASHP. This is because the Japanese domestic price is used for GSHP 1, as it is sold solely in Japan and was imported to Thailand for the purpose of research.
Figure 19 presents the NPV of each heat pump when considering power reductions of 17.1% and 18.4% for GSHP 1 and GSHP 2, respectively, as a base case. The figure reveals that the NPV period for GSHP 2 is equal to that of the ASHP after 15 years, when all systems reach their assumed maximum lifespans. From an economic perspective, GSHP 2 has no advantages over the ASHP in terms of cooling spaces. The calculated lifetime CO2 emissions for the ASHP, GSHP 1, and GSHP 2 are, respectively, 16, 170, 13,412, and 13,200 kg CO2.
Figure 20 presents the calculated NPVs, assuming that an annual power reduction of 40% can be achieved for both GSHPs through the optimization of the systems. In such a case, the annual CO2 emission is 647.04 kg CO2/year for each of the GSHPs. It has been observed that the NPV periods for GSHP 2 reach the same value as that for the ASHP after 6.3 years of operation. At the end of its lifespan, GSHP 2 has a 14% cost reduction. The lifetime CO2 emission for each GSHP is 9705 kg CO2. However, it is noted that in both scenarios, the cost of GSHP 1 is too high, owing to the high system cost, making the GSHP 1 system unfavorable from an economic point of view, unless the heat pump cost is significantly lowered. Beside the aforementioned cost analyses, to evaluate the actual long-term sustainability of GSHP application, life cycle assessment can be adopted to assess the environmental effects of the GSHP [15,70,71,72]. Furthermore, long-term data (i.e., year-round experimental data) are required, such that an annual evaluation and comparison of heat pump systems can be carried out.
Comparing both GSHPs, it is important to note that the major cost difference relies on the heat pump cost, since both systems used similar ground heat exchangers. The ratio of the heat exchanger and installation cost to the heat pump cost were 10% and 60% for GSHP 1 and GSHP 2, respectively. That is to say, GSHP 1 costs six times more than GSHP 2. Thus, it is necessary to lower the heat pump cost in order to make GSHP application in southeast Asian countries become economically attractive. Cost reduction can be achieved in several ways, such as local manufacturing of GSHP systems, including the heat exchangers, and considering several factors, such as those outlined below:
  • Thailand and other southeast Asian countries are experiencing rapid economic and industrial growth [73].
  • The ground-source heat pump is a relatively mature technology.
  • A single-function heat pump (only for cooling) is less complicated than those with reversible functions (cooling and heating).
  • Labor cost is relatively low; installation cost can be further reduced by a proper arrangement and design.

5.4. Future Study

Despite the present study providing early insight into the application of GSHPs in a hot and humid climate, critical analyses are not possible owing to the limited data. Improvements, mainly concerning the data acquisition, thus need to be considered in the future.
Long-term analyses must be conducted for a full year, to clarify the effects of climatic variation on the performance of a heat pump. It is interesting that recent research on GSHP applications in Bangkok, using the vertical borehole exchanger, showed that an electricity reduction of 30% or more can be achieved [39].
All the aforementioned considerations support the optimization of GSHP in terms of the compressor and heat exchanger capacity, GHE length, size, and separation, while taking into account the building cooling load characteristics and ground conditions.

6. Conclusions

This study presented the application of GSHP in a tropical country (i.e., Thailand) using shallow horizontal heat exchangers. The performances of the two GSHPs were compared to the ASHP in a two-month experiment. The results demonstrate that during the hot season in Thailand, GSHPs with shallow heat exchangers perform better than ASHPs. GSHP 1 and 2 consumed 17.1% and 18.4% less electricity, respectively, than ASHPs. Likewise, the CO2 emissions could be reduced at a similar rate. During the GSHPs’ operational period, the ground temperatures were higher compared to the average daily air temperatures. A significant ground temperature increment was observed at the position near to the heat exchanger, as a result of heat rejection during the GSHPs’ operation. Intermittent use of a GSHP and an ASHP provide enough time for the ground to dissipate heat. In addition, cost evaluation revealed that, considering a lifetime of 15 years, investment in GSHPs had no economic advantage over investment in ASHPs. The realization of economic benefit requires a reduction of capital cost. One alternative to achieve this goal is by local manufacturing of the GSHPs.
Further study will focus on long-term performance while upgrading data acquisition, so that other crucial data can be obtained for advance analyses.

Author Contributions

All of the authors contributed to publishing this paper: conceptualization, I.T., S.C. (Srilert Chotpantarat), Y.U., K.Y., and P.C.; methodology, I.T. and A.W.,; validation, A.W., S.C. (Sasimook Chokchai), and I.T.; formal analysis, A.W., S.C. (Sasimook Chokchai), and I.T.; data curation, S.C. (Sasimook Chokchai) and I.T.; writing—original draft preparation, A.W.; writing—review and editing, A.W.; visualization, A.W. and S.C. (Sasimook Chokchai); supervision, Y.U., K.Y., P.C., and S.C. (Srilert Chotpantarat).

Funding

This research is financially supported by (i) The Leading Initiative for Excellent Young Researcher (LEADER), Ministry of Education, Culture, Sport, Science and Technology, Japan; (ii) the National Research University Project, Office of Higher Education Commission (WCU-58-017-EN and NRU59-052-EN); and (iii) the Thammasat University Research Fund under the Research University Network (RUN) initiative.

Acknowledgments

The authors would like to thank to Chulalongkorn University for providing research facilities. Also, Narongsuk Sodsaard of the Faculty of Science, Chulalongkorn University, and Podchana Jamngoen of the Department of Geology, Chulalongkorn University, for technical support on GSHP modification and non-technical assistance at the Saraburi site, respectively.

Conflicts of Interest

The authors declare no conflict of interest.

References

  1. IEA. Southeast Asia Energy Outlook 2017; IEA: Paris, France, 2017. [Google Scholar]
  2. Ministry of Energy of The Kingdom of Thailand. Energy Statistic of Thailand; Ministry of Energy of The Kingdom of Thailand: Bangkok, Thailand, 2018.
  3. Lee, Z.H.; Sethupathi, S.; Lee, K.T.; Bhatia, S.; Mohamed, A.R. An Overview on Global Warming in Southeast Asia: CO2emission Status, Efforts Done, and Barriers. Renew. Sustain. Energy Rev. 2013, 28, 71–81. [Google Scholar] [CrossRef]
  4. World Air Conditioner Demand by Region. Available online: https://www.google.com.tw/url?sa=t[&rct=j&q=&esrc=s&source=web&cd=1&cad=rja&uact=8&ved=2ahUKEwi5xO3GrLDhAhXUc94KHWfCCesQFjAAegQIAxAC&url=https%3A%2F%2Fwww.jraia.or.jp%2Fenglish%2FWorld_AC_Demand.pdf&usg=AOvVaw1q-QotBU5B0pLSdNOuxDBq (accessed on 24 February 2019).
  5. Kwong, Q.J.; Adam, N.M.; Sahari, B.B. Thermal Comfort Assessment and Potential for Energy Efficiency Enhancement in Modern Tropical Buildings: A Review. Energy Build. 2014, 68, 547–557. [Google Scholar] [CrossRef]
  6. Kojima, M.; Watanabe, M. Effectiveness of Promoting Energy Efficiency in Thailand: The Case of Air Conditioners; IDE Discussion Papers No. 577; Institute of Developing Economies: Chiba, Japan, 2016. [Google Scholar]
  7. Cazelles, P. Promotion of Higher Efficiency Air Conditioners in Asean: A Regional Policy Roadmap; European Copper Institute: Brussels, Belgium, 2015. [Google Scholar]
  8. Sahakian, M. Keeping Cool in Southeast Asia Energy Consumption and Urban Air-Conditioning; Palgrave Macmillan: Basingstoke, UK, 2014. [Google Scholar]
  9. Supasa, T.; Hsiau, S.-S.; Lin, S.-M.; Wongsapai, W.; Wu, J.-C. Household Energy Consumption Behaviour for Different Demographic Regions in Thailand from 2000 to 2010. Sustainability 2017, 9, 2328. [Google Scholar] [CrossRef]
  10. Sriamonkul, W.; Intarajinda, R.; Tongsuk, N.; Saengsuwan, S. Life Cycle Cost Analysis of Air Conditioning System for Residential Sector in Thailand. GMSARN Int. J. 2011, 5, 131–138. [Google Scholar]
  11. Parkpoom, S.; Harrison, G.P. Analyzing the Impact of Climate Change on Future Electricity Demand in Thailand. IEEE Trans. Power Syst. 2008, 23, 1441–1448. [Google Scholar] [CrossRef]
  12. Arifwidodo, S.D.; Tanaka, T. The Characteristics of Urban Heat Island in Bangkok, Thailand. Procedia Soc. Behav. Sci. 2015, 195, 423–428. [Google Scholar] [CrossRef]
  13. Arifwidodo, S.; Chandrasiri, O. Urban Heat Island and Household Energy Consumption in Bangkok, Thailand; Elsevier B.V.: Amsterdam, The Netherlands, 2015; Volume 79. [Google Scholar]
  14. Genchi, Y. New Countermeasures for Mitigating the Heat Island Effect - District Heat Supply Systems, Underground Thermal Energy Storage, Systems Using Underground as a Heat Sink (in Japanese). J. Jpn. Soc. Energy Resour. 2001, 22, 306–310. [Google Scholar]
  15. Genchi, Y.; Kikegawa, Y.; Inaba, A. CO2payback-Time Assessment of a Regional-Scale Heating and Cooling System Using a Ground Source Heat-Pump in a High Energy-Consumption Area in Tokyo. Appl. Energy 2002, 71, 147–160. [Google Scholar] [CrossRef]
  16. Dasare, R.R.; Saha, S.K. Numerical Study of Horizontal Ground Heat Exchanger for High Energy Demand Applications. Appl. Therm. Eng. 2015, 85, 252–263. [Google Scholar] [CrossRef]
  17. Congedo, P.M.; Colangelo, G.; Starace, G. CFD Simulations of Horizontal Ground Heat Exchangers: A Comparison among Different Configurations. Appl. Therm. Eng. 2012, 33–34, 24–32. [Google Scholar] [CrossRef]
  18. Mustafa Omer, A. Ground-Source Heat Pumps Systems and Applications. Renew. Sustain. Energy Rev. 2008, 12, 344–371. [Google Scholar] [CrossRef]
  19. Kim, M.-J.; Lee, S.-R.; Yoon, S.; Jeon, J.-S. Evaluation of Geometric Factors Influencing Thermal Performance of Horizontal Spiral-Coil Ground Heat Exchangers. Appl. Therm. Eng. 2018, 144, 788–796. [Google Scholar] [CrossRef]
  20. Fujii, H.; Nishi, K.; Komaniwa, Y.; Chou, N. Numerical Modeling of Slinky-Coil Horizontal Ground Heat Exchangers. Geothermics 2012, 41, 55–62. [Google Scholar] [CrossRef]
  21. Fujii, H.; Yamasaki, S.; Maehara, T.; Ishikami, T.; Chou, N. Numerical Simulation and Sensitivity Study of Double-Layer Slinky-Coil Horizontal Ground Heat Exchangers. Geothermics 2013, 47, 61–68. [Google Scholar] [CrossRef]
  22. Di Sipio, E.; Bertermann, D. Soil Thermal Behavior in Different Moisture Condition: An Overview of ITER Project from Laboratory to Field Test Monitoring. Environ. Earth Sci. 2018, 77, 1–15. [Google Scholar] [CrossRef]
  23. Bertermann, D.; Klug, H.; Morper-Busch, L. A Pan-European Planning Basis for Estimating the Very Shallow Geothermal Energy Potentials. Renew. Energy 2015, 75, 335–347. [Google Scholar] [CrossRef]
  24. Neuberger, P.; Adamovský, R.; Šedová, M. Temperatures and Heat Flows in a Soil Enclosing a Slinky Horizontal Heat Exchanger. Energies 2014, 7, 972–987. [Google Scholar] [CrossRef]
  25. Demir, H.; Koyun, A.; Temir, G. Heat Transfer of Horizontal Parallel Pipe Ground Heat Exchanger and Experimental Verification. Appl. Therm. Eng. 2009, 29, 224–233. [Google Scholar] [CrossRef]
  26. Leong, W.; Tarnawski, V.; Aittomäki, A. Effect of Soil Type and Moisture Content on Ground Heat Pump Performance: Effet Du Type et de l’humidité Du Sol Sur La Performance Des Pompes à Chaleur à Capteurs Enterrés. Int. J. Refrig. 1998, 21, 595–606. [Google Scholar] [CrossRef]
  27. Chua, K.J.; Chou, S.K.; Yang, W.M. Advances in Heat Pump Systems: A Review. Appl. Energy 2010, 87, 3611–3624. [Google Scholar] [CrossRef]
  28. Lazzarin, R.M.; Castellotti, F. A New Heat Pump Desiccant Dehumidifier for Supermarket Application. Energy Build. 2007, 39, 59–65. [Google Scholar] [CrossRef]
  29. Aynur, T.N.; Hwang, Y.; Radermacher, R. Integration of Variable Refrigerant Flow and Heat Pump Desiccant Systems for the Cooling Season. Appl. Therm. Eng. 2010, 30, 917–927. [Google Scholar] [CrossRef]
  30. Ozgener, O.; Hepbasli, A. A Parametrical Study on the Energetic and Exergetic Assessment of a Solar-Assisted Vertical Ground-Source Heat Pump System Used for Heating a Greenhouse. Build. Environ. 2007, 42, 11–24. [Google Scholar] [CrossRef]
  31. Han, Z.; Zheng, M.; Kong, F.; Wang, F.; Li, Z.; Bai, T. Numerical Simulation of Solar Assisted Ground-Source Heat Pump Heating System with Latent Heat Energy Storage in Severely Cold Area. Appl. Therm. Eng. 2008, 28, 1427–1436. [Google Scholar] [CrossRef]
  32. Esen, H.; Esen, M.; Ozsolak, O. Modelling and Experimental Performance Analysis of Solar-Assisted Ground Source Heat Pump System. J. Exp. Theor. Artif. Intell. 2017, 29, 1–17. [Google Scholar] [CrossRef]
  33. Hawlader, M.N.A.; Rahman, S.M.A.; Jahangeer, K.A. Performance of Evaporator-Collector and Air Collector in Solar Assisted Heat Pump Dryer. Energy Convers. Manag. 2008, 49, 1612–1619. [Google Scholar] [CrossRef]
  34. Bruelisauer, M.; Meggers, F.; Leibundgut, H. Choosing Your Heat Sink for Cooling in Tropical Climates. In Proceedings of the 5th International Building Physics Conference (IBPC), Kyoto, Japan, 28–31 May 2012; pp. 1339–1345. [Google Scholar]
  35. Permchart, W.; Tanatvanit, S. Study on Using the Ground as A Heat Sink for A 12,000-Btu/h Modified Air Conditioner. World Acad. Sci. Eng. Technol. 2009, 3, 120–123. [Google Scholar]
  36. Yasukawa, K.; Uchida, Y.; Tenma, N.; Taguchi, Y.; Muraoka, H.; Ishii, T.; Suwanlert, J.; Buapeng, S.; Nguyen, T.H. Groundwater Temperature Survey for Geothermal Heat Pump Application in Tropical Asia. Bull. Geol. Surv. Jpn. 2009, 60, 459–467. [Google Scholar] [CrossRef]
  37. Yasukawa, K.; Takashima, I.; Uchida, Y. Geothermal Heat Pump Application for Space Cooling in Kamphaengphet, Thailand. Bull. Geol. Surv. Jpn. 2009, 60, 491–501. [Google Scholar] [CrossRef]
  38. Uchida, Y.; Yasukawa, K.; Tenma, N.; Taguchi, Y.; Suwanlert, J.; Buapeng, S. Subsurface Thermal Regime in the Chao-Phraya Plain, Thailand. Bull. Geol. Surv. Jpn. 2009, 60, 469–489. [Google Scholar] [CrossRef]
  39. Chokchai, S.; Chotpantarat, S.; Takashima, I.; Uchida, Y.; Widiatmojo, A.; Yasukawa, K.; Charusiri, P. A Pilot Study on Geothermal Heat Pump (GHP) Use for Cooling Operations, and on GHP Site Selection in Tropical Regions Based on a Case Study in Thailand. Energies 2018, 11, 2356. [Google Scholar] [CrossRef]
  40. Garber, D.; Choudhary, R.; Soga, K. Risk Based Lifetime Costs Assessment of a Ground Source Heat Pump (GSHP) System Design: Methodology and Case Study. Build. Environ. 2013, 60, 66–80. [Google Scholar] [CrossRef]
  41. Noorollahi, Y.; Bigdelou, P.; Pourfayaz, F.; Yousefi, H. Numerical Modeling and Economic Analysis of a Ground Source Heat Pump for Supplying Energy for a Greenhouse in Alborz Province, Iran. J. Clean. Prod. 2016, 131, 145–154. [Google Scholar] [CrossRef]
  42. Esen, H.; Inalli, M.; Esen, M. A Techno-Economic Comparison of Ground-Coupled and Air-Coupled Heat Pump System for Space Cooling. Build. Environ. 2007, 42, 1955–1965. [Google Scholar] [CrossRef]
  43. Esen, H.; Inalli, M.; Esen, M. Technoeconomic Appraisal of a Ground Source Heat Pump System for a Heating Season in Eastern Turkey. Energy Convers. Manag. 2006, 47, 1281–1297. [Google Scholar] [CrossRef]
  44. Go, G.H.; Lee, S.R.; Yoon, S.; Kim, M.J. Optimum Design of Horizontal Ground-Coupled Heat Pump Systems Using Spiral-Coil-Loop Heat Exchangers. Appl. Energy 2016, 162, 330–345. [Google Scholar] [CrossRef]
  45. Zhu, Y.; Rayegan, R.; Tao, Y. Case Study of Ground-Source Heat Pump Applications in Hot and Humid Climates. J. Archit. Eng. 2014, 21, 5014006. [Google Scholar] [CrossRef]
  46. Khedari, J.; Sangprajak, A.; Hirunlabh, J. Thailand Climatic Zones. Renew. Energy 2002, 25, 267–280. [Google Scholar] [CrossRef]
  47. Vasco, D.A.; Muñoz-Mejías, M.; Pino-Sepúlveda, R.; Ortega-Aguilera, R.; García-Herrera, C. Thermal Simulation of a Social Dwelling in Chile: Effect of the Thermal Zone and the Temperature-Dependant Thermophysical Properties of Light Envelope Materials. Appl. Therm. Eng. 2017, 112, 771–783. [Google Scholar] [CrossRef]
  48. Staffell, I.; Brett, D.; Brandon, N.; Hawkes, A. A Review of Domestic Heat Pumps. Energy Environ. Sci. 2012, 5, 9291–9306. [Google Scholar] [CrossRef]
  49. Luo, M.; Cao, B.; Ji, W.; Ouyang, Q.; Lin, B.; Zhu, Y. The Underlying Linkage between Personal Control and Thermal Comfort: Psychological or Physical Effects? Energy Build. 2016, 111, 56–63. [Google Scholar] [CrossRef]
  50. Hwang, R.L.; Cheng, M.J.; Lin, T.P.; Ho, M.C. Thermal Perceptions, General Adaptation Methods and Occupant’s Idea about the Trade-off between Thermal Comfort and Energy Saving in Hot-Humid Regions. Build. Environ. 2009, 44, 1128–1134. [Google Scholar] [CrossRef]
  51. Feriadi, H.; Wong, N.H. Thermal Comfort for Naturally Ventilated Houses in Indonesia. Energy Build. 2004, 36, 614–626. [Google Scholar] [CrossRef]
  52. Khedari, J.; Yamtraipat, N.; Pratintong, N.; Hirunlabh, J. Thailand Ventilation Comfort Chart. Energy Build. 2000, 32, 245–249. [Google Scholar] [CrossRef]
  53. Wong, N.H.; Feriadi, H.; Lim, P.Y.; Tham, K.W.; Sekhar, C.; Cheong, K.W. Thermal Comfort Evaluation of Naturally Ventilated Public Housing in Singapore. Build. Environ. 2002, 37, 1267–1277. [Google Scholar] [CrossRef]
  54. Wong, N.H.; Khoo, S.S. Thermal Comfort in Classrooms in the Tropics. Energy Build. 2003, 35, 337–351. [Google Scholar] [CrossRef]
  55. Djamila, H.; Chu, C.M.; Kumaresan, S. Field Study of Thermal Comfort in Residential Buildings in the Equatorial Hot-Humid Climate of Malaysia. Build. Environ. 2013, 62, 133–142. [Google Scholar] [CrossRef]
  56. Nicol, F. Adaptive Thermal Comfort Standards in the Hot-Humid Tropics. Energy Build. 2004, 36, 628–637. [Google Scholar] [CrossRef]
  57. Bryś, K.; Bryś, T.; Sayegh, M.A.; Ojrzyńska, H. Subsurface Shallow Depth Soil Layers Thermal Potential for Ground Heat Pumps in Poland. Energy Build. 2018, 165, 64–75. [Google Scholar] [CrossRef]
  58. Chalhoub, M.; Bernier, M.; Coquet, Y.; Philippe, M. A Simple Heat and Moisture Transfer Model to Predict Ground Temperature for Shallow Ground Heat Exchangers. Renew. Energy 2017, 103, 295–307. [Google Scholar] [CrossRef]
  59. Chalhoub, M.; Philippe, M.; Coquet, Y. A Field Experiment to Assess the Influence of Heat and Mass Transfer at the Soil Surface on Shallow Ground Heat Exchanger Performances. In Proceedings of the World Geothermal Congress, Melbourne, Australia, 19–25 April 2015. [Google Scholar]
  60. Saito, H.; Simunek, J.; Mohanty, B. Numerical Analysis of Coupled Water, Vapor, and Heat Transport in the Vadose Zone. Vadose Zone J. 2006, 5, 784–800. [Google Scholar] [CrossRef]
  61. Ghasemi-Fare, O.; Basu, P. Influences of Ground Saturation and Thermal Boundary Condition on Energy Harvesting Using Geothermal Piles. Energy Build. 2018, 165, 340–351. [Google Scholar] [CrossRef]
  62. Gan, G. Dynamic Thermal Performance of Horizontal Ground Source Heat Pumps – The Impact of Coupled Heat and Moisture Transfer. Energy 2018, 152, 877–887. [Google Scholar] [CrossRef]
  63. Sakai, M.; Toride, N.; Šimůnek, J. Water and Vapor Movement with Condensation and Evaporation in a Sandy Column. Soil Sci. Soc. Am. J. 2009, 73, 707. [Google Scholar] [CrossRef]
  64. Platts, A.B.; Cameron, D.A.; Ward, J. Improving the Performance of Ground Coupled Heat Exchangers in Unsaturated Soils. Energy Build. 2015, 104, 323–335. [Google Scholar] [CrossRef]
  65. Agrawal, K.K.; Misra, R.; Yadav, T.; Agrawal, G.D.; Jamuwa, D.K. Experimental Study to Investigate the Effect of Water Impregnation on Thermal Performance of Earth Air Tunnel Heat Exchanger for Summer Cooling in Hot and Arid Climate. Renew. Energy 2018, 120, 255–265. [Google Scholar] [CrossRef]
  66. Lu, N.; Dong, Y. Closed-Form Equation for Thermal Conductivity of Unsaturated Soils at Room Temperature. J. Geotech. Geoenviron. Eng. 2015, 141, 04015016. [Google Scholar] [CrossRef]
  67. Wang, Z.; Wang, F.; Ma, Z.; Wang, X.; Wu, X. Research of Heat and Moisture Transfer Influence on the Characteristics of the Ground Heat Pump Exchangers in Unsaturated Soil. Energy Build. 2016, 130, 140–149. [Google Scholar] [CrossRef]
  68. Zhang, T.; Cai, G.; Liu, S.; Puppala, A.J. Investigation on Thermal Characteristics and Prediction Models of Soils. Int. J. Heat Mass Transf. 2017, 106, 1074–1086. [Google Scholar] [CrossRef]
  69. Go, G.H.; Lee, S.R.; N.V., N.; Yoon, S. A New Performance Evaluation Algorithm for Horizontal GCHPs (Ground Coupled Heat Pump Systems) That Considers Rainfall Infiltration. Energy 2015, 83, 766–777. [Google Scholar] [CrossRef]
  70. Zhu, Y.; Tao, Y.; Rayegan, R. A Comparison of Deterministic and Probabilistic Life Cycle Cost Analyses of Ground Source Heat Pump (GSHP) Applications in Hot and Humid Climate. Energy Build. 2012, 55, 312–321. [Google Scholar] [CrossRef]
  71. Saner, D.; Juraske, R.; Kübert, M.; Blum, P.; Hellweg, S.; Bayer, P. Is It Only CO2that Matters? A Life Cycle Perspective on Shallow Geothermal Systems. Renew. Sustain. Energy Rev. 2010, 14, 1798–1813. [Google Scholar] [CrossRef]
  72. Bayer, P.; Saner, D.; Bolay, S.; Rybach, L.; Blum, P. Greenhouse Gas Emission Savings of Ground Source Heat Pump Systems in Europe: A Review. Renew. Sustain. Energy Rev. 2012, 16, 1256–1267. [Google Scholar] [CrossRef]
  73. Vithayasrichareon, P.; MacGill, I.F. Portfolio Assessments for Future Generation Investment in Newly Industrializing Countries - A Case Study of Thailand. Energy 2012, 44, 1044–1058. [Google Scholar] [CrossRef]
Figure 1. Annual temperature (upper) and relative humidity (bottom) variations measured in Bangkok and Lopburi Province (2017). Green shading shows the average shallow ground temperature at depths of 0–100 m [36].
Energies 12 01274 g001
Figure 2. Location showing the installation site of ground-source heat pump (GSHP) systems at the Saraburi campus of Chulalongkorn University, Saraburi Province.
Energies 12 01274 g002
Figure 3. Schematic diagram of the connection of heat pumps and GHEs; the number in the circle represents the grouping of the ground heat exchangers.
Energies 12 01274 g003
Figure 4. Carpet-type heat exchanger installation.
Energies 12 01274 g004
Figure 5. Installation of high-density polyethylene (HDPE) slinky pipes (Group 1).
Energies 12 01274 g005
Figure 6. Installation of a helically configured heat exchanger (Group 4).
Energies 12 01274 g006
Figure 7. Modification of the air-source heat pump (ASHP) and installation of the plate heat exchanger.
Energies 12 01274 g007
Figure 8. Illustration of energy flow during cooling.
Energies 12 01274 g008
Figure 9. Annual variations of temperature, precipitation, and relative humidity at Saraburi.
Energies 12 01274 g009
Figure 10. Atmospheric temperature variation during the heat pump operation.
Energies 12 01274 g010
Figure 11. Performance of GSHP 1 (10-min interval data during the operational period).
Energies 12 01274 g011
Figure 12. Performance of GSHP 2 (10-min interval data during the operational period).
Energies 12 01274 g012
Figure 13. Performance of the ASHP (10-min interval data during the operational period).
Energies 12 01274 g013
Figure 14. Performance comparison of the GSHPs and ASHP; the coefficient of performance (CoP) of the ASHP is calculated assuming an average cooling load similar to that of GSHP 1 and GSHP 2.
Energies 12 01274 g014
Figure 15. Temperature data of GSHP 1 (May 20) and GSHP 2 (May 9).
Energies 12 01274 g015
Figure 16. One-day operational data of the ASHP (June 27).
Energies 12 01274 g016
Figure 17. Ground temperatures and maximum–minimum daily air temperatures.
Energies 12 01274 g017
Figure 18. Ground temperatures during heat pump operation (February 20–March, 3).
Energies 12 01274 g018
Figure 19. The net present value (NPV) of the heat pumps (in the base case scenario).
Energies 12 01274 g019
Figure 20. NPV of the heat pumps assuming the GSHP uses 40% less power than the ASHP.
Energies 12 01274 g020
Table 1. Technical specifications of the heat pumps used in the present study.
Heat PumpCooling Capacity (kW)Heating Capacity (kW)InverterRefrigerantEnergy Rating1Remarks
GSHP 145YesR410a-Imported from Japan
GSHP 2N/A2-NoR410aN/A3Replaced with 7.03 kW Water-R410A plate heat exchanger
ASHP3.5-YesR410a5 stars-
1 Certification standard issued by Electricity Generating Authority of Thailand (EGAT); 2 the original Cooling capacity was 3.6kW; 3 the original energy rating was five stars (2011 standard certification).
Table 2. Temperature sensor specifications.
Sensor LocationSensor TypeAccuracy
Indoor air temp.T type thermocouple+/−0.5 °C
Atmospheric air temp.T type thermocouple+/−0.5 °C
Heat transfer fluid inletPt100 platinum resistance+/−0.2 °C
Heat transfer fluid outletPt-100 platinum resistance+/−0.2 °C
Ground TemperaturesNTC thermistor+/−0.2 °C
Table 3. Initial and installation costs of each heat pump and heat exchanger.
Heat PumpLife-Cycle CostCost1
GSHP 1Total cost5700
GSHP 2Total cost900
Ground Heat ExchangerMaterial cost225
Installation cost360
ASHPUnit cost630
Installation cost90
OthersElectricity cost0.1352
1 All costs are in USD; 2 Electricity cost is in USD/kWh.

