Identification Method for Voltage Sags Based on K-means-Singular Value Decomposition and Least Squares Support Vector Machine


1
School of Electrical Engineering, Southeast University, Nanjing 210096, China
2
Jiangsu Key Laboratory of Smart Grid Technology and Equipment, Southeast University, Nanjing 210096, China
3
College of Energy and Electrical Engineering, Hohai University, Nanjing 211100, China
4
State Grid Jiangsu Electric Power Co., Ltd. Research Institute, Nanjing 211113, China
*
Author to whom correspondence should be addressed.
Energies 2019, 12(6), 1137; https://doi.org/10.3390/en12061137
Submission received: 23 February 2019
/
Revised: 19 March 2019
/
Accepted: 21 March 2019
/
Published: 23 March 2019
(This article belongs to the Section F: Electrical Engineering)
Abstract
:Voltage sag is one of the most serious problems in power quality. The occurrence of voltage sag will lead to a huge loss in the social economy and have a serious effect on people’s daily life. The identification of sag types is the basis for solving the problem and ensuring the safe grid operation. Therefore, with the measured data uploaded by the sag monitoring system, this paper proposes a sag type identification algorithm based on K-means-Singular Value Decomposition (K-SVD) and Least Squares Support Vector Machine (LS-SVM). Firstly; each phase of the sag sample RMS data is sparsely coded by the K-SVD algorithm and the sparse coding information of each phase data is used as the feature matrix of the sag sample. Then the LS-SVM classifier is used to identify the sag type. This method not only works without any dependence on the sag data feature extraction by artificial ways, but can also judge the short-circuit fault phase, providing more effective information for the repair of grid faults. Finally, based on a comparison with existing methods, the accuracy advantages of the proposed algorithm with be presented.
1. Introduction
With the construction and development of the power distribution network, technology upgrades for all types of electrical equipment are required. In particular, the large-scale application of automatic control technology in industrial production puts higher demands on the power quality of the power supply system. Among them, voltage sag is generally considered to be the most frequent and serious power quality problem [1,2,3]. Voltage sag refers to a sudden drop of the grid voltage and recovery in a short time. In June 2016, due to the voltage sag, the Samsung Semiconductor factory assembly line was unexpectedly shut down, resulting in a 10% decrease of the factory’s productivity and an economic loss of tens of billions of won (the Korean currency). In June 18, the Xinyi District of Taipei suffered a voltage sag due to feeder trips, directly affecting 2134 users, including a short pause of 5 to 10 min in the Taipei 101 Building Shopping Center, which disturbed the normal life of the residents in that area. According to the statistics of the Taiwan Power Company, each voltage sag caused an economic loss of about a hundred thousand to one million dollars US dollars to the Hsinchu Science Park in Taiwan. The occurrence of voltage sags leads directly to productivity and product quality declines in enterprises and increased costs, affecting people’s normal life and causing huge economic losses to society [4,5,6]. Therefore, it is necessary to take corresponding action to reduce the impact of voltage sags.
In order to better solve the voltage sag problem, Jiangsu Power Grid has built more than 17,000 sag monitoring points in the province’s distribution network. A large amount of monitoring data provides necessary conditions for the analysis and solution of the sag problem. The Institute of Electrical and Electronics Engineers (IEEE) defines voltage sag as a situation where the root mean square (RMS) voltage drops to 10–90% of the rated value, with a duration of 10 ms–60 s [7,8]. Identification of the type of sag event is the basis for solving the sag problem. In recent years., an certain amount of research has been done on sag type identification. In [9], a generalized model based on symmetrical components is developed to classify the different types of unbalanced dips caused by a fault. The article only discusses the situation in which the voltage dip caused by a fault. Subsequently, transformer energizing and motor starting dips are also included in the discussion, an an expert system is used to classify the three major types of sag: fault-induced, transformer energizing, and induction motor starting dips [10]. In [11], the SVM intelligent classifier is introduced. Five time-frequency domain features are extracted from the RMS waveform of voltage sags as the training data of the SVM to realize the identification of the voltage sag type. In [12,13,14], wavelet transforms were proposed as a fast and efficient tool for voltage sag characterization; they accurately locate where the voltage sags and recovers. Based on this, the dips are effectively classified according to the wavelet coefficient. Besides the RMS, a polarized ellipse was introduced in [15] to characterise the voltage dip trajectory, and five ellipse parameters are used to classify and characterise voltage dips and swells within a one-cycle window length. As an improvement of the technique proposed in [15], the voltage space vector and least squares are used to transform the dip time series into two-dimensional polarization ellipses. The features extracted by the polarization ellipses are then used to classify the dips [16]. Although these methods have obtained good performance, they require human expert knowledge [9,11,12,13,14], feature extraction techniques [10,11], and setting of several threshold parameters [15,16]. This will lead to a complicated classification algorithm, affecting the generalization ability of the classification algorithm.
K-SVD is a data compression and feature extraction technique that in recent years has been used in many fields, including image processing and language recognition [17]. It provides a sparse linear representation of sample data by looking for a set of overcomplete base vectors (i.e., dictionaries). Dictionary atoms are extracted from the sample dataset, and each dictionary atom is a component of the RMS waveform of sag samples. The linear combination of dictionary atoms corresponding to the same category of sag has a higher similarity, which provides conditions for identification of sag sample types. Therefore, this paper first uses the K-SVD algorithm to sparsely encode each phase of the RMS data of the sag sample. The sparse representation information of each data phase (the number of the dictionary atom and the atomic coefficient) is used as the feature matrix of the sag sample. Then the LS-SVM classifier is used to identify the sag type. This method does not require complex threshold setting and signal processing techniques, and is free of dependence of the sag data feature extraction on manual intervention. It not only achieves accurate identification of the three types of sag, namely the fault, induction motor start and transformer energizing, but also accurately identifies the fault phase in the fault sag. This method not only lays a foundation for effective management of sags, but is also helpful in judging the fault phase selection and improving the maintenance efficiency of faults.
The second part of the paper analyzes the waveforms and characteristics of different sag types. In the third part, the sag source identification algorithm based on K-SVD and SVM multi-classifier is introduced. We use the measured data to verify the accuracy of the proposed algorithm, and compare with the algorithm with some reference methods [10,11] in the fourth part. The last part is the conclusions.
2. Analysis of Voltage Sags
At present, the causes of the voltage sag are mainly short-circuit fault, motor starts, and transformer energizing, Among them, the faults can be divided into single-phase short-circuit faults (phase-A fault, phase-B fault, phase-C fault), two-phase short-circuit faults (phase AB fault, phase BC fault, phase AC fault), and three-phase short-circuit faults.
2.1. Short-Circuit Faults
Short-circuit faults are the main cause of voltage sags. The RMS waveform of the measured voltage sag data is shown in the figure below. When a short-circuit fault occurs, the voltage falls instantaneously, the duration of the short-circuit sag is determined by the system reclosing time. When the reclosing is successful, the voltage immediately returns to normal. The waveform of the fault phase is a rectangle, as shown in Figure 1a–f. In addition, because the provincial 10 kV distribution network system is a neutral point ungrounded system, when an unbalanced fault occurs, a voltage swell occurs in the non-fault phase. In the unbalanced fault in Figure 1a–f, the voltage of the non-fault phase is higher than the rated operating voltage.
2.2. Transformer Energizing and Motor Starting
Motors and transformers are important equipment in power grids. The transformer of the power distribution system uses Y/Y or Y/Δ wiring mode. In the distribution network, transformers have a ratio of 10:0.4 kV. When a motor starts or a no-load transformer energizes, the excitation current of the line increases to 2–8 times the rated current, which causes the voltage amplitude of the PCC point to drop. Due to the different phase angles of the three-phase current, the amplitude of the drop of the three-phase voltage is also different. Both cases are non-fault cases, and there is no action of the protection device that triggers the line. Therefore, the process of voltage recovery is different from the fault, and the elapsed time is long and the waveform is relatively flat. The RMS waveform are as shown in Figure 2. It can be seen from Figure 1 and Figure 2 that each type of sag has its own uniqueness that make it different from other types. At the same time, the same type of voltage waveform has a high degree of similarity, which provides the necessary conditions for the identification of its sag type.
3. Classification of Sag Type Based on K-SVD and LS-SVM
3.1. K-SVD Algorithm
K-SVD is an effective algorithm for sparse expression of signals, proposed by Aharon in 2006 [18]. This paper introduces the K-SVD algorithm with the intention of establishing a set of redundant dictionaries and use the linear combination of dictionary atoms to sparsely express the waveform of sag mentioned in the previous section. Assume that the signal set Y = [y1, y2, …, yN]T, Sample length is n, a set of redundant dictionaries can accurately and sparsely express a linear signal Y, K represents the number of dictionary atoms. As shown in Equation (1), the redundancy means K > n and sparse means that only a few xi are not 0:
represents the F norm of the matrix, means the number of non-zeros in xi, represents the sparsity constraint on the coefficient vector xi. T0 is the number of non-zero elements in xi. As can be seen from the above Equation (1), under the condition of sparse constraints, when the error between the original signal Y and D·X satisfies the requirement, the dictionary D can perform effective sparse linear expression on any set of data in the Y set.
The process for obtaining the optimal D and X of the above formula is as follows. First assume that D is fixed, then the above formula can be written as:
where xi represents the linear expression coefficient for each signal in Y, whereby Equation (1) can be equally divided into N discrete optimization problems, as shown in the Equation (3)
In this regard, a random initial dictionary D0 is generated and fixed D0 is unchanged, and at the same time, each sample yi is found to correspond to the sparse coefficient xi of the current dictionary D0, and the initial sparse matrix X0 corresponding to the signal set Y is obtained. Then, the fixed sparse matrix X0 is unchanged, and the dictionary D is divided into K-column dictionary atoms. Assume that dk (the k-th atom of D) is taken as an example, and the coefficient matrix of the coefficient matrix X corresponding to dk is xk, then Equation (3) can be converted as follows:
where Ek represents the error of the original signal and sparse expression in addition to the updated atom. Each time, only one of the columns of the dictionary D is updated, the remaining column values of the dictionary D are unchanged. Find the dictionary D1 that makes the error smaller, and cycle back and forth. This paper chooses the Orthogonal Matching Pursuit (OMP) algorithm to calculate D and its corresponding X [19]. In addition, to ensure the sparsity of the sparse matrix X, and to speed up the convergence of program calculation. Each time the coefficient matrix X is updated, all 0 elements in the matrix are removed, and only the non-zero elements in the X sparse matrix are updated. Definition , that is, find the position of all non-zero elements in the sparse matrix X. Define matrix Ω as a unit sparse matrix, the value at is 1, the other points are all 0, then the above formula can be converted into Equation (5):
where Ωk is the k-th column of the matrix Ω.
After each iteration calculation is completed, the root mean square error is used to evaluate the error degree of the algorithm. As shown in Equation (6):
where K is the number of dictionary atoms and N is the number of signals in the Y signal set. According to the above principle, the monitoring data is used as the signal Y, and the A, B, and C phases in the sag voltage data are respectively calculated, as shown in Figure 3 below. Each phase waveform consists of its corresponding dictionary atom. The algorithm using K-SVD has the following three advantages:
- Self-Learning. This algorithm is a self-learning algorithm, rather than extracting hand-crafted features, and reducing the dependence on artificial experience. All features are extracted directly from the RMS waveform without complex feature extraction algorithms.
- Response to the characteristics of the signal directly. Each signal has a linear combination of one atom with the highest similarity, that is, the atom with the highest absolute coefficient which is called Dominating Atom (DA) in this paper, and its corresponding coefficient x is called Dominating Coefficient (DC). DA and DC reflect the characteristics of the signal, so the DA’s number and DC can be used as the basis for its classification.
- Data visualization. The waveform of each dictionary atom is part of the sag voltage waveform. This visualization can show how the original profiles are transformed into other forms, which can help with coding accuracy analysis.
3.2. Classification Algorithm
This paper uses a Least Squares Support Vector Machine (LS-SVM) to build a multi-type classifier, which has a better performance than the traditional SVM algorithm [20]. Suppose {(s1, h1), (s2, h2), …, (sm, hm)} is a training set with m sample. The sample si (i = 1, 2, …, m) corresponds to the category hi ∈ {−1,1}. Then there is the optimal classification hyperplane, as shown in Figure 4.
That meets the following conditions:
where: ω is the normal vector of the hyperplane; β is the offset. Then the classification decision function is:
Least squares support vector machine [20], the nonlinear classification model can be represented by solving the optimization function :
where C is the regularization factor; ei is the error. In order to allow a certain degree of misclassification, the least misclassified sample and the maximum classification interval are traded off.
Equation (9) needs to satisfy the following constraints:
In the formula, φ(si) is a nonlinear mapping, through which the sample set is mapped from the input space to the high-dimensional feature space.
Construct the Lagrange equation as:
where αi is a Lagrange multiplier. The optimization condition is:
In the simultaneous Equations (5) and (6), eliminating the variables ei and ω, yield the following linear equation:
among them:
where FK(si, sj) is the kernel function of the support vector machine, j = 1, 2, …, m, hT = [h1, …, hm]; I is the unit matrix, I = [1, …, 1]T; α = [α1, …, αm]T. Then the classification decision function of the least squares support vector machine is:
where s is a sample. The kernel function of LS-SVM must be positive definite and satisfy the Mercer theorem [21].
This paper realizes the function of multi-class classification by constructing multiple 2-class LS-SVMs combined with the method of minimum output coding (MOC). Using the Gauss radial basis with superior performance as the kernel function [22]. The regularization factor C and the kernel parameter σ are obtained by the grid search method [23]. This method requires a minimum number of constructors to implement multiple classes [24] and is easy to implement.
3.3. Dip Type Classification Method
Combined with the above algorithm principle, the sag type identification method is shown in Figure 5. The sag type identification method first uses the training data to calculate the K-SVD dictionary atom, and optimizes D and X by Equation (6). After satisfying the loop termination condition, the dictionary D and the sparse matrix X obtained by the training are retained.
The DA, DC values of the three-phase A, B, and C voltage data are used as the eigenvalues of the SVM classifier training. The eigenvector of each sag sample is [DAa, DCa, DAb, DCb, DAc, DCc]. The eigenvector needs to be normalized, and the normalization formula is as follows:
K is the number of the DA, N is the number of atoms in the dictionary, DCmin is the minimum of the DC of all samples, and DCmax is the maximum of the DC of all samples. The dictionary D and LS-SVM classifiers obtained by training are used to identify the newly sag type.
In order to verify the accuracy of the sag source type identification algorithm, this paper uses the confusion matrix to investigate the recognition effect of the algorithm. The confusion matrix calculation formula is as follows:
where Tpi is the number of correct samples in each category, N is the total number of samples, Z is the number of sag types, Ni is the number of each type in the sample; i is the sample type number; j is the recognition result. The serial number of the type; Nj is the number of each class in the recognition result. Ri is the recall rate, Pj is the recognition accuracy, and Q is the harmonic average accuracy of the recall rate and accuracy. The index is used to evaluate the performance on the imbalanced label dataset. The higher the A and Q, the better the classifier is [25,26].
4. Experiment and Analysis
4.1. Data Description
In order to verify the validity and accuracy of the above algorithm, this paper selects 1554 sets of sag data measured at Suzhou, Jiangsu Province, in July 2018 as the verification data of the algorithm. The data sampling rate is 12.8 kHz, and each sag event includes 15745 data points. 256 points are sampled per cycle. In the process of data preprocessing, the signal is converted into RMS first, and then one point is taken every cycle to reduce the amount of data calculation. Each phase of data retains 61 points. Preserving the characteristics of the sag waveform without changing the graphical features. The various types of data are listed in the following table. The data is divided into training data and test data. The training data accounts for 75% of the total data, and the test data for 25%, as shown in Table 1.
4.2. Parameter Selection
In this paper, the parameters of the K-SVD algorithm are selected by an enumeration method. The traversal range of non-zero element T0 parameter in the sparse matrix is [1, 6], the traversal range of dictionary atom number is [70, 110], and the number of iterations is 10. The calculation error preserves the result of the last iteration. The simulation results are shown in the Figure 6, where the y-axis is the sparsity T0, the x-axis is the number of dictionary atoms, and the z-axis is the reconstruction error. When the sparsity is less than 4, the error in reconstruction is larger. When the sparsity is greater than 4 and the number of dictionary atoms is greater than 75, the error of reconstruction is small and tends to be stable. Therefore, the sparsity is 4 and the number of dictionary is 75.
When K = 80, T0 = 4, the relationship between the number of iterations and the reconstruction error is as shown in Figure 7. As the number of iterations increases, the reconstruction error becomes more and more gradual. When the number of iterations is greater than 20, the RMSE can reach 0.01 or less. Therefore, we choose 20 as the number of iterations.
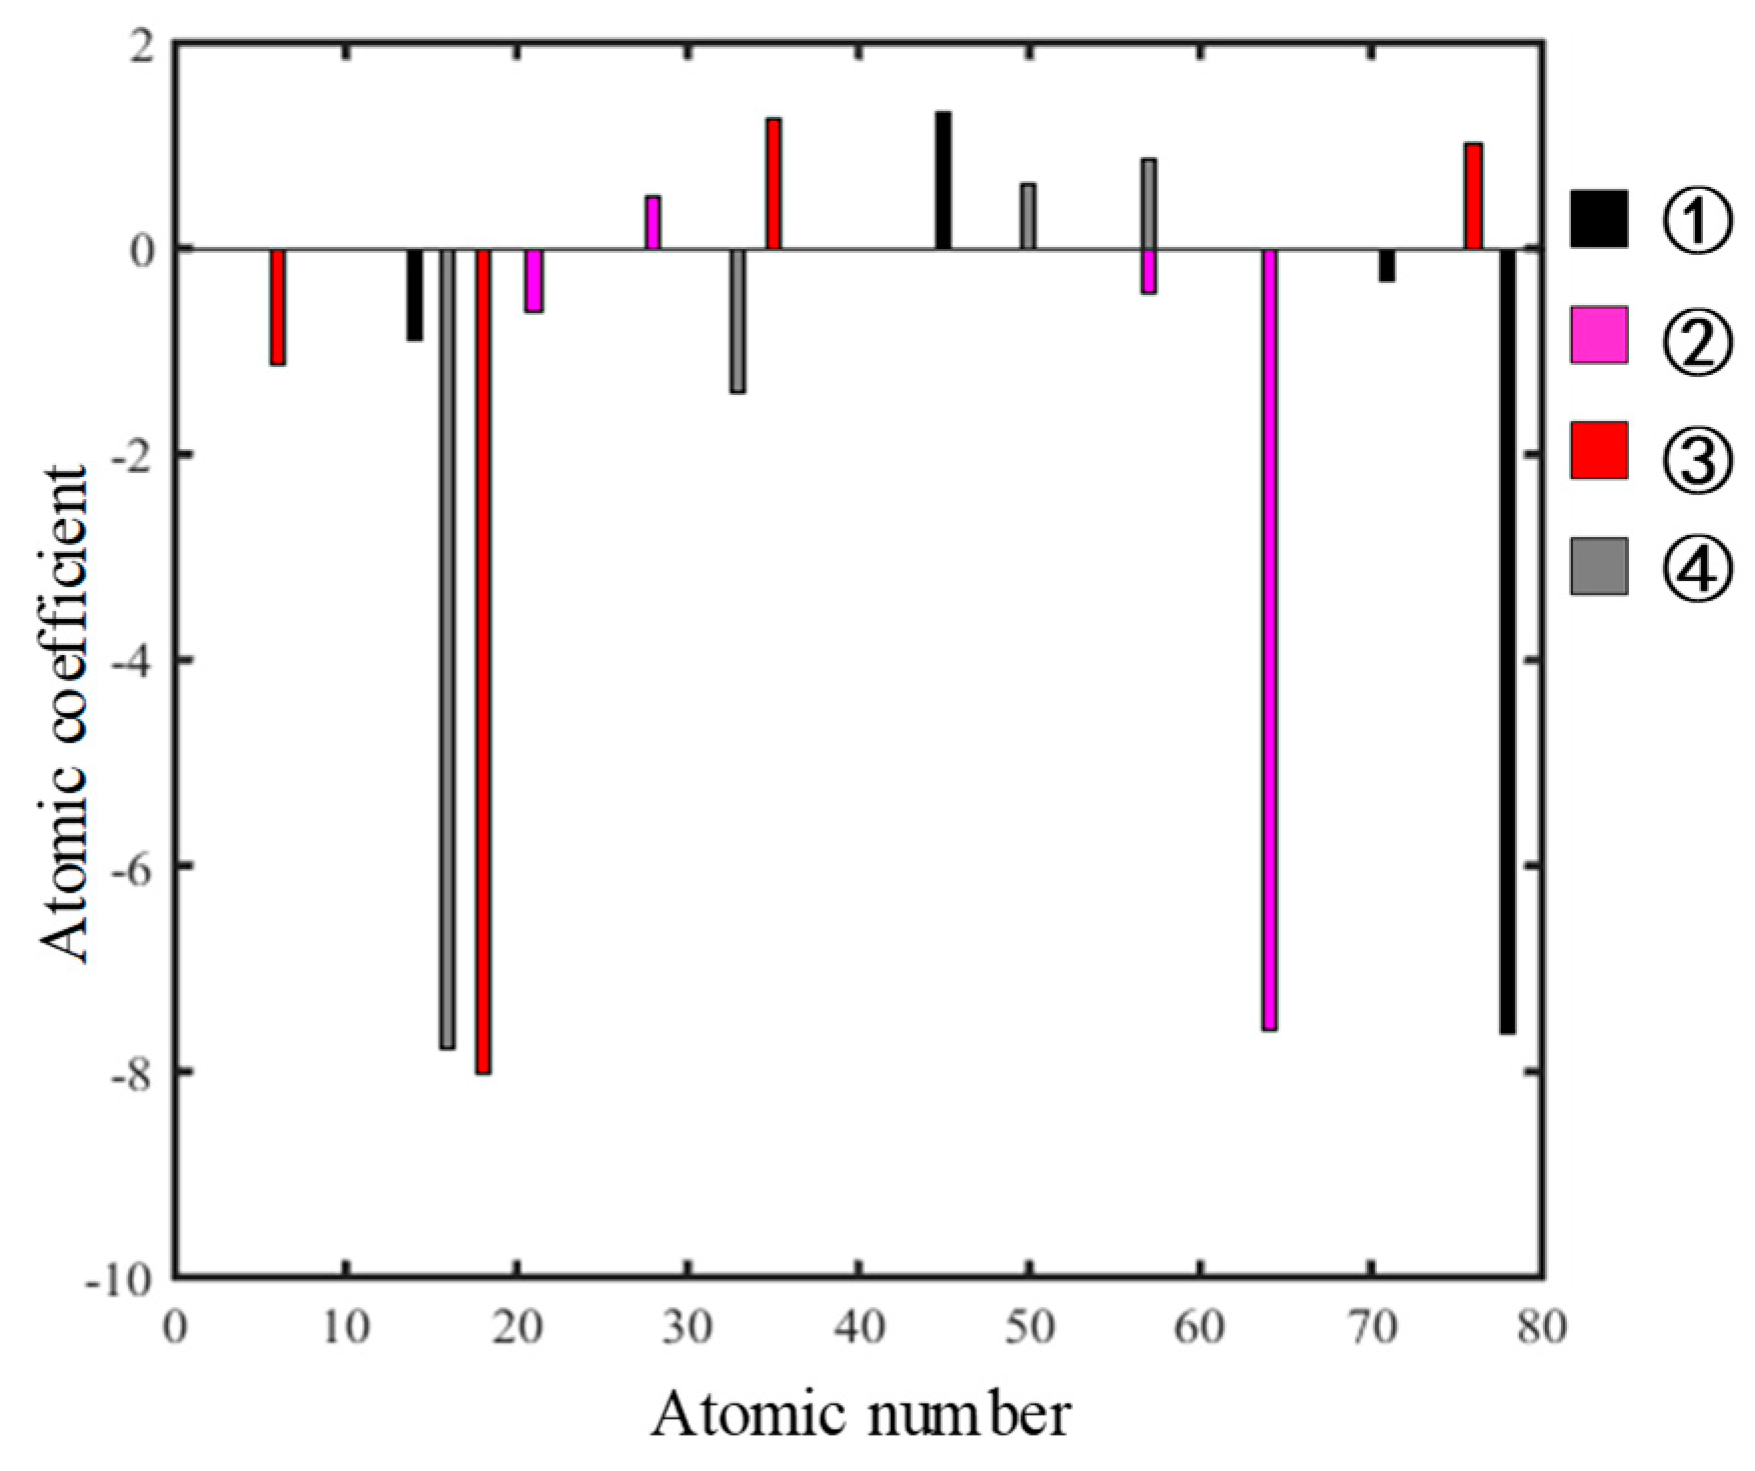
The K-SVD algorithm is used to reconstruct the voltage of each phase of the sag data. Figure 8 is the reconstruction of the representative four waveforms. Subfigure ① shows the waveform of the voltage sag, subfigure ② shows the waveform of the voltage swell, and subfigure ③ shows one of the phases of the transformer energizing. Subfigure ④ shows one of the phases of the motor starting. The black solid line represents the actual measured waveform, and the red dotted line represents the reconstruction. The waveform can be seen from the figure. The reconstructed result is close to the actual waveform feature, and the effective expression of the actual measured waveform is realized. Figure 9 shows the result of the parameter, including the dictionary atom and sparse coefficients used. Black represents the coefficient matrix of the reconstructed waveform in subfigure ①, pink is subfigure ②, red is subfigure ③, and gray is subfigure ④.
As shown in the figure, the dominant atoms of subfigures ①, ②, ③ and ④ are 78, 64, 19 and 16, respectively. The dominating atom and dominating coefficient are the parameters that can best reflect the characteristics of the waveform. The dominating atom and dominating coefficient of the same type of sag waveform also have high similarity. At the same time, different types of data correspond to different dominating atom.
4.3. Sag Classification Experiment Example
4.3.1. Experiment 1
In the voltage sag event, the proportion of short-circuit faults is the highest, and the impact is also the most serious. Short-circuit faults can be divided into balanced faults such as three-phase faults, and unbalanced faults such as two-phase fault single-phase faults. The classification accuracy rate of the fault data is shown in the following table.
In Table 2, only confusion between single-phase faults and two-phase faults appears in the classification results. The accuracy of the classification algorithm for balancing faults and unbalanced faults is 100%. In an unbalanced fault, voltage swell occurs in the non-faulty phase, which provides some help for determining the type of fault.
4.3.2. Experiment 2
Both transformer energizing and motor starting are due to manual operation in the grid. These two cases are non-faulty disturbances. The management for these two situations are different from the fault cases. Therefore, it is necessary to distinguish between fault and non-fault cases, and consider the sag as five kinds of situations: single-phase fault, two-phase fault, and three-phase fault., motor starting, transformer energizing. The classification results are shown in Table 3.
As the type of data increases, the label changes, and the result of the classification changes accordingly. The waveforms of some three-phase shortcircuits in the measured data are similar to that of the motor starting, resulting in a decrease in the classification accuracy rate of the three-phase fault.
4.3.3. Experiment 3
Since the data uploaded by the sag monitoring terminal is three-phase voltage data, this provides conditions for judging the phase in which the fault occurs. Therefore, the classification of voltage sag sources can not only help to assess the severity of sag impact and control power quality, but also can be used as auxiliary information for fault phase selection to improve the efficiency of fault management. In this paper, the sag type is divided into nine categories: A, B, C, AB, BC, AC, ABC, motor starting, transformer energizing, the correct classification rate is shown in Table 4.
In the table above, the classification accuracy of the two-phase fault and the three-phase fault is not satisfactory, and there is some confusion between the three-phase fault and the motor start, which is caused by a serious imbalance of the types of sag. Types with less data are classified with lower accuracy. The characteristic vector values of individual cases in the three-phase fault data set are close to the motor start, thus causing classification errors. However, when the amount of data increases, the classification accuracy will increase.
4.4. Comparative Analysis
We select the classification methods in reference [10,11] to compare with the method proposed in this paper. Among them, reference [10] discusses four major categories: single-phase, two-phase, three-phase and transformer energizing. Reference [11] discusses faults, transformer energizing, and motor starting. The discussion content is similar to the content in Experiment 2 of this paper. Therefore, the results of Experiment 2 are compared with the two methods. In the comparative experiment, the data used in the reference [10,11] is the same as the data set mentioned in the paper. The following are the results of the comparison of the three methods.
The calculation method of R%, P%, Q%, A% comes from Equations (17)–(20). It can be seen from the comparison that the identification result of the proposed method is better than the above two methods, as shown in Table 5. The problem of unbalanced sample size also affects the above two methods. The essence of the above two methods is to analyze the characteristics of the typical waveform of the voltage sag, and then use the expert knowledge to extract the features contained in the sag waveform. This method is more effective for waveforms when the amount of data is small and the waveform is relatively regular. However, for monitoring data with more interference, the correct rate will decrease.
5. Conclusions
This paper proposes a feature extraction method for sag voltage waveform based on K-SVD and LS-SVM. Using the dominant atom and dominating coefficient sparsely expressed by each type of sag, the characteristic matrix is formed, and the identification of the voltage sag source is realized. In the algorithm experiment, the three classifications of the voltage sag type are discussed one by one, and the accuracy of each classification is over 90%. At the end of the paper, the algorithm proposed in this paper is compared with two other methods. The experimental results show the superiority of the proposed algorithm. The data used in the experimental analysis are all from the monitoring data of the Jiangsu Power Grid. The proposed algorithm has certain anti-interference ability and is highly practical.
Author Contributions
H.S. analyzed the data and wrote the paper. F.M. performed the simulation and modeling; C.Z. contributed analysis tools; Y.P. prepared the data; J.Z. analyzed the results and reviewed the modeling and text.
Funding
This research was funded by “the Fundamental Research Funds for the Central Universities, grant number 2018B15814”.
Conflicts of Interest
The authors declare no conflicts of interest.
References
- Wang, B.; Xu, W.; Pan, Z. Voltage sag state estimation for power distribution systems. IEEE Trans. Power Syst. 2005, 20, 806–812. [Google Scholar] [CrossRef]
- Arias-Guzmán, S.; Ruiz-Guzmán, O.A.; Garcia-Arías, L.F.; Jaramillo-Gonzáles, M.; Cardona-Orozco, P.D.; Ustariz-Farfán, A.J.; Cano-Plata, E.A.; Salazar-Jiménez, A.F. Analysis of Voltage Sag Severity Case Study in an Industrial Circuit. IEEE Trans. Ind. Appl. 2017, 53, 15–21. [Google Scholar] [CrossRef]
- Thakur, P.; Singh, A.K. Unbalance voltage sag fault-type characterization algorithm for recorded waveform. IEEE Trans. Power Deliv. 2013, 28, 1007–1014. [Google Scholar] [CrossRef]
- Brekke, K.; Esteves, J.; Bollen, M.; Lo Schiavo, L.; Villa, F.; Reti, G.; Haber, A.; Falcao, A.; Westergaard, T.; Kolessar, R. The CEER and the 4th Benchmarking Report on Quality of Electricity Supply. In Proceedings of the International Conference on Power Engineering, Energy and Electrical Drives, Lisbon, Portugal, 18–20 March 2009; pp. 291–296. [Google Scholar] [CrossRef]
- Weldemariam, L.; Cuk, V.; Cobben, S.; van Waes, J. Regulation and classification of voltage dips. CIRED—Open Access Proc. J. 2017, 1, 832–836. [Google Scholar] [CrossRef]
- McGranaghan, M.F.; Mueller, D.R.; Samotyj, M.J. Voltage sags in industrial systems. IEEE Trans. Ind. Appl. 1993, 29, 391–399. [Google Scholar] [CrossRef]
- López, M.A.; de Vicuña, J.L.; Miret, J.; Castilla, M.; Guzmán, R. Control Strategy for Grid-ConnectedThree-Phase Inverters During Voltage Sags to Meet Grid Codes and to Maximize Power Delivery Capability. IEEE Trans. Power Electron. 2018, 33, 9360–9374. [Google Scholar] [CrossRef]
- Xiao, X.Y.; Chen, Y.Z.; Wang, Y.; Ma, Y.Q. Multi-attribute analysis on voltage sag insurance mechanisms and their feasibility for sensitive customers. IET Gener. Transm. Distrib. 2018, 12, 3892–3899. [Google Scholar] [CrossRef]
- Zhan, L.; Bollen, M.H. Characteristic of voltage dips (sags) in power systems. IEEE Trans. Power Delivery 2000, 15, 827–832. [Google Scholar] [CrossRef]
- Styvaktakis, E.; Bollen, M.H.; Gu, I.Y.H. Expert system for classification and analysis of power system events. IEEE Trans. Power Delivery 2002, 17, 423–428. [Google Scholar] [CrossRef]
- Axelberg, P.G.; Gu, I.Y.H.; Bollen, M.H. Support vector machine for classification of voltage disturbances. IEEE Trans. Power Delivery 2007, 22, 1297–1303. [Google Scholar] [CrossRef]
- Chen, W.; Hao, X.; Lin, J. Interference Source of Voltage Sag in Distribution System Automatic Identification and Classification Using Wavelet and Neural Network. In Proceedings of the 6th World Congress on Intelligent Control and Automation, Dalian, China, 21–23 June 2006. [Google Scholar]
- Faiz, J.; Lotfi-fard, S.; Bollen, M.H.J. Wavelet-based Mann and Morrison algorithm for improvement of three-phase unbalanced voltage dips characterization. IET Gener. Transm. Distrib. 2007, 1, 640–646. [Google Scholar] [CrossRef]
- Costa, F.B.; Driesen, J. Assessment of voltage sag indices based on scaling and wavelet coefficient energy analysis. IEEE Trans. Power Delivery 2013, 28, 336–346. [Google Scholar] [CrossRef]
- Alam, R.M.; Muttaqi, K.M.; Bouzerdoum, A. A new approach for classification and characterization of voltage dips and swells using 3-D polarization ellipse parameters. IEEE Trans. Power Delivery 2015, 30, 1344–1353. [Google Scholar] [CrossRef]
- García-Sánchez, T.; Gómez-Lázaro, E.; Muljadi, E.; Kessler, M.; Molina-García, A. Approach to fitting parameters and clustering for characterising measured voltage dips based on two-dimensional polarisation ellipses. IET Renew. Power Gener. 2017, 11, 1335–1343. [Google Scholar] [CrossRef]
- Bengio, Y.; Courville, A.; Vincent, P. Representation learning: A review and new perspectives. IEEE Trans. Pattern Anal. Mach. Intell. 2013, 35, 1798–1828. [Google Scholar] [CrossRef] [PubMed]
- Aharon, M.; Elad, M.; Bruckstein, A. K-SVD: An algorithm for de-signing overcomplete dictionaries for sparse representation. IEEE Trans. Signal Process. 2006, 54, 4311–4322. [Google Scholar] [CrossRef]
- Pati, Y.C.; Rezaiifar, R.; Krishnaprasad, P.S. Orthogonal Matching Pursuit: Recursive Function Approximation with Applications to Wavelet Decomposition. In Proceedings of the 27th Asilomar Conference on Signals, Systems and Computers, Pacific Grove, CA, USA, 1–3 November 1993; pp. 40–44. [Google Scholar] [CrossRef]
- Van Gestel, T.; Suykens, J.A.; Baesens, B.; Viaene, S.; Vanthienen, J.; Dedene, G.; De Moor, B.; Vandewalle, J. Benchmarking least squares support vector machine classifiers. Mach. Learn. 2004, 54, 5–32. [Google Scholar] [CrossRef]
- Fei, S.W.; Sun, Y. Forecasting dissolved gases content in power transformer oil based on support vector machine with genetic algorithm. Electr. Power Syst. Res. 2008, 78, 507–514. [Google Scholar] [CrossRef]
- Vapnik, V. The Nature of Statistical Learning Theory; Springer: New York, NY, USA, 1998; pp. 1–17. [Google Scholar]
- Wang, T.; Ye, X.; Wang, L.; Li, H. Grid search optimized SVM method for dish-like underwater robot attitude prediction. In Proceedings of the 5th International Joint Conference on Computational Sciences and Optimization, Harbin, China, 23–26 June 2012; pp. 839–843. [Google Scholar]
- Hsu, C.W.; Lin, C.J. A comparison of methods for multiclass support vector machines. IEEE Trans. Neural Networks 2002, 13, 415–425. [Google Scholar] [Green Version]
- Wang, Y.; Chen, Q.; Kang, C.; Xia, Q.; Luo, M. Sparse and Redundant Representation-Based Smart Meter Data Compression and Pattern Extraction. IEEE Trans. Power Syst. 2017, 32, 2142–2151. [Google Scholar] [CrossRef]
- Wang, Y.; Chen, Q.; Gan, D.; Yang, J.; Kirschen, D.S.; Kang, C. Deep Learning-Based Socio-demographic Information Identification from Smart Meter Data. IEEE Trans. Smart Grid 2018, 1, 1. [Google Scholar] [CrossRef]
Figure 1.
(a) A-phase short-circuit fault, (b) B-phase short-circuit fault, (c) C-phase short-circuit fault, (d) AB-phase short-circuit fault, and (e) AC-phase short-circuit fault, (f) BC phase short circuit fault, (g) ABC phase short circuit fault.
Figure 1.
(a) A-phase short-circuit fault, (b) B-phase short-circuit fault, (c) C-phase short-circuit fault, (d) AB-phase short-circuit fault, and (e) AC-phase short-circuit fault, (f) BC phase short circuit fault, (g) ABC phase short circuit fault.
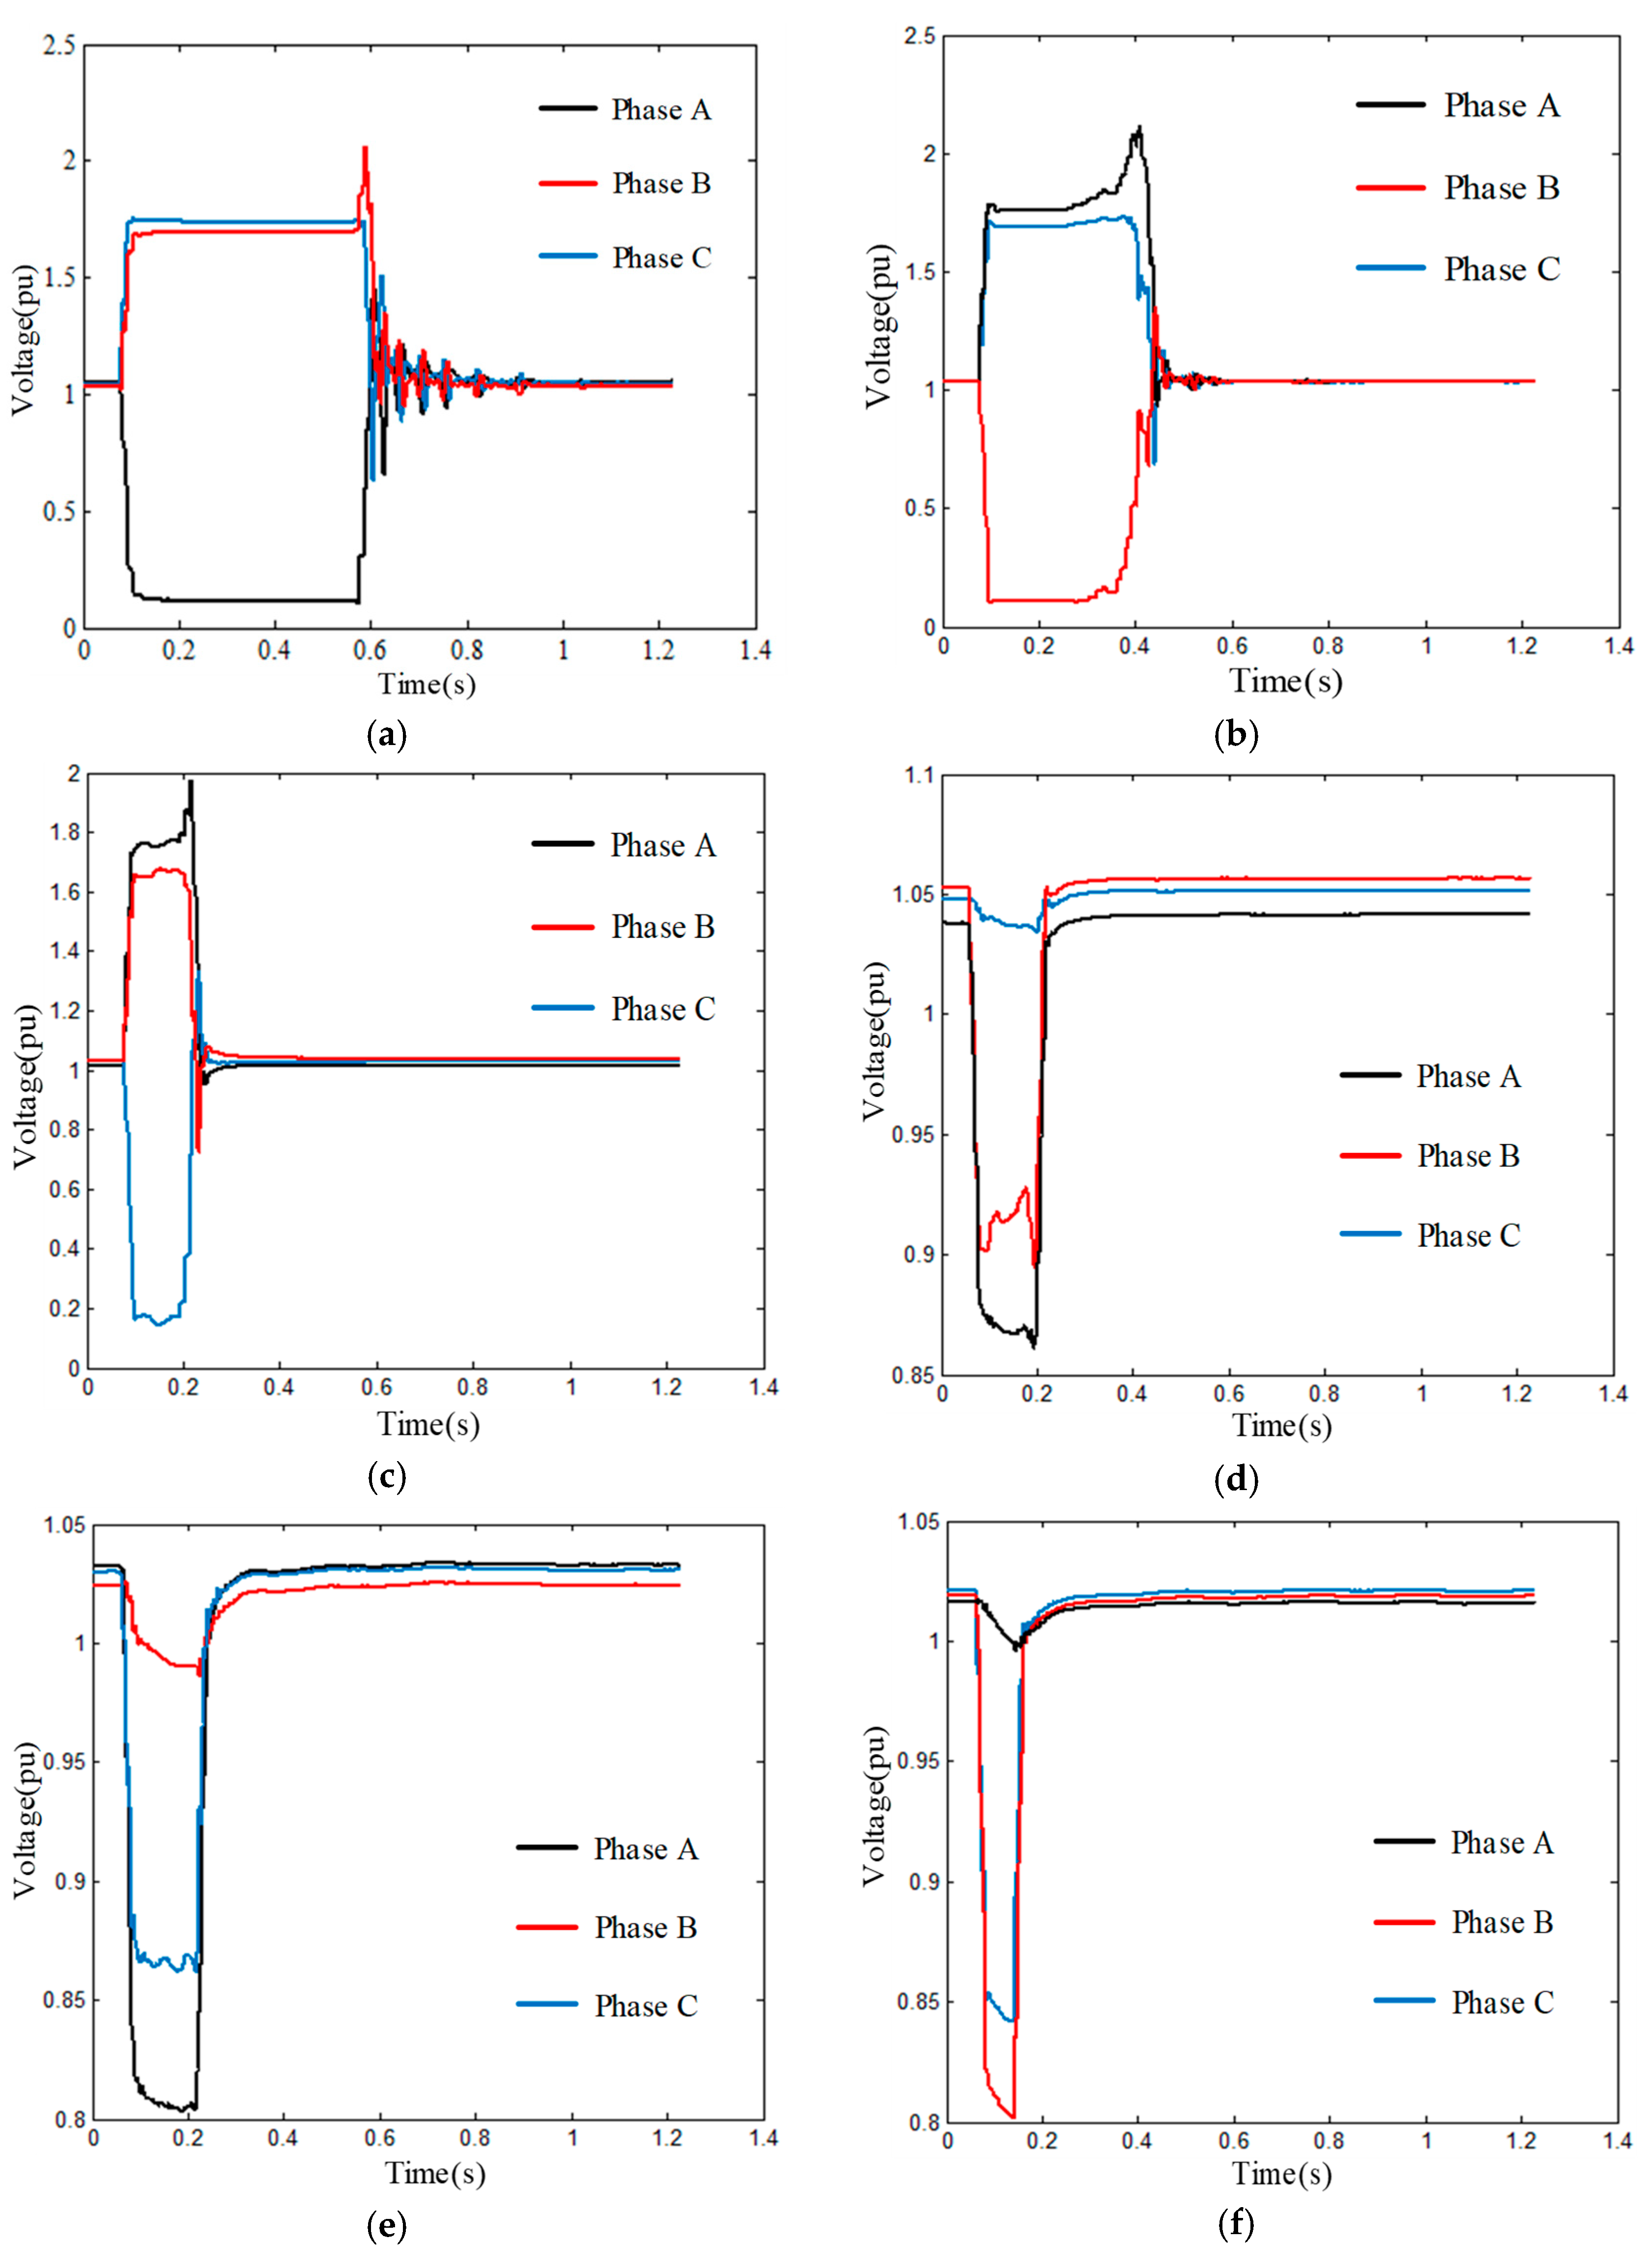

Figure 2.
(a) Transformer energizing, (b) Motor starting.
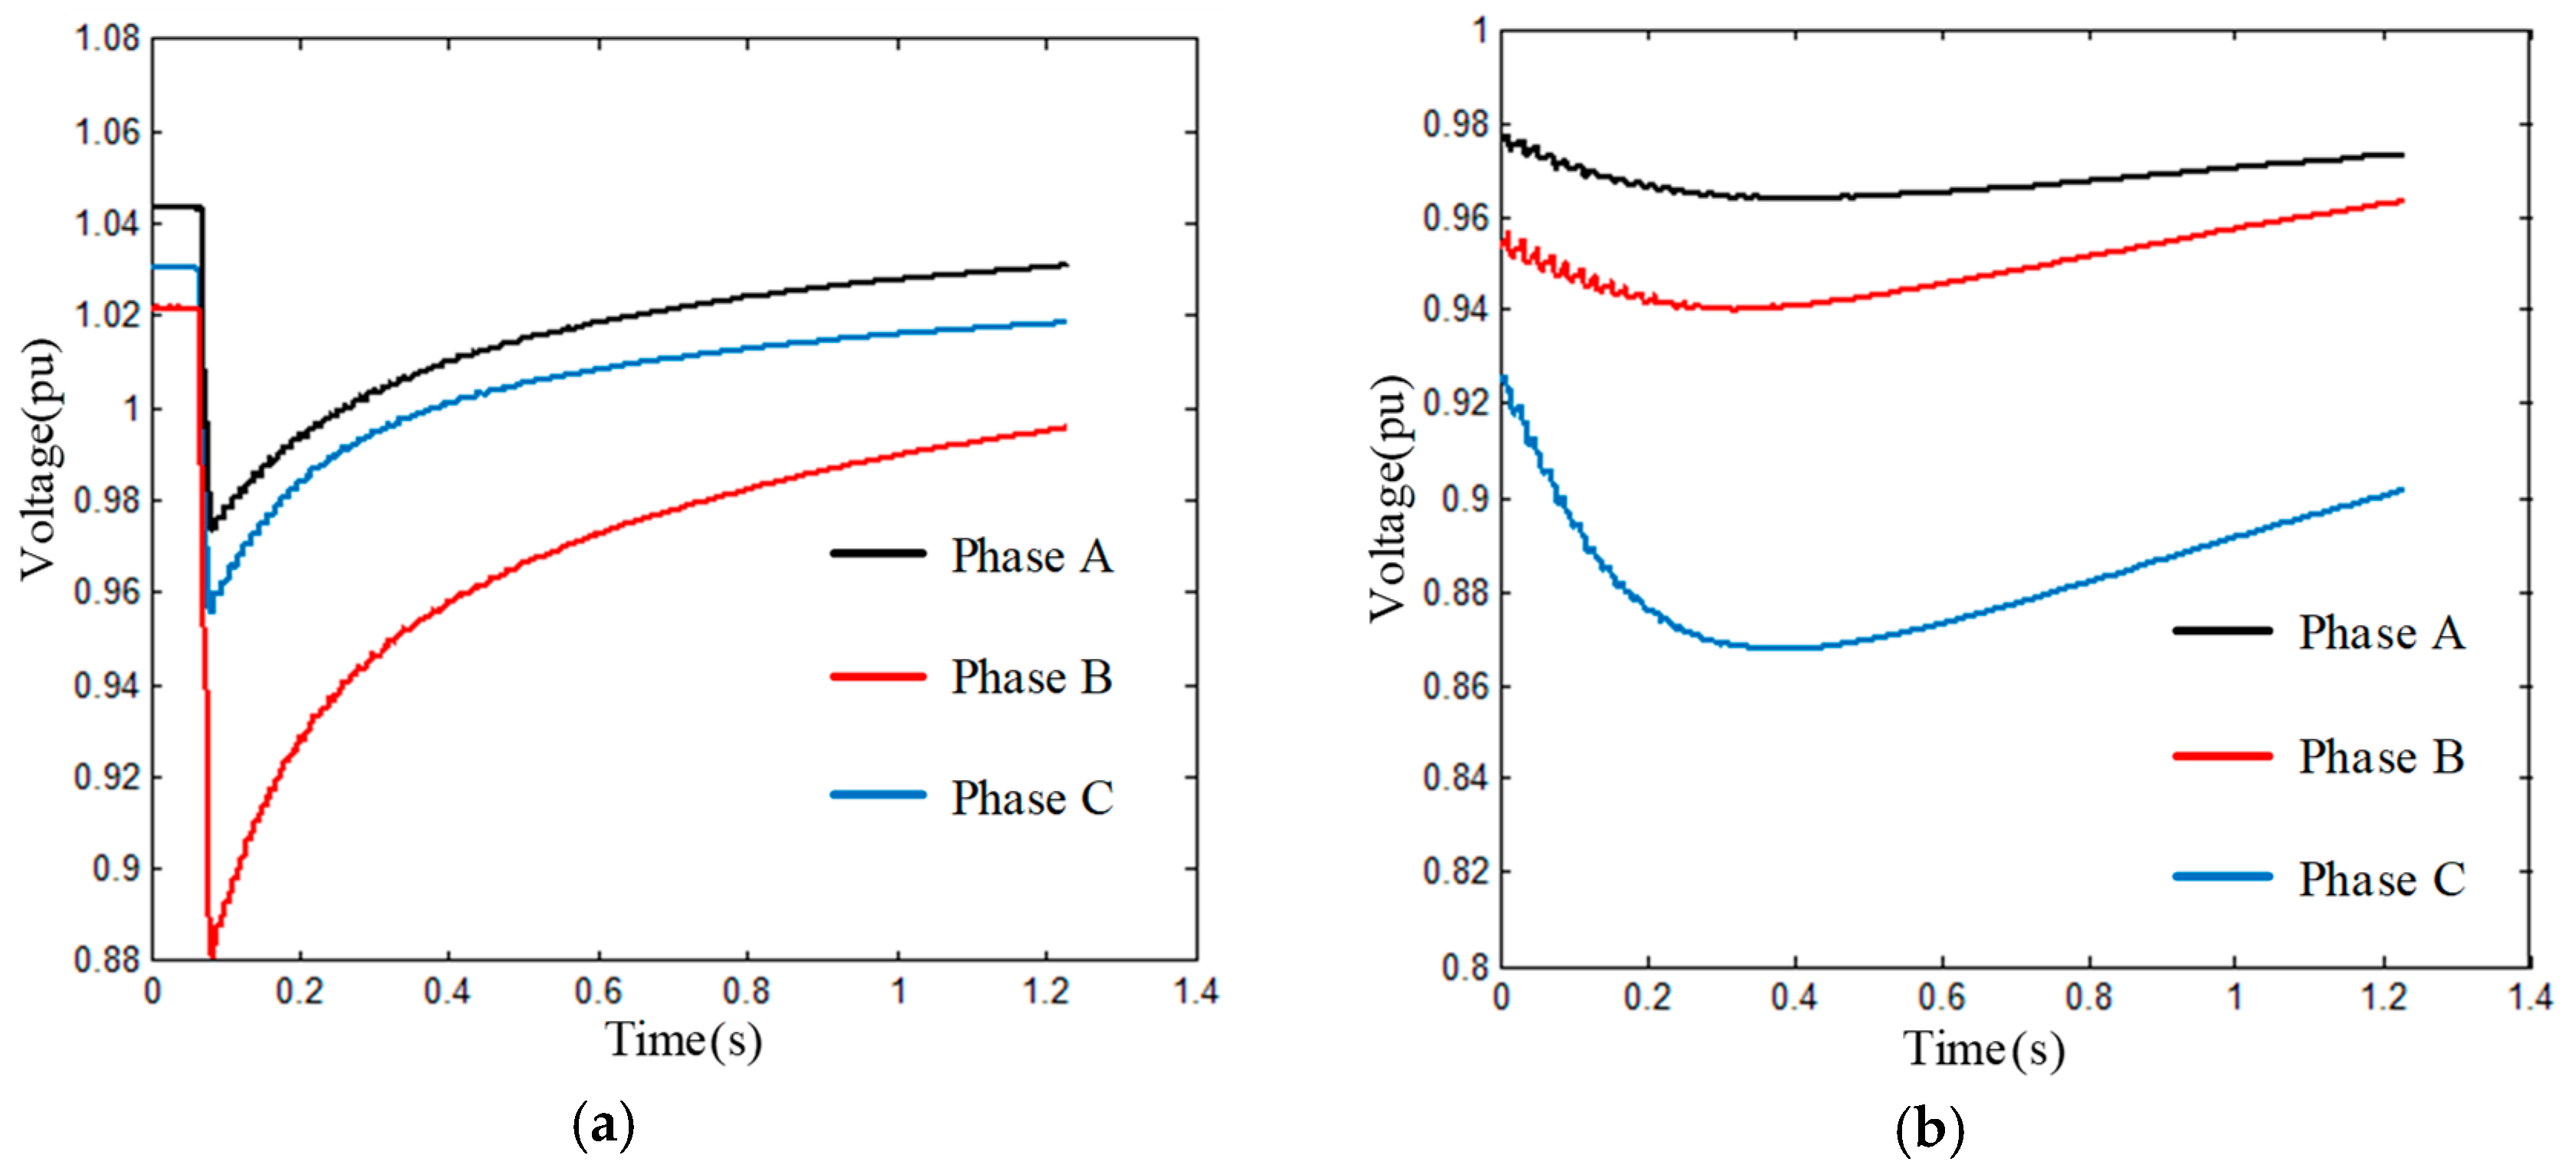
Figure 3.
Decomposition diagram calculated by K-SVD.
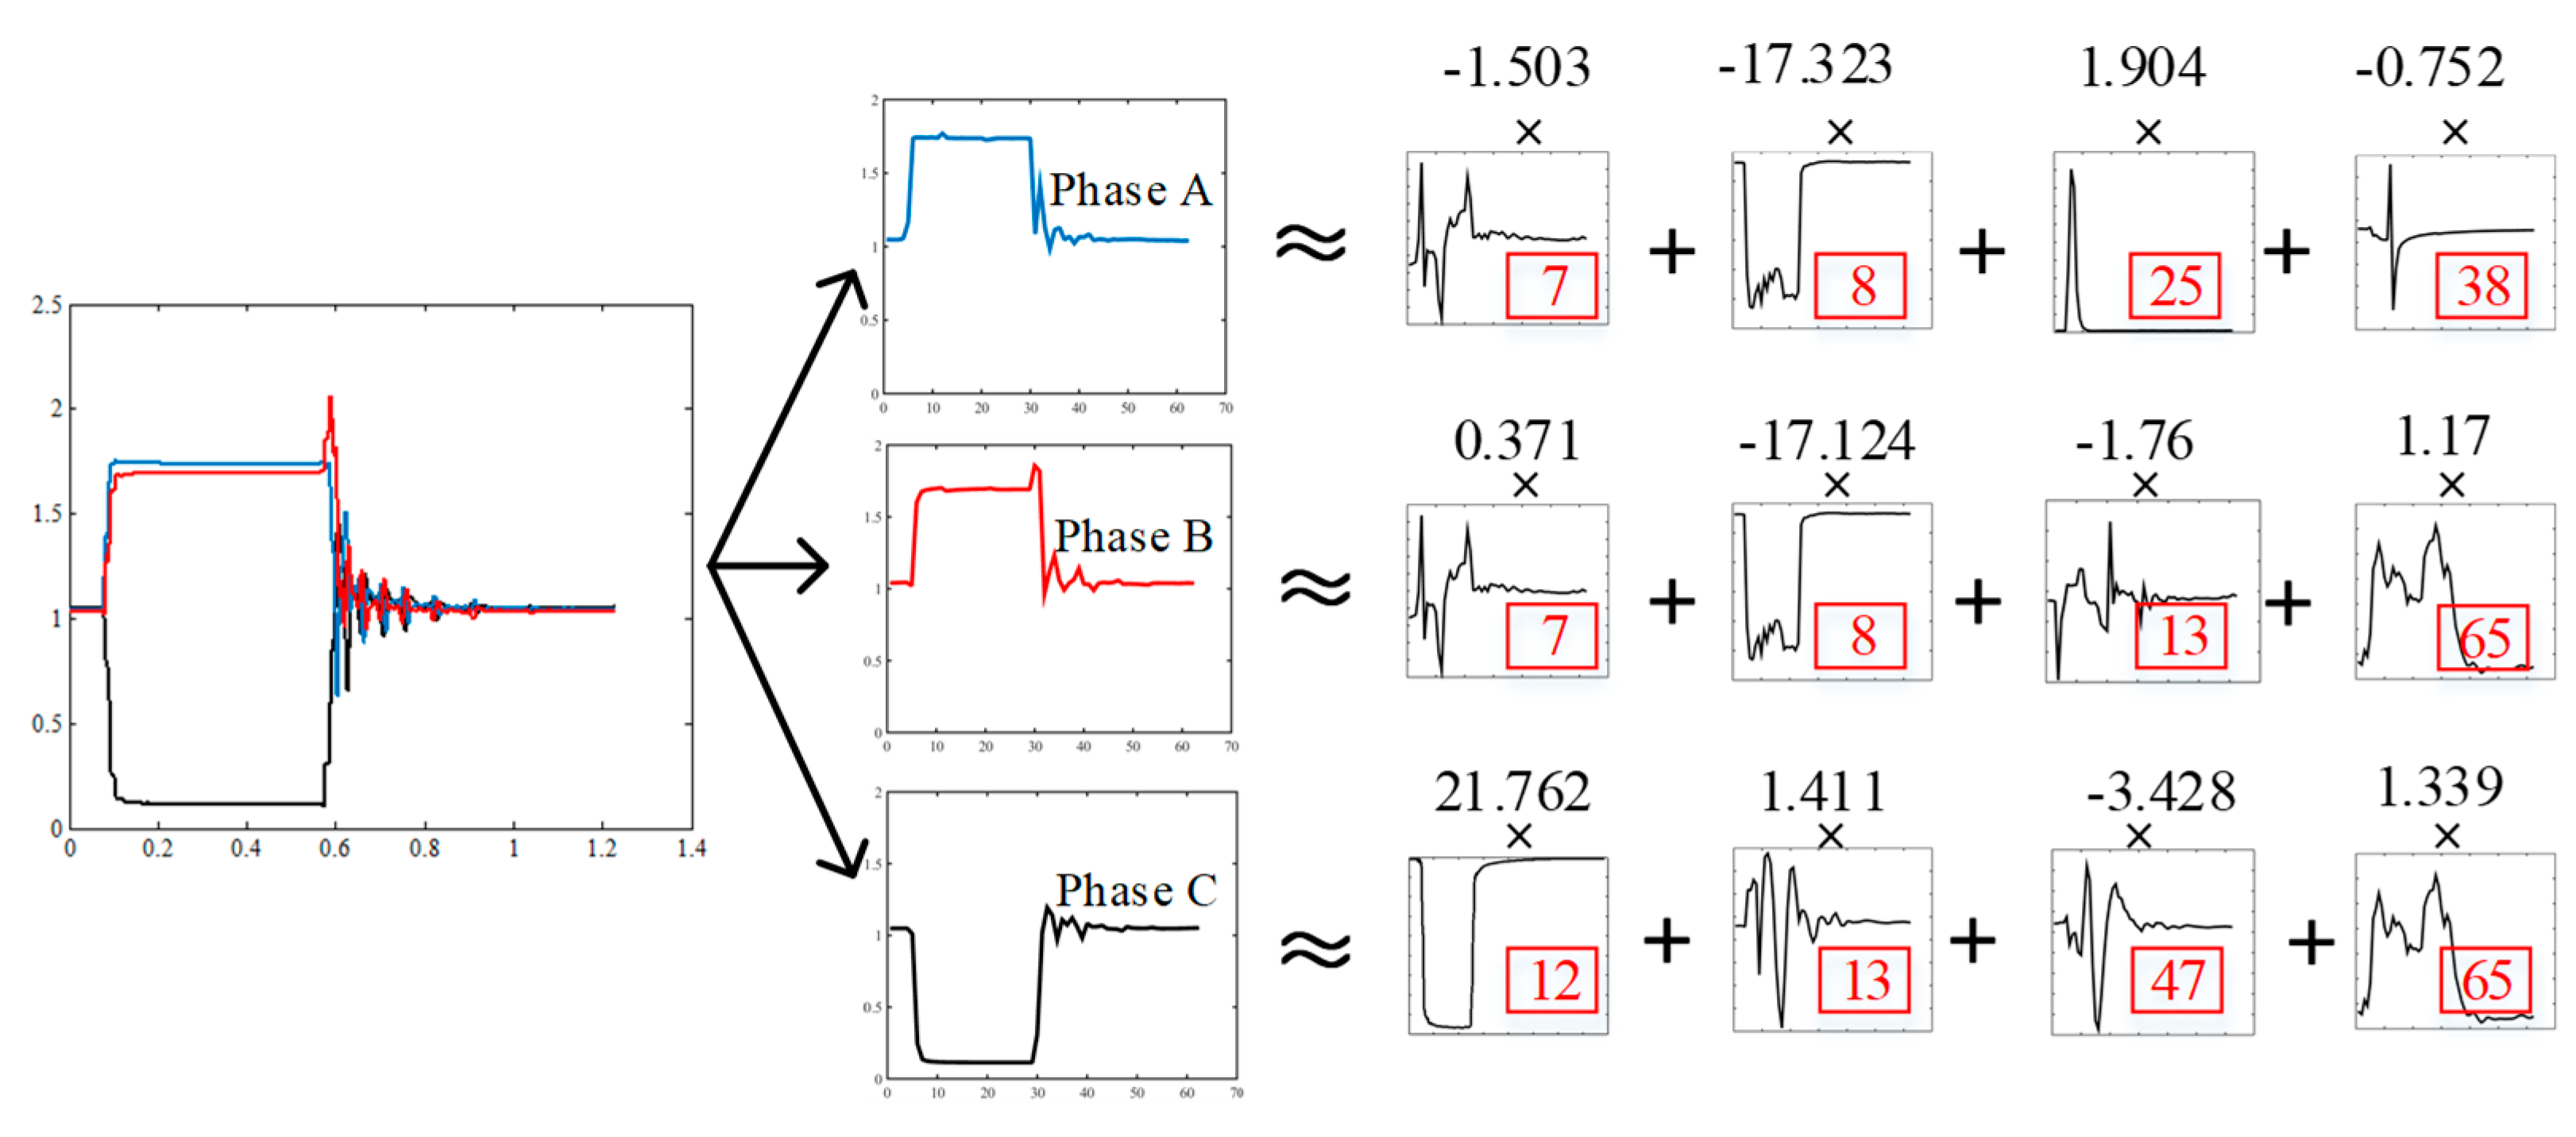
Figure 4.
SVM classification theory.
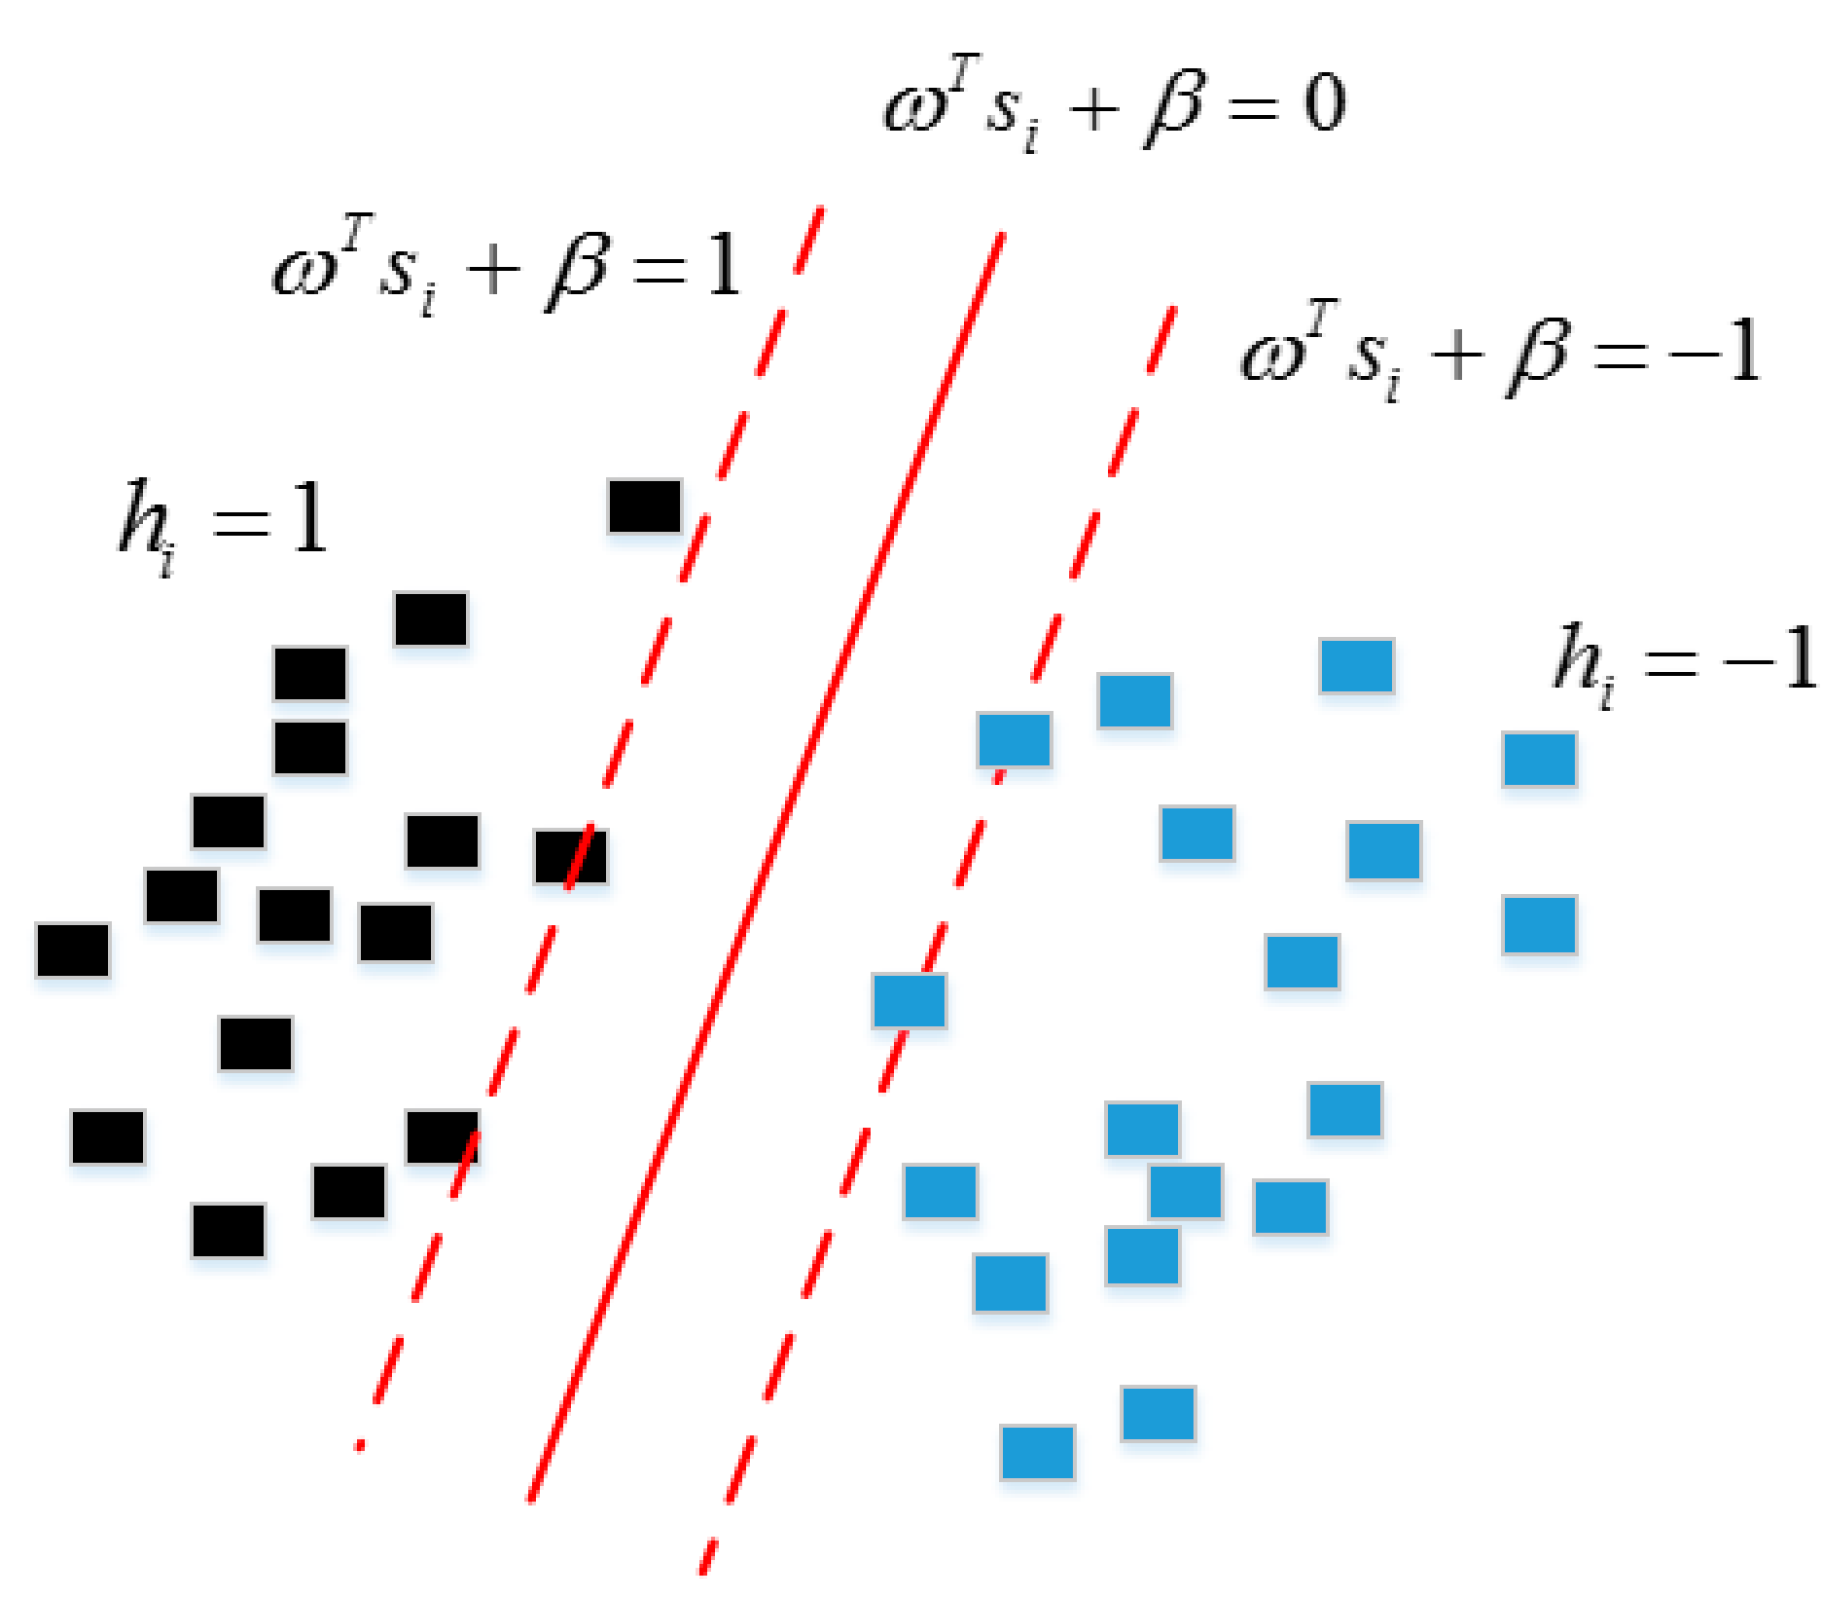
Figure 5.
Algorithm flowchart.
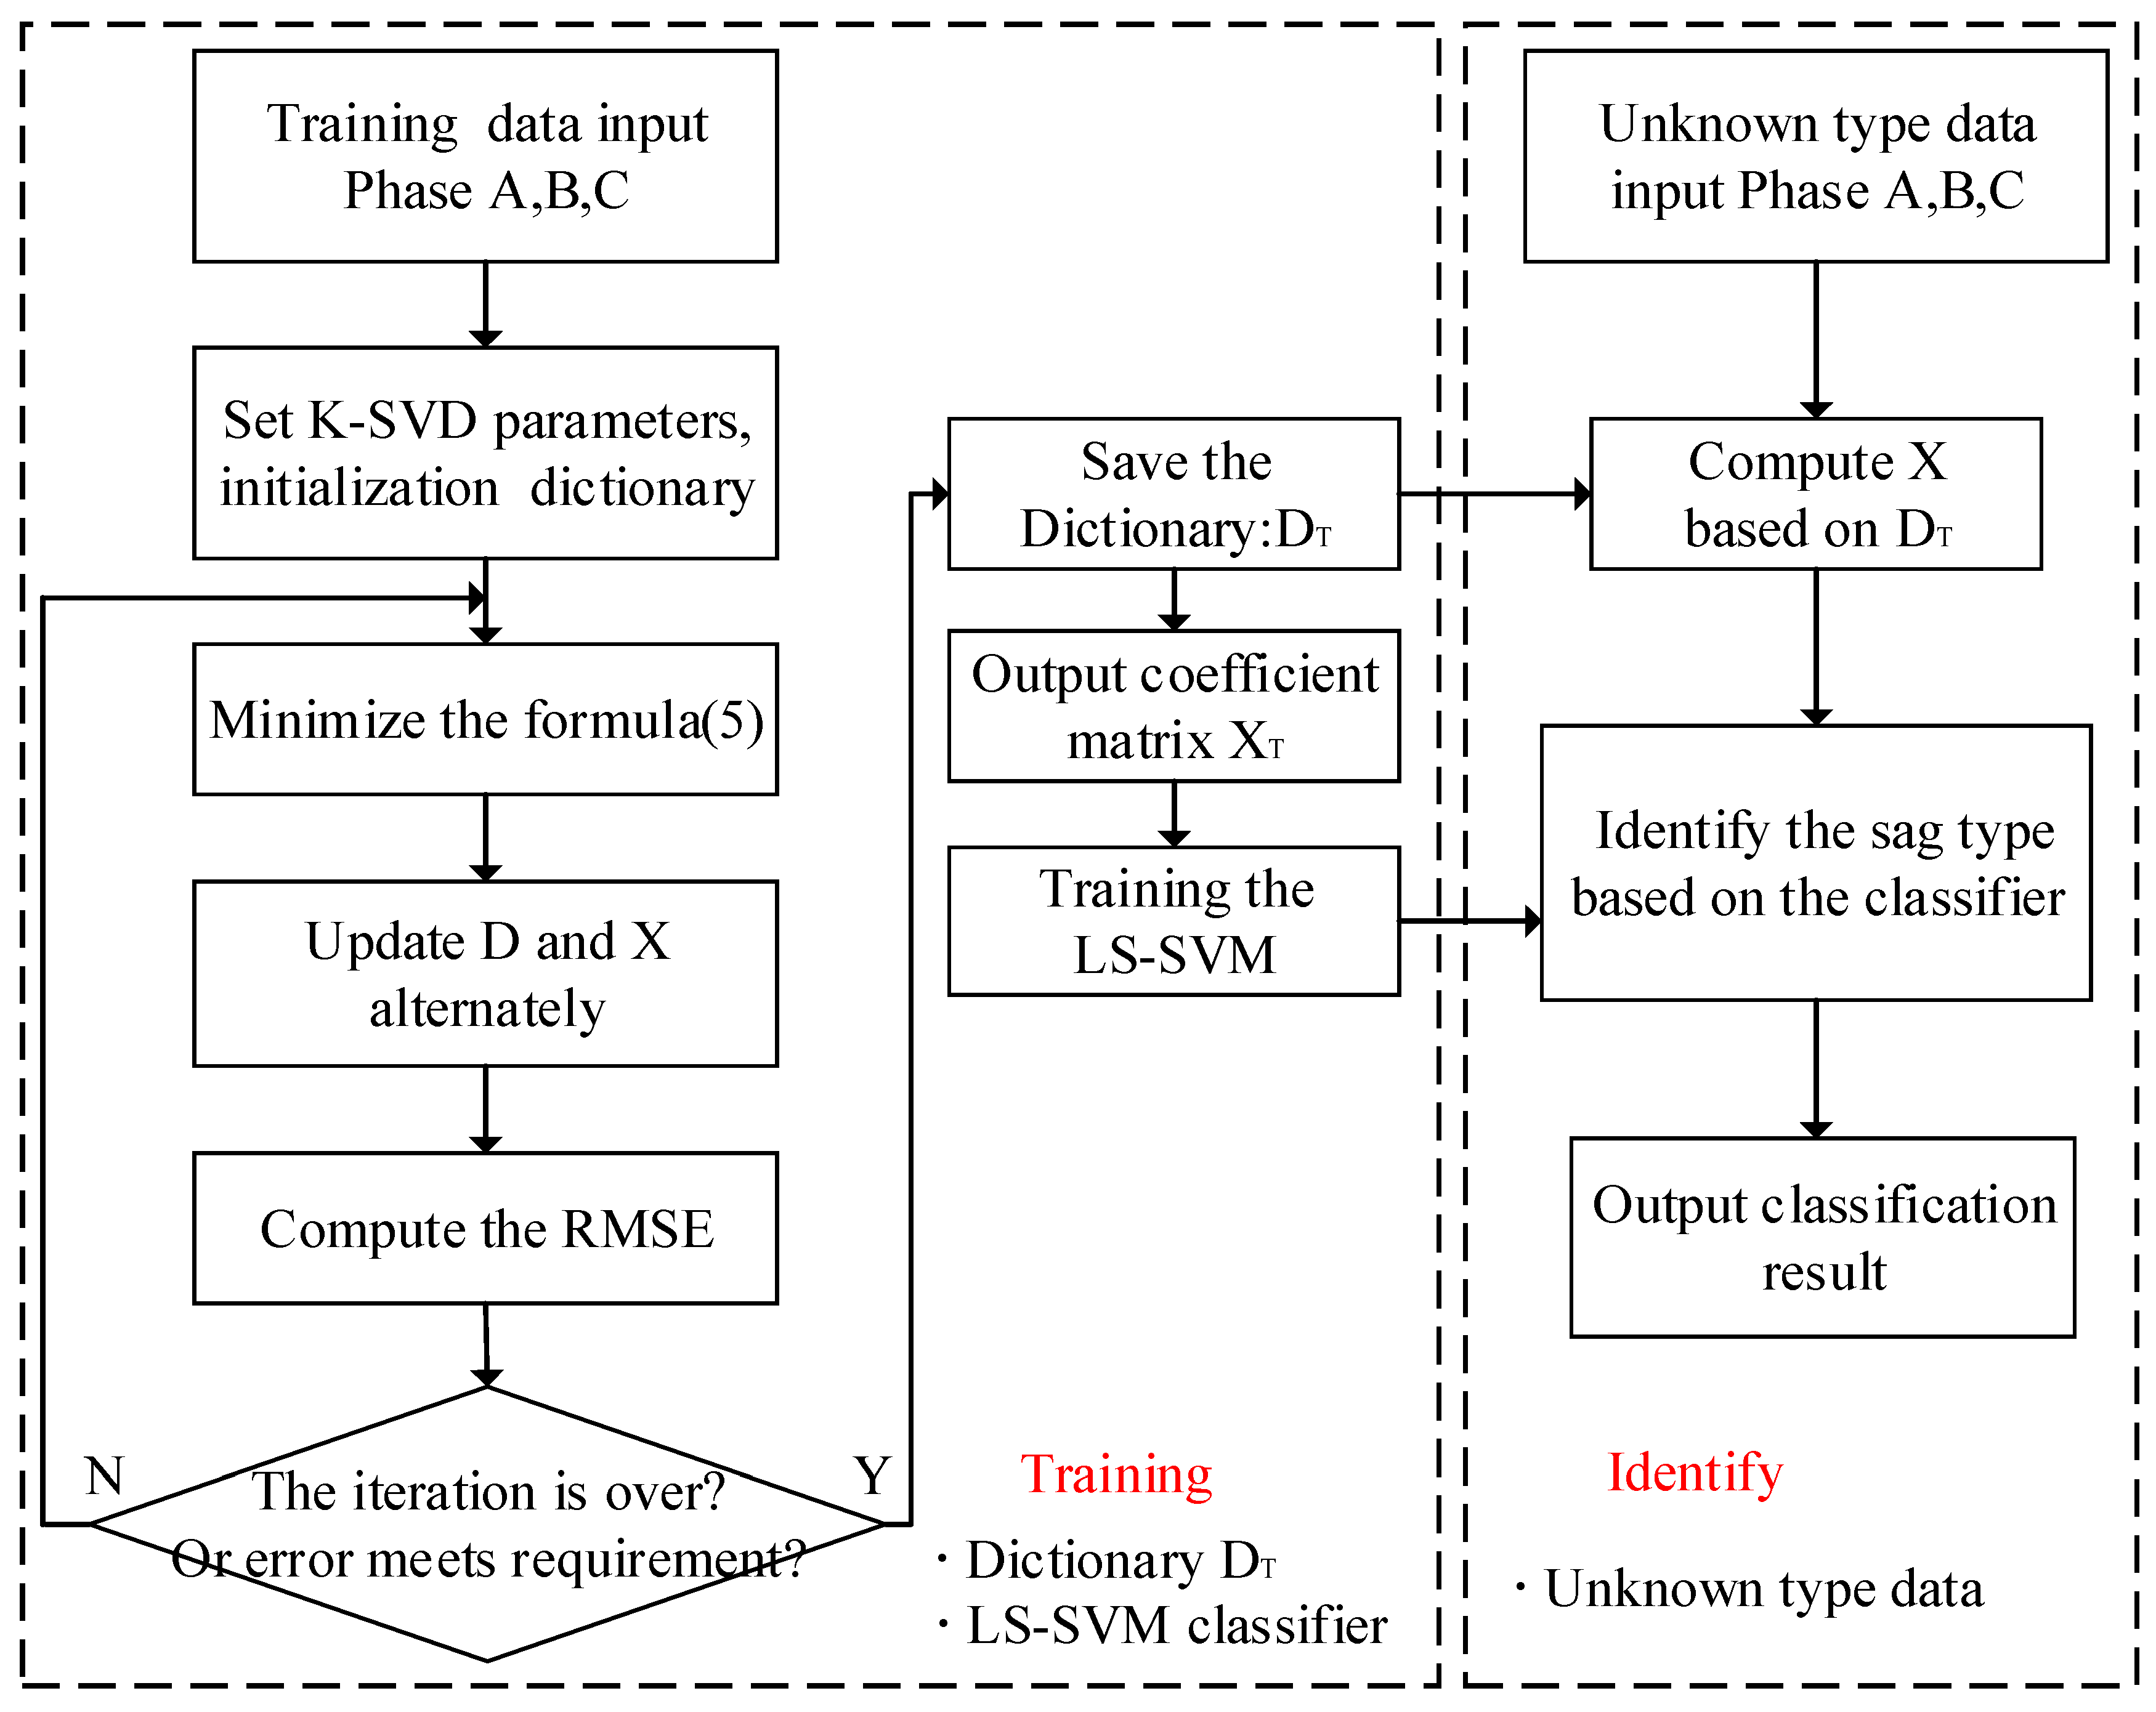
Figure 6.
The RMSE of the K-SVD algorithm as the parameters vary.
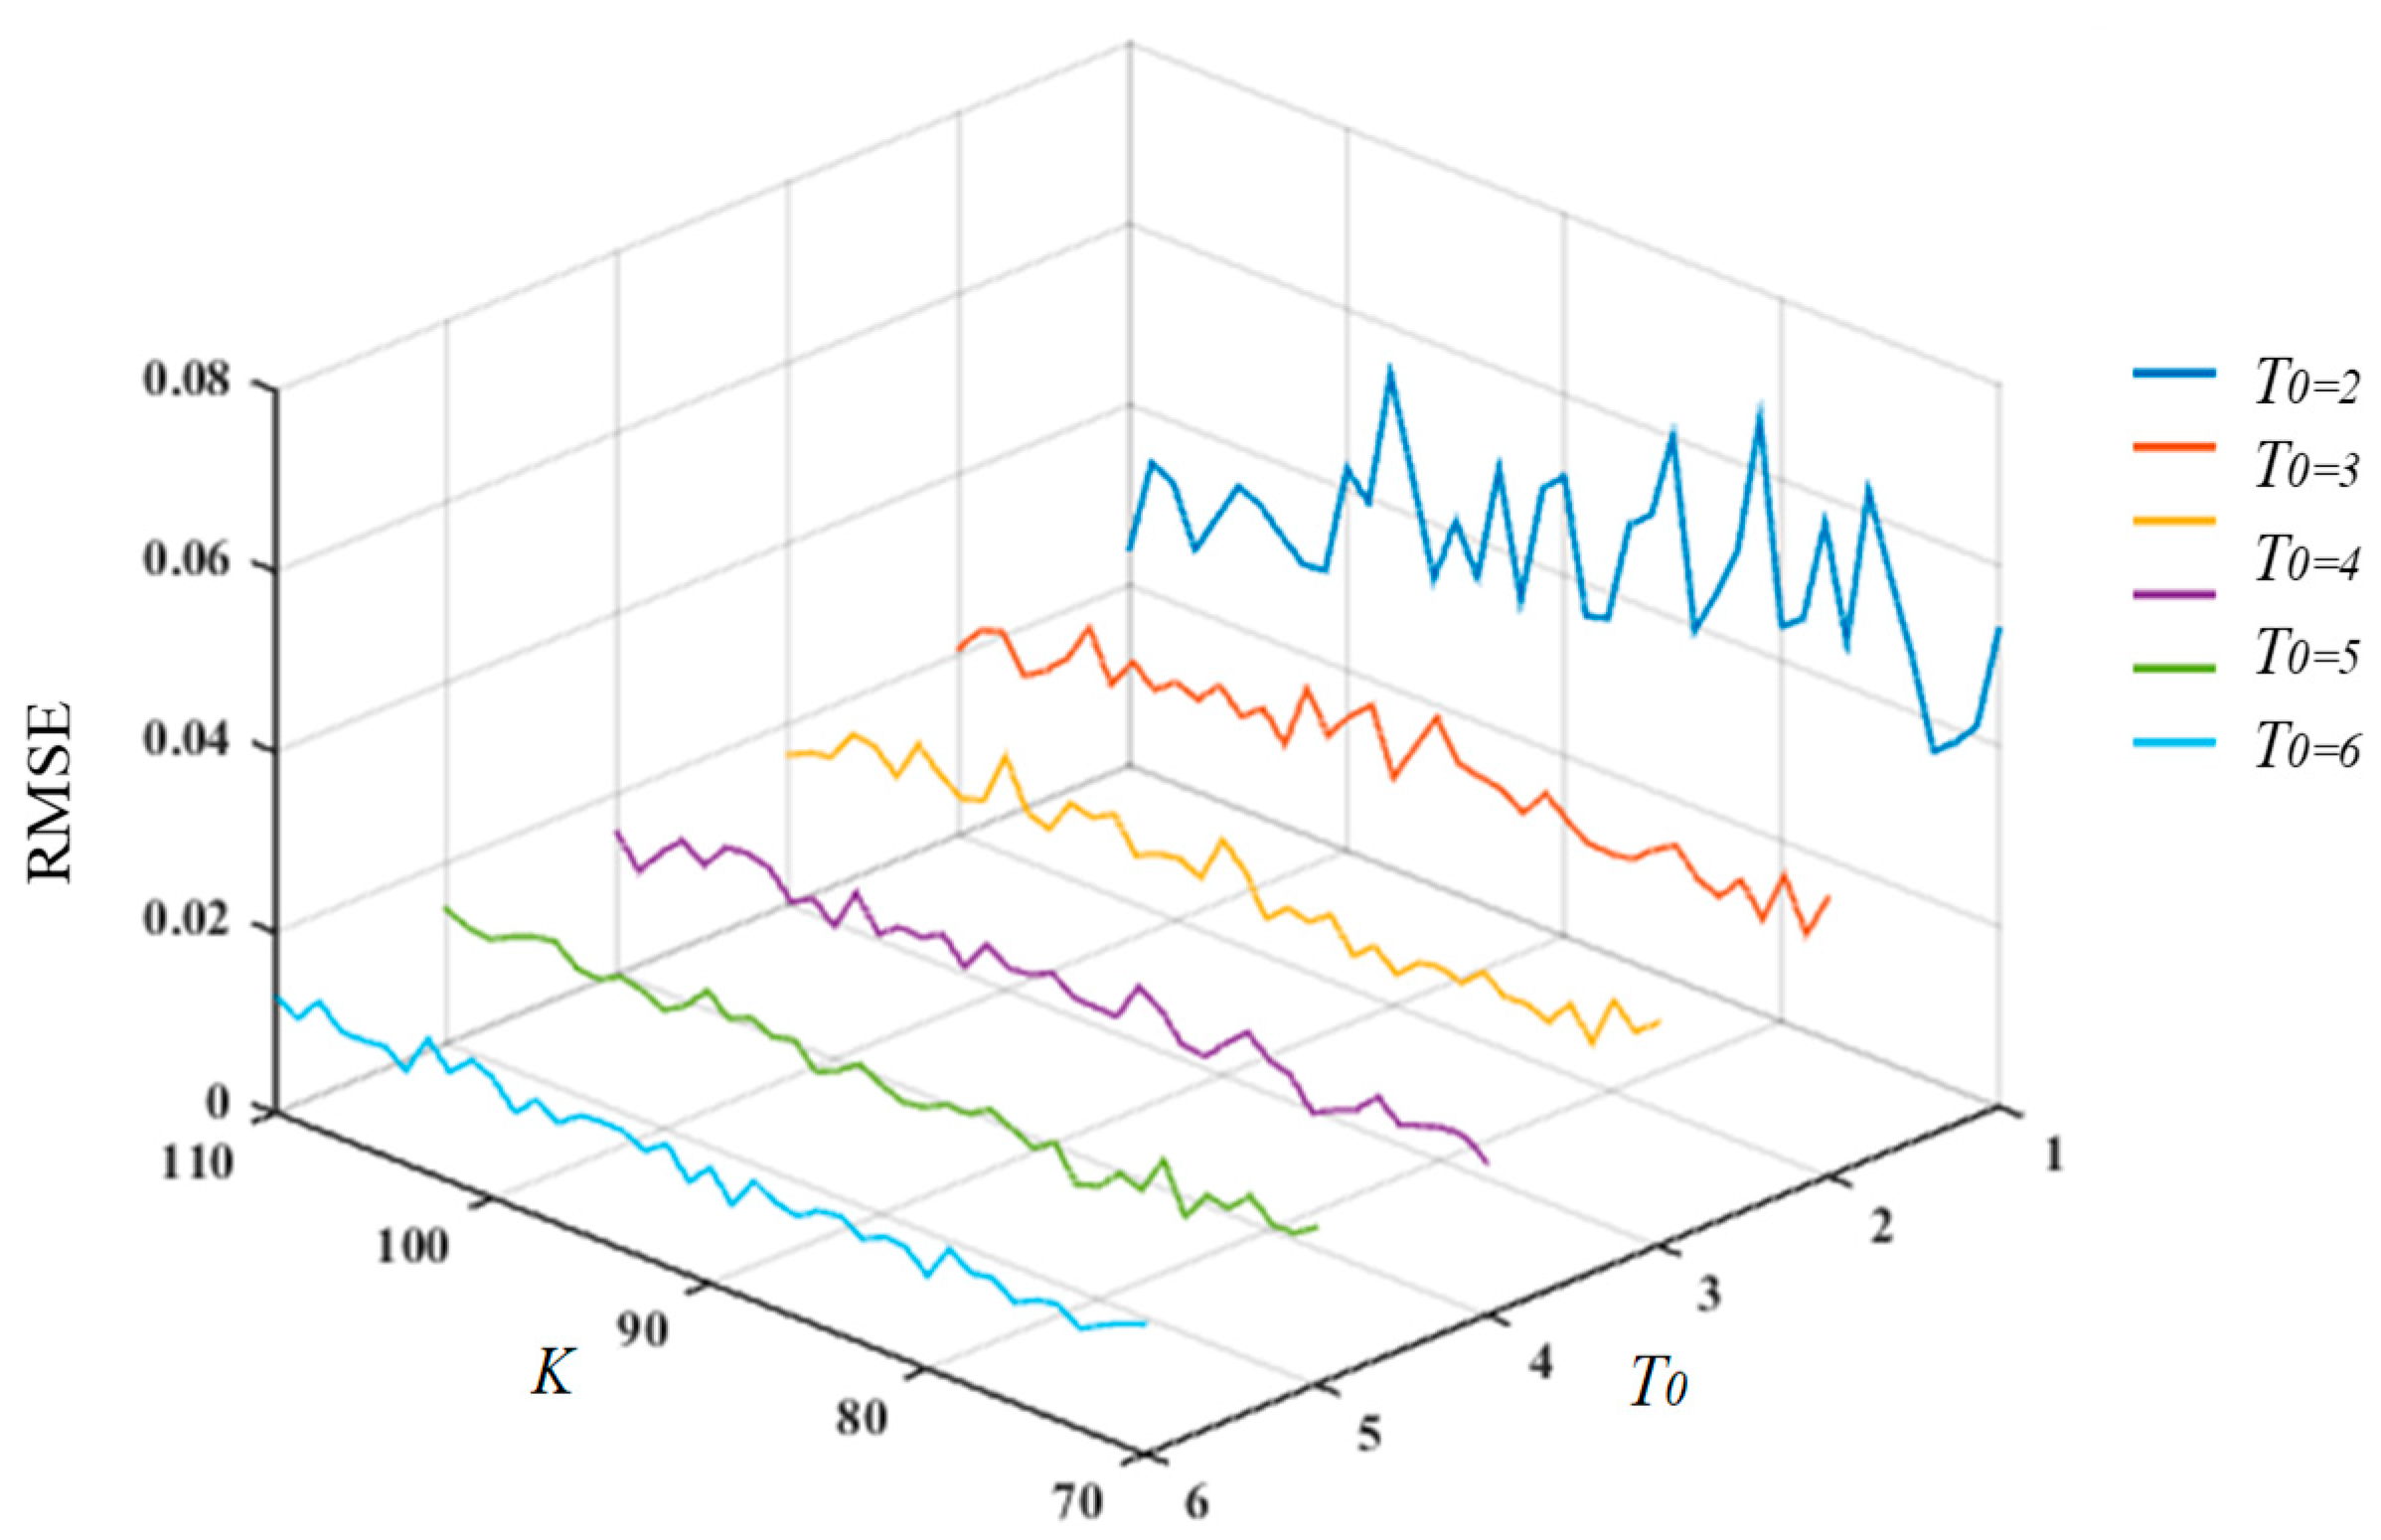
Figure 7.
The RMSE of the K-SVD algorithm for different numbers of iterations.
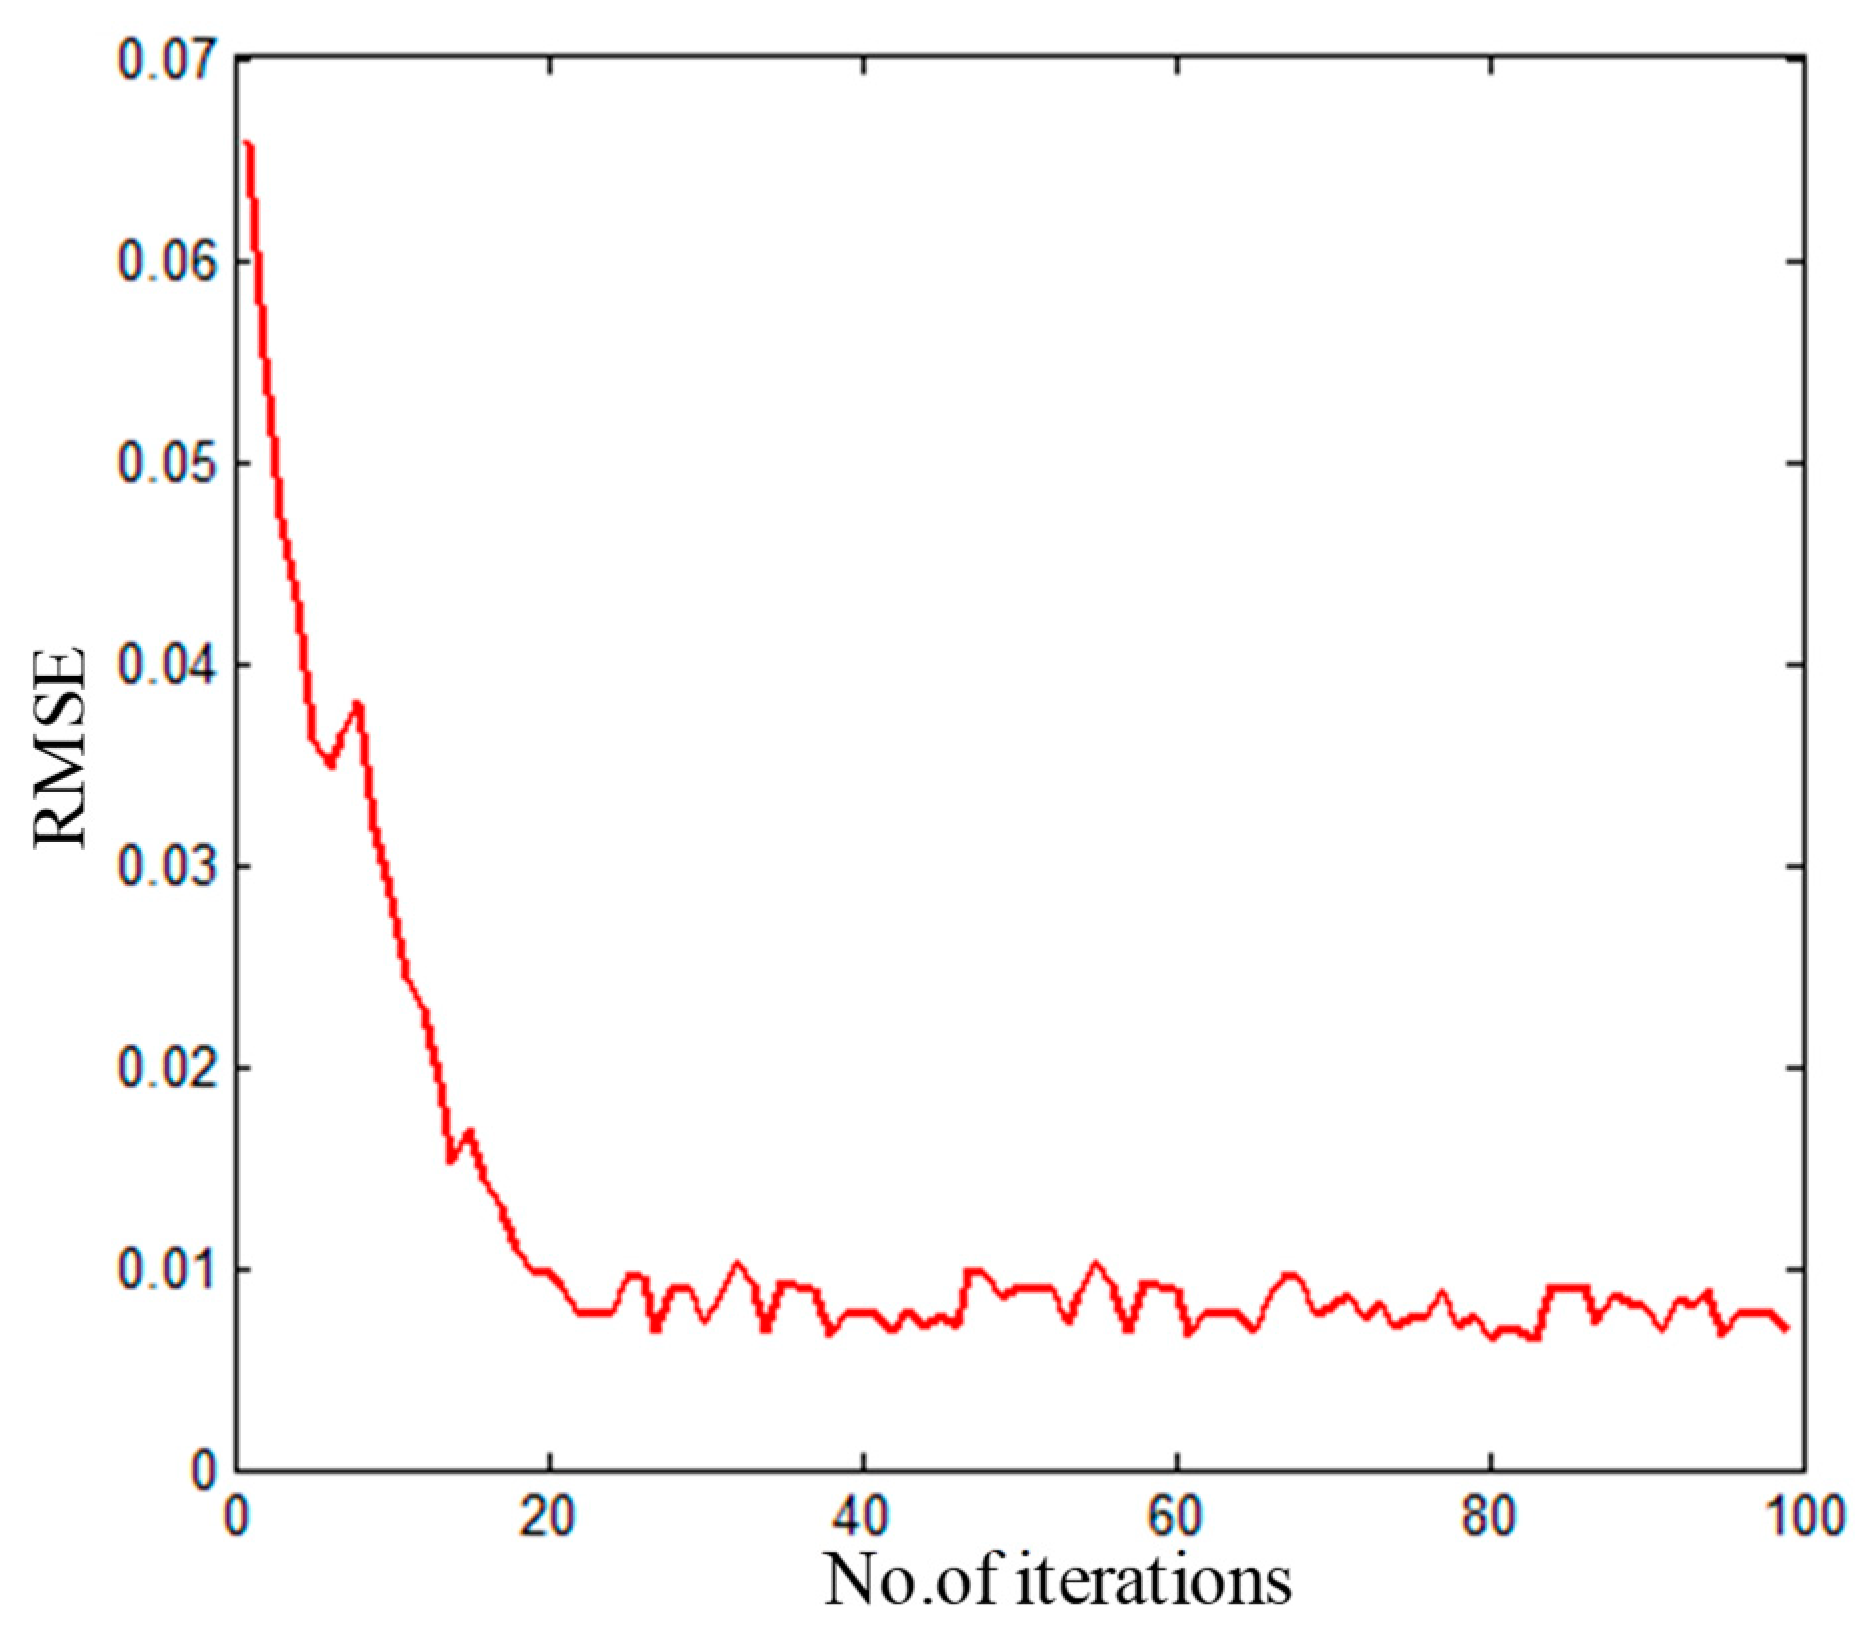
Figure 8.
Reconstruction of the sag waveform.
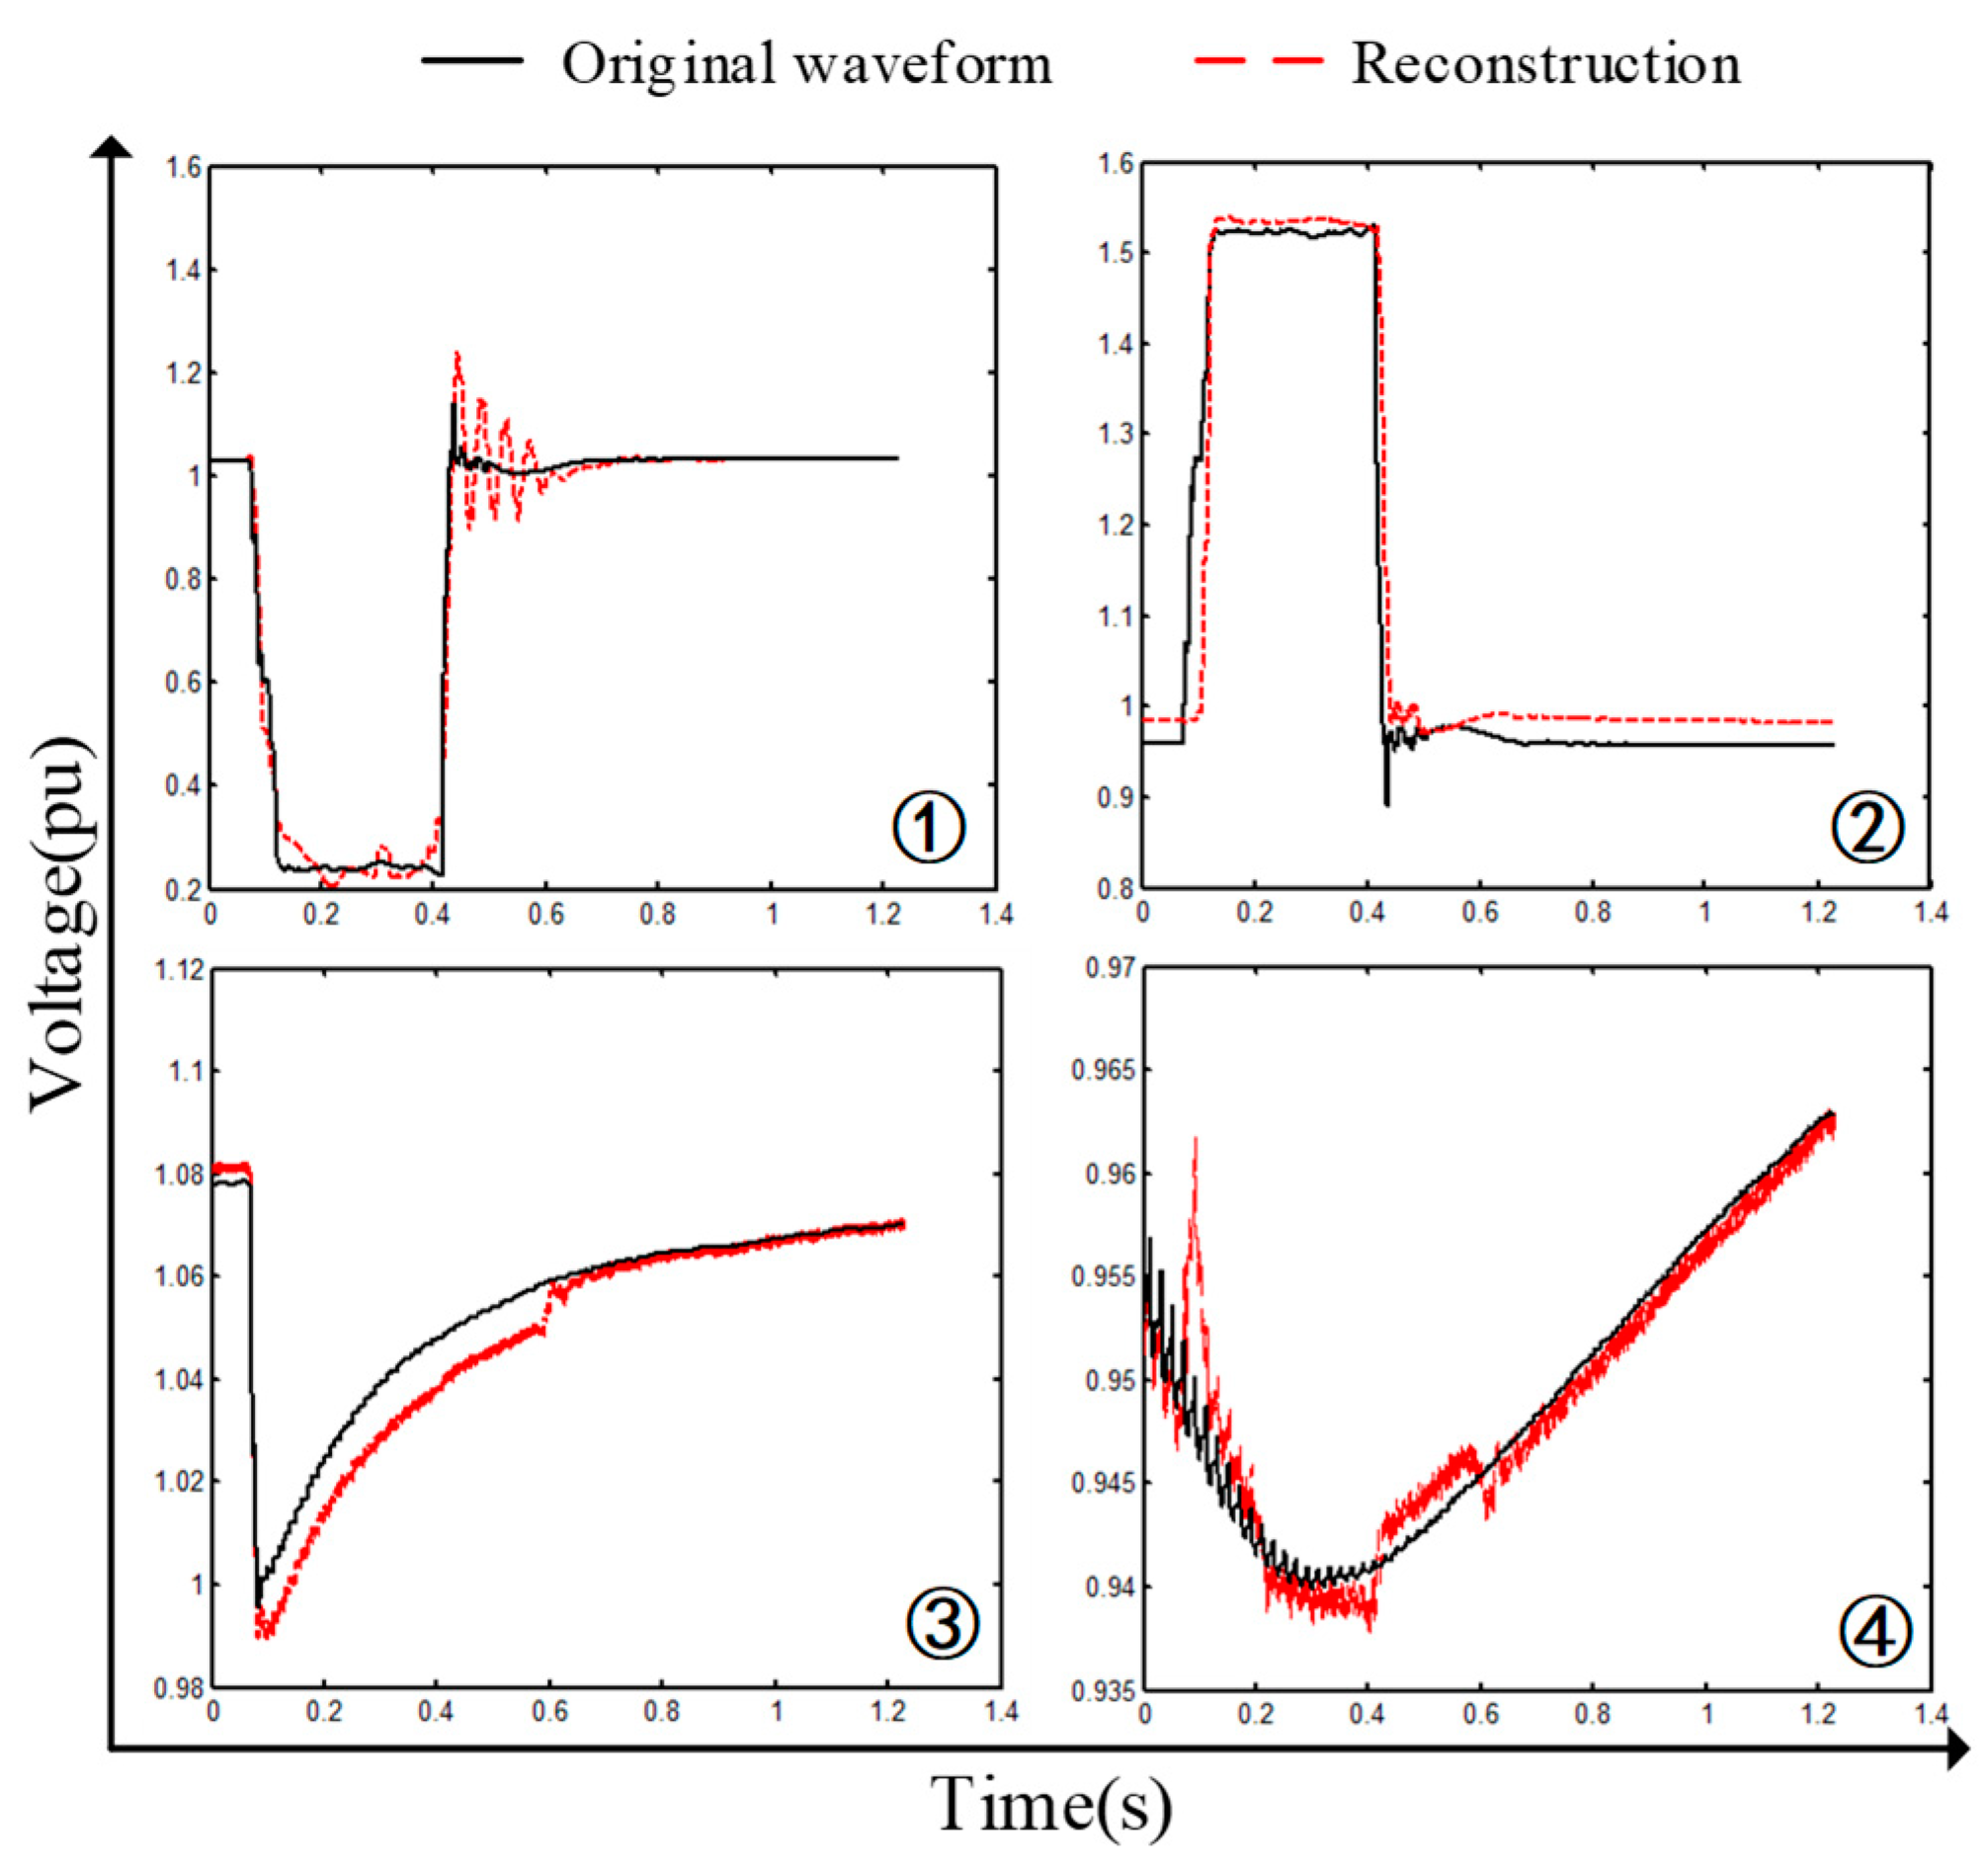
Figure 9.
The dictionary atom and sparse coefficients used.

Table 1.
Training and test data.
| Type | Number | Training | Test | |
|---|---|---|---|---|
| Fault-induced | A-phase short circuit | 465 | 348 | 117 |
| B-phase short circuit | 369 | 276 | 93 | |
| C-phase short circuit | 201 | 150 | 51 | |
| A- and B-phase short circuit | 72 | 54 | 18 | |
| B- and C-phase short circuit | 45 | 33 | 12 | |
| A- and C-phase short circuit | 120 | 90 | 30 | |
| Three-phase short circuit | 123 | 92 | 31 | |
| No-Fault-induced | Motor starting | 90 | 67 | 23 |
| Transformer energizing | 69 | 51 | 18 | |
| Total | 1554 | 1161 | 393 | |
Table 2.
Experiment 1 results.
| Sag Type | Single 1 | Two 1 | Three 1 | Q (%) |
|---|---|---|---|---|
| Single 1 (261) | 257 | 4 | - | 98.85 |
| Two 1 (60) | 2 | 58 | - | 95.07 |
| Three 1 (31) | - | - | 31 | 100 |
| Accuracy (%) | ||||
| 97.97 | ||||
1 Single means single-phase faults, two means two-phase faults, and Three means three-phase faults.
Table 3.
Experiment 2 results.
| Sag Type | Single 1 | Two 1 | Three 1 | M 2 | T 2 | Q (%) |
|---|---|---|---|---|---|---|
| Single 1 (261) | 258 | 3 | - | - | - | 98.23 |
| Two 1 (60) | 1 | 59 | - | - | - | 92.92 |
| Three 1 (31) | - | - | 27 | 4 | - | 92.03 |
| M 2 (23) | - | - | 1 | 22 | - | 88.91 |
| T 2 (18) | - | - | - | - | 18 | 100 |
| Accuracy (%) | ||||||
| 95.14 | ||||||
1 Single means single-phase faults, two means two-phase faults, and Three means three-phase faults; 2 M means motor starting and T means transformer energizing.
Table 4.
Experiment 3 results.
| Sag Type | A | B | C | AB | BC | AC | ABC | M 1 | T 1 | Q (%) |
|---|---|---|---|---|---|---|---|---|---|---|
| A (117) | 117 | - | - | - | - | - | - | - | - | 100 |
| B (93) | - | 93 | - | - | - | - | - | - | - | 98.43 |
| C (51) | - | 51 | - | - | - | - | - | - | 95.34 | |
| AB (18) | - | 2 | 16 | - | - | - | - | - | 94.18 | |
| BC (12) | - | 1 | 2 | - | 9 | - | - | - | - | 85.71 |
| AC (30) | - | - | 3 | - | - | 27 | - | - | - | 94.74 |
| ABC (31) | - | - | - | - | - | - | 27 | 4 | - | 91.51 |
| M 1 (23) | - | - | - | - | - | - | 1 | 22 | - | 89.81 |
| T 1 (18) | - | - | - | - | - | - | - | - | 18 | 100 |
| Accuracy (%) | ||||||||||
| 92.98 | ||||||||||
1 M means motor starting and T means transformer energizing.
Table 5.
Performance of different methods for sag Identification.
| Sag Type | Expert System | SVM | The Proposed Method | |||||||||
|---|---|---|---|---|---|---|---|---|---|---|---|---|
| R% | P% | Q% | A% | R% | P% | Q% | A% | R% | P% | Q% | A% | |
| Single 1 (261) | 95.8 | 98.8 | 97.28 | 91.88 | 93.9 | 98.8 | 96.29 | 90.22 | 96.9 | 99.6 | 98.23 | 95.14 |
| Two 1 (60) | 93.3 | 87.5 | 90.31 | 86.7 | 85.2 | 85.94 | 98.3 | 88.1 | 92.92 | |||
| Three 1 (31) | 87.1 | 84.4 | 85.73 | 90.3 | 87.5 | 88.88 | 93.5 | 90.6 | 92.03 | |||
| M 2 (23) | 91.3 | 80.8 | 85.73 | 91.3 | 77.8 | 84.01 | 87 | 90.9 | 88.91 | |||
| T 2 (18) | - | - | - | 88.9 | 64 | 74.42 | 100 | 100 | 100 | |||
1 single means single-phase faults, two means two-phase faults, and Three means three-phase faults; 2 M means motor starting and T means transformer energizing.
© 2019 by the authors. Licensee MDPI, Basel, Switzerland. This article is an open access article distributed under the terms and conditions of the Creative Commons Attribution (CC BY) license (http://creativecommons.org/licenses/by/4.0/).
Share and Cite
MDPI and ACS Style
Sha, H.; Mei, F.; Zhang, C.; Pan, Y.; Zheng, J. Identification Method for Voltage Sags Based on K-means-Singular Value Decomposition and Least Squares Support Vector Machine. Energies 2019, 12, 1137. https://doi.org/10.3390/en12061137
AMA Style
Sha H, Mei F, Zhang C, Pan Y, Zheng J. Identification Method for Voltage Sags Based on K-means-Singular Value Decomposition and Least Squares Support Vector Machine. Energies. 2019; 12(6):1137. https://doi.org/10.3390/en12061137
Chicago/Turabian StyleSha, Haoyuan, Fei Mei, Chenyu Zhang, Yi Pan, and Jianyong Zheng. 2019. "Identification Method for Voltage Sags Based on K-means-Singular Value Decomposition and Least Squares Support Vector Machine" Energies 12, no. 6: 1137. https://doi.org/10.3390/en12061137
Note that from the first issue of 2016, this journal uses article numbers instead of page numbers. See further details here.