An Expeditious Methodology to Assess the Effects of Intermittent Generation on Power Systems
by
 ,
,
Gracita Batista Rosas
1 ,
,
Elizete Maria Lourenço
2,*,
Djalma Mosqueira Falcão
3 and
Thelma Solange Piazza Fernandes
2 1
Electrical Engineering Department, Brazilian Energy Utility Companhia Paranaense de Energia (COPEL), Curitiba 81200-240, Brazil
2
Electrical Engineering Department, Federal University of Paraná, Curitiba 81531-980, Brazil
3
Electrical Engineering Department, Federal University of Rio de Janeiro/COPPE, Rio de Janeiro 21941-972, Brazil
*
Author to whom correspondence should be addressed.
Energies 2019, 12(6), 1135; https://doi.org/10.3390/en12061135
Submission received: 2 March 2019
/
Revised: 21 March 2019
/
Accepted: 21 March 2019
/
Published: 23 March 2019
(This article belongs to the Special Issue Optimization Methods Applied to Power Systems Ⅱ)
Abstract
:This paper proposes an expeditious methodology that provides hourly assessments of the effect of intermittent wind and solar power generation on the electrical quantities characterizing power systems. Currents are measured via circuit breakers to confirm the correct sizing of devices based on their rated currents. Nodal voltage magnitudes are assessed for compliance with limits imposed by regulatory authorities, whereas the active power produced by hydroelectrical generators is assessed for reserve energy. The proposed methodology leverages a fuzzy extended deterministic optimal power flow that uses in power balance equations the average hourly values of active power generated by wind and solar sources as well as hourly energy load. The power grid is modeled at the substation level to directly obtain power flow through circuit breakers. Uncertainties in power system electrical quantities are assessed for an optimal solution using a Taylor series associated with deviations from the average values of the active power produced by the wind and solar sources. These deviations are represented using a fuzzy triangular model reflecting the approximations of the probability density functions of these powers. The methodology takes into account a subjective investigation that focuses on the qualitative characteristic of these energy sources’ behaviors.
1. Introduction
The challenges of the expansion and operation of Electrical Power Systems (EPS) have intensified over time owing to the incessant increase in the complexity of these systems. Nowadays, additional factors have been incorporated in these challenges, including uncertainties in the generation and consumption of electric energy as dictated by the growing participation of intermittent sources of energy, domestic electric vehicles, and energy storage systems. Because of these uncertainties, the technical specifications of the EPS components must be assessed, especially those associated with substations’ internal devices, as is the case with circuit breakers. Therefore, it is of fundamental importance that the tools in development that seek to model these uncertainties are also capable of assessing the loading of these devices in their analysis processes.
Optimal power flow (OPF) is recognized as a powerful tool for planning an operation and has gained importance in analysis involving the incorporation of distributed generation [1,2,3]. OPF is able to indicate the ideal size of these generation units to avoid compromising voltage stability [4,5]. The uncertainties of wind and solar energy sources have been widely explored in OPFs, whether these were coordinated with conventional generation or in association with energy storage systems [6,7,8]. In this context, some works have explored the characteristics of the OPF to analyze the impact of the expansion of distributed generation on transmission line loading [9], on the presence of domestic electric vehicles in power grids [10,11], on high-voltage direct current connections [12,13], and in frequency control actions [14].
The uncertainties of energy sources are often represented in an OPF by probabilistic approaches, which are unable to incorporate qualitative information residing in human knowledge. In this case, fuzzy logic has been used to represent qualitative, vague, or incomplete knowledge in mathematical models in several areas of knowledge, including the OPF [15]. The literature presents the use of fuzzy logic combined with OPF as promising for EPS analysis [16], mainly in the definition of functions with conflicting objectives [17,18], in operational limit constraints [19,20], and in solutions that define the date of need, location, and sizing of new energy resources [21]. Some techniques incorporate fuzzy logic in the OPF solution through a linear relation [22], or through sensitivity analyses [23]. This allows for the assessment of the influence of uncertainties in energy generation in the electrical quantities of EPS.
Another promising application of the OPF has been the inclusion of switch and circuit breaker representation, hereinafter referred to as switchable branches, in power grid modeling. Through continuous functions, this representation has been used successfully in assessments of system reconfiguration [24] and in restoring the maximum loads in distribution systems [25]. The representation of these devices by integer variables is proposed in [26] to obtain the optimum dispatch and topology of an electric network to meet static loads. In some applications, the concept of switching transforms contingencies (criterion n − 1) into inequality constraints as a way of guaranteeing safety in the electrical system [27]. An OPF with a switching technique has also been used to alleviate transmission line congestion [28], in addition to improving the hosting of distributed generation systems [29] and minimizing losses [30] through network reconfiguration.
The conventional bus-branch representation of the power grid appears in the vast majority of OPF applications. However, developments related to the explicit representation of switches and circuit breakers in state estimation studies [31] have been incorporated into the power flow problem formulation [32], allowing for the processing of power grids at the substation level. In this type of modeling, the power flows through switchable branches are incorporated into the vectors of state variables together with the nodal complex voltages. This incorporation avoids possible numerical problems in the search for an optimal solution, motivated by the representation of impedances with very high or very low values. This is necessary to indicate the open and closed positions of these devices, respectively. As a consequence, this modeling allows for the direct determination of the power flow distribution through the components of substations, which is necessary for the analysis of electrical device loading, especially in circuit breakers. Preliminary studies demonstrated the feasibility of modeling at the substation level in the formulation of the OPF problem [33].
This work is inserted in this context and proposes an expeditious methodology capable of determining, for each hour of the day, the uncertainties in EPS electrical quantities owing to the uncertainties of wind and solar energy sources. The proposed approach consists of a Fuzzy Extended Deterministic OPF (FED-OPF) composed by two stages, which aims to explore the subjectivity of qualitative knowledge associated with these energy sources’ behaviors. The first stage solves a deterministic OPF with extended formulation, referred to as ED-OPF, that is capable of processing modeled power grids at the substation level. In this first stage, the average values of the active power generated by wind and solar energy sources are used as input data together with the data referring to hourly load curves. In the second stage, the uncertainties of the EPS electric quantities are determined by the sum of the deterministic variables (determined in the first stage) with the fuzzy variables. The fuzzy variables are determined through qualitative sensitivity analysis applied to the postprocessing of the ED-OPF, considering maximum and minimum values for the active power of wind and solar energy sources. This procedure allows that the qualitative behavior of wind and solar energies sources be incorporated to the solution.
The proposed methodology allows for the assessment, in an expeditious way, of the influence of the uncertainties of the active power produced by wind and solar energy sources: (a) in the active power produced by conventional generators for energy reserve analysis, (b) in the nodal voltage magnitudes in order to comply with the limits imposed by regulatory authorities, and, mainly, (c) in the currents through circuit breakers. These results are essential to ascertain the correct sizing of the rated current of these devices.
2. Fuzzy Extended Deterministic Optimal Power Flow
Originating from an extension of the economic dispatch [34], the OPF allows for the determination of the optimum point of operation in relation to a predefined objective, while it complies with the operational limits imposed by power grids. Over the years, mainly owing to uncertainties in the generation and consumption of electric energy, the OPF was marked by a progression in the numerical techniques of solutions and in problem formulation. Among these techniques of solution, it is worth mentioning the Primal Dual Interior Points Method, initially proposed for the optimal dispatch of reactive power, which proved to be robust in solutions of large systems [35].
Based on these assumptions and considering the subjectivity of qualitative knowledge about the wind and solar energy sources behavior, this paper proposes a fuzzy extended deterministic optimal power flow (FED-OPF) capable of determining, for each hour of the day, the uncertainties of EPS electrical quantities owing to the uncertainties of these energy sources. These uncertainties are determined mainly for the currents through circuit breakers, to verify the correct sizing of these devices by the rated current, for the active power produced by conventional generators for energy reserve analysis and for the nodal voltage magnitudes in order to comply with the limits imposed by the regulatory authorities. The hourly analysis via the proposed FED-OPF is composed by two stages, as described in the following sections.
2.1. Extended Deterministic Optimal Power Flow: First Stage
In this work, the modeling of a power grid at the substation level is incorporated in the ED-OPF formulation. This modeling allows for the explicit representation of the switches and circuit breakers that make up the substation arrangements. This is different from bus-branch conventional modeling, which considers these arrangements as a single bus. To illustrate substation-level modeling, Figure 1 shows a simple five-bus system (a) where bus three started to rely on this modeling, resulting in an eleven-bus system (b).
With this new modeling, it is possible to obtain, in a direct way, information of electrical quantities through the substation components. This includes the power flows through circuit breakers, thus creating subsidies to confirm some technical specifications of these devices. As a consequence, this modeling excludes the need to use complementary analysis tools to obtain this information, as occurs with bus-branch conventional modeling.
It should be emphasized that the modeling at the substation level is applied only to previously selected substations, which are the substations through which it is desired to determine the power flow distribution and the influence of wind and solar sources. This means that only a small number, usually the substations connected to solar and wind sources, will be modeled at this level of detail.
In the following formulation, the details of the modeling of a power grid at the substation level and of the wind and solar power sources in the ED-OPF are presented:
subject to:
Equation (1) represents the conventional objective function that minimizes the costs of active power generation Pg by conventional generators, where Q is the diagonal matrix with quadratic cost coefficients, b is the vector of linear cost coefficients and co is the constant cost vector. Equations (6) and (7) represent the minimum and maximum limit constraints of the active and reactive powers Pg and Qg produced by these generators, respectively. Equations (8) to (12) represent these limit constraints for the nodal voltage magnitudes V, taps of the transformers a, powers injected by static compensators Bs, angles of the shift transformers , and the active power flows on transmission lines fl, respectively.
The necessary adaptations in the ED-OPF formulation for the processing of power grids at the substation level are performed by extending the state vector so as to include the active (t) and reactive (u) power flow through each switchable branch along with the conventional nodal complex voltages. This procedure avoids the use of atypical values to represent the open and closed position of switchable branches in the problem formulation, eliminating the numeric problem such values would cause in the optimal solution search.
Equations (2) and (3) represents, respectively, the active and reactive bus power balance (or bus injected power), that is, the difference between the generated power and the demand at each bus. Please notice that, as a consequence of the current Kirchhoff law, the injected power at bus “k” is equal to the sum of the power flow through all adjacent branches of bus “k”. When the substation level modeling is applied to the network, as proposed in this article, the sum of the power flow through adjacent branches must consider the set of adjacent conventional branches (transmission lines and transformers) as well as the set of adjacent switchable branches. Power flow through conventional branches are determined as usually, that is, as a function of the complex voltage. However, power flow through switchable branches are written directly as a function of the new state variables (t and u).
To incorporate the power flows through switchable branches in power balance equations (2) and (3) of the ED-OPF, the bus-switchable branches incidence matrix is defined. With the number of rows equal to the number of buses of the system and the number of columns equal to the number of switchable branches, the element i-j of is defined as
- −1 if the switchable branch j is connected to bus i and the flow is oriented to enter in bus i.
- 1 if the switchable branch j is connected to bus i and the flow is oriented outward from bus i.
- 0 if switchable branch j is not connected to bus i.
In (2), tfl represents the vector of the sum of the switchable branches active power flow in the buses. It can be written using the incidence matrix as indicated in (13):
Similarly, in (3), ufl represents the contribution, that is, the sum of the reactive power flows through switchable branches to the system buses, and can be written as:
where t and u are the new state variable vectors referring to the active and reactive power flows in switchable branches, respectively.
Equation (4) represents the active operational constraints that model the closed and open positions of the switches and circuit breakers. These constraints can be reformulated in function of specific incidence matrices for this purpose, as presented in (15):
The incidence matrix has a number of lines equal to the number of closed circuit breakers and a number of columns equal to the number of total buses of the system. This matrix represents the operational constraints of closed circuit breakers of the type , where is the angle of the complex voltages. Thus, the values of this matrix are equal to 1 in column “i” and equal to -1 in column “j” of the line corresponding to the closed circuit breaker i-j.
The incidence matrix has a number of lines equal to the number of open circuit breakers and a number of columns equal to the total number of circuit breakers. This matrix represents the operational constraints of open circuit breakers of type . The values of this matrix will only be different from zero and are necessarily equal to 1 in the line corresponding to open circuit breaker i-j and the column corresponding to the state variable (active power flow) associated with this circuit breaker.
A similar reformulation can be performed on the reactive operating restrictions of (5), as shown in (16):
From (16), it is possible to obtain the operational restrictions of the closed circuit breakers of type , in addition to the operational restrictions of the open circuit breakers of type .
Regarding the representation of alternative sources of energy, (2) considers in the balance of the active power the average values of the active power produced by wind and solar energy sources and , respectively. The average values can be determined from real historic data, as discussed in the Section 3.
The solution of the proposed extended deterministic optimal power flow is achieved by the Primal Dual Interior Points Method [35] as associated with the Lagrange technique, the conditions of Karush Kuhn Tucker, and the Newton Method.
This solution defines the deterministic variables of EPS electrical quantities as function of average values of the active power produced by wind and solar energy sources and demands the traditional expensive computational time of solutions involving OPFs.
2.2. Electrical Quantity Uncertainties of EPS: Second Stage
The information regarding the uncertainties of generation and consumption of electric energy in the OPF is usually represented by probabilistic approaches through probability density functions [4,36,37]. However, these approaches based on quantitative information are not capable of representing the qualitative information that resides in human knowledge. With the fuzzy technique, the incomplete, vague, and qualitative knowledge present in human beings began to be represented by mathematical models in several areas of knowledge, including in OPFs [15].
In addition to not considering qualitative information, usually the processing of probabilistic data in the OPF demands a high computational effort. However, in several practical situations, expeditious and even approximate responses of the electric quantities of the power systems are enough for the analysts of these systems. An example of such situations is the investigation of the necessity of replacing circuit breakers with equipment that has a greater rated current capacity, usually common in expansions and changes in EPS.
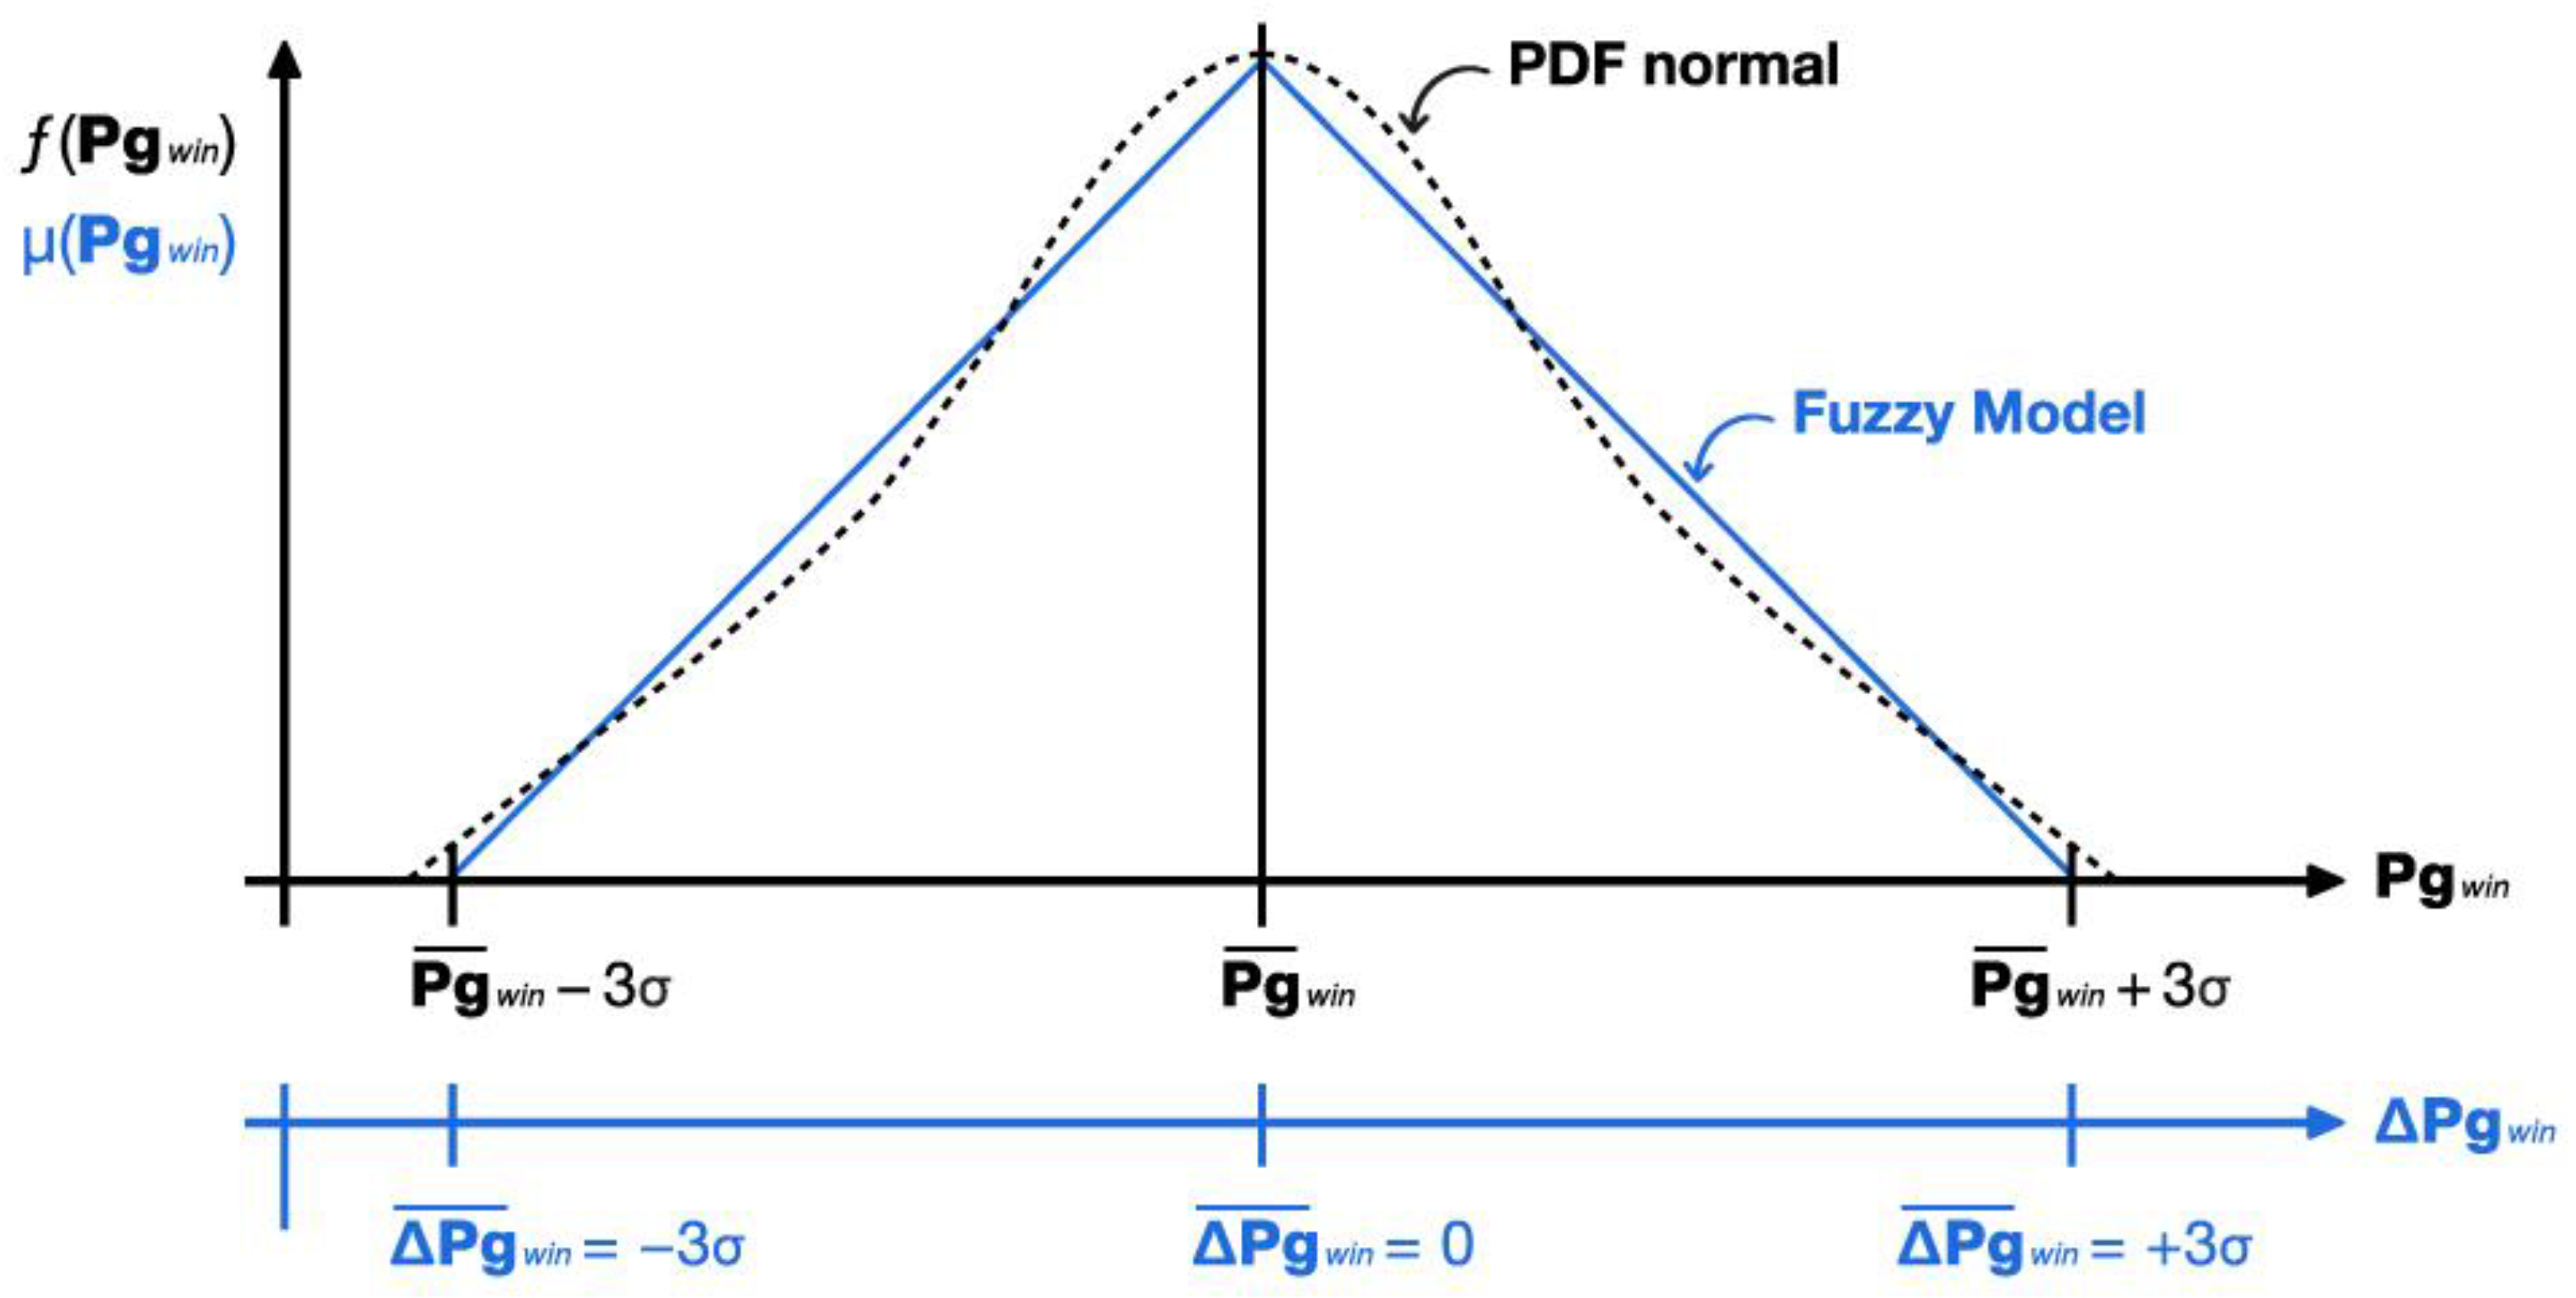
Based on the above discussion, this work proposes an hourly evaluation of the electrical quantities of the electric system in relation to the intermittent behavior of wind and solar energy sources, based on the association illustrated in the Figure 2. In this illustration the area delimited by the mean and +/−3 standard deviations of the Probability Density Function (PDF) normal distribution of the active power produced by wind and solar energy sources is associated with the area delimited by the membership function of a fuzzy triangular model. This approach allows composing, through fuzzy variables and a real brief historical data about these energy sources, an hourly qualitative knowledge about the average, minimum, and maximum values of powers produced by these sources. Section 3 exemplifies the composition of this qualitative knowledge.
The Figure 2 shows the Probability Density Function (PDF) (in black), where: : probability density function of the active power produced by wind energy sources; : hourly average values of the active power produced by wind energy sources; : standard deviation of the active power produced by wind energy sources.
For the fuzzy triangular model (in blue), the Figure 2 shows: : membership function of the active power produced by wind energy sources; : hourly variations in relation to the average values of the active power produced by wind energy sources, here called fuzzy variables. For the solar energy sources, we can use the same definition, changing the subscript “win” to “sol”.
As the qualitative average values of the active power produced by these sources and were considered in the optimal solution of the ED-OPF of the first stage (Equation (2)), it is possible to define the fuzzy variables of the other system electrical quantities as a function of the fuzzy variables . and . For this purpose, let us consider the Lagrangian function of the problem formulation (1)–(12). The first derivative (or gradient) of this function in the optimal solution must be null, in order to comply with the optimality conditions of Karush Kuhn Tucker. This gradient is represented by (17):
where, Pg is the vector of the active power produced by conventional generators; and are the vectors of the qualitative average values of the active power produced by wind and solar energy sources, respectively; V is the vector of the nodal voltage magnitudes; t is the vector of the active power flows through circuit breakers; and y is the vector of the other electrical quantities of the system, including the dual variables.
Based on this, the expansion of (17) in Taylor series, in the directions of fuzzy variables and , still in the optimal solution, can be formulated by:
This relationship implies that:
Or that:
Defining W as a Hessian matrix, the equation can be rewritten as:
Equation (21) defines the fuzzy variables of the active power produced by conventional generators , of the nodal voltage magnitudes , of the active power flows through switches and circuit breakers , and of the other system quantities . With these fuzzy variables, it is possible to determine the uncertainties of the electrical quantities of the EPS. These uncertainties result from the sum of the deterministic variables calculated in the optimal ED-OPF solution as determined in the first stage, with the fuzzy variables determined in this stage, as shown below:
where are the uncertainties regarding the active power produced by conventional generators, necessary for energy reserve analysis; are the uncertainties regarding the nodal voltage magnitudes, necessary to analyze the accomplishment of the limits imposed by the regulatory authorities; are the uncertainties regarding the active power flows through circuit breakers, necessary to verify the correct sizing of these devices by the rated current; and are the uncertainties regarding the other electrical quantities that can be used according to necessity.
In summary, the uncertainties of EPS electrical quantities are determined, in the second stage, by the sum of deterministic variables (determined in the first stage) and fuzzy variables. The fuzzy variables are determined through qualitative sensitivity analysis (Equations (17)–(21)) applied to the postprocessing of the ED-OPF optimal solution, as function of variation (maximum and minimum values) of the active power of wind and solar energy sources, always considering an hourly based analysis.
The fuzzy variables participate only in the postprocessing stage of the OPF and avoid the incorporation of these uncertainties into the iterative process of the OPF solution. The result is a significant reduction in the computational time when compared with the first stage. The second stage provides rapid and authentic responses (as discussed in next section) for a general analysis of the electrical quantities of the system as a function of the variation of wind and solar energy sources.
3. Test System Data
To implement the proposed methodology, a real power network composed of 139 buses that comprises the northeast Brazilian coastal region was used. The system contains buses at different voltage levels ranging from 13.8 kV to 500 kV. In addition, the available data includes real hourly load curves, static compensators, capacitor banks, bus and line reactors, previously selected substations modeled at the substation level, and large hydroelectric power plants: Sobradinho (1.00 GW), Xingó (3.6 GW), Luiz Gonzaga (1.5 GW), and Paulo Afonso Complex (2.4 GW). The power system has approximately 400 MW of thermoelectric power plants.
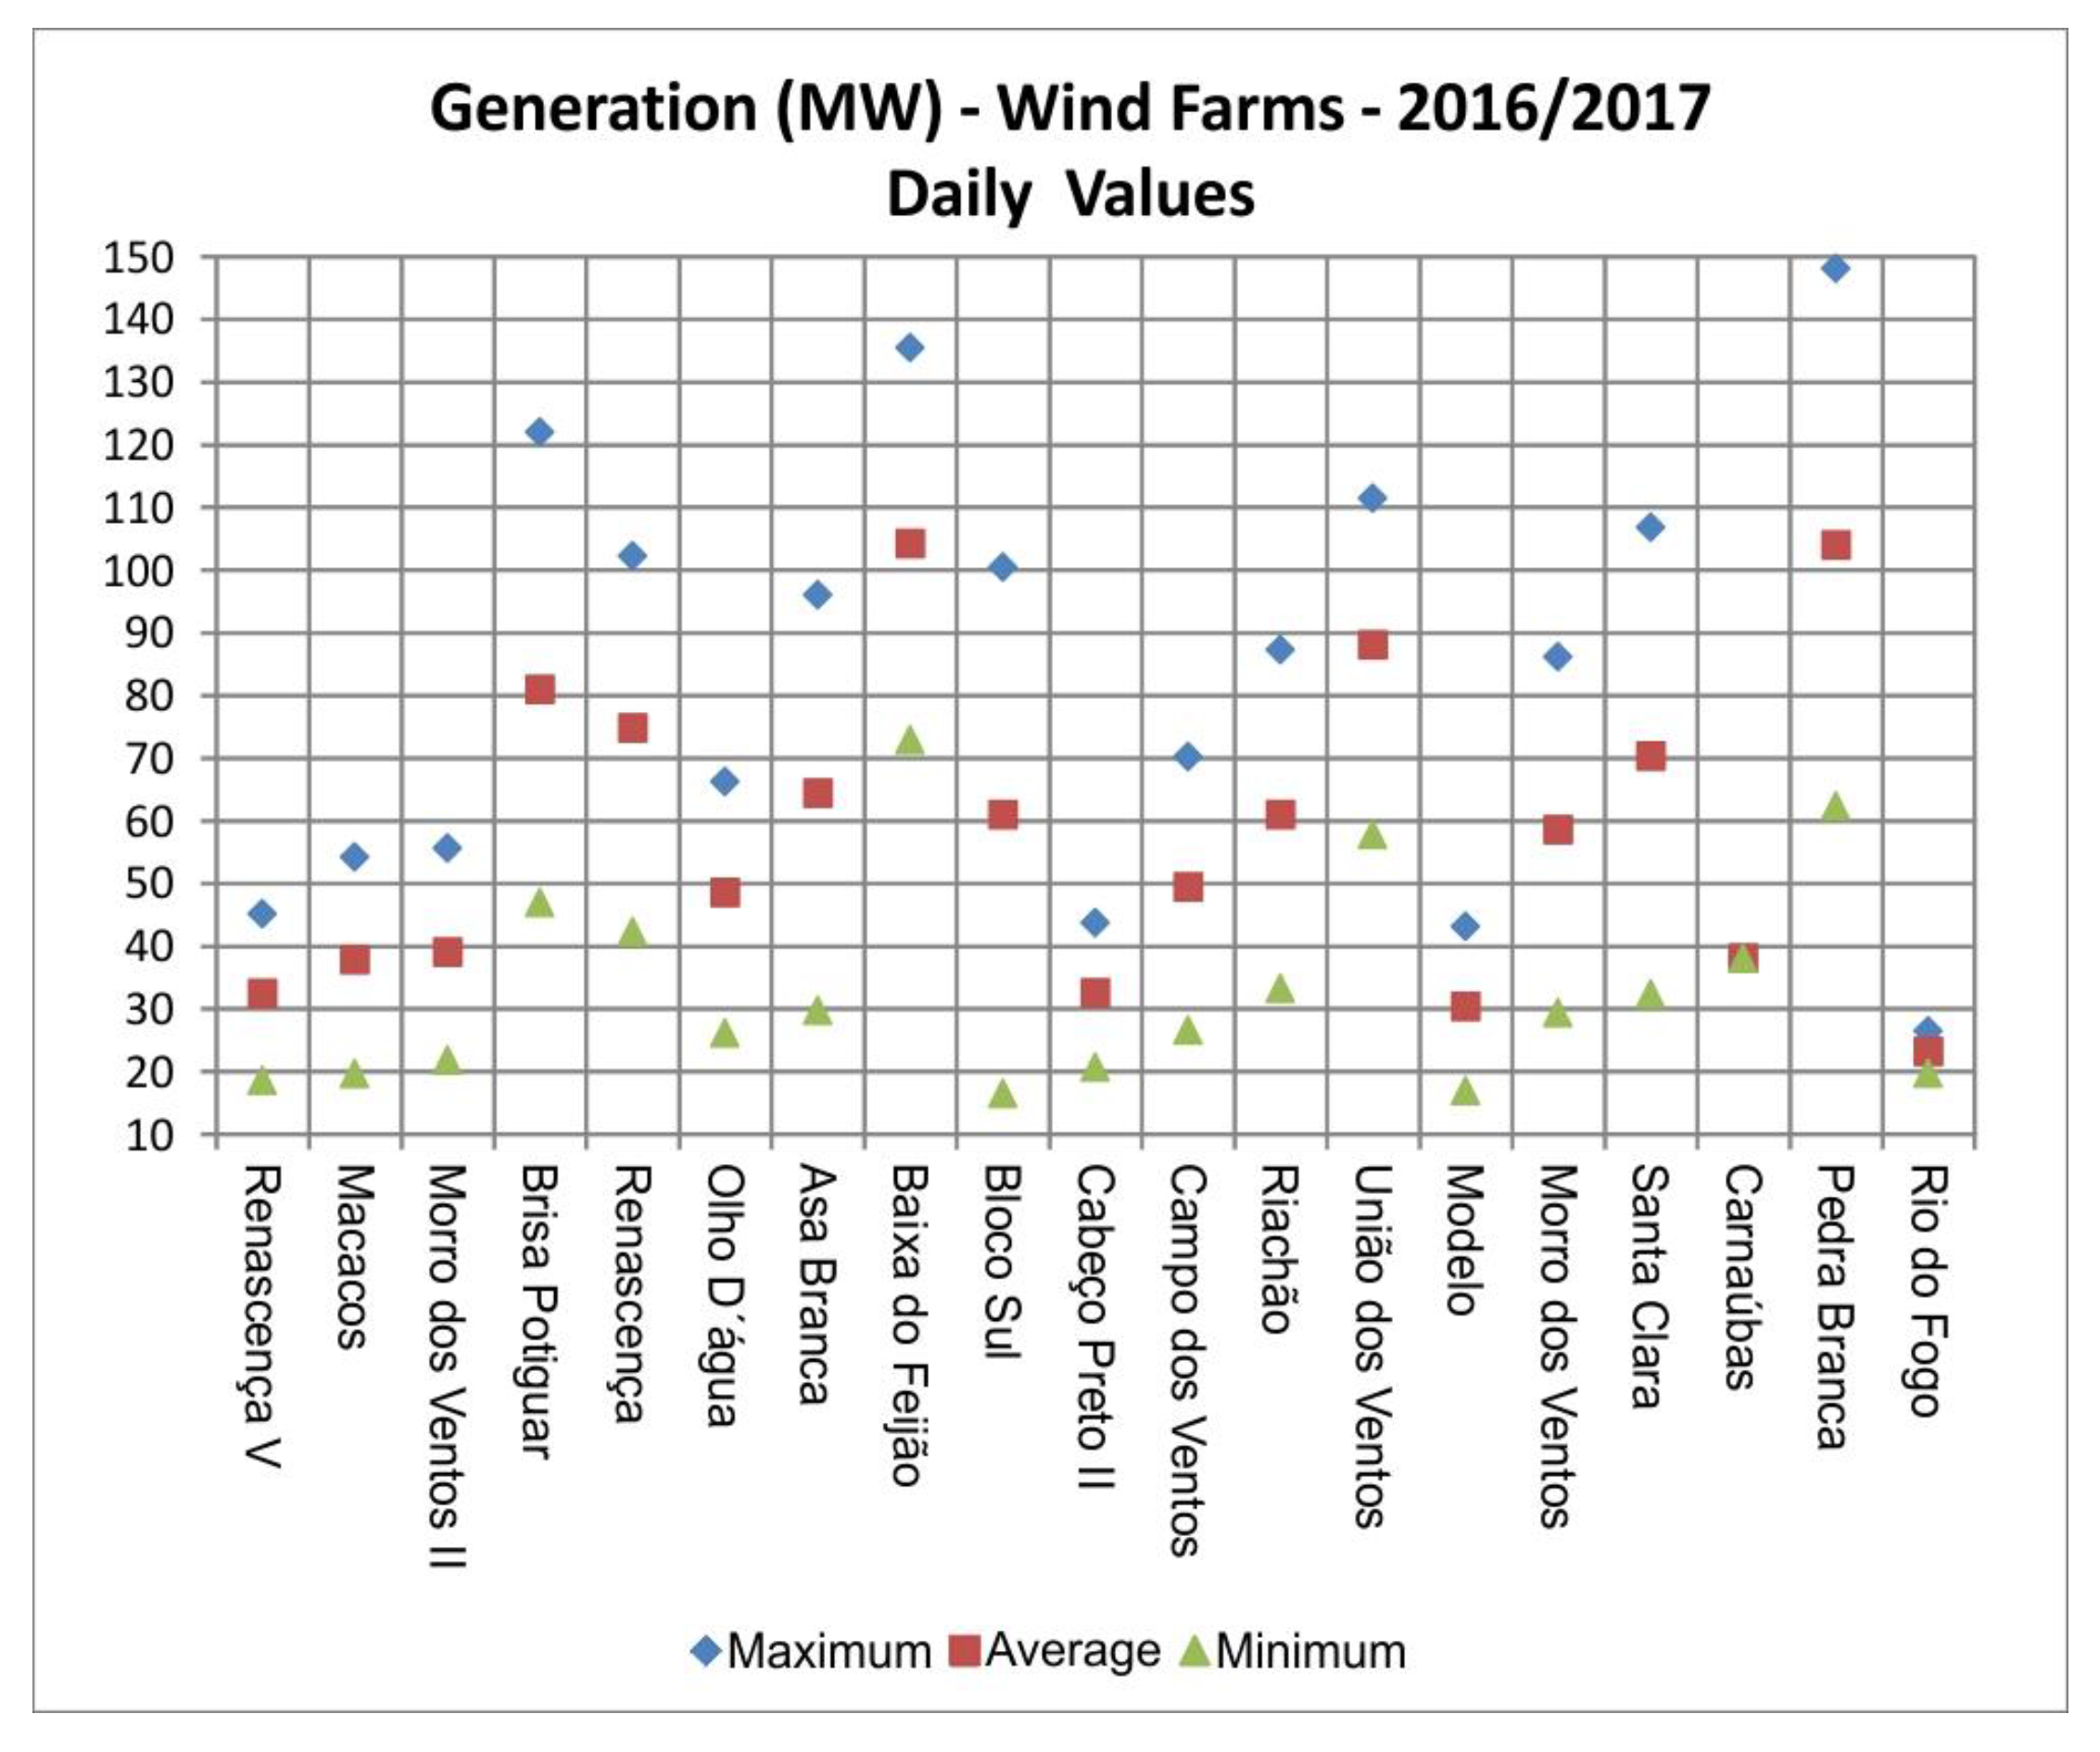
Additionally, the power system has 19 wind farms that represent approximately 2 GW of installed power. Figure 3 illustrates the daily variation of active power produced by these wind farms in the period between June 2016 and July 2017. All of this information corresponds to daily real data properly processed and grouped to subsidize the analysis of the proposed tool in the most realistic way possible.
To illustrate the proposed qualitative definition of maximum, average, and minimum of active power of the renewable energy sources, the Brisa Potiguar wind farm (BP) were chosen. Figure 4 presents the active power average values of BP for each hour of the day, which was determined from the available real historic data.
These values were used in the first stage (Section 2.1—Equation (2)) of the proposal methodology, in order to define the deterministic variables of EPS electrical quantities.
According to real historical data, the maximum and minimum values of active power of BP are defined for each hour of the day. These values correspond to the variation of +/−30% of the average values of these powers, which are represented the fuzzy variables (see Figure 2). These values are used in the second stage (Section 2.2—Equations (17)–(21)) of the proposal methodology, in order to determine the fuzzy variables of EPS electrical quantities. The uncertainties of EPS electrical quantities are then computed by the sum of deterministic variables, determined in the first stage, and fuzzy variables, determined in the second stage, as discussed in Section 2.2—Equations (22–25).
In summary, the average values of active power of wind and solar energy sources are determined through the brief real historic data. The maximum and minimum values of these active powers are defined by the hourly variation of +/−30% of the average value. It should be emphasized that the whole proposed strategy assumes an hourly based analysis, such that fuzzy triangular model (based in the normal PDF) is used to model the hourly variation of the wind and solar generators in the second stage of the proposed methodology.
The same methodology is applied to active power produced by solar energy sources, which are randomly distributed in six of the 69 kV buses. The solar energy participates in the formulation of the problem only in the period of solar incidence between 6–18 h, and the average value of these powers is dimensioned in 10% of the active power demanded in these buses. The fuzzy variables , related to the active power produced by solar energy sources are also defined by values equivalent to +/−30% of the average values.
4. Simulations and Results
The developments presented in this work were carried out using the MATLAB computational tool. The first and most important result consists of authenticating the proposed methodology. In order to validate the proposed approach, exhaustive solutions of conventional OPF considering each increase/decrease variation for wind and solar sources, were used.
Figure 5 illustrates this validation for the active power of the hydroelectric plant of Xingó.
The "Original" trace of Figure 5 represents the deterministic values of the active power of the hydroelectric plant of Xingó, obtained with the ED-OPF solution, as described in Section 2.1. In this case, the qualitative average values of the active power of the wind and solar energy sources were used in the power balance equations. The "Wind and Solar Increment" trace represents the uncertainties of the active power of the hydroelectric plant of Xingó. These uncertainties are determined by the sum of determinist values (“Original” trace) with fuzzy values. In this case, according to the technique described in Section 2.2, the fuzzy values were determined through qualitative sensitivity analysis applied to the postprocessing of the ED-OPF, as function of 30% (maximum values) increase in the active power of wind and solar energy sources. The "Wind and Solar Decrement" trace also represents the uncertainties of the active power of the hydroelectric plant of Xingó, but now considering a decrease of 30% (minimum values) in the active power of these energy sources.
Simulations were performed in a conventional OPF to authenticate the proposed methodology. The "Original Validation" trace represents the values obtained in the solution of a conventional OPF that considers in the power balance equations the qualitative average values of the active power of the wind and solar energy sources. The "Wind and Solar Increment Validation" trace represents the values obtained in the conventional OPF that considers in the active power balance equations the qualitative average values of the active power of these energy sources increased by 30%, while the "Wind and Solar Decrement Validation" trace represents the values obtained in the conventional OPF when in these equations the qualitative average values of the active power of these energy sources is reduced in 30%. The adherence of the results indicates the effectiveness of the proposed methodology in obtaining the desired results in an expeditious way, as proposed.
This authentication is also successfully achieved for the other electrical quantities of the system. The following sections present the definition of the uncertainties of the power flows through circuit breakers, of the active power produced by conventional generators, and of the nodal voltage magnitudes as a function of the uncertainties of the active power produced by wind and solar energy sources. These analyses are academic and have no intention of interfering with the operation or expansion of the actual system.
Similar proposals, that reach solution with reduced computational time as proposed in our paper, and that simultaneously contemplates in the OPF, renewable energies, switching (substation model level), and qualitative information, were not found in the literature. These characteristics make us confident that the proposed approach presents innovative ideas and presents itself as a promising tool for analyzing the impact of intermittent energy sources in the electrical quantities of the power systems.
4.1. Power Flows through Circuit Breakers
The verification of the correct sizing of the rated current of circuit breakers, often motivated by expansions or alterations in power systems, has attracted the attention of analysts of these systems in different parts of the world. In these analyses, the representation of the substation of interest at the substation level, as proposed in this paper, allows for the assessment in a direct way of the power flows through these devices. As most analytical tools consider bus-branch modeling, this analysis requires the adoption of additional procedures that overload the area professionals and hamper this task. The incorporation of network modeling at the substation level in the OPF eliminates this step, thus facilitating and more effectively subsidizing the analysis work by these professionals.
To illustrate the effectiveness of this attribute of the proposed methodology, the Sobradinho 230 kV substation was chosen for modeling at the substation level owing to its connections with wind and solar power sources, as well as sheltering an important hydroelectric plant of the same name with 1.05 GW of installed power. Figure 6 illustrates the configuration of this substation, including the most common directions of power flows through the circuit breakers of this installation.
Table 1 presents the most relevant results related to this analysis involving the Sobradinho 230 kV substation. Column 1 indicates the hour at which the variation was assessed (corresponding to the solar incidence period), while the second to fifth columns show the variations in the active power flows through the indicated circuit breaker when the active power produced by wind and solar sources varied from +/−30% (always in relation to the average values according to Section 2.1).
The results indicate that the active power flows through the circuit breakers of this substation were influenced by the simultaneous generation of wind and solar energy sources. The exception was with the active power flows through circuit breaker 159, which were influenced only by the wind energy source since this device was connected to the Pedra Branca 230 kV wind farm. Similar analyses can be performed for the active power flows through circuit breakers 160 and 163, which connect the solar source, and therefore were influenced only by this source of energy.
Once the power flows through the circuit breakers of the Sobradinho 230 kV substation were determined, the maximum currents through these devices were calculated as a function of the apparent powers. From this calculation, it was observed that the maximum ratio between these currents and the rated current was 22.2% for circuit breaker 159, ensuring the correct dimensioning of these devices by the rated current.
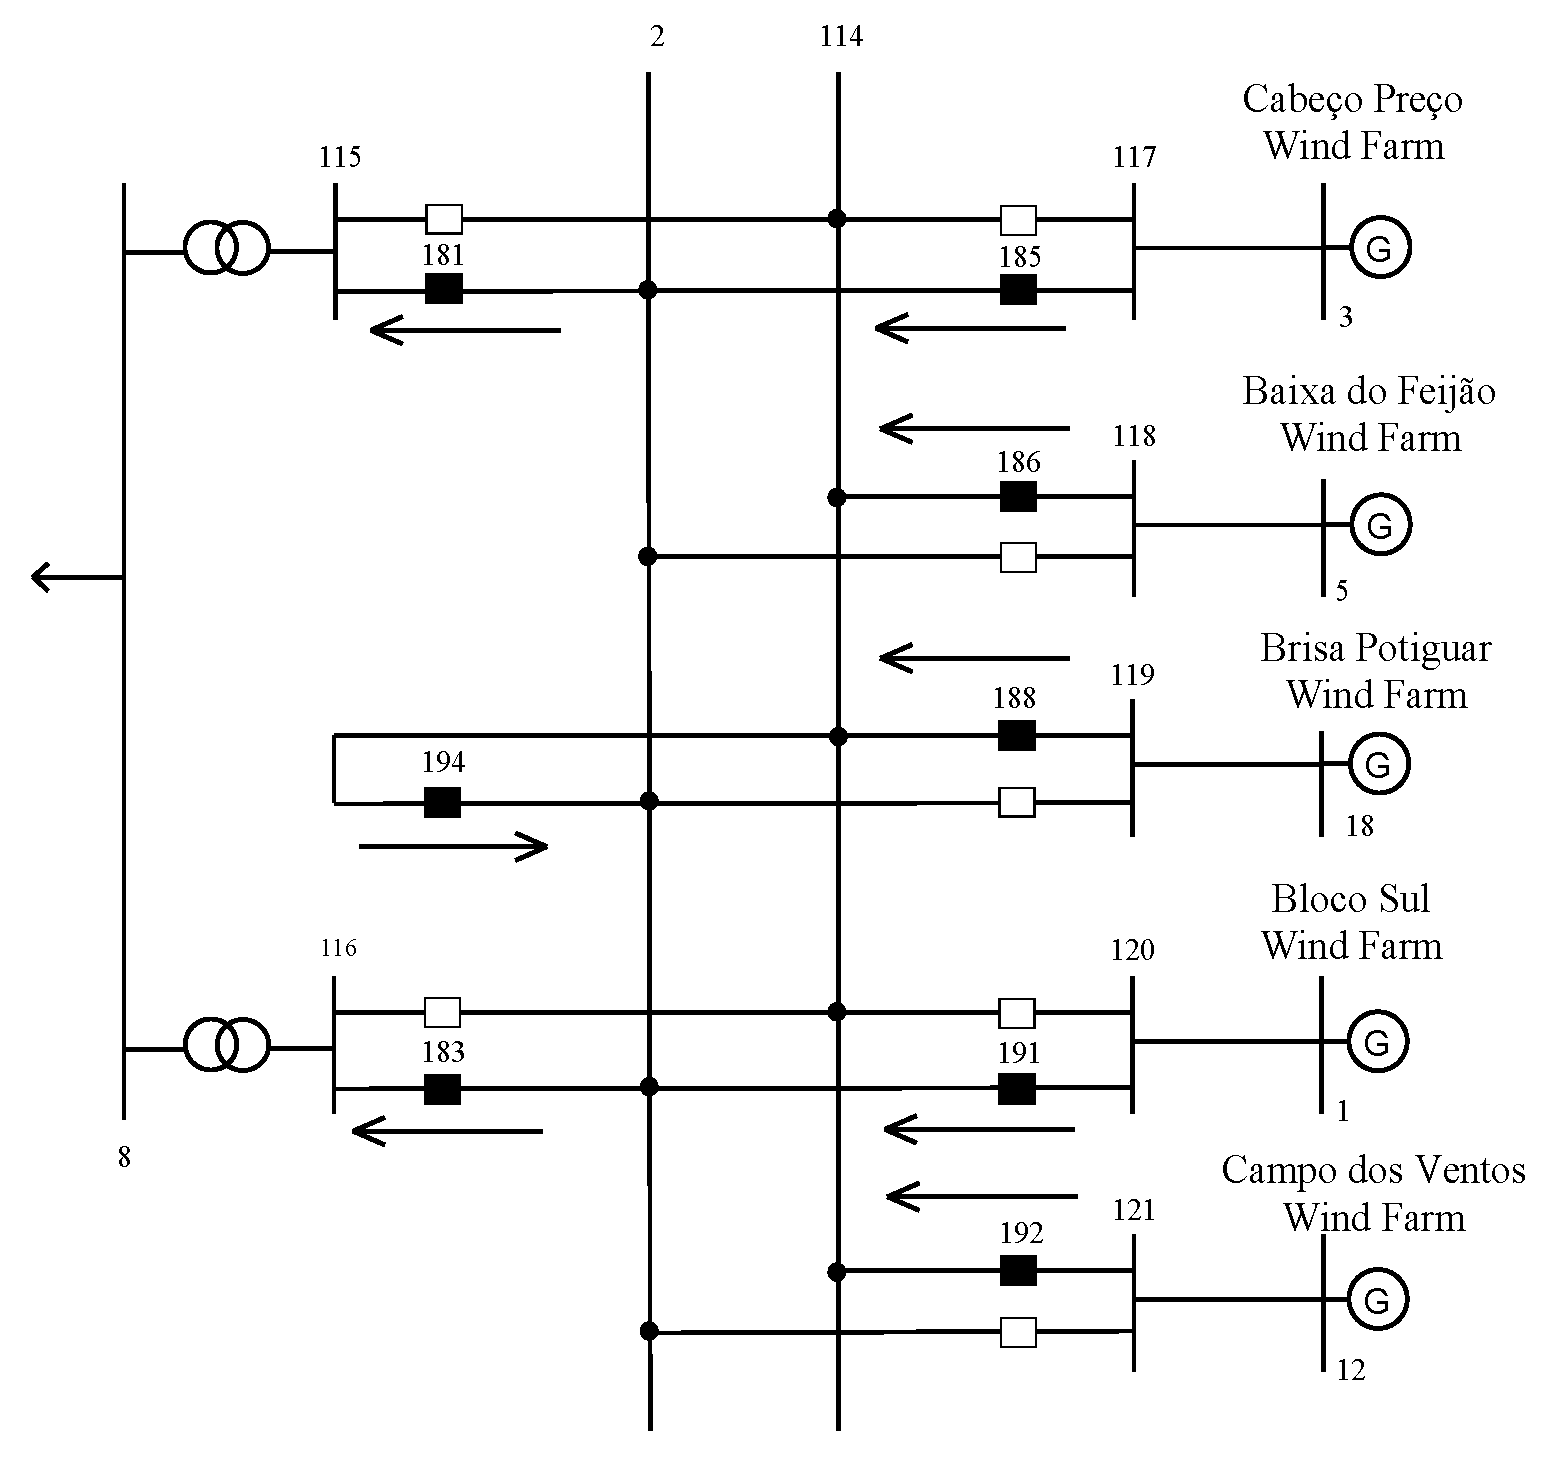
The João Câmara II 138 kV bus was also modeled at the substation level owing to the connection of approximately 700 MW of installed power by wind farms. Figure 7 shows the bus configuration and indicates the most common orientation of power flows through the circuit breakers of this substation.
Table 2 lists the maximum current values through the main circuit breakers of this substation, as well as the proportion of these values in relation to their rated values. These analyses are performed for the original condition, that is, without the variation of the average values of the active power of the wind sources, and with a variation of +/−30% in relation to these values.
The results indicate that the effect of the wind power sources was very significant, taking the maximum current values through these devices near the rated values. For example, the maximum current through circuit breaker 194 reached 71.6% of its rated current value when exposed to the uncertainties of the active power produced by the wind farms connected to the bus under study. The effect of the solar energy sources in this substation was negligible.
It should be noted that this case considers a normal operating condition. Logically, under conditions of contingency (criterion n − 1) or expansions in the system considered, the currents passing through these circuit breakers could be closer to the nominal values and may even exceed them. This type of analysis can be carried out by the proposed methodology and allows for the assessment of the necessity of replacing these devices with equipment that has a greater rated current capacity.
4.2. Active Power: Conventional Generators
Another relevant issue associated with the uncertainties of the active power generated by wind and solar energy sources is related to the analysis of their impact on the established powers for conventional generators. Although it is not advisable to ignore the importance of intermittent sources in reducing the rotating reserve, a careful analysis is also needed to avoid compromising the energy supply to consumers in conditions of unexpected reductions of the share of these energy sources in the energy matrix.
Table 3 lists, for some hours of the day, the variation in megawatts from the average values of the active power produced by the Paulo Afonso IV hydroelectric power plant. These values were obtained as a function of the variation of +/−30% from the average values of the active power generated by wind and solar energy sources.
These and other results obtained (omitted because of lack of space) show that all conventional generators of the system were sensitized by both the solar and wind energy uncertainties except for the generators of the thermoelectric plants that were not dispatched owing to high cost.
In this context, Table 4 shows the influence of the uncertainties of wind and solar energy on the energy reserve of these conventional generators.
The results presented show a slight reduction in the available powers of generators, which was necessary to increase energy production to supply the reduction in the share of wind and solar sources. The Luiz Gonzaga hydroelectric power plant reached its active power limit with a reduction of 30% in the share of these energy sources. The system under analysis contemplates an installed capacity of approximately 20 GW distributed between the hydroelectric and thermoelectric plants and equivalent generators, in addition to the hourly demand of around 7 GW. Considering energy generation planning based on an operational reserve equivalent to 5% of the demand, the variations of +/−30% of the active power of the wind and solar energy sources guarantee an operational reserve of 350 MW.
4.3. Nodal Voltage Magnitudes
Voltage control is one of the main concerns when there are expansions and changes in energy systems, as it must comply with the limits imposed by regulatory authorities. Thus, for the test system of this work, the uncertainties of the nodal voltage magnitudes were determined as a function of the uncertainty of +/−30% in relation to the average value of the active power of the wind and solar energy sources. Figure 8 illustrates the behavior throughout the day of the nodal voltage magnitudes in the 500 kV Pau de Ferro substation, an important transmission trunk of the system, owing to the combination of the uncertainties of wind and solar energy sources.
The values obtained for the nodal voltage magnitudes of all buses of the test system are within the limits established by the Brazilian regulatory authority, according to Table 5 [38]. These results show once again the relevance of the proposed methodology that allows for the inference of questions of this order without the need to carry out studies and exhaustive simulations involving the intermittent sources of energy.
4.4. Computational Time
Table 6 presents the computational times demanded in the execution of first and second stages of the proposed methodology.
According to the results presented in Table 6 it is possible to verify the significant computational time reduction in the second stage.
Based on the subjectivity of the qualitative knowledge about the wind and solar energy sources behavior, the second stage of the proposal methodology provides for the analysts fast answers and with good authenticity about electrical quantities of these systems, as indicated in Figure 5.
5. Conclusions
The combination of fuzzy logic with a Taylor series in the postprocessing of the Extended Deterministic Optimum Power Flow allows for the assessment of the impact of the active power uncertainties produced by the wind and solar energy sources in the electrical quantities of energy systems, for each hour of the day. In an expeditious way, based in a subjective investigation that focuses on the qualitative character of these energy sources’ behaviors, the proposed methodology allows for the assessment of the impact of these uncertainties on the active power produced by conventional generators. This makes it possible to conduct energy reserve analyses. These impacts are also assessed on the nodal voltage magnitudes. Thus, it is possible to verify if the limits reached comply with the limits of the voltages imposed by the regulatory authorities.
In addition, a representation of the power grid at the substation level made it possible to identify the impact of the variations of the wind and solar energy sources on the distribution of power flows and consequently of the currents through the circuit breakers of substations. This model allows for the evaluation of the technical specifications of such devices, such as rated currents. In face of this new reality of intermittent energy generation systems, this topic has attracted the attention of systems analysts from various parts of the world owing to the need for expansions and changes in EPS.
The results presented highlight the importance of energy reserve analyses and of correct technical specifications of circuit breakers in addition of voltages control, as a function of the forecasted growth of wind and solar energy sources in energy matrices. These results reinforce the relevance of analytical tools that provide professionals the ability to perform these tasks, in an expeditious way, as in the case of the methodology proposed in this work. Future studies are under investigation to assess the impact of such approach in contingencies analysis, including wind farm groups contingencies.
6. Article Contribution
The main contribution of this article is to offer power systems analysts a tool that allows the rapid assessment of the hourly behavior of the electrical quantities of these systems as a function of the variation of wind and solar energy sources. It is not a tool that involves data accuracy, but rather a tool that provides enough and rapid responses to decision making by those analysts. The proposed tool is original and suitable mainly for analysis of currents through circuit breakers, a theme that has attracted the attention of analysts from various parts of the world, due to the need for expansions and topology changes in power systems. The variations in the power injected by these energy sources can increase the value of the currents through the circuit breakers, resulting in an alert to the analysts about the need for replacement with equipment with higher nominal current value.
The assessment of the impact of the variation of the wind and solar energy sources not only on the currents through the circuit breakers, but also on the reserve energy and the nodal voltage magnitudes is reached through the solution of fuzzy extended deterministic optimal power flow, composed of two stages.
As discussed before, in the first stage, the extended deterministic OPF (ED-OPF) solution provides the deterministic variables of the power system electrical quantities. For this stage, we would like to emphasize that the formulation of ED-OPF contemplates an original modeling at the substation level, which enables the direct assessment of the currents through the circuit breakers. In addition, this formulation contemplates the hourly average values of the active powers of wind and solar energy sources in the active power balance equations. The first stage solution demands the traditional expensive computational time of solutions involving OPFs.
In the second stage, the uncertainties of the power system electrical quantities are obtained considering an hourly based analysis. These uncertainties are determined by the sum of determinist variables (first stage) with fuzzy variables. The fuzzy variables are obtained when the maximum and minimum values of these energy sources (corresponding to +/−30 % of average values of these energy sources) are applied to the ED-OPF solution, through a qualitative sensitivity analysis. The second stage presents lower computational time when compared to the first stage.
With the proposed tool, power system analysts can run ED-OPF once, which demands longer computational time and work more frequently with the second stage, which demands lower computational time. The second stage provides rapid and authentic responses for a general analysis of the electrical quantities of the system as a function of the variation of wind and solar energy sources.
Author Contributions
All the authors contributed to the realization, analysis of the data, as well as the writing of the paper.
Funding
This research received no external funding.
Acknowledgments
The authors are grateful for the support of the Brazilian electric utilities Companhia Paranaense de Energia (COPEL) (Paraná, Brazil) and Companhia Hidroelétrica do São Francisco (CHESF) (Pernambuco, Brazil).
Conflicts of Interest
The authors declare no conflict of interest.
References
- Keane, A.; Ochoa, L.F.; Borges, C.L.T.; Ault, G.W.; Alarcon-Rodriguez, A.D.; Currie, R.A.F.; Pilo, F.; Dent, C.; Harrison, G.P. State-of-the-Art Techniques and Challenges Ahead for Distributed Generation Planning and Optimization. IEEE Trans. Power Syst. 2013, 28, 1493–1502. [Google Scholar] [CrossRef] [Green Version]
- Miranda, V. Successful Large-scale Renewables Integration in Portugal: Technology and Intelligent Tools. CSEE J. Power Energy Syst. 2017, 3, 7–16. [Google Scholar] [CrossRef]
- Khaled, U.; Eltamaly, A.M.; Beroual, A. Optimal Power Flow Using Particle Swarm Optimization of Renewable Hybrid Distributed Generation. Energies 2017, 10, 1013. [Google Scholar] [CrossRef]
- Al Abri, R.S.; El-Saadany, E.F.; Atwa, Y.M. Optimal Placement and Sizing Method to Improve the Voltage Stability Margin in a Distribution System Using Distributed Generation. IEEE Trans. Power Syst. 2013, 28, 326–334. [Google Scholar] [CrossRef]
- Warid, W.; Hizam, H.; Mariun, N.; Addul-Wahad, N.I. Optimal Power Flow Using the Jaya Algorithm. Energies 2016, 9, 678. [Google Scholar] [CrossRef]
- Mégel, O.; Mathieu, J.L.; Andersson, G. Hybrid Stochastic-Deterministic Multiperiod DC Optimal Power Flow. IEEE Trans. Power Syst. 2017, 32, 3394–3945. [Google Scholar] [CrossRef]
- Atwa, Y.M.; El- Saadany, E.F. Optimal Allocation of ESS in Distribution Systems with a High Penetration of Wind Energy. IEEE Trans. Power Syst. 2010, 25, 1815–1822. [Google Scholar] [CrossRef]
- Wienholt, L.; Müller, U.P.; Bartels, J. Optimal Sizing and Spatial Allocation of Storage Units in a High-Resolution Power System Model. Energies 2018, 11, 3365. [Google Scholar] [CrossRef]
- Liang, J.; Molina, D.D.; Venayagamoorthy, G.K.; Harley, R.G. Two-Level Dynamic Stochastic Optimal Power Flow Control for Power Systems with Intermittent Renewable Generation. IEEE Trans. Power Syst. 2013, 28, 2670–2678. [Google Scholar] [CrossRef]
- Derakhshandeh, S.Y.; Masoum, A.S.; Deilami, S.; Masoum, M.A.S.; Golshan, M.E. Coordination of Generation Scheduling with PEVs Charging in Industrial Microgrids. IEEE Trans. Power Syst. 2013, 28, 3451–3461. [Google Scholar] [CrossRef]
- An, K.; Song, K.B.; Hur, K. Incorporating Charging/Discharging Strategy of Electric Vehicles into Security-Constrained Optimal Power Flow to Support High Renewable Penetration. Energies 2017, 10, 729. [Google Scholar] [CrossRef]
- Roald, L.; Misra, S.; Krause, T.; Andersson, G. Corrective Control to Handle Forecast Uncertainty: A Chance Constrained Optimal Power Flow. IEEE Trans. Power Syst. 2017, 32, 1626–1637. [Google Scholar]
- Kim, H.Y.; Kim, M.K.; Kim, S. Multi-Objective Scheduling Optimization Based on a Modified Non- Dominated Sorting Genetic Algorithm-II in Voltage Source Converter—Multi-Terminal High Voltage DC Grid-Connected Offshore Wind Farms with Battery Energy Storage Systems. Energies 2017, 10, 986. [Google Scholar] [CrossRef]
- Liu, Y.; Qu, Z.; Xin, H.; Gan, D. Distributed Real-Time Optimal Power Flow Control in Smart Grid. IEEE Trans. Power Syst. 2017, 32, 3403–3414. [Google Scholar] [CrossRef]
- Miranda, V.; Saraiva, J.T. Fuzzy Modeling of Power System Optimal Load Flow. IEEE Trans. Power Syst. 1992, 7, 843–849. [Google Scholar] [CrossRef]
- Zhang, W.; Li, F.; Tolbert, L.M. Review of Reactive Power Planning: Objectives, Constraints, and Algorithms. IEEE Trans. Power Syst. 2007, 22, 2177–2186. [Google Scholar] [CrossRef] [Green Version]
- Abdul-Rahman, K.H.; Shahidehpour, S.M. Static Security in Power System Operation with Fuzzy Real Load Conditions. IEEE Trans. Power Syst. 1995, 10, 77–87. [Google Scholar] [CrossRef]
- He, X.; Wang, W.; Jiang, J.; Xu, L. An Improved Artificial Bee Colony Algorithm and Its Application to Multi-Objective Optimal Power Flow. Energies 2015, 8, 2412–2437. [Google Scholar] [CrossRef] [Green Version]
- Edwin Liu, W.H.; Guan, X. Fuzzy Constraint Enforcement and Control Action Curtailment in an Optimal Power Flow. IEEE Trans. Power Syst. 1996, 11, 639–645. [Google Scholar]
- Assis, T.M.L.; Falcão, D.M.; Taranto, G.N. Dynamic Transmission Capability Calculation Using Integrated Analysis Tools and Intelligent Systems. IEEE Trans. Power Syst. 2007, 22, 1760–1770. [Google Scholar] [CrossRef]
- Lami, B.; Bhattacharya, K. Clustering Technique Applied to Nodal Reliability Indices for Optimal Planning of Energy Resources. IEEE Trans. Power Syst. 2016, 31, 4679–4690. [Google Scholar] [CrossRef]
- Arneja, I.S.; Venkatesh, B. Probabilistic OPF Using Linear Fuzzy Relation. In Proceedings of the 10th International Power & Energy Conference IPEC, Ho Chi Minh City, Vietnam, 11–12 December 2012. [Google Scholar]
- Mohapatra, A.; Bijw, P.R.E.; Panigrahi, B.K. Optimal Power Flow with Multiple Data Uncertainties. Electr. Power Syst. Res. 2013, 95, 160–167. [Google Scholar] [CrossRef]
- Gomes, F.V.; Carneiro, S.; Pereira, J.L.R.; Vinagre, M.P.; Garcia, P.A.N.; Araújo, L.R. A New Distribution System Reconfiguration Approach Using Optimum Power Flow and Sensitivity Analysis for Loss Reduction. IEEE Trans. Power Syst. 2006, 21, 1616–1623. [Google Scholar] [CrossRef]
- Borges, T.T.; Carneiro, S.; Garcia, P.A.N.; Pereira, J.L.R. A New OPF Based Distribution System Restoration Method. Int. J. Electr. Power Energy Syst. 2006, 80, 297–305. [Google Scholar] [CrossRef]
- Fisher, E.B.; O’Neill, R.P.; Ferris, M.C. Optimal transmission switching. IEEE Trans. Power Syst. 2008, 23, 1346–1355. [Google Scholar] [CrossRef]
- Schnyder, G.; Glavitsch, H. Integrated Security Control using an Optimal Power Flow and Switching Concepts. IEEE Trans. Power Syst. 2008, 3, 782–790. [Google Scholar] [CrossRef]
- Khanabadi, M.; Ghasemi, H.; Doostizadeh, M. Optimal Transmission Switching Considering Voltage Security and N-1 Contingency Analysis. IEEE Trans. Power Syst. 2013, 28, 542–550. [Google Scholar] [CrossRef]
- Capitanescu, F.; Ochoa, L.F.; Margossian, H.; Hatziargyriou, N.D. Assessing the Potential of Network Reconfiguration to Improve Distributed Generation Hosting Capacity in Active Distribution Systems. IEEE Trans. Power Syst. 2015, 30, 346–356. [Google Scholar] [CrossRef] [Green Version]
- Peng, Q.; Tang, Y.; Low, S.H. Feeder Reconfiguration in Distribution Networks Based on Convex Relaxation of OPF. IEEE Trans. Power Syst. 2015, 30, 1793–1804. [Google Scholar] [CrossRef]
- Monticelli, A.; Garcia, A. Modeling Zero Impedance Branches in Power System State Estimation. IEEE Trans. Power Syst. 1991, 6, 1561–1570. [Google Scholar] [CrossRef]
- Lourenço, E.M.; Simões Costa, A.; Ribeiro, R. Steady-State Solution for Power Networks Modeled at Bus Section Level. IEEE Trans. Power Syst. 2010, 25, 10–20. [Google Scholar] [CrossRef]
- Rosas, G.B.; Lourenço, E.M.; Fernandes, T.S.P. Network Model at Substation Level for Optimal Power Flow Studies. Controle Automação 2012, 23, 766–781. (In Portuguese) [Google Scholar] [CrossRef]
- Huneault, M.; Galiana, F.D. A Survey of the Optimal Power Flow Literature. IEEE Trans. Power Syst. 1991, 6, 762–770. [Google Scholar] [CrossRef]
- Granville, S. Optimal Reactive Dispatch through Interior Point Methods. IEEE Trans. Power Syst. 1994, 9, 136–146. [Google Scholar] [CrossRef]
- Chayakulkheeree, K. Probabilistic Optimal Power Flow: An Alternative Solution for Emerging High Uncertain Power Systems. In Proceedings of the International Electrical Engineering Congress, Pattaya, Thailand, 19–21 March 2014. [Google Scholar]
- Lyu, J.K.; Heo, J.H.; Park, J.K.; Kang, Y.C. Probabilistic Approach to Optimizing Active and Reactive Power Flow in Wind Farms Considering Wake Effects. Energies 2013, 6, 5717–5737. [Google Scholar] [CrossRef] [Green Version]
- National System Operator (Brazil). Available online: http://ons.org.br/paginas/sobre-o-ons/procedimentos-de-rede/vigentes-Módulo 23-Critérios para estudos-Submódulo 23.3-Diretrizes e critérios para estudos elétricos (accessed on 19 March 2019).
Figure 1.
(a) Bus-branch modeling and (b) substation level modeling.

Figure 2.
Probability Density Function (PDF) and fuzzy triangular model for wind and solar energy sources.
Figure 2.
Probability Density Function (PDF) and fuzzy triangular model for wind and solar energy sources.

Figure 3.
Maximum, average, and minimum daily values of active power (MW) wind farms.

Figure 4.
Brisa Potiguar wind farm daily behavior.

Figure 5.
Authentication—active power of Xingó hydroelectric power plant.

Figure 6.
Power flow distribution at Sobradinho 230 kV substation.

Figure 7.
Power flow distribution at João Câmara II 138 kV substation.

Figure 8.
Uncertainties in nodal voltage magnitudes of 500 kV bus of Pau de Ferro substation.


Table 1.
Active Power Flow Variations (MW) Through Circuit Breakers of Sobradinho 230 kV Substation.
Table 1.
Active Power Flow Variations (MW) Through Circuit Breakers of Sobradinho 230 kV Substation.
| Hour | Circuit Breaker (CB) 164 | CB 159 | CB 160 | |||||
|---|---|---|---|---|---|---|---|---|
| Wind Variation (MW) | Solar Variation (MW) | Wind Variation (MW) | Solar Variation (MW) | |||||
| 30% | −30% | 30% | −30% | 30% | −30% | 30% | −30% | |
| 06 | 26.5 | −26.5 | 0.67 | −0.66 | 39.8 | −39.8 | 2.0 | −2.0 |
| 07 | 26.4 | −26.4 | 0.70 | −0.69 | 39.6 | −39.6 | 2.1 | −2.1 |
| 08 | 25.3 | −25.3 | 0.74 | −0.76 | 38.0 | −38.0 | 2.2 | −2.3 |
| 09 | 22.8 | −22.8 | 0.79 | −0.80 | 34.2 | −34.2 | 2.4 | −2.4 |
| 10 | 19.1 | −19.1 | 0.82 | −0.81 | 28.7 | −28.7 | 2.4 | −2.4 |
| 11 | 15.8 | −15.8 | 0.82 | −0.81 | 23.8 | −23.8 | 2.4 | −2.5 |
| 12 | 13.6 | −13.6 | 0.81 | −0.80 | 20.4 | −20.4 | 2.4 | −2.4 |
| 13 | 11.9 | −11.9 | 0.82 | −0.82 | 17.9 | −17.9 | 2.5 | −2.5 |
| 14 | 11.3 | −11.3 | 0.83 | −0.83 | 17.0 | −17.0 | 2.5 | −2.5 |
| 15 | 11.4 | −11.4 | 0.83 | −0.84 | 17.2 | −17.2 | 2.5 | −2.5 |
| 16 | 12.3 | −12.3 | 0.81 | −0.81 | 18.4 | −18.4 | 2.4 | −2.4 |
| 17 | 13.0 | −13.0 | 0.79 | −0.80 | 19.5 | −19.5 | 2.4 | −2.4 |
| 18 | 14.7 | −14.7 | 0.84 | −0.82 | 22.1 | −22.1 | 2.5 | −2.5 |
Table 2.
Maximum Currents (A) Through Circuit Breakers of João Câmara II 138 kV Substation.
| System | Circuit Breakers | ||||
|---|---|---|---|---|---|
| 181 | 186 | 188 | 191 | 194 | |
| Original (A) | 789.6 | 491.2 | 442.9 | 300.3 | 1134.9 |
| Wind Energy Increment (A) | 1012.1 | 606.5 | 562.7 | 390.8 | 1431.7 |
| Wind Energy Decrement (A) | 579.2 | 396.9 | 331.0 | 209.9 | 866.3 |
| Circuit Breaker Rated Current (A) | 2000 | 2000 | 2000 | 2000 | 2000 |
| Original Current/Rated current (%) | 39.5 | 24.6 | 22.1 | 15.0 | 56.7 |
| (Maximum Current with Wind and/or Solar) /Rated Current (%) | 50.6 | 30.3 | 28.1 | 19.5 | 71.6 |
Table 3.
Variations (MW) at the Paulo Afonso IV Hydroelectric Power Plant.
| Hour | Wind Variation (MW) | Solar Variation (MW) | ||
|---|---|---|---|---|
| +30% | −30% | +30% | −30% | |
| 10 | −90.3 | 90.3 | 54.2 | −54.2 |
| 11 | −99.2 | 99.2 | 2.5 | −2.5 |
| 12 | −35.6 | 35.6 | −0.8 | 0.8 |
| 13 | −97.1 | 97.1 | 59.1 | −59.1 |
| 14 | −102.8 | 102.8 | 63.3 | −63.3 |
| 15 | −100.1 | 100.1 | 59.9 | −59.9 |
| 16 | −37.6 | 37.6 | −0.6 | 0.6 |
| 17 | −36.5 | 36.5 | −0.7 | 0.7 |
| 18 | −106.0 | 106.0 | −13.8 | 13.8 |
Table 4.
Available Powers: Conventional Generators.
| Conventional Generators | Active Power | Reactive Power | ||||
|---|---|---|---|---|---|---|
| Limits (MW) | Original (%) | Impact Wind and Solar (%) | Limits (MVar) | Original (%) | Impact Wind and Solar (%) | |
| Sobradinho | 1005 | 79 | 73 | −272~388 | 75 | 74 |
| Luiz Gonzaga | 1480 | 4 | 0 | −210~210 | 45 | 10 |
| Paulo Afonso | 2400 | 79 | 77 | −920~820 | 67 | 66 |
| Xingó | 3600 | 46 | 44 | −860~519 | 79 | 76 |
Table 5.
Voltage magnitude admissible limits in the Brazilian electrical system.
| Rated Operating Voltage | Normal Operating Condition | Emergency Operating Condition |
|---|---|---|
| (kV) | (pu) | (pu) |
| ≤138 | 0.95 to 1.05 | 0.90 to 1.05 |
| 230 | 0.95 to 1.05 | 0.90 to 1.05 |
| 345 | 0.95 to 1.05 | 0.90 to 1.05 |
| 440 | 0.95 to 1.046 | 0.90 to 1.046 |
| 500 | 1.00 to 1.10 | 0.95 to 1.10 |
| 525 | 0.95 to 1.05 | 0.90 to 1.05 |
| 765 | 0.90 to 1.046 | 0.90 to 1.046 |
Table 6.
Computational time (seconds).
| Hour | First | Second | Hour | First | Second | Hour | First | Second |
|---|---|---|---|---|---|---|---|---|
| Stage | Stage | Stage | Stage | Stage | Stage | |||
| 0 | 27.6 | 0.94 | 8 | 20.8 | 0.90 | 16 | 19.3 | 0.98 |
| 1 | 23.3 | 1.01 | 9 | 21.3 | 0.94 | 17 | 22.6 | 0.99 |
| 2 | 28.8 | 0.98 | 10 | 26.3 | 0.84 | 18 | 24.2 | 0.94 |
| 3 | 24.7 | 0.95 | 11 | 25.2 | 1.01 | 19 | 56.0 | 0.90 |
| 4 | 22.8 | 0.90 | 12 | 22.9 | 0.92 | 20 | 25.2 | 0.95 |
| 5 | 22.7 | 0.87 | 13 | 22.4 | 0.81 | 21 | 24.6 | 0.87 |
| 6 | 40.8 | 1.03 | 14 | 22.5 | 0.95 | 22 | 26.6 | 0.90 |
| 7 | 20.4 | 0.92 | 15 | 27.4 | 0.90 | 23 | 20.8 | 0.92 |
© 2019 by the authors. Licensee MDPI, Basel, Switzerland. This article is an open access article distributed under the terms and conditions of the Creative Commons Attribution (CC BY) license (http://creativecommons.org/licenses/by/4.0/).
Share and Cite
MDPI and ACS Style
Rosas, G.B.; Lourenço, E.M.; Falcão, D.M.; Fernandes, T.S.P. An Expeditious Methodology to Assess the Effects of Intermittent Generation on Power Systems. Energies 2019, 12, 1135. https://doi.org/10.3390/en12061135
AMA Style
Rosas GB, Lourenço EM, Falcão DM, Fernandes TSP. An Expeditious Methodology to Assess the Effects of Intermittent Generation on Power Systems. Energies. 2019; 12(6):1135. https://doi.org/10.3390/en12061135
Chicago/Turabian StyleRosas, Gracita Batista, Elizete Maria Lourenço, Djalma Mosqueira Falcão, and Thelma Solange Piazza Fernandes. 2019. "An Expeditious Methodology to Assess the Effects of Intermittent Generation on Power Systems" Energies 12, no. 6: 1135. https://doi.org/10.3390/en12061135
Note that from the first issue of 2016, this journal uses article numbers instead of page numbers. See further details here.