Energy, Economy, and Environment: A Worldwide Research Update


Faculty of Economics and Business, University of Almería, Ctra. de Sacramento, s/n, 04120 Almería, Spain
*
Author to whom correspondence should be addressed.
Energies 2019, 12(6), 1120; https://doi.org/10.3390/en12061120
Submission received: 23 February 2019
/
Revised: 13 March 2019
/
Accepted: 19 March 2019
/
Published: 22 March 2019
(This article belongs to the Special Issue Assessment of Energy–Environment–Economy Interrelations)
Abstract
:This paper has reviewed the international research on the interactions between the Economy, Energy, and Environment (3E) in the 21st century. For this purpose, a bibliometric and cluster analysis by fractional accounting has been carried out based on the two most important databases: Web of Science (WoS) and Scopus. The research found and studied 2230 documents from the WoS Core Collection and 3,149 from Scopus. The results show a continuous increase in the number of articles that were published and citations during the whole period. They also showed that China and the United States (U.S.) were the most productive countries and there was a predominance of Asian organizations supporting and fostering researches. The main contribution of this article is the analysis of keywords from 2001 to 2018. The trends show that the main common elements are sustainable development and sustainability and they also include CO2 emissions and consumption. Future research in this field should address the energy transition issue in the area of sustainable development by adapting it to the restrictions of this economic model.
1. Introduction
Throughout history, the concept of economy has evolved in parallel with society: from a perspective that is solely focused on obtaining wealth, to a holistic and integrated vision in which a growing number of factors are interrelated with it.
The scientific literature includes numerous articles in which the interrelation between Energy, Economy, and Environment is identified with the nomenclature “3E” [1,2,3]. In this sense, the eight Millennium Development Goals that were proposed by the United Nations Development Organization [4] at the beginning of the 21st century show the global importance of this triple helix in the global economic scenario. Ensuring environmental sustainability is the seventh of these goals, while energy appears as an indicator of this objective: carbon dioxide emissions or use of water resources, among others. The evolution of these objectives in the Sustainable Development Goals [5] expands the importance of energy and the environment in the form of the following: affordable and non-polluting energy, sustainable cities and communities, or climate action. In light of this, 3E is more present today than ever before.
In recent years, the problems that are related with 3E have been studied and evaluated in a deeper way than ever before in history [6,7,8]. Recently, the academic community has linked these three elements in the form of diverse currents or lines of research [9,10,11].
One of these research lines emphasizes the impact of the energy management of productive units on the economic growth of the regions. On the one hand, the impact of human activities, such as mining or tourism, on the state of natural resources (even human capital) is analysed [12,13,14]. In contrast, some authors apply a long-term approach and analyse the viability of cleaner energy in developing economies [15,16].
There are also research studies in which the efficiency and effectiveness of the energy sources used are related to the environment and the restrictions that it poses. For example, the solid waste recycling strategy in Brazil to solve the problem of the growing amount of electronic waste because of an increase in the use of new technologies and electrical energy [17], or the impact of efficient coal waste management [18] while using environmental indicators that characterize the combustion of different ranges of coal (gas, flame, coke, or uncooked coal).
There is a factor used by the research community that manages to relate the three elements in an integral way: the concept of renewable energy [19,20]. Through the inclusion of alternative energies, the productive system of an economy adapts the intervening elements in the value chain to develop an “environment-centred” strategy [21,22]. For example, an integrated sustainability model that is used to understand how changes in the bioenergy system influence environmental measures, economic development, and society, showing that an increase in the share of bioenergy in total electricity generation will stimulate the electricity market [23].
Other authors follow this trend regarding energy from different perspectives: a reorientation of productive energy distribution towards others, such as biogas, biodiesel, or bioethanol to close the carbon cycle in nature [24]; the achievement of a given objective of carbon dioxide elimination through the framework of Modelling and Optimisation of Negative Emission Technologies (MONET) [25], or an analysis of the impact of traditional and alternative energy resources on economic growth, the transport sector, and the carbon dioxide emissions [26].
Furthermore, another highlighted line of investigation focuses more on the environmental aspect: from a legal and educational approach of the issue [27], the application of the concept of eco-efficiency to assess the suitability of renewable energies [28,29,30] to multi-target models or a qualitative comparative analysis to study the relationship between economic growth and the environment [31,32,33].
The so-called carbon footprint, which can be defined as a measure of the greenhouse gas emissions of human activity, is another element of growing research attention that associates the three concepts [34,35]. This line of research applies the method of accumulated energy demand to develop and validate indicators of urban environmental sustainability, using the five urban systems in Italy as case studies to analyse their ecological footprint. Other researchers [36] use the life cycle assessment method to propose a strategy to maximise the benefits of the cold chain of table grapes by integrating its carbon footprint. In the same way, the concept of the seasonal footprint avoided by imports has been used to analyse whether proximity and seasonal consumption are consumption patterns that buyers can use to improve the sustainability of the economy [37]. An approach that is focused on the Internet of Things has also been used to analyse the management of “Smart” cities and how households can reduce their carbon footprint [38].
However, the most relevant expression of the union of these concepts is found in the concept of sustainability, which made its first appearance on the international stage at the United Nations Conference on Environment and Development [39] that was held in Stockholm in 1972. Since then, the question of how to improve and stabilize the economic situation of countries is linked to the restrictions that are imposed by the natural environment [40] and it has materialized in numerous research articles that interrelate the economy with the environment. In fact, sustainability is identified as the perfect conciliation between the environment and the economy [41].
In accordance with this approach, several authors focus on the following methodologies to assess the impact of human activities on the sustainability of the environment: an analysis of the social and environmental impact of these activities by using the life cycle assessment method [42], agency theory [43], or the development of different indicators [44,45]. On the other hand, another stream of authors study how the different agents of the economy of a country influence the sustainability: multinational companies [46] or final consumers [47].
Nevertheless, the researchers also point to examples of economic growth using environmentally damaging energies [48], recommending that authorities should take the path of sustainable development with low resource consumption, less pollution, and high ecological security.
There are similar articles that analyse the economy, energy, and environment from a bibliometric analysis, either independently or in pairs [49,50,51]. However, there is no article in the existing literature analysing the latest trends in 3E that are based on a bibliometric analysis. From this analysis, it can be seen that the junction of the three terms results in new research areas, such as sustainability, and a focus on CO2 emissions.
2. Materials and Methods
The methodology that is used to analyse the concept of 3E is bibliometric analysis, a scientific method that is widely accepted and used by institutions, such as the European Commission or the National Science Foundation [52]. Bibliometric is a scientific method that uses mathematical techniques and statistics to evaluate a given scientific output [53]. The principle on which it is based is the citation network, from which the sub-methods of citation analysis [54] and scientific cartography, which are essential for the evaluation of research performance, are derived. In order to understand the performance or production of a researcher, this research has also applied the index h, as developed by Hirsch [55] and defined as the number of articles with citation number ≥h. To this end, the indexes of publications in the core collection of the WoS and Scopus online databases are considered.
All types of documents (articles, books, proceedings and so on) were included for the general analysis, but the impact analysis was filtered to only include articles (Table 1). The reason why this filter was applied is that this type of scientific document has undergone a rigorous review process to guarantee its quality and will, thus also guarantee the quality of our conclusions. Finally, information that is related to 3E was also filtered, coding the recovered material, and analysing the results.
The cluster analyses were built while using VOSviewer software tool for constructing and visualizing bibliometric networks [56]. For this analysis, a fractional counting method was chosen. The basic idea of the fractional counting approach is that each action, such as co-authoring or citing of a publication, should have equal weight, regardless of, for instance, the number of authors, citations, or references of a publication [57].
This bibliometric analysis followed the following steps (Figure 1). First, the search criteria, keywords, and period were defined. In this work, we have chosen the words “energy”, “environment”, and “economy”. The reason why these words have been chosen lies with the scientific community’s continued use of 3E terminology to name the development and growth models in which these elements are integrated [1,2,58]. The study period corresponds to the 21st century: from 2001 to 2018 so that new trends can be better defined. Subsequently, Scopus and WoS were the chosen databases in which the analysis was conducted, since they are the two largest databases that follow a rigorous protocol for the inclusion of research work in order to ensure scientific quality [59].
In order to identify new trends involving the three elements, 3904 relevant research studies have been identified from 2001 to 2018 in the core collection of Web of Science (WoS). The list was then filtered down to 2230 publications that link Energy, Economy, and Environment as keywords in the documents recorded. The process was then repeated for the Scopus database. This time, 6198 documents were founded and the results were filtered down to 3149 research articles that were published in impact journals.
3. Results and Discussion
3.1. Number of Publications per Year
Below, a series of data is displayed, which shows the status of the research activity about 3E with reference to the results of the WoS and Scopus databases in the 21st century.
WoS opens the new century with the article entitled Energy relations of gas estimated from flare radiation in Nigeria [60], in which the economic and environmental impact of oil extraction in Nigeria is studied. Scopus, on the other hand, includes, as its first article for the period, the work entitled Food security, agricultural subsidies, energy, and the environment. A process of ‘glocalization’ in Sri Lanka [61], in which the interaction of the political dilemma in the areas of food security, agricultural subsidies, energy consumption, and the environment in the process of ‘glocalization’ in Sri Lanka are analysed.
Throughout the study period, it is observed that the scientific contribution that was collected in Scopus is higher than that of WoS in terms of the number of articles and citations, with the only exception of 2016, in which the latter is slightly higher. The evolution of the h-index follows a similar pattern, with WoS being higher in 2007. On the other hand, the ratio of scientific production (represented by the number of citations per article) does not follow such a clearly defined path. However, there is convergence in the number of articles that are indexed in each of the databases by the end of the period (Table 2).
With consideration of the total number of articles in both databases, the trend is positive, exponentially growing in recent years, and even surpassing 400 articles published in 2018 on the Scopus database. The dynamics of WoS with respect to this issue is positive throughout the period, only decreasing in 2004. The Scopus trend, on the other hand, shows several moments of decreasing scientific contribution: in 2004, 2013, 2014, 2015, and 2016. However, the overall positive evolution of this factor indicates that research into the interrelationship between the economy, energy, and the environment is a safe bet, and currently at a high point in terms of the number of studies being published on this issue (Figure 2 and Figure 3).
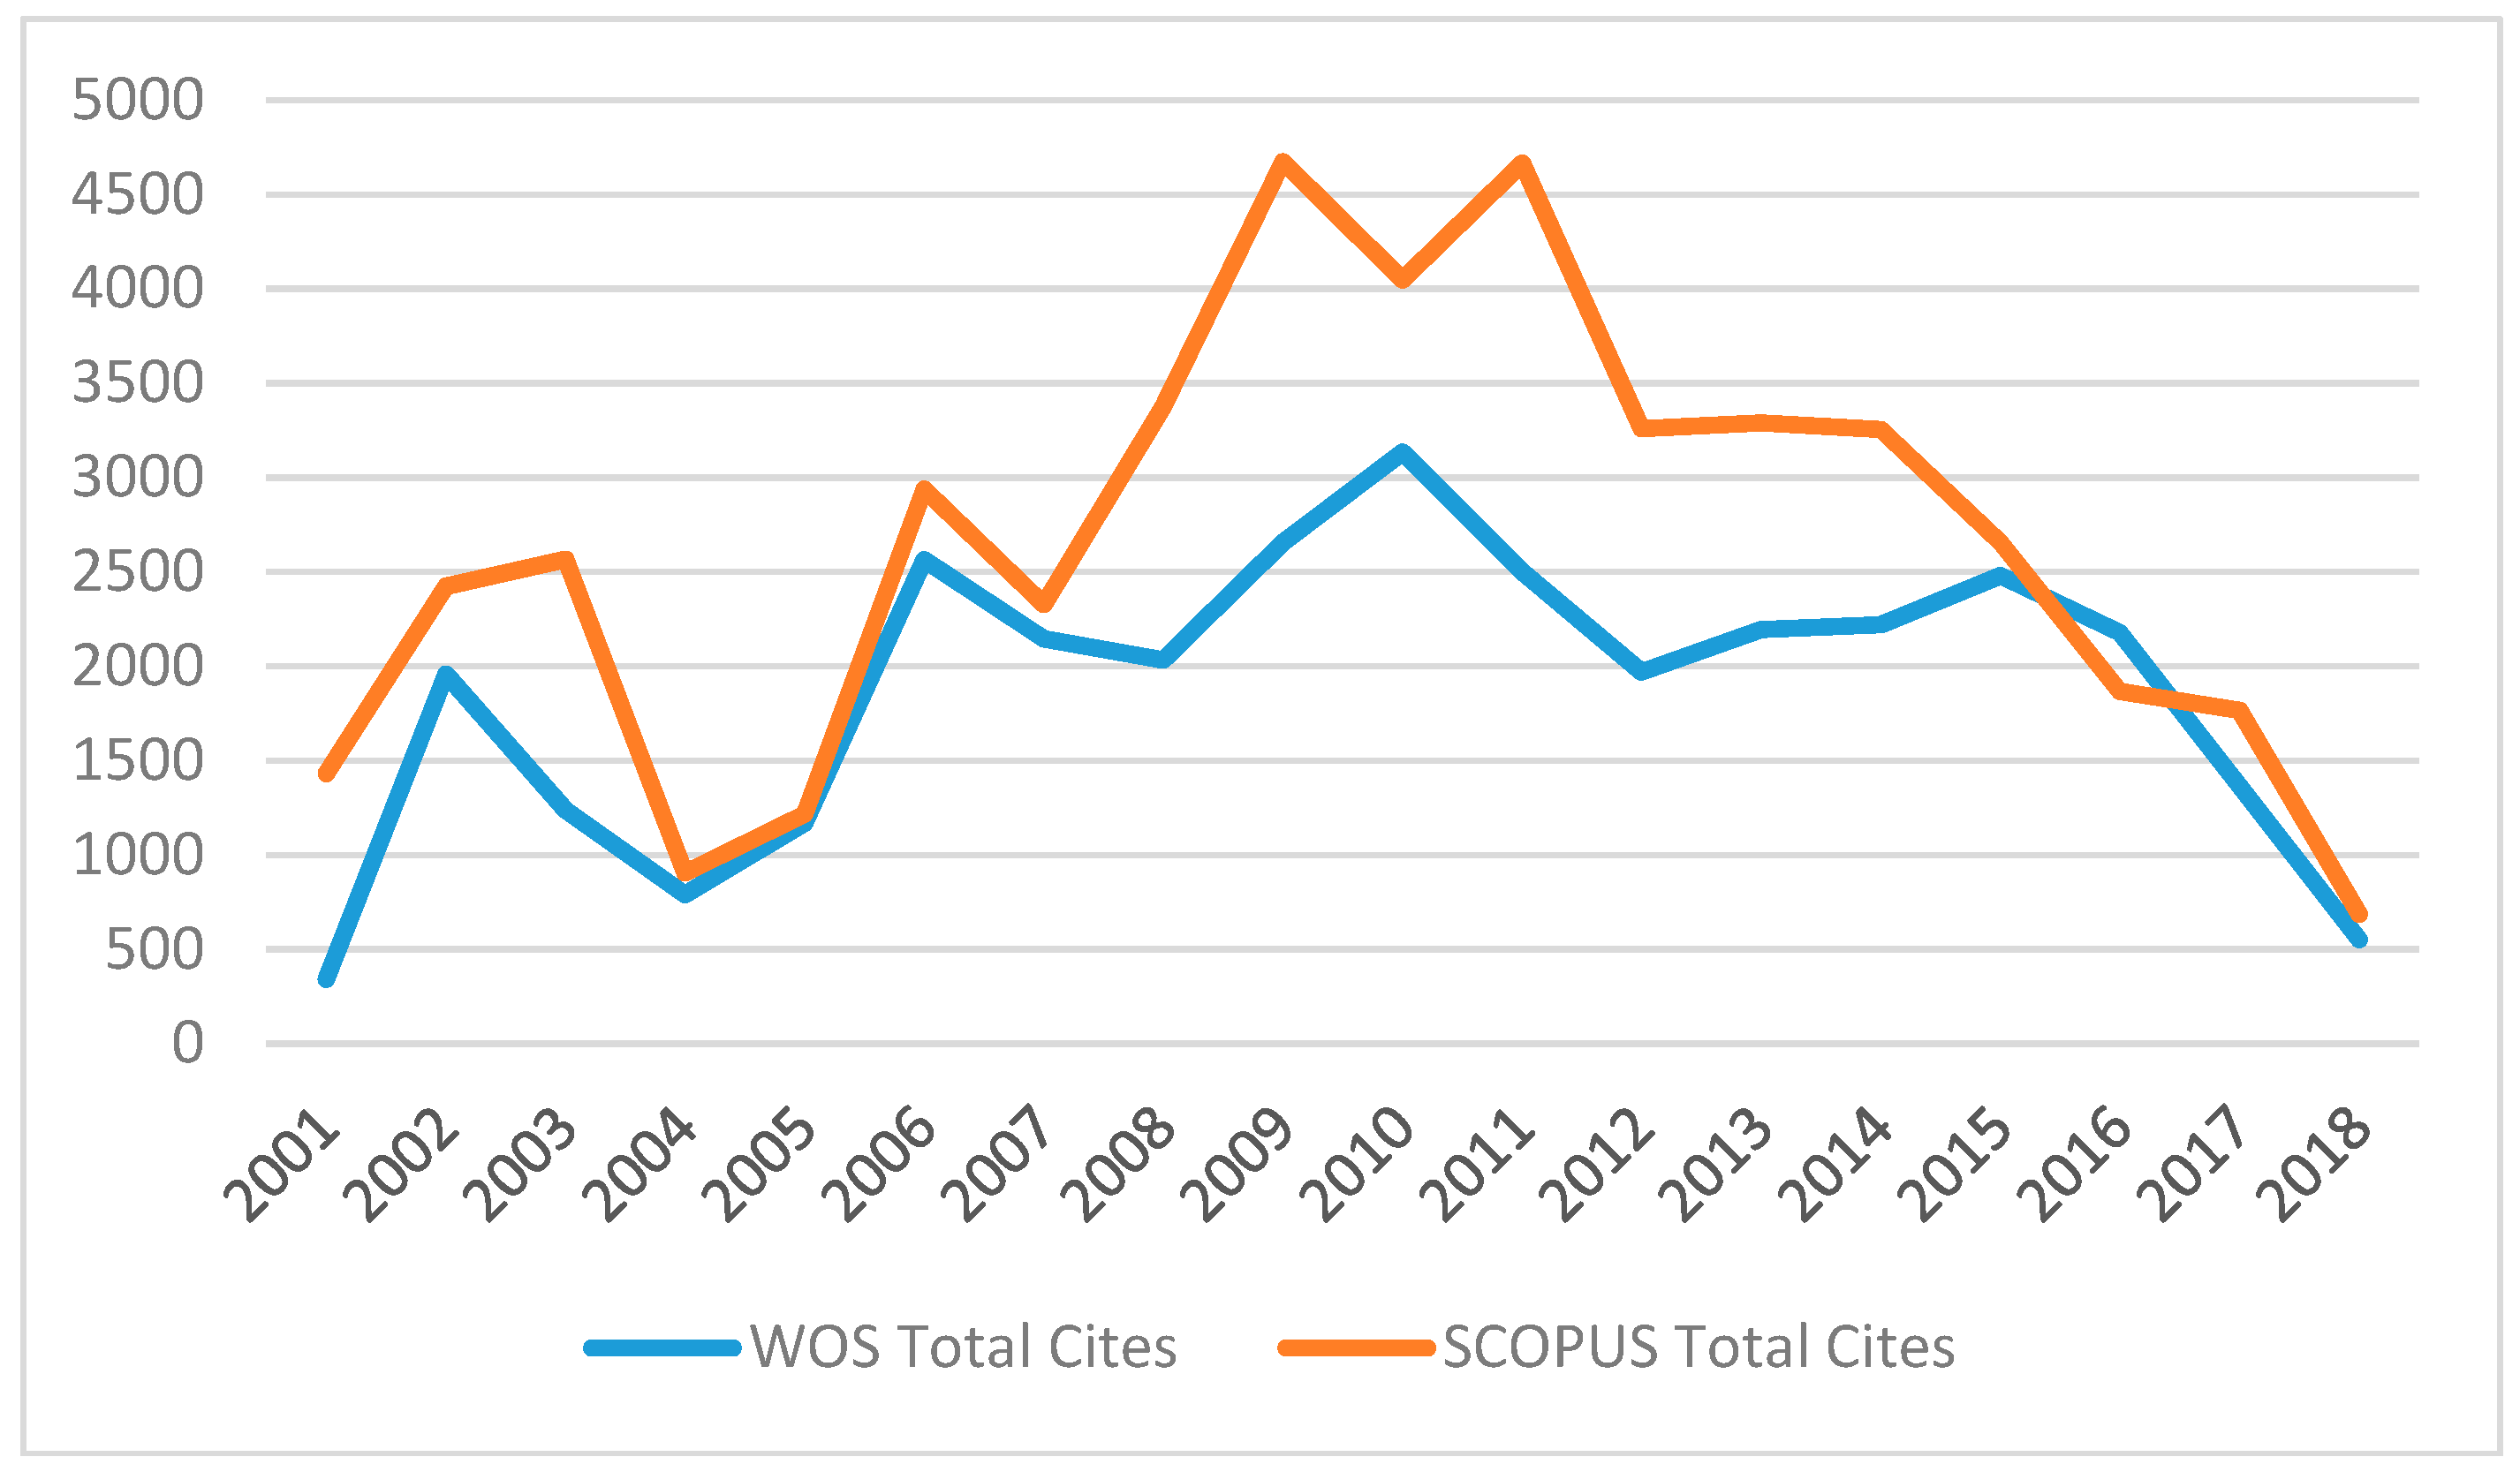
The evolution of the number of citations does not present as stable a path as in the previous variable, drawing an inverted U shape. The highest peak was in 2009 and 2011 for Scopus and 2010 for WoS, decreasing in recent years. The most quoted article throughout this period in WoS and Scopus is the work, A class of non-precious metal composite catalysts for fuel cells [62], with 1477 and 1531 citations, respectively (Figure 4).
3.2. Language and Most Influential Countries
The main countries in terms of publication on 3E for both databases are represented below. The ranking by country is practically the same for both databases: China leads the economy, energy, and environment research field, followed by the United States of America (USA) and the United Kingdom (UK), although the difference between the Asian countries and Anglo-Saxon ones is higher in Scopus than in WoS. The only difference that was observed in both geographical distributions is the last place: Netherlands for WoS and Russia for Scopus, with a similar production of articles, but with much greater capacity for dissemination in the case of the Netherlands as compared to Russia.
The distribution by language shows the complete predominance of English over other languages. With regards to other languages that are used in this field of research, the most commonly used in both databases are Russian, Spanish, and German. Chinese and Portuguese are the divergent languages, especially the latter if the results of WoS and Scopus are compared: three versus 311 articles (Table 3 and Table 4).
3.3. Journals and Authors
The distribution of scientific production by authors with respect to 3E shows a situation in which the vast majority of authors are of Asian origin, especially from the perspective of WoS. However, Professor Terry Barker (Department of Applied Economics at the University of Cambridge (UK)) is the most prolific author in both datasets, with 13 and 10 articles in WoS and Scopus, respectively (Table 5).
In both databases, the journals Energy Policy, Journal of Cleaner Production, Energy, and Sustainability are the most influential journals on 3E-related issues. In fact, half of the most influential journals are the same in WoS and Scopus. The main difference is the inclusion in Scopus of Asian journals: Shengtai Xuebao Acta Ecologica Sinica and Nongye Gongcheng Xuebao Transactions of the Chinese Society of Agricultural Engineering (Table 6).
3.4. Areas of Knowledge
The analysis of knowledge areas has been carried out with an initial homogenization of the existing categories in WoS and Scopus, in order to extract more conclusive results. The adaptation of the categories in WoS has been conducted with the inclusion of the Environmental, Chemical, Civil, Industrial, and Agricultural Engineering subsections, while Computer Science includes Artificial Intelligence, Interdisciplinary Applications, Software Engineering, and Information Systems. The rest of the thematic areas correspond to the distribution that is presented in Table 7. The revision of categories in Scopus has required the inclusion of Chemical Engineering in the Engineering area, while the rest of categories correspond to those existing in this database.
The areas of Environmental Sciences, Engineering, and Energy Fuels are the most predominant in terms of the number of articles published, especially in the case of Scopus, where this trio is separated from the rest with a gap of almost double the number of works. However, if the influence or productivity, as indicated by the number of citations per article, is observed, the category of Business Economics has the greatest impact in the scientific field, occupying second and third place in WoS and Scopus, respectively (Table 7).
3.5. Institutions
The distribution of the 3E’s scientific contribution with respect to the institutions shows a predominance of Asian organizations. In fact, nine of the 13 institutions that were analysed are located in China, which is consistent with the results that were obtained in relation to geographical distribution and the most productive and influential authors.
Both of the databases show that the top three positions are held by the Chinese Academy of Science, Tsinghua University, and North China Electric Power. The first of these is one of the most relevant research centres in the world with around 60,000 researchers, standing out in the field of chemistry. Tsinghua University is dedicated to academic excellence, the benefit of Chinese society, and global development. It is considered to be one of the best academic institutions in China and Asia, ranking in the top 20 of the Times Higher Education World Reputation Rankings. Finally, North China Electric Power has been fostering talent in the areas of engineering technology, management, economics, and the social sciences.
The exceptions to the Asian institutions are the University of Cambridge, the U.S. Department of Energy, the University of London, and the University of California. In other words, the main organizations researching the relationship between the economy, energy, and environment are of Chinese and Anglo-Saxon origin (Table 8).
3.6. Linked Areas: Clustering 3E
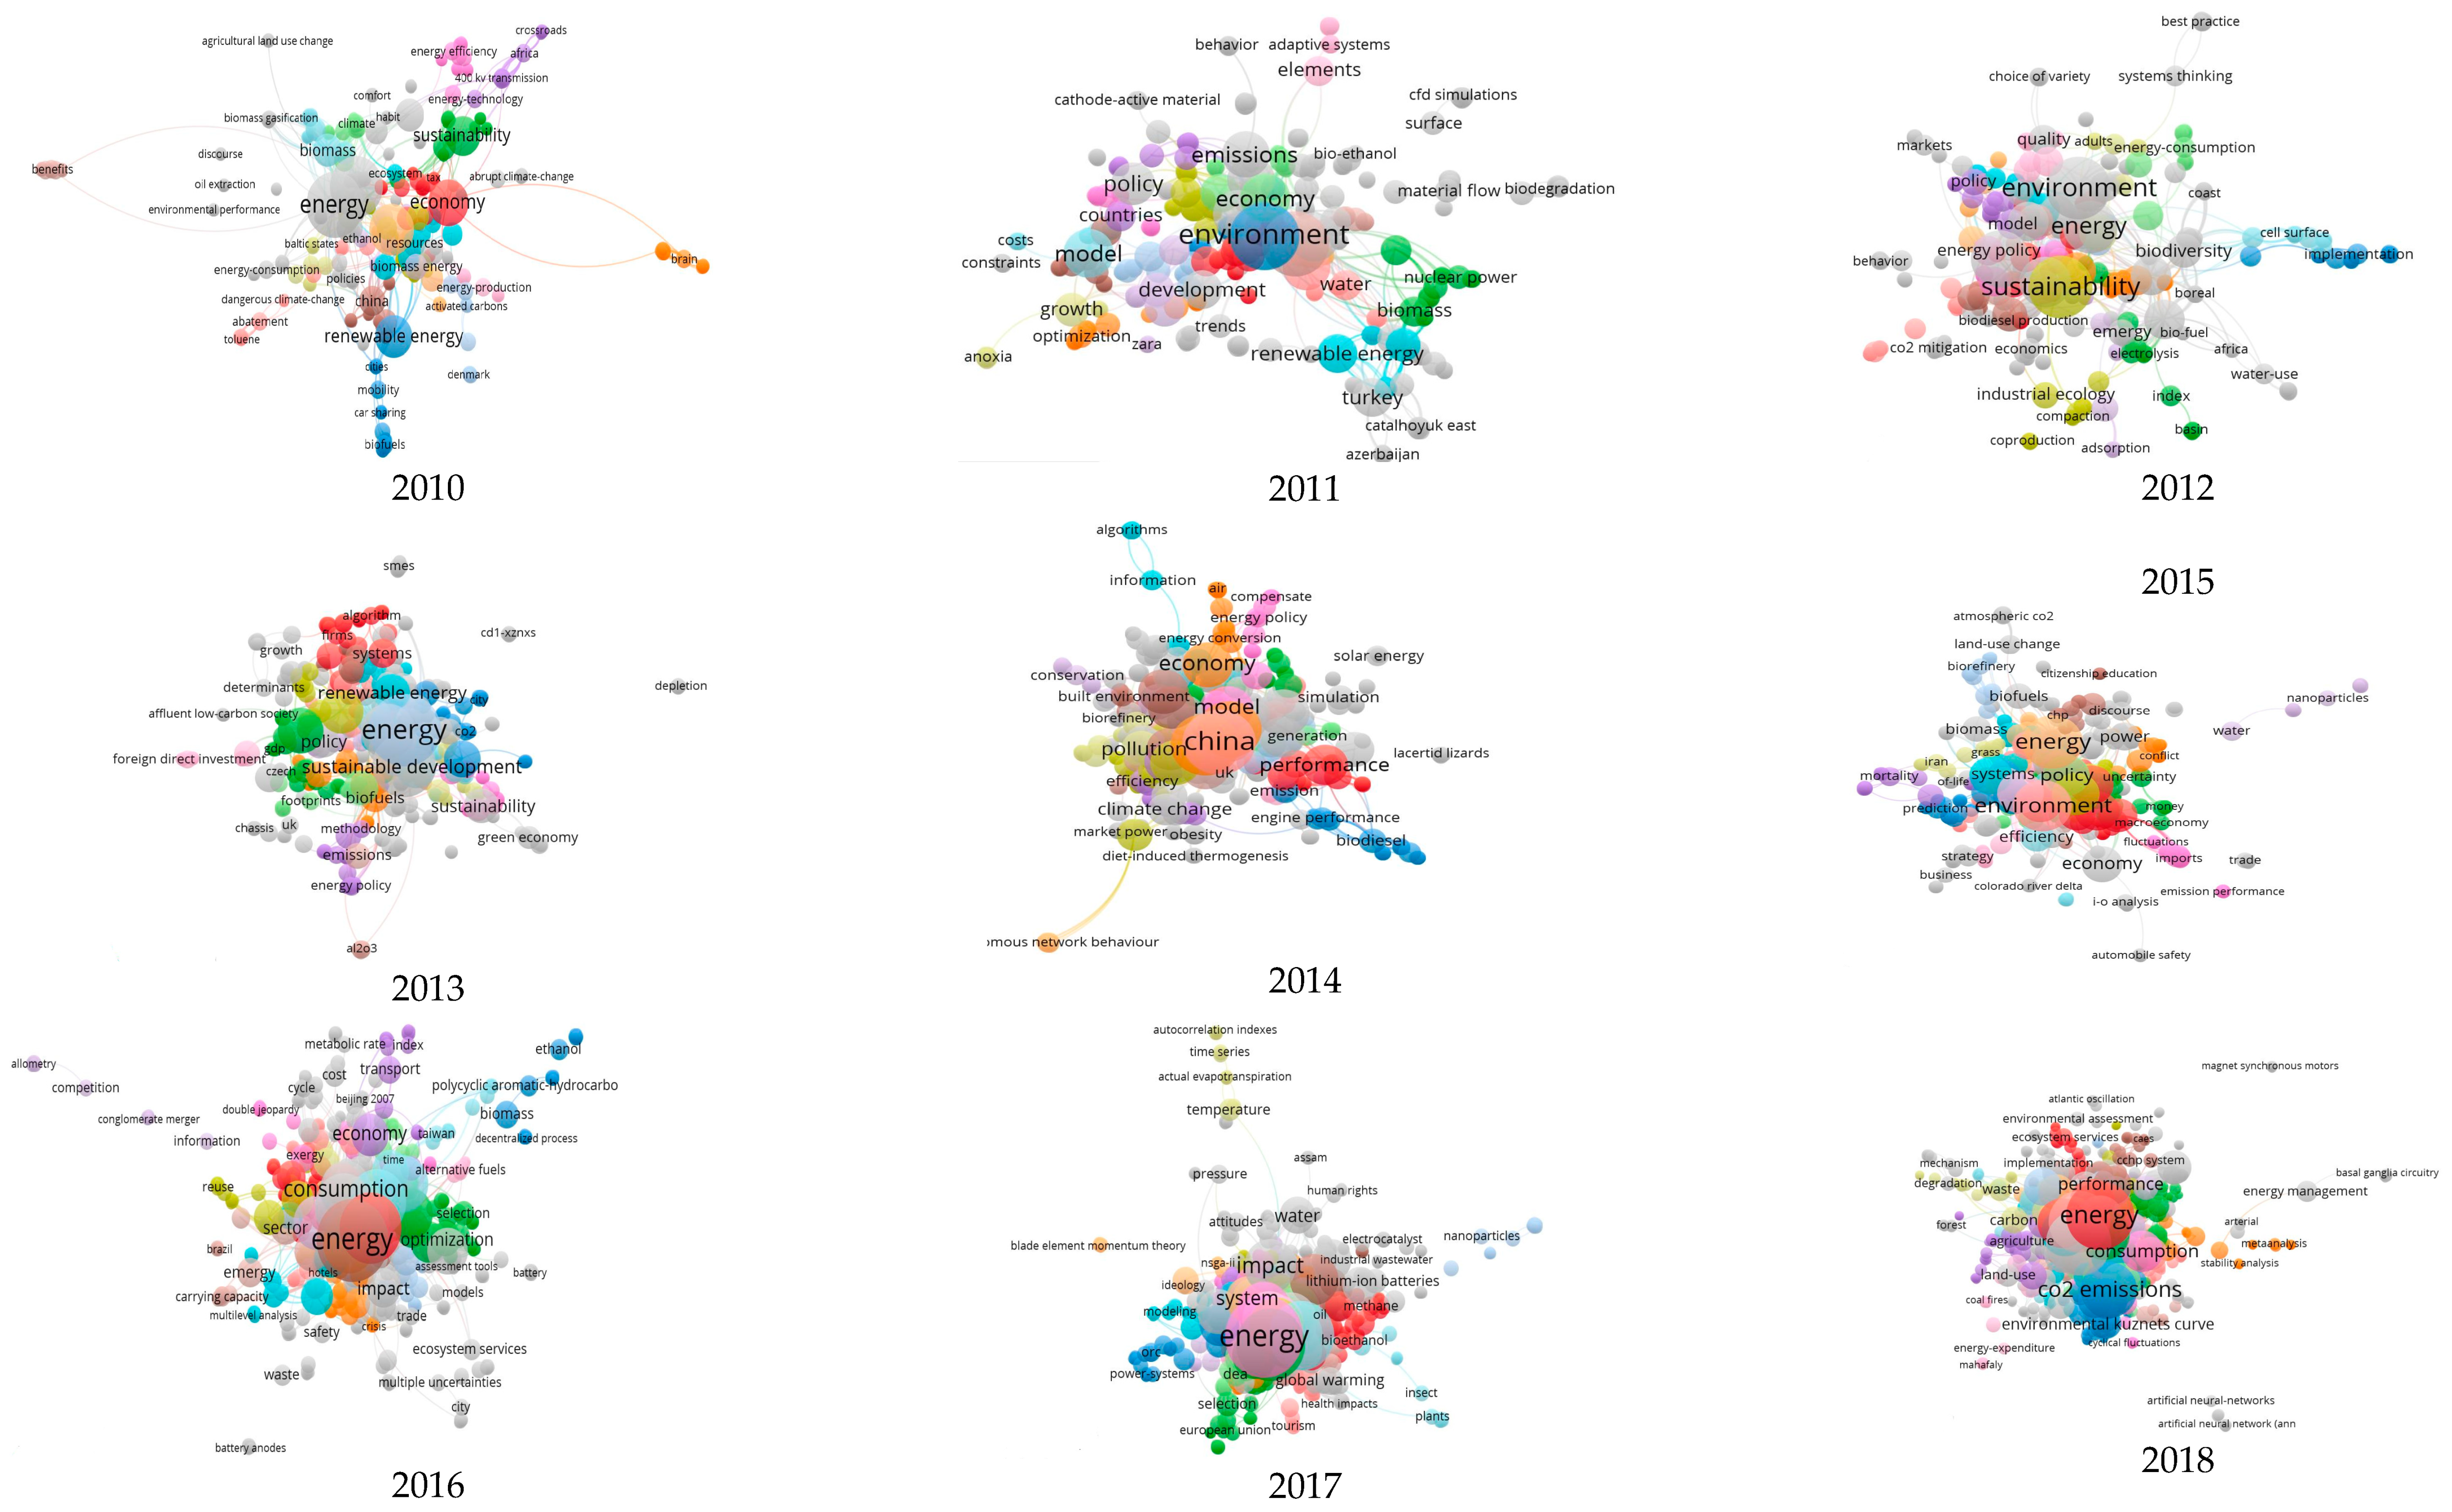
In order to have a better understanding of the evolution of the literature from 2001 to 2018, a fractional counting cluster analysis of keywords throughout the study period has been carried out. The different configurations of the clusters can be observed in Figure 5 and Figure 6, and they also show how the main and central topics have changed.
The articles published during 2001 are distributed into three clusters, with the term Sustainability linking them (Figure 5). The first cluster includes: cost effectiveness, Czech Republic, environmental assessment, water, and national accounting; the second cluster: construction materials, governance, developing countries, public policy, and technology transfer; and, the third one: environmental protection, energy consumption, and transport policy, all being within the geographical scope of the Czech Republic and China.
The following two years follow a similar group structure, with a greater distribution in 2003: four groups in 2002 as compared to 11 in 2003. The 2002 groups show the incorporation of new elements in the 3E research field, such as logistics, structural change, land use, environmental impact, energy, sustainable development, carbon dioxide, and hydrogen economy. In 2003, energy was the central axis of the documents, being closely related to the environment in models of bottom-up approach. The same cluster also includes keywords, such as integrated econometric models, welfare, or trade reforms, all being framed within the geographical scope of China. The economy, on the other hand, is found in another cluster, along with terms, such as biomechanics or energy efficiency.
There was a variation in the distribution of the research in 2004, with the predominance of two large clusters that are united by the concept of sustainable development. The first cluster includes elements, such as cost-benefit analysis, energy analysis, and quality. The second cluster focuses on the value chain, the input-output technique, the explicit integration of economy, energy, and environment and industrial district, focusing the issue in countries, such as Italy and the USA. In 2005, sustainable development continued to be the central trend in the relationship between economy, environment, and environment. Six clusters were identified, in which biomass energy is related to environmental conservation, energy policies, renewable and rural energies, as well as environmental management or the analysis of life cycle assessment in the territories of China and the European Union.
In the following year, the importance of the economy was greater within the dimension of 3E, while sustainable development continued to be the central concept. Keywords, such as energy efficiency, taxes on coal and emissions, as well as biomass, renewable energy sources, climate change, Jevons paradox, or eco-efficiency within New Zealand and Turkey revolve around it. In 2007, there was a convergence between the three concepts of 3E, surrounded by elements, such as the agricultural economy, biomass, hydrogen, energy efficiency, gasification, carbon dioxide emissions, production of biohydrogen, or energy in the geographical areas of China and India.
The scenario drawn in 2008 and 2009 is very similar to that of 2007, although the importance of energy is lower when compared to the presence of the environment and the economy in those years’ articles. New concepts that were incorporated in those years include wind energy, research and development policies, strategic planning, exergy analysis, uncertainty, and the price of carbon emissions in the Balkans, Europe, Asia, and India. Similar to 2008, 2009 saw a waning of the importance of the economy with respect to energy and the environment, as well as a lesser presence of sustainable development. Newer elements in 3E include the analysis of the environmental impact of transport, critical discursive analysis of ecological modernization, deforestation, biodiesel, biofuel, and ecological footprint, all being framed in countries such as China, Japan, or the African continent.
In 2010 (Figure 6), there was an increase in the importance of the elements of 3E, together with the concept of sustainable development. In this period, new factors appear, such as the change in the use of agricultural land, the dangers of climate change, the energy footprint, ecological modernisation, greenhouse gas, environmental strategy, and the responsibility of consumers and pressure groups on the state of the environment. The main territories at this time were China, Japan, Denmark, Europe, and Africa. In 2011, the environment was the main element of 3E. Sustainability and climate change are at the same level in terms of presence, while aspects such as renewable energies or emissions management appear in the research to a greater extent than in previous periods. In addition, the geographical scope of the studies broadened to include territories, such as Azerbaijan and the United Arab Emirates. In 2012, the concept of sustainability once more gained space, along with the terms biomass, biodiversity, efficiency, and performance. Economy, environment, and energy are at the same level of presence, but behind sustainability. The number of researches that were carried out in China increased, as well as those that were focused on developing countries.
The following year, 2013, shows a similar structure to that of 2009, with a recovery of the concept of sustainable development. It is in this year that the green economy had greater presence in the research scenario, including terms, such as recycling or energy efficiency. 2014 stands out for the high prominence that China acquires in the investigation on 3E. The concept of environment is at the same level, to the detriment of energy and economy. Sustainability and energy efficiency also have a high presence, and it is at this time that solar energy is analysed to a greater extent. In that year, there was a distancing of the concept of economy in relation to energy and the environment, which had a greater presence in the research landscape than the first. In fact, the greatest division takes place between economy and energy, with the environment being the connecting element. China continues to have a high presence, as well as a growing number of articles analysing the uncertainty, performance, and management of energy efficiency.
Something similar happened the following year, 2015, where energy and the environment are more closely related than the economy, which is less relevant. Along with the first two elements, sustainable development, sustainability, consumption, economic growth, and CO2 emissions also stand out, with China and the USA being the main countries under investigation. In 2016 and 2017, the economy was once again linked to the other two components of 3E, with a concentration of keywords around 3E. Finally, energy and sustainable development predominate in 2018. Factors, such as the environmental curve of Kuznets, the carbon footprint, the circular economy, and the optimization of the efficiency of greenhouse gas emissions are also present. These coincide with the latest trends that were observed in the cluster analysis for the whole period (Figure 7).
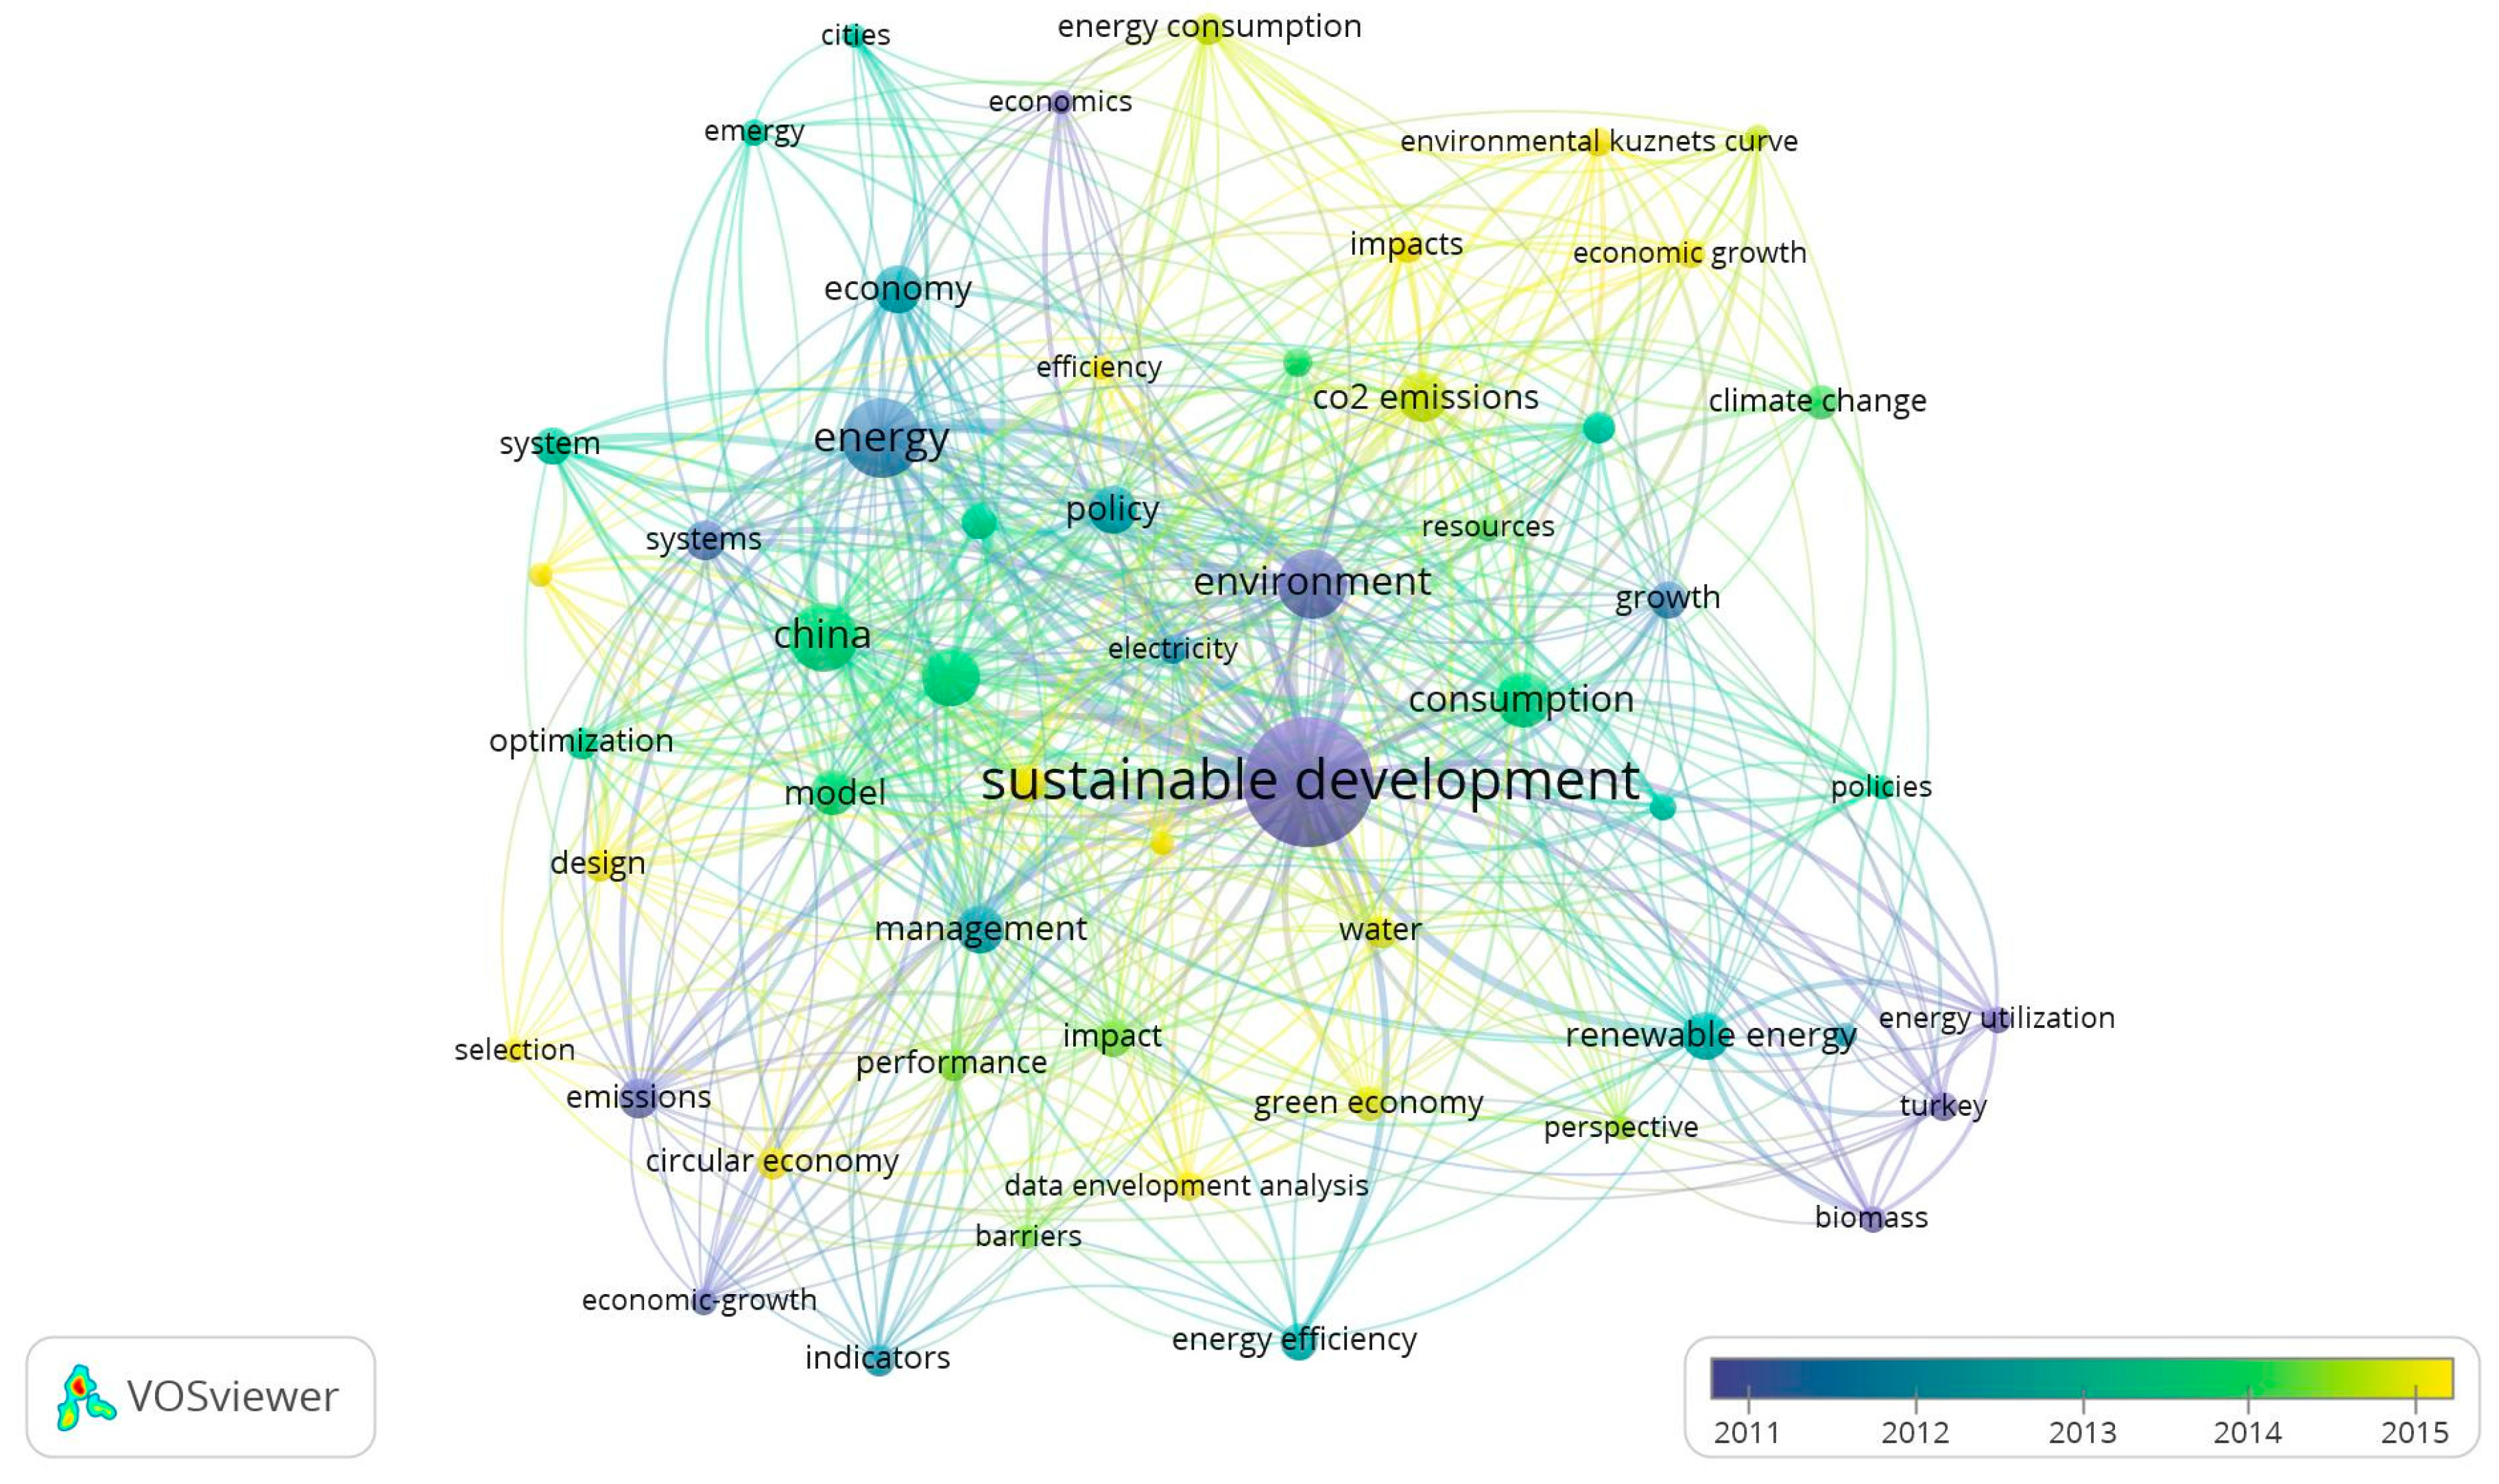
The analysis of the 3E keyword trend shows that the most prominent common elements were sustainable development and sustainability. The inclusion of this in the analysis shows the different clusters that link them and the latest trends.
With regard to the clusters, these are distributed in six groups. The first of them relates to economic growth in the circular economy, the efficient use and consumption of energy, and the management of emissions, all being framed in the geographical scope of China and in the methodology of surrounding data analysis. The second group focuses more on the field of economic development, climate change, and greenhouse gas emissions, with its methodological element being the analysis of the environmental curve of Kuznets. The following two groups follow the line of climate change, identifying new energy sources, such as biomass or biofuel, and including elements, such as green economy, development, and sustainable energy, as well as the territory of Turkey. The fifth encompasses the concept of sustainability and energy, while the last cluster integrates innovation with development policies and dynamic systems.
Figure 8 shows the latest trends in research with the integration of energy, economy, and environment terms in a single cluster analysis. An initial reflection in these trends indicates that the Kuznets environmental curve is used under the sustainable development approach. Currently, the enveloping analysis of data is used to study the impact of variables, such as carbon dioxide emissions or energy consumption on economic growth. On the other hand, due to the absence of some terms that were commonly used in previous years, such as petrol, pollution, or even some that are lagging behind, such as climate change, which is in accordance with this cluster analysis, future research on 3E may emphasise on Circular Economy and Green Economy as the main solution for achieving sustainable development.
4. Conclusions
The interrelation between Energy, Economy, and Environment has been studied in depth by academia and the number of publications increases year on year. The Millennium Development Goals that was proposed by the United Nations Development Organization has contributed to highlight the importance of this triple helix in the global economic scenario.
The bibliometric and cluster analysis has shown that the main thematic categories that are linked to the integrated concept of 3E correspond to environmental sciences, engineering, energy fuels, and business and economics. However, the diversity of topics with which this concept is related is so great that it demonstrates its multidisciplinarity and transversal character.
The study of the most prolific countries shows the hegemony of China, followed by the USA and the United Kingdom. This leadership of China as a research country in economy, energy, and environment is more evident after analysing the distribution by authors and institutions, wherein most of them are from said country. However, English continues to be the main language used by researchers due to the fact that it is the preferred language for the publication of articles in the principal high impact journals.
The analysis of keywords shows that the evolution of the interrelation between 3E from 2001 to 2018 has been marked by a process of progressive integration of the three concepts. From 2001 to 2005, there was a clear differentiation in a few groups between energy, economy, and environment. However, from 2009 onwards, a progressive change can be observed in this relationship, integrating itself more and more until 2018, when the concept of 3E culminates in the term sustainable development, being linked to the environmental curve of Kuznets, the carbon footprint, the circular economy, the green economy, and the optimisation of the efficiency of greenhouse gas emissions. These latest trends are framed within the enveloping data analysis methodology. The main common element is sustainable development and sustainability. It can be observed that topics regarding renewable power, such as solar energy, have a relevant role from 2010. The inclusion of this in the analysis shows the different clusters that link them and the latest trends.
According to the results that were obtained, the future of 3E studies revolves around the concept of sustainable development, in which China, with the Chinese Academy of Science at the forefront, is positioned as the driving country of this trend, and journals, such as Energy Policy, are the main drivers to concentrate the research effort of the scientific community of institutions with greater research capacity in the field of environmental sciences, energy fuels, engineering, business, and economics.
Specifically, in relation with energy, one of the most important topic are energy saving, energy efficiency, recycling, and renewable energy sources, highlighting the importance of green energy. In this line, concepts, such as eco-efficiency and energy production, have a greater presence in the academia.
This work is placed as an identification of the latest trends that relate to Energy, Economy, and Environment, at a time when the transition to energy from less polluting sources is being considered in view of the imminent arrival of climate change. Therefore, it marks new lines of research that is related to the concept of sustainable development and other complementary terms, such as the circular economy or carbon footprint. In other words, new research in the field of 3E should address the energy transition issue in the area of sustainable development, by adapting it to the restrictions of this economic model.
With regards to the limitations of this research, firstly, the field of study has focused on the most influential academic databases (WoS and Scopus). Secondly, only articles have been analysed and therefore it would be interesting to open a broader line of research that includes other databases and other types of publications, such as books or conference proceedings.
Author Contributions
The authors contributed equally to this work.
Funding
This research received no external funding.
Conflicts of Interest
The authors declare no conflict of interest.
References
- Roques, F.; Sassi, O.; Hourcade, J.C.; Guivarch, C.; Waisman, H.; Crassous, R. The impact of China and India’s economic growth on energy use and CO2 emissions-integrated modelling of economic-energy-environment scenarios. IOP Conf. Ser. Earth Environ. Sci. 2009, 6, 212003. [Google Scholar] [CrossRef]
- Capros, P. Integrated economy-energy-environment models. In Proceedings of the International Symposium on Electricity, Health and the Environment: Comparative Assessment in Support of Decision Making, Vienna, Austria, 16–19 October 1995. [Google Scholar]
- Liu, D.; Tian, X.; Wu, R.; Wang, L. Study on integrated simulation model of economic, energy and environment safety system under the low-carbon policy in Beijing. Procedia Environ. Sci. 2011, 5, 120–130. [Google Scholar] [CrossRef] [Green Version]
- United Nations. United Nations Millennium Declaration; United Nations: New York, NY, USA, 2000. [Google Scholar]
- United Nations. Sustainable Development Goals Report; United Nations: New York, NY, USA, 2016. [Google Scholar]
- Yi, Q.; Feng, J.; Wu, Y.; Li, W. 3E (energy, environmental, and economy) evaluation and assessment to an innovative dual-gas polygeneration system. Energy 2014, 66, 285–294. [Google Scholar] [CrossRef]
- Uno, K. Economy-energy-environment: The 3E compass model. In Integrated Global Models of Sustainable Development; Onishi, A., Ed.; EOLSS Publishers Co Ltd.: Tokio, Japan, 2009; Volume 2, pp. 131–153. ISBN 978-1-905839-18-6. [Google Scholar]
- Jorgenson, D.W.; Goettle, R.J.; Ho, M.S.; Wilcoxen, P.J. Energy, the environment and US economic growth. In Handbook of Computable General Equilibrium Modeling; Dixon, P., Jorgenson, D., Eds.; Elsevier: Amsterdam, The Netherlands, 2013; Volume 1, pp. 477–552. ISBN 9780444595560. [Google Scholar]
- Nakata, T. Energy-economic models and the environment. Prog. Energy Combust. 2004, 30, 417–475. [Google Scholar] [CrossRef]
- Yanqing, X.; Mingsheng, X. A 3E Model on Energy Consumption, Environment Pollution and Economic Growth—An Empirical Research Based on Panel Data. Energy Procedia 2012, 16, 2011–2018. [Google Scholar] [CrossRef]
- Besstremyannaya, G.; Dasher, R.; Golovan, S. Technological change, energy, environment and economic growth in Japan. In Energy, Environment and Economic Growth in Japan; USAEE Working Paper; Center for Economic and Financial Research (CEFIR): Moscow, Russia, 2018; pp. 18–377. [Google Scholar]
- Zaman, K.; Moemen, M.A.E.; Islam, T. Dynamic linkages between tourism transportation expenditures, carbon dioxide emission, energy consumption and growth factors: Evidence from the transition economies. Curr. Issues Tour. 2017, 20, 1720–1735. [Google Scholar] [CrossRef]
- Ping, J.; Yan, S.; Gu, P.; Wu, Z.; Hu, C. Application of MIKE SHE to study the impact of coal mining on river runoff in Gujiao mining area, Shanxi, China. PLoS ONE 2017, 12, e0188949. [Google Scholar] [CrossRef] [Green Version]
- Dzikuć, M. Problems associated with the low emission limitation in Zielona Góra (Poland): Prospects and challenges. J. Clean. Prod. 2017, 166, 81–87. [Google Scholar] [CrossRef]
- Darko, A.; Chan, A.P.C.; Gyamfi, S.; Olanipekun, A.O.; He, B.J.; Yu, Y. Driving forces for green building technologies adoption in the construction industry: Ghanaian perspective. Build. Environ. 2017, 125, 206–215. [Google Scholar] [CrossRef]
- Bashir, S.; Ahmad, I.; Rashid Ahmad, S. Low-Emission Modeling for Energy Demand in the Household Sector: A Study of Pakistan as a Developing Economy. Sustainability 2018, 10, 3971. [Google Scholar] [CrossRef]
- Campolina, J.M.; Sigrist, C.S.L.; de Paiva, J.M.F.; Nunes, A.O.; da Silva Moris, V.A. A study on the environmental aspects of WEEE plastic recycling in a Brazilian company. Int. J. LCA 2017, 22, 1957–1968. [Google Scholar] [CrossRef]
- Dmitrienko, M.A.; Strizhak, P.A. Environmentally and economically efficient utilization of coal processing waste. Sci. Total Environ. 2017, 598, 21–27. [Google Scholar] [CrossRef]
- Prakash, R.; Bhat, I.K. Energy, economics and environmental impacts of renewable energy systems. Renew. Sustain. Energy Rev. 2009, 13, 2716–2721. [Google Scholar] [CrossRef]
- Grover, S. Energy, Economic, and Environmental Benefits of the Solar America Initiative; Report by the National Renewable Energy Laboratory; National Renewable Energy Laboratory: Golden, CO, USA, 2007. [CrossRef]
- Cavalcanti, C. Conceptions of ecological economics: Its relationship with mainstream and environmental economics. Estudos Avançados 2010, 24, 53–67. [Google Scholar] [CrossRef]
- Gowdy, J.; Erickson, J.D. The approach of ecological economics. Camb. J. Econ. 2007, 29, 207–222. [Google Scholar] [CrossRef]
- Jin, E.; Sutherland, J.W. An integrated sustainability model for a bioenergy system: Forest residues for electricity generation. Biomass Bioenergy 2018, 119, 10–21. [Google Scholar] [CrossRef]
- Beschkov, V. Biogas, Biodiesel and Bioethanol as Multifunctional Renewable Fuels and Raw Materials. In Frontiers in Bioenergy and Biofuels; JacobLopes, E., Zepka, L.Q., Eds.; InTech: Vienna, Austria, 2017; pp. 185–205. [Google Scholar]
- Fajardy, M.; Chiquier, S.; Mac Dowell, N. Investigating the BECCS resource nexus: Delivering sustainable negative emissions. Energy Environ. Sci. 2018, 11, 3408–3430. [Google Scholar] [CrossRef]
- Neves, S.A.; Marques, A.C.; Fuinhas, J.A. Could alternative energy sources in the transport sector decarbonise the economy without compromising economic growth? Environ. Dev. Sustain. 2018, 20, 1–18. [Google Scholar] [CrossRef]
- Yousefi, H.; Roumi, S.; Tabasi, S.; Hamlehdar, M. Economic and air pollution effects of city council legislations on renewable energy utilisation in Tehran. Int. J. Ambient. Energy 2018, 39, 626–631. [Google Scholar] [CrossRef]
- Middleton, P. Sustainable living education: Techniques to help advance the renewable energy transformation. Sol. Energy 2018, 174, 1016–1018. [Google Scholar] [CrossRef]
- Muradin, M.; Joachimiak-Lechman, K.; Foltynowicz, Z. Evaluation of Eco-Efficiency of Two Alternative Agricultural Biogas Plants. Appl. Sci. 2018, 8, 2083. [Google Scholar] [CrossRef]
- Cicea, C.; Marinescu, C.; Popa, I.; Dobrin, C. Environmental efficiency of investments in renewable energy: Comparative analysis at macroeconomic level. Renew. Sustain. Energy Rev. 2014, 30, 555–564. [Google Scholar] [CrossRef]
- Wang, Y.; Xiao, W.; Wang, Y.; Zhao, Y.; Wang, J.; Hou, B.; Song, X.Y.; Zhang, X. Impact of China’s Urbanization on Water Use and Energy Consumption: An Econometric Method and Spatiotemporal Analysis. Water 2018, 10, 1323. [Google Scholar] [CrossRef]
- Andreas, J.J.; Burns, C.; Touza, J. Renewable Energy as a Luxury? A Qualitative Comparative Analysis of the role of the Economy in the EU’s Renewable Energy Transitions during the ‘Double Crisis’. Ecol. Econ. 2017, 142, 81–90. [Google Scholar] [CrossRef]
- Armeanu, D.Ş.; Vintilă, G.; Gherghina, Ş.C. Does renewable energy drive sustainable economic growth? multivariate panel data evidence for EU-28 countries. Energies 2017, 10, 381. [Google Scholar] [CrossRef]
- Goodier, C. Carbon footprint. In Green Cities; Cohen, N., Robbins, P., Eds.; SAGE Publications: London, UK, 2010; pp. 49–53. [Google Scholar]
- Viglia, S.; Civitillo, D.F.; Cacciapuoti, G.; Ulgiati, S. Indicators of environmental loading and sustainability of urban systems. An emergy-based environmental footprint. Ecol. Indic. 2018, 94, 82–99. [Google Scholar] [CrossRef]
- Xiao, X.; Zhu, Z.; Fu, Z.; Mu, W.; Zhang, X. Carbon Footprint Constrained Profit Maximization of Table Grapes Cold Chain. Agronomy 2018, 8, 125. [Google Scholar] [CrossRef]
- Tobarra, M.A.; López, L.A.; Cadarso, M.A.; Gómez, N.; Cazcarro, I. Is Seasonal Households’ Consumption Good for the Nexus Carbon/Water Footprint? The Spanish Fruits and Vegetables Case. Environ. Sci. Technol. 2018, 52, 12066–12077. [Google Scholar] [CrossRef]
- Mahapatra, C.; Moharana, A.K.; Leung, V. Energy management in smart cities based on Internet of Things: Peak demand reduction and energy savings. Sensors 2017, 17, 2812. [Google Scholar] [CrossRef]
- United Nations. Report of the United Nations Conference on the Human Environment; United Nations Publications: New York, NY, USA, 1972. [Google Scholar]
- Millimet, D.L.; Roy, S.; Sengupta, A. Environmental regulations and economic activity: Influence on market structure. Annu. Rev. Resour. Econ. 2009, 1, 99–118. [Google Scholar] [CrossRef]
- Mahmood, F.; Belhouchette, H.; Nasim, W.; Shahzada, T.; Hussain, A.; Therond, O.; Fahad, E.; Refat, S.S.; Wéry, J. Economic and environmental impacts of introducing grain legumes in farming systems of Midi-Pyrenees region (France): A simulation approach. Int. J. Plant. Prod. 2017, 11, 65–88. [Google Scholar]
- Corona, B.; Bozhilova-Kisheva, K.P.; Olsen, S.I.; San Miguel, G. Social life cycle assessment of a concentrated solar power plant in Spain: A methodological proposal. J. Ind. Ecol. 2017, 21, 1566–1577. [Google Scholar] [CrossRef]
- Li, D.; Cao, C.; Zhang, L.; Chen, X.; Ren, S.; Zhao, Y. Effects of corporate environmental responsibility on financial performance: The moderating role of government regulation and organizational slack. J. Clean. Prod. 2017, 166, 1323–1334. [Google Scholar] [CrossRef]
- Ordouei, M.H.; Elkamel, A. New composite sustainability indices for Cradle-to-Cradle process design: Case study on thinner recovery from waste paint in auto industries. J. Clean. Prod. 2017, 166, 253–262. [Google Scholar] [CrossRef]
- Qi, Y.; Zhang, X.; Yang, X.; Lv, Y.; Wu, J.; Lin, L.; Xiao, Y.; Qi, H.; Yu, X.; Zhang, Y. The environmental sustainability evaluation of an urban tap water treatment plant based on emergy. Ecol. Indic. 2018, 94, 28–38. [Google Scholar] [CrossRef]
- Ishak, M.I.S.; Ishak, N.F.A.; Hassan, M.S.; Amran, A.; Jaafar, M.H.; Samsurijan, M.S. The role of multinational companies for world sustainable development agenda. J. Sustain. Sci. Manag. 2017, 12, 228–252. [Google Scholar]
- Marques, A.C.; Fuinhas, J.A.; Pais, D. Economic growth, sustainable development and food consumption: Evidence across different income groups of countries. J. Clean. Prod. 2018, 20, 245–258. [Google Scholar] [CrossRef]
- Wu, Z.; Wang, R.; Xu, S. Strategic choice and practice of low carbon urbanization in China. Model. Meas. Control C 2017, 78, 455–466. [Google Scholar] [CrossRef]
- Archambault, É.; Caruso, J.; Côté, G.; Larivière, V. Bibliometric Analysis of Leading Countries in Energy Research. In Proceedings of the 12th International Conference of the International Society for Scientometrics and Informetrics (ISSI), Rio de Janeiro, Brazil, 14–17 July 2009; pp. 80–91. [Google Scholar]
- Ruiz-Real, J.L.; Uribe-Toril, J.; De Pablo, J.; Gázquez-Abad, J.C. Worldwide Research on Circular Economy and Environment: A Bibliometric Analysis. Int. J. Environ. Res. Public Health 2018, 15, 2699. [Google Scholar] [CrossRef] [PubMed]
- Zheng, T.; Li, P.; Shi, Z.; Liu, J. Benchmarking the scientific research on wastewater-energy nexus by using bibliometric analysis. Environ. Sci. Pollut. Res. Int. 2017, 24, 27613–27630. [Google Scholar] [CrossRef]
- Reuters, T. A Guide to Evaluating Research Performance with Citation Data. Available online: http://ip-science. thomsonreuters. com/m/pdfs/325133_thomson. pdf (accessed on 15 January 2019).
- Pritchard, A. Statistical bibliography or bibliometrics. J. Doc. 1969, 25, 348–349. [Google Scholar]
- Osareh, F. Bibliometrics, citation analysis and co-citation analysis: A review of literature I. Libri 1996, 46, 149–158. [Google Scholar] [CrossRef]
- Hirsch, J.E. An index to quantify an individual’s scientific research output. Proc. Natl. Acad. Sci. USA 2005, 102, 16569–16572. [Google Scholar] [CrossRef] [PubMed]
- Van Eck, N.J.; Waltman, L. Citation-based clustering of publications using CitNetExplorer and VOSviewer. Scientometrics 2017, 111, 1053–1070. [Google Scholar] [CrossRef] [Green Version]
- Perianes-Rodriguez, A.; Waltman, L.; Van Eck, N. Constructing bibliometric networks: A comparison between full and fractional counting. J. Informetr. 2016, 10, 1178–1195. [Google Scholar] [CrossRef] [Green Version]
- Waltman, L.; Van Eck, N.J. A new methodology for constructing a publication-level classification system of science. J. Assoc. Inf. Sci. Technol. 2012, 63, 2378–2392. [Google Scholar] [CrossRef] [Green Version]
- Orduña-Malea, E.; Ayllón, J.M.; Martín-Martín, A.; López-Cózar, E.D. Methods for estimating the size of Google Scholar. Scientometrics 2015, 104, 931–949. [Google Scholar] [CrossRef] [Green Version]
- Ede, P.N.; Johnson, G.A. Energy relations of gas estimated from flare radiation in Nigeria. Int. J. Energy Res. 2001, 25, 85–91. [Google Scholar] [CrossRef]
- Mendis, P. Food Security, Agricultural Subsidies, Energy, and the Environment: A Process of ‘Glocalization’ in Sri Lanka. Energy Environ. 2001, 12, 55–71. [Google Scholar] [CrossRef]
- Bashyam, R.; Zelenay, P. A class of non-precious metal composite catalysts for fuel cells. In Materials for Sustainable Energy: A Collection of Peer-Reviewed Research and Review Articles from Nature Publishing Group; Dusastre, V., Ed.; Nature Publishing Group: London, UK, 2011; pp. 247–250. ISBN 978-981-4317-66-5. [Google Scholar]
Figure 1.
Bibliometric analysis steps followed.

Figure 2.
Evolution in number of articles.

Figure 3.
Average number of articles on WOS vs Scopus.

Figure 4.
Evolution of total cites.

Figure 5.
Evolution of keywords from 2001 to 2009.

Figure 6.
Evolution of keywords from 2010 to 2018.

Figure 7.
Keyword analysis from 2001 to 2018.

Figure 8.
Keywords of sustaniable development from 2001 to 2018.


Table 1.
Distribution of publications by type of document.
| Type of Document | WoS | Scopus |
|---|---|---|
| Article | 2230 | 3149 |
| Proceedings Paper | 1462 | 1894 |
| Review | 268 | 437 |
| Book and Book Chapter | 110 | 518 |
Table 2.
Annual distribution of the publication of Economy, Energy, and Environment (3E) scientific articles.
Table 2.
Annual distribution of the publication of Economy, Energy, and Environment (3E) scientific articles.
| WOS | SCOPUS | |||||||
|---|---|---|---|---|---|---|---|---|
| Year | Articles | H-Index | Citations | TC/Art | Articles | H-Index | Citations | TC/Art |
| 2018 | 356 | 9 | 553 | 1.55 | 401 | 11 | 687 | 1.71 |
| 2017 | 327 | 16 | 1366 | 4.18 | 387 | 17 | 1767 | 4.57 |
| 2016 | 227 | 20 | 2179 | 9.60 | 269 | 20 | 1868 | 6.94 |
| 2015 | 187 | 20 | 2480 | 13.26 | 277 | 24 | 2656 | 9.59 |
| 2014 | 166 | 26 | 2220 | 13.37 | 279 | 28 | 3254 | 11.66 |
| 2013 | 147 | 24 | 2195 | 14.93 | 195 | 28 | 3289 | 16.87 |
| 2012 | 125 | 24 | 1971 | 15.77 | 203 | 29 | 3260 | 16.06 |
| 2011 | 121 | 27 | 2502 | 20.68 | 185 | 30 | 4665 | 25.22 |
| 2010 | 121 | 32 | 3134 | 25.90 | 177 | 35 | 4047 | 22.86 |
| 2009 | 108 | 25 | 2656 | 24.59 | 165 | 31 | 4673 | 28.32 |
| 2008 | 69 | 23 | 2033 | 29.46 | 120 | 29 | 3376 | 28.13 |
| 2007 | 65 | 25 | 2145 | 33.00 | 99 | 24 | 2329 | 23.53 |
| 2006 | 57 | 21 | 2564 | 44.98 | 79 | 21 | 2939 | 37.20 |
| 2005 | 42 | 16 | 1170 | 27.86 | 68 | 16 | 1217 | 17.90 |
| 2004 | 23 | 13 | 792 | 34.43 | 48 | 14 | 906 | 18.88 |
| 2003 | 35 | 18 | 1238 | 35.37 | 68 | 23 | 2567 | 37.75 |
| 2002 | 24 | 15 | 1959 | 81.63 | 49 | 21 | 2424 | 49.47 |
| 2001 | 20 | 9 | 343 | 17.15 | 63 | 14 | 1433 | 22.75 |
TC/Art: Total Citations/Article.
Table 3.
Distribution of articles per country.
| WOS | SCOPUS | ||||||||
|---|---|---|---|---|---|---|---|---|---|
| Country | Articles | H-Index | Citations | TC/Art. | Country | Articles | H-Index | Citations | TC/Art. |
| China | 582 | 43 | 7191 | 12.36 | China | 933 | 49 | 9472 | 10.15 |
| USA | 365 | 51 | 11538 | 31.61 | USA | 471 | 57 | 15599 | 33.12 |
| UK | 202 | 34 | 4789 | 23.71 | UK | 205 | 34 | 7252 | 35.38 |
| Italy | 98 | 17 | 1174 | 11.98 | India | 132 | 19 | 1218 | 9.23 |
| Germany | 92 | 24 | 2802 | 30.46 | Germany | 128 | 26 | 2156 | 16.84 |
| Canada | 89 | 18 | 1477 | 16.60 | Italy | 115 | 22 | 1904 | 16.56 |
| Australia | 85 | 23 | 2469 | 29.05 | Australia | 101 | 27 | 3734 | 36.97 |
| India | 83 | 14 | 662 | 7.98 | Canada | 99 | 19 | 2804 | 28.32 |
| Japan | 74 | 19 | 2588 | 34.97 | Japan | 90 | 17 | 1211 | 13.46 |
| Turkey | 72 | 13 | 954 | 13.25 | Turkey | 74 | 19 | 2259 | 30.53 |
| Spain | 66 | 15 | 1595 | 24.17 | Spain | 73 | 19 | 1560 | 21.37 |
| France | 61 | 20 | 2646 | 43.38 | France | 65 | 18 | 1370 | 21.08 |
| Netherlands | 57 | 21 | 2291 | 40.19 | Rusia | 61 | 6 | 143 | 2.34 |
TC/Art: Total Citations/Article.
Table 4.
Distribution by language.
| WoS | SCOPUS | ||
|---|---|---|---|
| Languages | Articles | Languages | Articles |
| English | 2083 | English | 2640 |
| Russian | 33 | Chinese | 311 |
| Spanish | 23 | German | 38 |
| Portuguese | 19 | Russian | 26 |
| German | 15 | Spanish | 24 |
| Chinese | 3 | Portuguese | 10 |
Table 5.
Distribution of articles by author (Web of Science (WoS)/Scopus).
| Author | ID | Ranking (W/S) | Articles (W/S) | H-Index (W/S) | Citations (W/S) | TC/A (W/S) |
|---|---|---|---|---|---|---|
| Barker, T. | 7103052504 | 1/1 | 13/10 | 9/8 | 375/465 | 28.85/46.5 |
| Chen, B. | 55503929500 | 2/3 | 11/8 | 8/5 | 363/200 | 33/27.25 |
| Zhang, Y. | 57203830670 | 3/- | 11/- | 6/- | 173/- | 15.73/- |
| Ulgiati, S. | 6701799759 | -/2 | -/10 | -/7 | -/200 | -/20 |
| Wang, L. | NA | 4/- | 10/- | 5/- | 143/- | 14.30/- |
| Lin, BQ. | 35098935000 | 5/4 | 9/8 | 4/6 | 151/178 | 16.78/30.14 |
| Zhang, J. | 57193255205 | 6/- | 9/- | 4/- | 95/- | 10.56/- |
| Liu, Y. | 57200105972 | 7/- | 9/- | 4/- | 82/- | 9.11/- |
| Chen, GQ. | 7406541589 | 8/- | 8/- | 7/- | 351/- | 43.88/- |
| Huang, GH. | 55489745300 | 9/- | 8/- | 6/- | 193/- | 24.13/- |
| Yang, L. | 57203351492 | 10/- | 8/- | 6/- | 133/- | 16.63/- |
| Zhu, L. | 56701286100 | 11/- | 8/- | 6/- | 95/- | 11.88/- |
| Song, ML. | NA | 12/- | 8/- | 4/- | 75/- | 9.38/- |
| Fan, Y. | 7403491920 | -/5 | -/7 | -/6 | -/211 | -/30.14 |
| Yuan, X. | 15066382000 | -/6 | -/7 | -/5 | -/75 | -/10.71 |
| Antunes, C.H. | 57191244701 | -/7 | -/6 | -/6 | -/113 | -/18.83 |
| Krausmann, F. | 6602183651 | -/8 | -/6 | -/6 | -/412 | -/68.67 |
| Lutz, C. | 7103325863 | -/9 | -/6 | -/5 | -/108 | -/18 |
| Pollitt, H. | 22954406100 | -/10 | -/6 | -/5 | -/134 | -/22.33 |
| Zuo, J. | 23020460400 | -/11 | -/6 | -/4 | -/70 | -/11.67 |
| Edenhofer, E. | 55868364000 | -/12 | -/5 | -/5 | -/430 | -/86 |
ID: Identification author number on Scopus database; W/S: WoS/Scopus values; TC/Art: Total Citations/Article.
Table 6.
Distribution of articles by journal (WoS/Scopus).
| Journal | Ranking (W/S) | Articles (W/S) | H-Index (W/S) | Citations (W/S) | TC/A (W/S) |
|---|---|---|---|---|---|
| Energy Policy | 1/1 | 116/124 | 36/38 | 4128/4681 | 35.58/37.75 |
| Journal of Cleaner Production | 2/2 | 107/87 | 18/19 | 1252/1323 | 11.70/15.21 |
| Sustainability | 3/4 | 60/56 | 8/8 | 219/276 | 3.65/4.93 |
| Energy | 4/3 | 51/63 | 17/23 | 1243/1654 | 24.37/26.25 |
| Applied Energy | 5/5 | 44/45 | 18/20 | 1361/1840 | 30.93/40.89 |
| Shengtai Xuebao Acta Ecologica Sinica | -/6 | -/43 | -/5 | -/96 | 2.23 |
| Ecological Economics | 6/- | 29/- | 15/- | 1139/- | 39.27/- |
| Resources conservation and recycling | 8/7 | 28/31 | 10/12 | 311/437 | 11.10/14.10 |
| Nongye Gongcheng Xuebao Transactions of the Chinese Society of Agricultural Engineering | -/8 | -/28 | -/7 | -/204 | -/7.29 |
| Energies | 7/9 | 28/26 | 6/6 | 114/111 | 4.07/4.27 |
| International Journal of Hydrogen Energy | 9/- | 27/- | 12/- | 938/- | 34.74/- |
| Ecological Indicators | 10/- | 24/- | 11/- | 342/- | 14.25/- |
| Energy Economics | -/10 | -/26 | -/14 | -/792 | -/30.46 |
W/S: WOS/Scopus values.
Table 7.
Distribution of articles by knowledge areas.
| WOS | SCOPUS | |||||||
|---|---|---|---|---|---|---|---|---|
| Subject Area | Articles | H-Index | Citations | TC/A | Articles | H-Index | Citations | TC/A |
| Environmental Sciences | 620 | 52 | 10779 | 17.4 | 1300 | 67 | 21212 | 16.32 |
| Engineering, Chemical | 452 | 42 | 7400 | 16.4 | 1076 | 54 | 12413 | 11.54 |
| Energy Fuels | 483 | 55 | 11417 | 23.6 | 966 | 63 | 17199 | 17.80 |
| Business Economics | 345 | 48 | 7762 | 22.5 | 519 | 45 | 7770 | 14.97 |
| Science Technology | 299 | 25 | 3203 | 10.7 | 296 | 27 | 2951 | 9.97 |
| Computer Science | 54 | 14 | 705 | 13.1 | 178 | 25 | 2495 | 14.02 |
| Social Science | 98 | 15 | 736 | 7.51 | 608 | 34 | 5995 | 9.86 |
| Agriculture | 32 | 10 | 224 | 7 | 309 | 27 | 2834 | 9.17 |
TC/Art: Total Citations/Article.
Table 8.
Distribution of articles by institution (WOS/Scopus).
| Institution | Ranking (W/S) | Articles (W/S) | H-Index (W/S) | Citations (W/S) | TC/A (W/S) |
|---|---|---|---|---|---|
| Chinese Academy of Science | 1/1 | 76/113 | 20/21 | 1412/1614 | 18.58/14.28 |
| Tsinghua University | 2/2 | 44/61 | 17/18 | 850/1064 | 19.32/17.44 |
| North China Electric Power University | 3/3 | 40/46 | 12/12 | 542/522 | 13.55/11.34 |
| Beijing Normal University | 4/5 | 31/35 | 13/11 | 568/567 | 18.32/16.2 |
| Peking University | 5/8 | 27/22 | 13/12 | 654/488 | 24.22/22.18 |
| University of Cambridge | 6/6 | 27/29 | 14/17 | 828/1432 | 30.67/49.38 |
| U.S. Department of Energy | 7/- | 26/- | 14/- | 3509/- | 134.96/- |
| University of London | 8/- | 25/- | 10/- | 330/- | 13.2/- |
| University of Chinese Academy of Science | 9/4 | 24/36 | 10/8 | 433/355 | 18.04/9.86 |
| Ministry of Education China | -/7 | -/23 | -/8 | -/392 | -/17.04 |
| University of California System | 10/- | 21/- | 15/- | 1840/- | 87.62/- |
| Zheijang University | -/9 | -/21 | -/8 | -/243 | -/11.57 |
| Beijing Institute of Technology | -/10 | -/21 | -/5 | 169 | -/8.05 |
W/S: WoS/Scopus values; TC/Art: Total Citations/Article.
© 2019 by the authors. Licensee MDPI, Basel, Switzerland. This article is an open access article distributed under the terms and conditions of the Creative Commons Attribution (CC BY) license (http://creativecommons.org/licenses/by/4.0/).
Share and Cite
MDPI and ACS Style
Uribe-Toril, J.; Ruiz-Real, J.L.; Milán-García, J.; de Pablo Valenciano, J. Energy, Economy, and Environment: A Worldwide Research Update. Energies 2019, 12, 1120. https://doi.org/10.3390/en12061120
AMA Style
Uribe-Toril J, Ruiz-Real JL, Milán-García J, de Pablo Valenciano J. Energy, Economy, and Environment: A Worldwide Research Update. Energies. 2019; 12(6):1120. https://doi.org/10.3390/en12061120
Chicago/Turabian StyleUribe-Toril, Juan, José Luis Ruiz-Real, Juan Milán-García, and Jaime de Pablo Valenciano. 2019. "Energy, Economy, and Environment: A Worldwide Research Update" Energies 12, no. 6: 1120. https://doi.org/10.3390/en12061120
Note that from the first issue of 2016, this journal uses article numbers instead of page numbers. See further details here.