A Comparative Analysis of Sunshine Duration Effects in terms of Renewable Energy Production Rates on The LEED BD + C Projects in Turkey


Civil Engineering Department, Akdeniz University, Dumlupinar Boulevard, 07058 Campus Antalya, Turkey
*
Author to whom correspondence should be addressed.
Energies 2019, 12(6), 1116; https://doi.org/10.3390/en12061116
Submission received: 12 February 2019
/
Revised: 12 March 2019
/
Accepted: 19 March 2019
/
Published: 22 March 2019
(This article belongs to the Special Issue Sustainable Use of Energy in Buildings)
Abstract
:Global warming has been on the agenda over the past few years. Solutions to global warming and energy efficiency problems have brought with them the need for green building market. Leadership in Energy and Environmental Design (LEED) is a certification system regulating the compliance of green buildings to certain standards and is essential for construction projects focusing on sustainability and innovation. This study investigates the effects of sunshine duration on construction projects reducing annual electricity consumption and increasing renewable energy production. In this study, the effects of sunshine duration times on construction projects are located in different cities in Turkey which has gained point from LEED BD+C (NC) (LEED, Building Design + Construction: New Construction) certificate were analyzed with the help of getting the impact of annual electricity consumption and renewable energy production rates. It was our aim that the results will be used for construction projects in compliance with the “Energy and Atmosphere” category of the LEED BD+C certification system.
1. Introduction
The increased consumption of natural resources in recent years has called for renewable energy sources. Due to the rapid development of human civilization and expansion of the global economy, fossil fuel energy is going to be exhausted [1]. Besides, the consumption of natural resources is expected to increase gradually in the coming years. According to IEA (International Energy Agency) (2018), the share of renewable resources in total primary energy will reach 15,91 Mtoe (Million tonnes of oil equivalent) between 2017 and 2025, and electricity consumption will be the highest with 44,94 Mtoe. According to IEA preliminary estimates, global energy demand grew by 2.1% in 2017, which is twice the growth rate in 2016 [2].
The widespread use of electricity and burning of natural fuels have increased the earth’s temperature 1 °C over the last century [3]. It is widely accepted that fossil fuel consumption leads to high rates of carbon emissions, resulting in global warming [4]. According to IPCC (Intergovernmental Panel on Climate Change), global warming should be kept at 1.5 °C levels [5]. Table 1 shows the causes and consequences of global warming.
The share of the construction sector in the global economy stands at 15%, while it is about 9% in Turkey. It is, however, expected to be 10% and 17% in developed and developing countries, respectively until 2025 [7]. Many studies focus on the reduction of energy consumption and carbon emissions in buildings, which is one of the primary causes of global warming [8,9,10,11,12,13].
In recent years, energy saving methods in buildings have drawn significant attention for the prevention of global warming. The use of renewable energy sources in buildings is promoted across The European Union by support schemes applied to achieve sustainability, security of supply and improved competitiveness [14]. BP (British Petrol) Statistical Review of World Energy 2018 shows that the electricity demand increased by 6% and carbon emissions by 12.7% in 2017 in Turkey [15].
The study investigated the correlation between sunshine duration and renewable energy production in three LEED BD + C (NC) certified construction projects in which PV panels are used for renewable energy production. The results aim to encourage construction firms to use photovoltaic panels to reduce carbon emissions in buildings.
2. Literature Review
2.1. LEED BD + C Certification System
Recently, such concepts as green building and passive house have emerged, focusing on reducing energy consumption and carbon emissions in buildings. There are also some standards used to verify such buildings’ sustainability and energy saving and carbon reduction efficiency. Countries have developed rating systems to determine the level of green achievement. The main objective of these certification systems is to bring certain standards to the green building sector. LEED (Leadership in Energy and Environmental Design) is the most popular rating system. It is a framework that enables building owners and operators to identify and implement practical and measurable green building designs, constructions, and operations and maintenance solutions [16]. The LEED green building rating system rates designs based on sustainability, energy savings, and improvements in indoor environment quality [17].
A subcredit of the LEED BD+C certification system, referred to as New Construction, is mostly used to rate the construction projects in Turkey. There were 223 LEED certified projects in Turkey in 2017, 116 of which were certified under the category of LEED BD + C (New Construction). In other words, 52% of LEED certified projects applied for the New Construction category in Turkey [18].
2.2. Renewable Energy Generation in Turkey
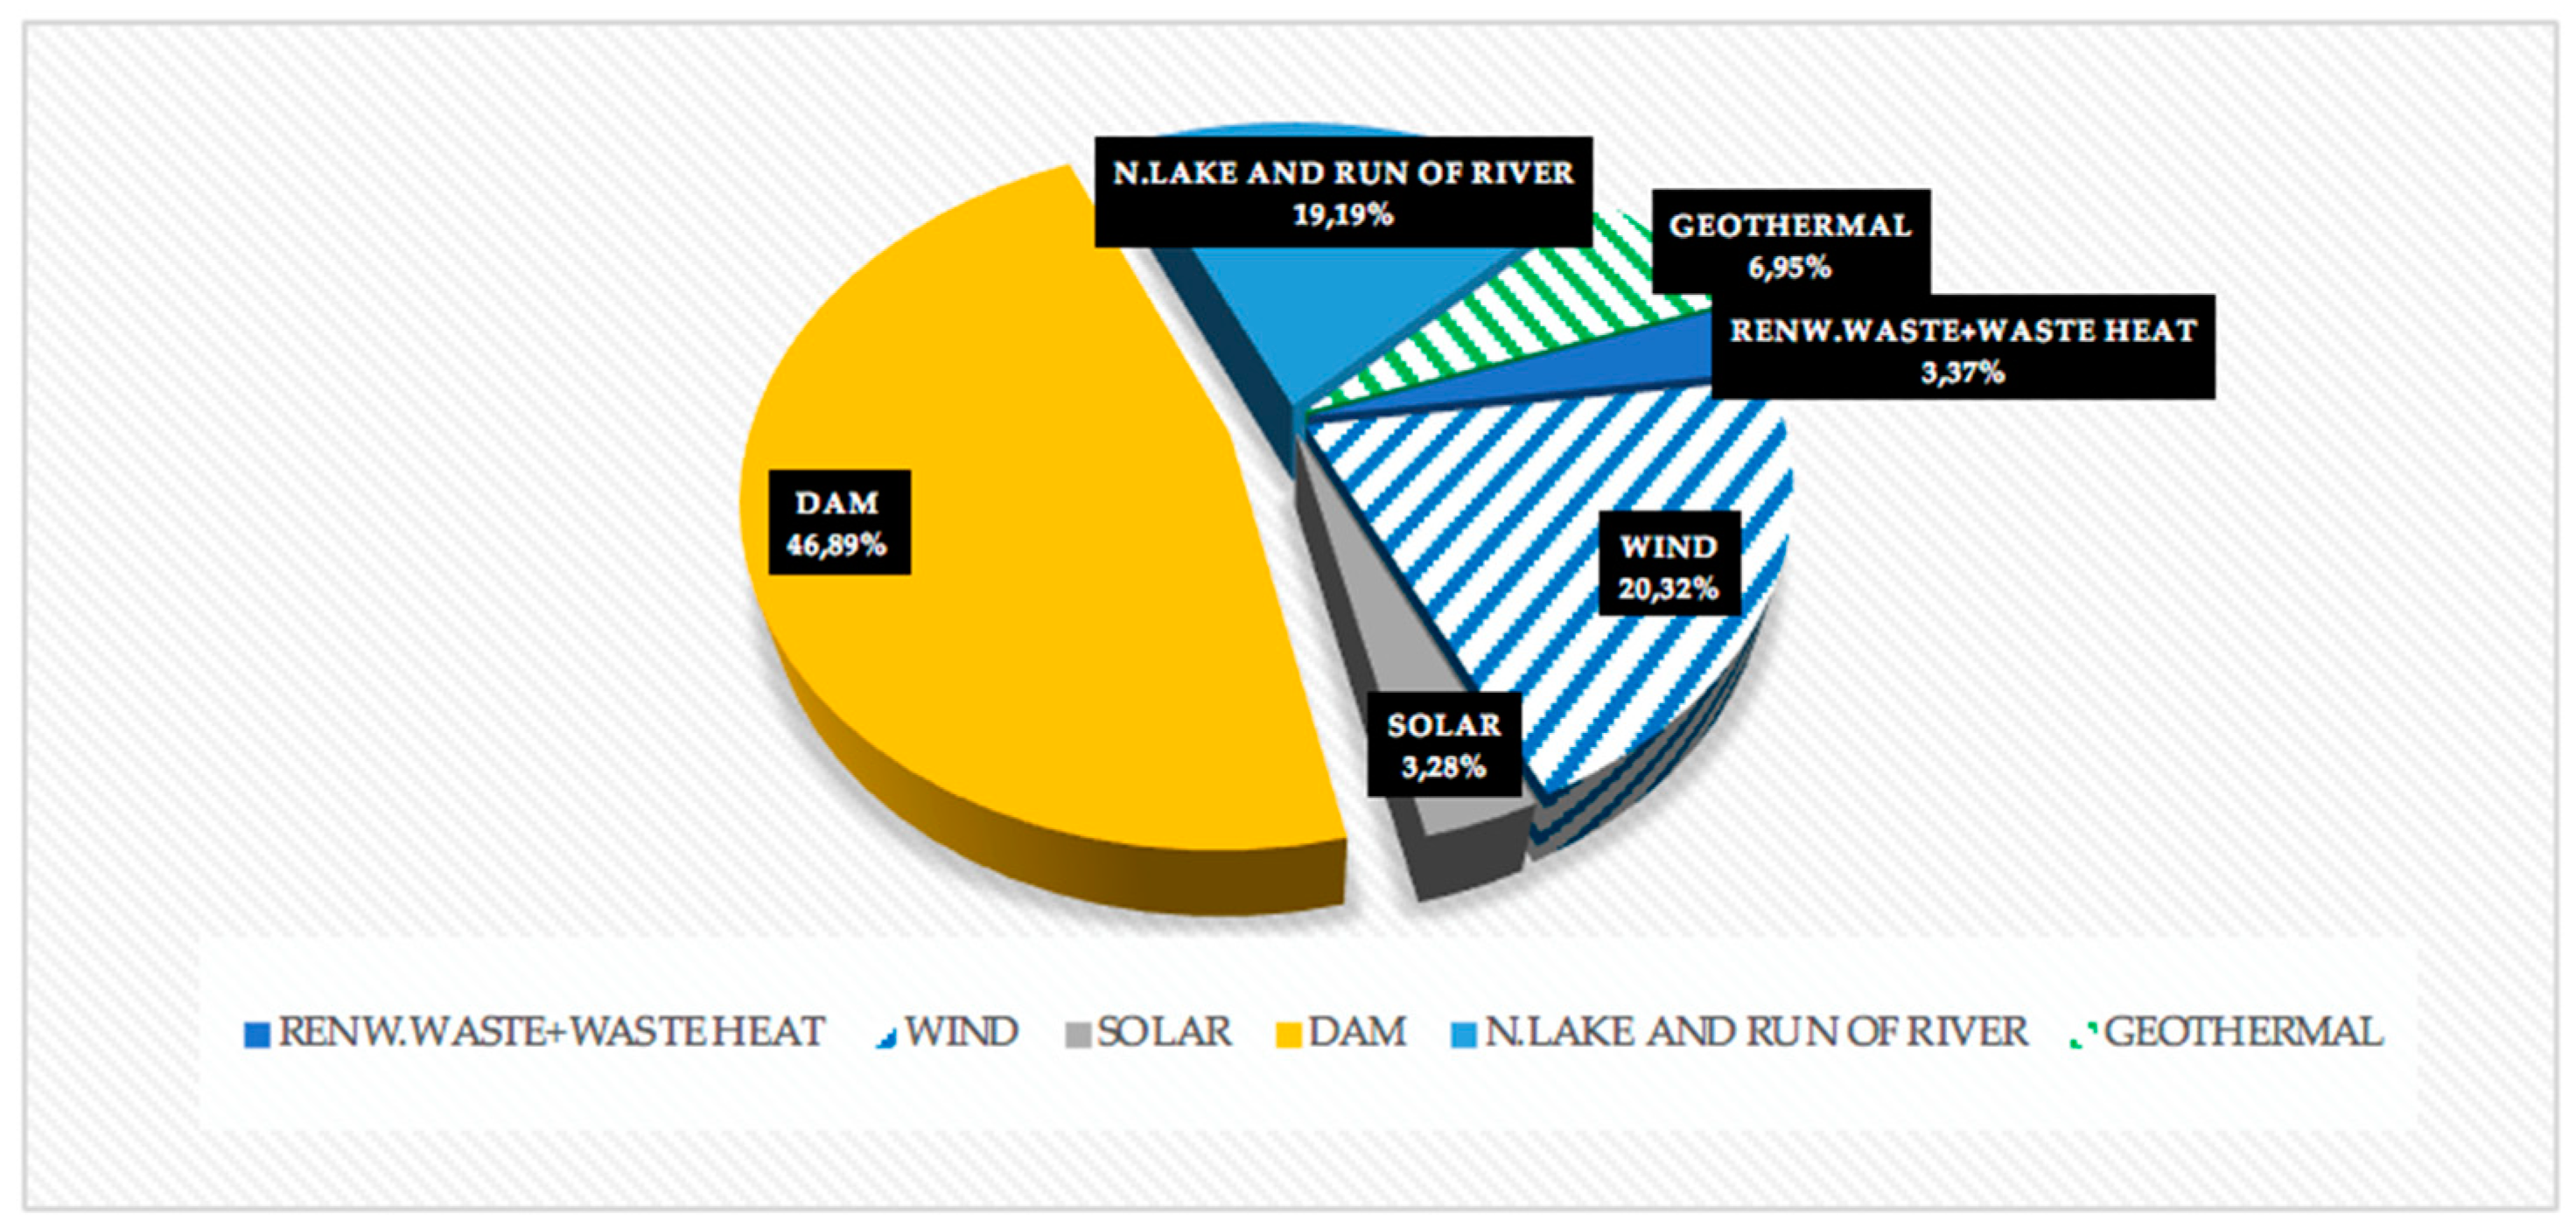
Solar energy accounts for 3.28 percent of total electricity in Turkey (Figure 1). According to the Turkish Electricity Transmission Corporation data (2018), the total energy produced by PV panels is 4.726 MW [19]. Table 2 shows the energy production by renewable resources in Turkey.
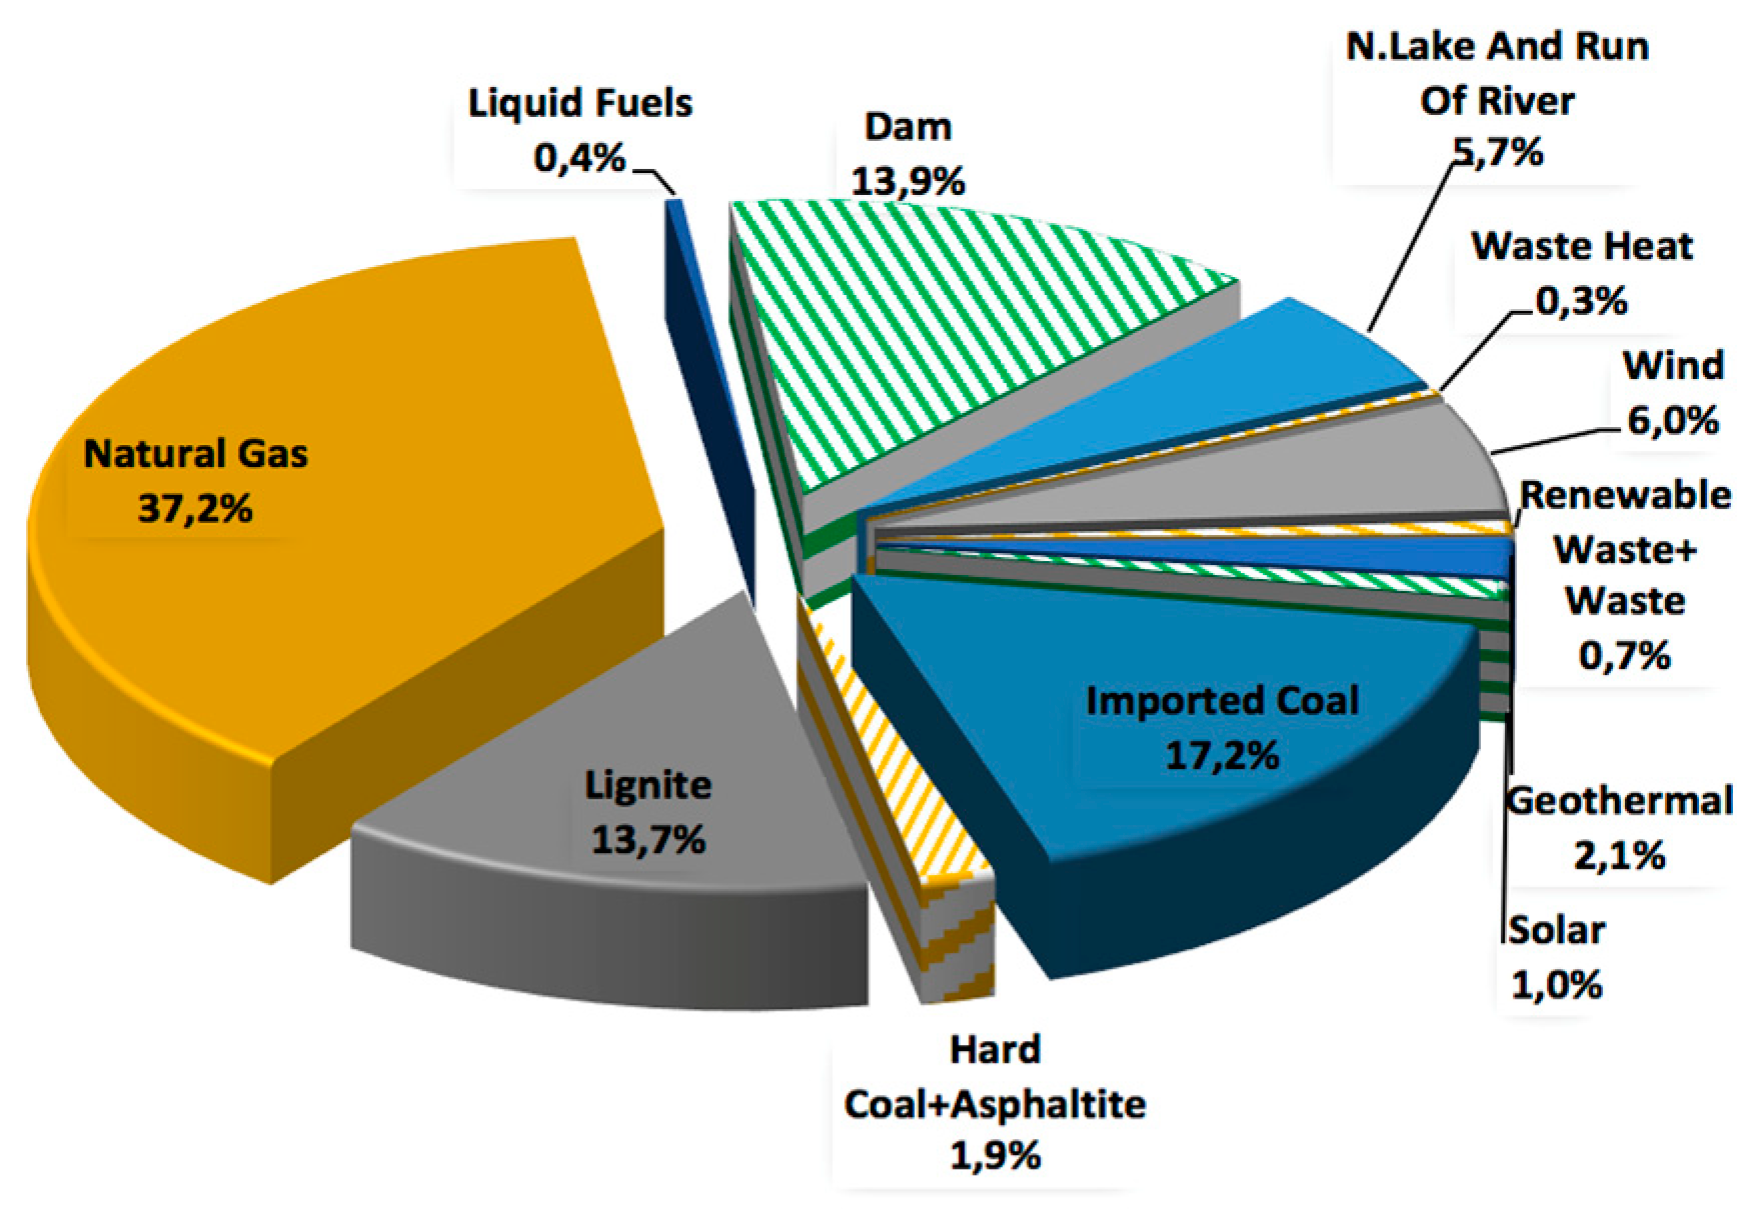
According to the Greenhouse Gas National Inventory (2008), the housing sector in Turkey accounts for 16% of national CO2 (Carbon Dioxide) emissions (270 million tons) and 18% (48 million tons) of the energy sector. It is, therefore, of great importance to take into account building structures and exploit renewable energy systems to reduce energy consumption and improve thermal comfort [20]. Solar energy is abundant and clean; therefore, conventional energy systems should be replaced with solar power systems in buildings [21]. Solar power generation accounts for only 1% of all power generation in Turkey in 2017 (Figure 2). Table 3 shows power generation by energy sources in 2017 in Turkey.
Photovoltaic (PV) systems have attracted significant attention in recent years. Turkey has long hours of sunshine and is, therefore, very suitable to use of solar power systems to generate electricity from PV panels. In Turkey, the maximum daily sunshine duration is 10.96 hours in July and the average daily sunshine duration is 7.5 hours. Moreover, the total installed capacity of the PV power plant was 4,726 MW (Megawatt) in June 2018 [22].
2.3. Photovoltaic Panels
Electricity demand will increase by about 2.6% with the most likely level of global warming arriving at 1.9 °C [23]. PV systems provide a reliable power supply in buildings with or without an electrical grid [24]. A photovoltaic power generation system consists of multiple components such as cells, mechanical and electrical connections, and mountings and means of regulating and/or modifying the electrical output. A PV system is rated in peak kilowatts (kWp), referring to the amount of power that it is expected to generate when the sun is directly overhead on a clear day [25]. Singh (2013) also suggested that the weather conditions affect the power generation of PV panels [26]. The main objective of this study is to compare the renewable energy production rates of LEED BD + C certified projects in terms of sunshine durations of cities in three climatic zones of Turkey. Three LEED BD + C (NC) certified projects were selected to understand and analyze the relationship between sunshine duration and renewable power generation by PV panels.
3. Methodology
Three LEED BD + C (NC) certified projects from three cities in different climatic zones of Turkey were examined in terms of the relationship between sunshine duration and renewable energy production. General information about the projects were presented. Then, the annual hours of sunshine in the cities were determined and presented in Graph. The sunshine duration data of the cities were obtained from the General Directorate of Energy Affairs of Turkey. Afterwards, the amount of electricity consumed and generated by PV panels was determined through interviews with firms. Renewable energy production rates were calculated and presented as follows:
EP: The electricity produced (kW-Kilowatt)
EG: The electricity generated (kW-Kilowatt)
One criterion for the selection of the projects was electricity production from PV panels. The general information about these projects are given below:
Project 1, which is in the city of Gaziantep, is the first passive house project in Turkey. The building is approximately 325 m2 [27]. There are photovoltaic panels in the garden of the building to meet the energy demand. Project 2, which is in the city of Konya, is a 40.312 meter square project in which a 100 kW installed photovoltaic system is used to generate power. Project 3, which is in the city of Istanbul, is a 400 m2 project in which 36 photovoltaic panels have been placed on the roof of a building to generate 27% of the electricity used in the building. Each panel has 200 watts of power. The data on the amount of energy produced annually by PV panels in Projects 1 and 3 was obtained. The data on the amount of energy consumed and produced annually (between May 2017 and April 2018) by PV panels in Project 2 were obtained from the Unilever company by personal interview. The data were compared with those reported by previous studies.
4. Results and Discussion
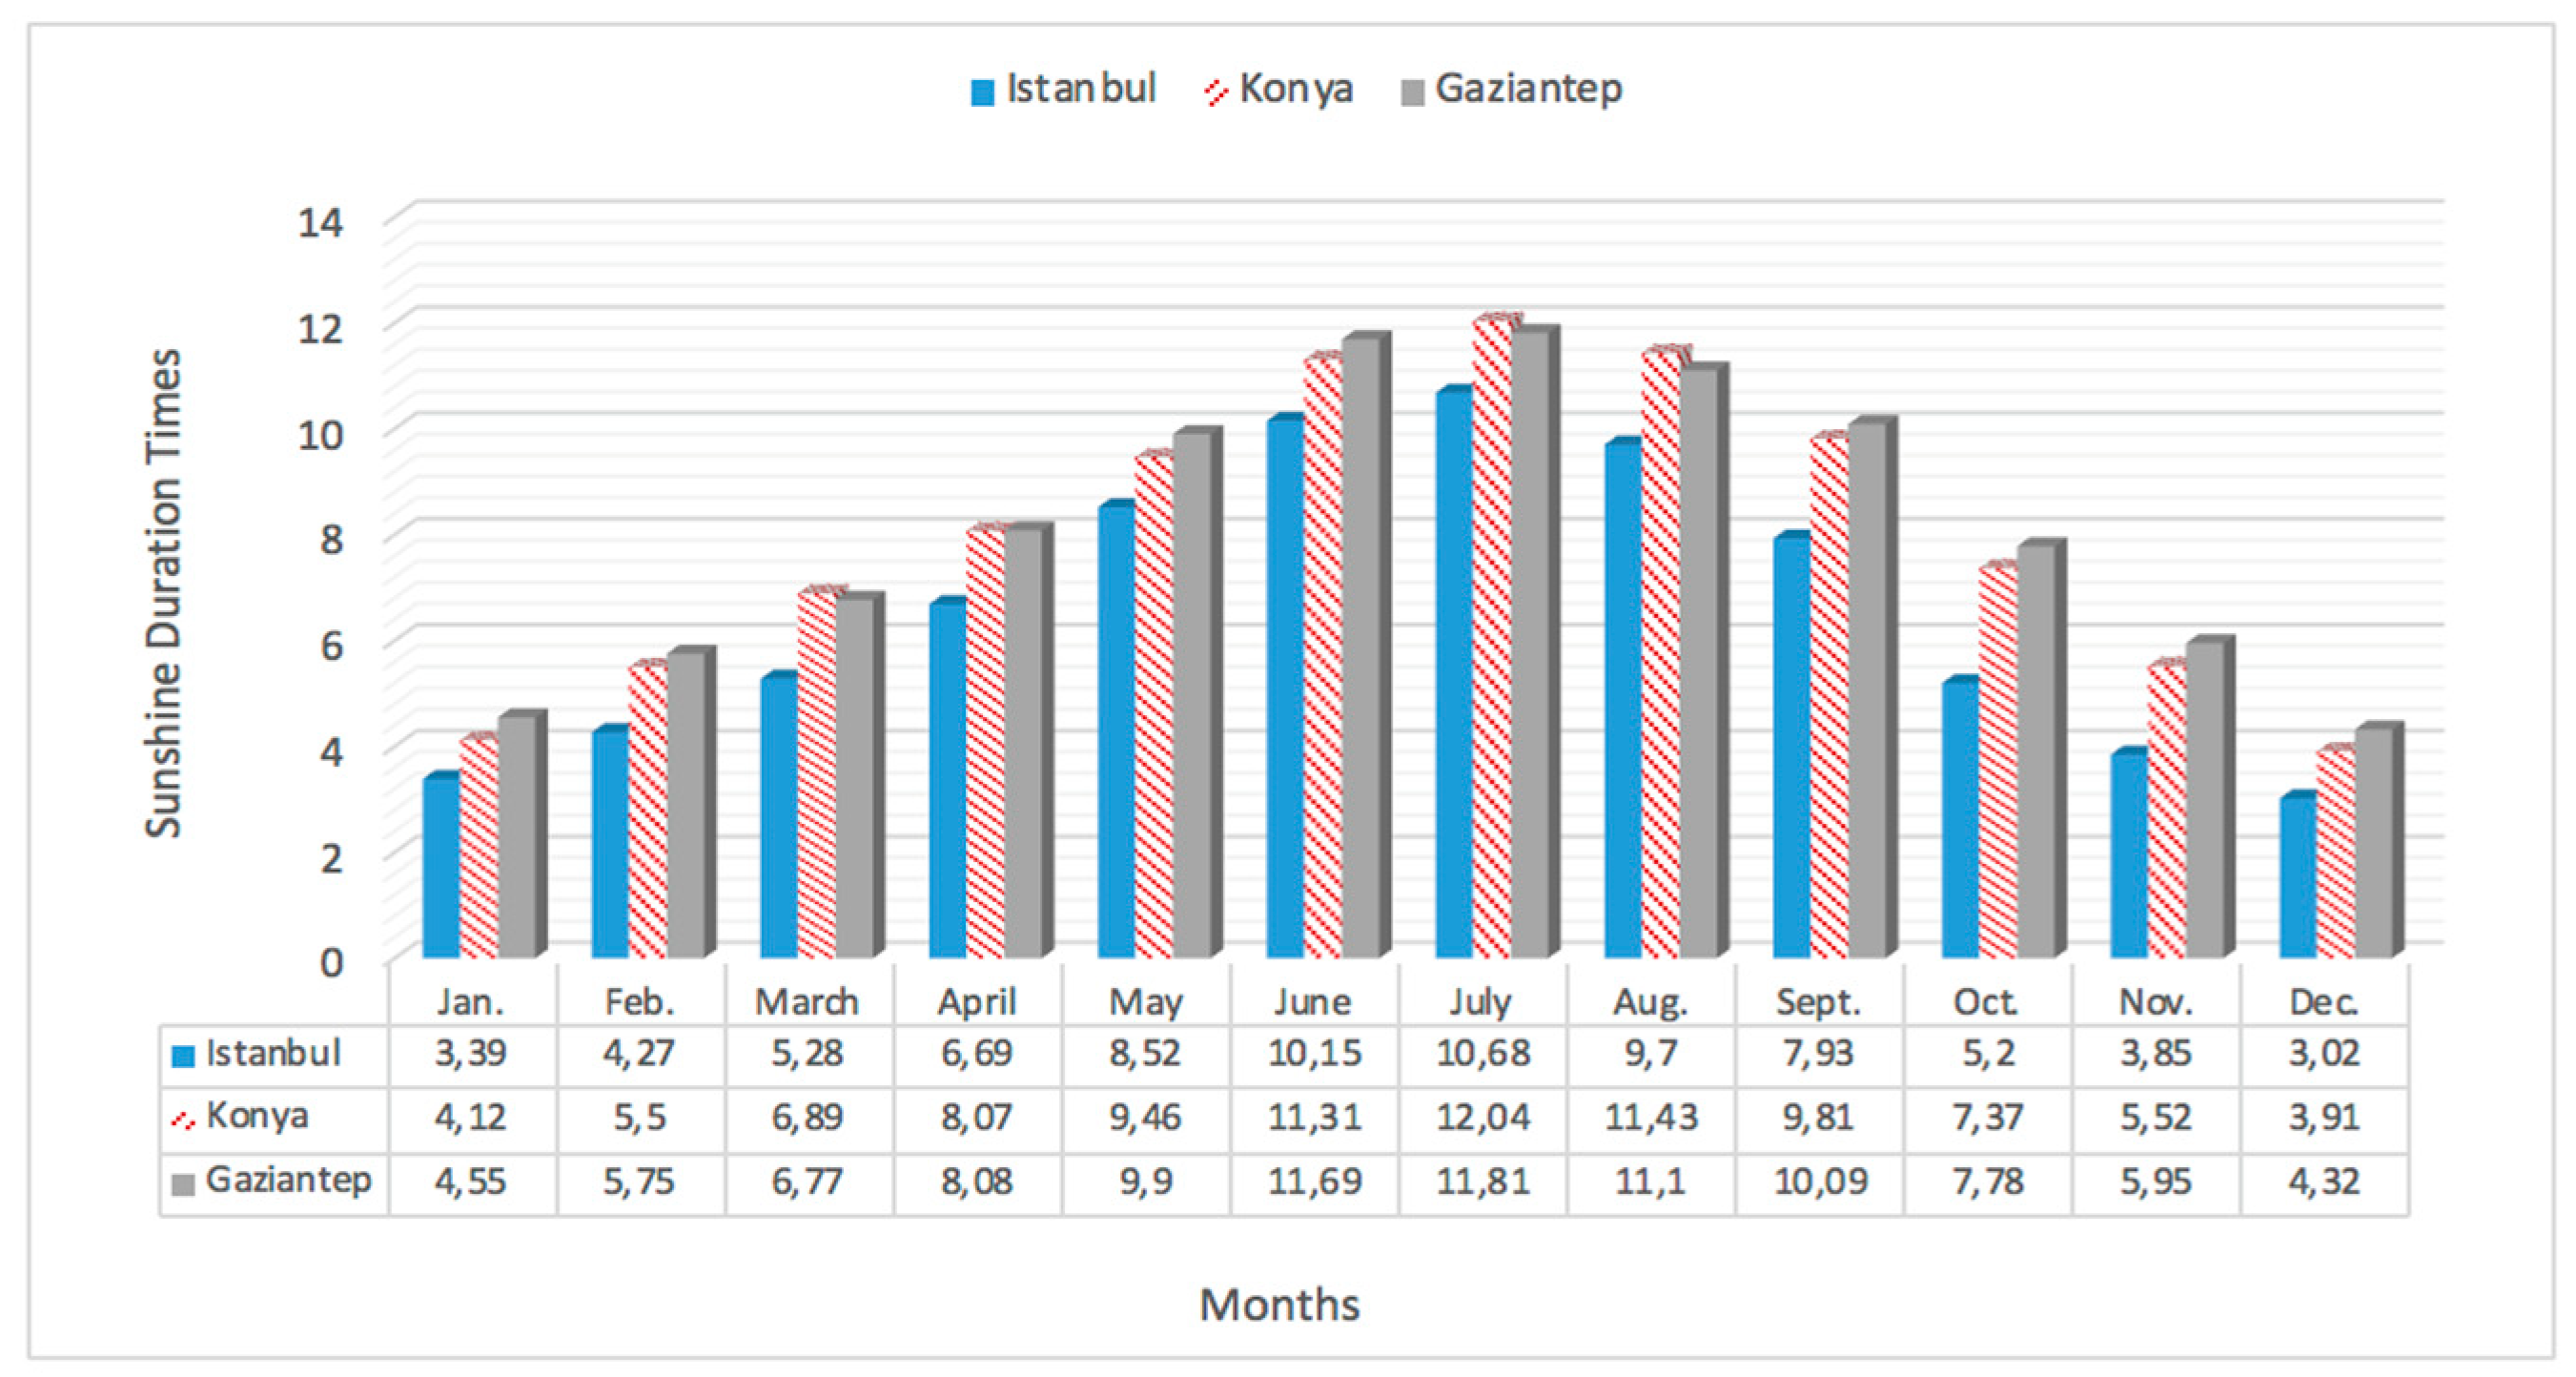
Table 4 and Figure 3 show the monthly variation in temperature and annual sunshine duration, respectively.
The cities have the most and fewest hours of sunshine in summer and winter months, respectively. July and December have the longest and shortest sunshine duration, respectively. Table 5 shows the effect of sunshine duration on electricity production and consumption.
The PV panels in the Gaziantep Green House Project produce and consume the highest amount of energy in June (3.584,00 kW) and December (2.700,00 kW), respectively. The highest ratio of energy production to consumption is in May (330.21%).
Gaziantep is in the southeast of Turkey. It is sunnier in winter and hotter in summer in Gaziantep than in Konya and Istanbul. The minimum electricity consumption in Gaziantep is in spring due to reduced heating demand and longer use of daylight. However, electricity consumption is high in summer due to an increase in air conditioning use.
Table 6 shows the amount of energy consumed and produced monthly by the PV panels in Konya Unilever Vector Admin Building.
The PV panels in the Konya Unilever Vector Admin Building Project consume the highest and produce the lowest amount of energy in winter months. They generate the highest amount of energy in July (15.200,00 kW). The highest ratio of energy production to consumption is in June (131.38).
The minimum electricity consumption in Konya is in spring and autumn due to reduced heating demand as well. The PV panels in the Konya Unilever Vector Admin Building Project generate a higher amount of energy than those in the Gaziantep Green House Project. It is cooler in Konya in summer evenings than in Gaziantep, resulting in a reduction in cooling demand in buildings.
Table 7 shows the amount of energy consumed and produced monthly by the PV panels in the Istanbul Erke Green Academy Building Project. Also, it is shown in Table 7 that the maximum electricity production/consumption value was gained in June. However, the renewable energy production rate was 13.66% in June. Of the three cities, Istanbul has the fewest hours of sunshine. Therefore, the PV panels in the Istanbul Erke Green Academy Building Project generate a higher amount of energy than those in the other two projects in winter due to an increase in lighting need in the building. The amount of energy generated in winter decreases due to a reduction in the number of hours of sunshine.
The three cities have the most and fewest hours of sunshine in summer and winter, respectively, and the average number of hours of sunshine over the year is 3.75. Almorox and Hontoria (2004) reported that global solar radiation correlations perform better in summer months [30]. Wang et. al. reported that the ratio of rural to urban dimming generally increases from 0.39 to 0.87 [31]. Hao et. al. (2007) also stated that solar radiation correlations perform better in summer and autumn than in spring and that annual correlations are similar to winter correlations but better than spring correlations [32]. According to Rehman et. al. (2007), the electricity demand patterns in Saudi Arabia are similar to the global solar radiation and sunshine duration data. These results indicate that PV-based power generation is an effective method to meet the peak load requirements in summer and in daylight hours throughout the year [33]. The results of this study show that the PV panels in the three projects produce the highest amount of electricity in summer, indicating that electricity generation by PV panels is highly correlated with sunshine duration.
The results show that there is a positive correlation between sunshine duration and renewable energy generation but that monthly variation in temperature also affects the amount of renewable energy generated. Project 1 generates 2.75% less energy than Project 2 in July, when both cities have almost an equal number of hours of sunshine. This is due to the fact that Project 1 needs more cooling than Project 2 in summer. The PV panels in the Projects produce a similar amount of energy in the months with similar average temperature and sunshine duration while they produce less energy in the months when electricity consumption increases.
5. Conclusions
This study analyzed the amount of energy consumed and produced by PV panels in three LEED BD + C certified projects in three cities to investigate the correlation between sunshine duration and renewable energy production. The results showed that PV panels can produce 10–15% of the energy consumed in cities with many hours of sunshine. Therefore, using PV panels in buildings especially in regions with warm winter and many hours of sunshine will promote renewable energy, reduce greenhouse gas emissions and mitigate the negative impacts of global warming.
The results indicate that the more hours of sunshine, the more electricity generation in winter and the more electricity consumption in summer. The results also indicate that electricity generation is higher in cities with many hours of sunshine in summer but with a low monthly average temperature.
Heat insulation materials and energy-efficient electrical fittings should be used, and buildings should be designed in a way to maximize daylighting in order to reduce electricity consumption and mitigate the negative impacts of global warming.
Author Contributions
Conceptualization, A.K. and S.A.I.; Data Curation, A.K. and S.A.I.; Formal Analysis, A.K. and S.A.I.; Investigation, A.K. and S.A.I.; Methodology, A.K. and S.A.I.; Project Administration, A.K.; Resources, A.K and S.A.I.; Visualization, A.K. and S.A.I.; Writing-Original Draft Preparation, A.K. and S.A.I.; Writing-Review & Editing, A.K. and S.A.I.
Funding
Authors are grateful to the Scientific Research Projects Coordination Unit of Akdeniz University for supporting this study with the project number of (FDK-2018-3654).
Conflicts of Interest
The authors declare no conflict of interest.
References
- You, H.M.; Fang, H.; Wang, X.; Fang, S.R. Environmental efficiency of photovoltaic power plants in china-a comparative study of different economic zones and plant types. Sustainability 2018, 10, 2551. [Google Scholar] [CrossRef]
- International Energy Agency. Global Energy & CO2 Status Report. Available online: https://www.iea.org/geco/ (accessed on 25 February 2019).
- Leung, B.C.M. Greening existing buildings GEB strategies. Energy Rep. 2018, 4, 159–206. [Google Scholar] [CrossRef]
- Scofield, J.H.; Doane, J. Energy performance of LEED-certified buildings from 2015 Chicago benchmarking data. Energy Build. 2018, 174, 402–413. [Google Scholar] [CrossRef]
- IPCC Global Warming of 1.5 °C. Available online: https://www.ipcc.ch/sr15/ (accessed on 25 February 2019).
- Hoegh-Guldberg, O.; Jacob, D.; Taylor, M.; Bindi, M.; Brown, S.; Camilloni, I.; Diedhiou, A.; Djalante, R.; Ebi, K.L.; Engelbrecht, F.; et al. Impacts of 1.5 °C global warming on natural and human systems. Available online: https://www.ipcc.ch/site/assets/uploads/sites/2/2019/02/SR15_Chapter3_Low_Res.pdf (accessed on 25 February 2019).
- KPMG. Available online: https://home.kpmg.com/tr/tr/home/gorusler/2018/01/sektorel-bakis-2018-insaat.html (accessed on 25 February 2019).
- Chen, Y.J.; Matsuoka, R.H.; Liang, T.M. Urban form, building characteristics, and residential electricity consumption: A case study in Tainan City. Environ. Plan. B Urban Anal. City Sci. 2018, 45, 933–952. [Google Scholar] [CrossRef]
- Lopes, S.M.; Moreira, R.M.; Malheiros, T.F. Electricity Consumption Assessment: Case Study of University of Sao Paulo Campus of Sao Carlos. In Towards Green Campus Operations: Energy, Climate and Sustainable Development Initiatives at Universities; Filho, W.L., Frankenberger, F., Iglecias, P., Mulfarth, R.C.K., Eds.; Springer International Publishing Ag.: Cham, Switzerland, 2018; pp. 669–683. [Google Scholar]
- Fan, J.; Wu, L.; Zhang, F.; Cai, H.; Zeng, W.; Wang, X.; Zou, H. Empirical and machine learning models for predicting daily global solar radiation from sunshine duration: A review and case study in China. Renew. Sustain. Energy Rev. 2019, 100, 186–212. [Google Scholar] [CrossRef]
- Olaniyan, K.; McLellan, B.C.; Ogata, S.; Tezuka, T. Estimating residential electricity consumption in Nigeria to support energy transitions. Sustainability 2018, 10, 1440. [Google Scholar] [CrossRef]
- Ribeiro, F.; Ferreira, P.; Araujo, M. Sustainability assessment of electricity production using a logic models approach. Renew. Sustain. Energy Rev. 2013, 28, 215–223. [Google Scholar] [CrossRef] [Green Version]
- Shaaban, M.; Scheffran, J. Selection of sustainable development indicators for the assessment of electricity production in Egypt. Sustain. Energy Technol. Assess. 2017, 22, 65–73. [Google Scholar] [CrossRef]
- Atanasoae, P.; Pentiuc, R. Considerations on the Green Certificate Support Dystem for Electricity Production from Renewable Energy Sources. In Proceedings of the 10th International Conference Interdisciplinarity in Engineering, INTER-ENG 2016, Tirgu Mures, Romania, 6–7 October 2016. [Google Scholar]
- BP Statistical Review of World Energy. Available online: https://www.bp.com/en/global/corporate/energy-economics/statistical-review-of-world-energy.html (accessed on 27 February 2019).
- Choi, J.O.; Bhatla, A.; Stoppel, C.M.; Shane, J.S. LEED credit review system and optimization model for pursuing LEED certification. Sustainability 2015, 7, 13351–13377. [Google Scholar] [CrossRef]
- Newsham, G.R.; Mancini, S.; Birt, B.J. Do LEED-certified buildings save energy? Yes, but. Energy Build. 2009, 41, 897–905. [Google Scholar] [CrossRef]
- US Green Building Council (USGBC). Projects Directory. Available online: https://www.usgbc.org/projects/new-construction (accessed on 24 June 2018).
- Turkish Electricity Transmission Corporation. Available online: https://www.teias.gov.tr/en (accessed on 23 January 2019).
- Cucchiella, F.; D’Adamo, I.; Gastaldi, M.; Stornelli, V. Solar photovoltaic panels combined with energy storage in a residential building: An economic analysis. Sustainability 2018, 10, 3117. [Google Scholar] [CrossRef]
- Zhai, X.Q.; Wang, R.Z.; Dai, Y.J.; Wu, J.Y.; Xu, Y.X.; Ma, Q. Solar integrated energy system for a green building. Energy Build. 2007, 39, 985–993. [Google Scholar] [CrossRef]
- Turkish General Directorate of Renewable Energy. Available online: http://www.yegm.gov.tr/MyCalculator/ (accessed on 10 March 2019).
- Baxter, L.W.; Calandri, K. Global warming and electricity demand: A study of California. Energy Policy 1992, 20, 233–244. [Google Scholar] [CrossRef]
- Bakos, G.C.; Soursos, M.; Tsagas, N.F. Technoeconomic assessment of a building-integrated PV system for electrical energy saving in residential sector. Energy Build. 2003, 35, 757–762. [Google Scholar] [CrossRef]
- Parida, B.; Iniyan, S.; Goic, R. A review of solar photovoltaic technologies. Renew. Sustain. Energy Rev. 2011, 15, 1625–1636. [Google Scholar] [CrossRef]
- Singh, G.K. Solar power generation by PV (photovoltaic) technology: A review. Energy 2013, 53, 1–13. [Google Scholar] [CrossRef]
- Gaziantep Ecological Building. Available online: http://gaziantepekolojikbina.com.tr (accessed on 23 January 2018).
- Turkish State Meteorological Service. Available online: https://www.mgm.gov.tr/veridegerlendirme/il-ve-ilceler-istatistik.aspx?k=H&m=ISTANBUL (accessed on 10 March 2019).
- Erke Green Academy. Available online: http://www.erketasarim.com/erkegreenacademy_booklet.pdf (accessed on 25 January 2018).
- Almorox, J.; Hontoria, C. Global solar radiation estimation using sunshine duration in Spain. Energy Conversat. Manag. 2004, 45, 1529–1535. [Google Scholar] [CrossRef]
- Wang, Y.; Wild, M.; Sanchez-Lorenzo, A.; Manara, V. Urbanization effect on trends in sunshine duration in China. Ann. Geophys. 2017, 35, 839–851. [Google Scholar] [CrossRef] [Green Version]
- Hao, G.; Yu, X.; Huang, Y.; Xu, Y.; Zhao, X.; Li, H.; Chen, M. Application and development of building-integrated photovoltaics (BIPV) system in China. In Proceedings of the International Solar Energy Society Solar World Congress, Beijing, China, 18–21 September 2007; Volume 3, pp. 1685–1689. [Google Scholar]
- Rehman, S.; Bader, M.A.; Moallem, S.A. Cost of solar energy generated using PV panels. Renew. Sustain. Energy Rev. 2007, 11, 1843–1857. [Google Scholar] [CrossRef]
Figure 1.
Distribution of renewable energy resources in Turkey (2017) [19].
Figure 1.
Distribution of renewable energy resources in Turkey (2017) [19].

Figure 2.
Distribution of gross power generation by energy resources in Turkey (2017) [19].
Figure 2.
Distribution of gross power generation by energy resources in Turkey (2017) [19].

Figure 3.
The annual sunshine duration times of Istanbul, Konya and Gaziantep [22].
Figure 3.
The annual sunshine duration times of Istanbul, Konya and Gaziantep [22].


Table 1.
Causes and consequences of global warming [6].
Table 1.
Causes and consequences of global warming [6].
| Causes | ||||
|---|---|---|---|---|
| Solar radiation | Greenhouse gas emissions | Using fuels | Natural disasters | Economic problems |
| Consequences | ||||
| Temperature Rise | Sea Level Rise | Biodiversity and Ecosystem Transformation | Increased Ocean Acidity | Diseases |
| Extreme hot days | Melting of ice sheets | Extinction | Threats to ocean life | Malaria, Tuberculosis, HIV/AIDS |
| Droughts | Global sea level rise | Terrestrial land area transformation | Reduction in yields of cereal crops | |
| Heavy precipitation | Exposure of small islands | Degradation of forests | ||
Table 2.
Energy production by renewable sources in Turkey (2017) [19].
Table 2.
Energy production by renewable sources in Turkey (2017) [19].
| Renewable Sources | GWh (Gigawatt Hours) | % |
|---|---|---|
| Renew waste + waste heat | 2.972,3 | 3.37 |
| Wind | 17.903,8 | 20.32 |
| Solar | 2.889,3 | 3.28 |
| Dam | 41.312,6 | 46.89 |
| N. lake and run of river | 16.905,9 | 19.19 |
| Geothermal | 6.127,5 | 6.95 |
| Total | 88.111,4 | 100 |
Table 3.
Power generation by energy sources in Turkey (2017) [19].
Table 3.
Power generation by energy sources in Turkey (2017) [19].
| Energy Source | Generation (GWh) | Contribution (%) |
|---|---|---|
| Renew waste + waste heat | 2.972,3 | 3.37 |
| Wind | 17.903,8 | 20.32 |
| Solar | 2.889,3 | 3.28 |
| Dam | 41.312,6 | 46.89 |
| N. lake and run of river | 16.905,9 | 19.19 |
| Geothermal | 6.127,5 | 6.95 |
| Total | 88.111,4 | 100 |
Table 4.
Monthly variation in temperature in three cities between 1930–2018 [28].
Table 4.
Monthly variation in temperature in three cities between 1930–2018 [28].
| Months | Jan. | Feb. | Mar. | April | May | June | July | Aug. | Sep. | Oct. | Nov. | Dec. | |
|---|---|---|---|---|---|---|---|---|---|---|---|---|---|
| Cities | |||||||||||||
| Gaziantep | 3.6 | 4.4 | 8.5 | 13.6 | 18.8 | 24.3 | 28.1 | 27.7 | 23.1 | 16.6 | 9.4 | 5.1 | |
| Konya | −0.2 | 0.8 | 5.5 | 11.0 | 15.7 | 20.4 | 23.6 | 23.4 | 18.9 | 12.7 | 5.8 | 1.6 | |
| Istanbul | 5.8 | 5.5 | 7.3 | 11.2 | 15.7 | 20.5 | 22.9 | 23.4 | 19.9 | 15.8 | 11.0 | 7.8 | |
Table 5.
Amount of energy consumed and produced monthly by PV panels in Gaziantep Green House Project (2017) [27].
Table 5.
Amount of energy consumed and produced monthly by PV panels in Gaziantep Green House Project (2017) [27].
| Months | Electricity Consumption (kW) | Electricity Production (kW) | Renewable Energy Prod. (%) | Electricity Prod./ Electricity Cons. |
|---|---|---|---|---|
| January | 2.638,00 | 1.430,00 | 4.51 | 54.21 |
| February | 2.046,00 | 2.167,00 | 6.84 | 105.91 |
| March | 1.632,00 | 2.466,00 | 7.79 | 151.10 |
| April | 1.017,00 | 3.094,00 | 9.77 | 304.23 |
| May | 1.003,00 | 3.312,00 | 10.46 | 330.21 |
| June | 1.188,00 | 3.584,00 | 11.31 | 301.68 |
| July | 2.120,00 | 3.476,00 | 10.97 | 163.96 |
| August | 2.336,00 | 3.308,00 | 10.44 | 141.61 |
| September | 2.198,00 | 3.220,00 | 10.17 | 146.50 |
| October | 1.595,00 | 2.611,00 | 8.24 | 163.70 |
| November | 2.047,00 | 1.629,00 | 5.14 | 79.58 |
| December | 2.700,00 | 1.379,00 | 4.35 | 51.07 |
| TOTAL | 22.520,00 | 31.676,00 | - | - |
Table 6.
The annual electricity consumption and production values of Konya Unilever Vector Admin Building.
Table 6.
The annual electricity consumption and production values of Konya Unilever Vector Admin Building.
| Months | Electricity Consumption (kW) | Electricity Production (kW) | Renewable Energy Prod. (%) | Electricity Production/ Electricity Consumption |
|---|---|---|---|---|
| May 2017 | 11.041,7 | 8.000,00 | 7.22 | 72.45 |
| June 2017 | 11.417,33 | 15.000,00 | 13.54 | 131.38 |
| July 2017 | 12.873,92 | 15.200,00 | 13.72 | 118.07 |
| August 2017 | 12.112,73 | 15.000,00 | 13.54 | 123.84 |
| September 2017 | 11.276,94 | 13.000,00 | 11.73 | 115.28 |
| October 2017 | 11.184,31 | 8.100,00 | 7.31 | 72.42 |
| November 2017 | 12.886,78 | 6.100,00 | 5.51 | 47.34 |
| December 2017 | 12.722,39 | 4.600,00 | 4.15 | 36.16 |
| January 2018 | 15.764,27 | 4.100,00 | 3.70 | 26.01 |
| February 2018 | 12.391,91 | 5.900,00 | 5.32 | 47.61 |
| March 2018 | 10.436,17 | 7.900,00 | 7.13 | 75.70 |
| April 2018 | 7.863,00 | 7.900,00 | 7.13 | 100.47 |
| TOTAL | 141.971,45 | 110.800,00 |
Table 7.
Amount of energy consumed and generated monthly by PV panels in Istanbul Erke Green Academy Building Project [29].
Table 7.
Amount of energy consumed and generated monthly by PV panels in Istanbul Erke Green Academy Building Project [29].
| Months | Electricity Consumption (kW) | Electricity Production (kW) | Renewable Energy Production (%) | Electricity Production/ Electricity Consumption |
|---|---|---|---|---|
| January | 3332 | 313 | 3.31 | 9.39 |
| February | 3143 | 438 | 4.63 | 13.94 |
| March | 2.994 | 698 | 7.39 | 23.31 |
| April | 2532 | 967 | 10.23 | 38.19 |
| May | 2801 | 1208 | 12.78 | 43.13 |
| June | 2850 | 1263 | 13.37 | 44.32 |
| July | 3435 | 1291 | 13.66 | 37.58 |
| August | 2886 | 1153 | 12.20 | 39.95 |
| September | 2929 | 875 | 9.26 | 29.87 |
| October | 1972 | 608 | 6.43 | 30.83 |
| November | 2618 | 369 | 3.90 | 14.09 |
| December | 3066 | 267 | 2.83 | 8.71 |
| TOTAL | 34558 | 9450 |
© 2019 by the authors. Licensee MDPI, Basel, Switzerland. This article is an open access article distributed under the terms and conditions of the Creative Commons Attribution (CC BY) license (http://creativecommons.org/licenses/by/4.0/).
Share and Cite
MDPI and ACS Style
Kazaz, A.; Adiguzel Istil, S. A Comparative Analysis of Sunshine Duration Effects in terms of Renewable Energy Production Rates on The LEED BD + C Projects in Turkey. Energies 2019, 12, 1116. https://doi.org/10.3390/en12061116
AMA Style
Kazaz A, Adiguzel Istil S. A Comparative Analysis of Sunshine Duration Effects in terms of Renewable Energy Production Rates on The LEED BD + C Projects in Turkey. Energies. 2019; 12(6):1116. https://doi.org/10.3390/en12061116
Chicago/Turabian StyleKazaz, Aynur, and Seyda Adiguzel Istil. 2019. "A Comparative Analysis of Sunshine Duration Effects in terms of Renewable Energy Production Rates on The LEED BD + C Projects in Turkey" Energies 12, no. 6: 1116. https://doi.org/10.3390/en12061116
Note that from the first issue of 2016, this journal uses article numbers instead of page numbers. See further details here.