Article

An Experimental and Simulation Study on Optimisation of the Operation of a Distributed Power Generation System with Energy Storage—Meeting Dynamic Household Electricity Demand

1
Huaiyin Institute of Technology, Huaiyin 223002, China
2
School of Electrical Engineering, Guangxi University, Nanning 530004, Guangxi Zhuang Autonomous Region, China
3
Guangxi Electrical Polytechnic Institute, Nanning 530007, China
4
Sir Joseph Swan Centre for Energy Research, Newcastle University, Newcastle upon Tyne NE1 7RU, UK
*
Author to whom correspondence should be addressed.
Energies 2019, 12(6), 1091; https://doi.org/10.3390/en12061091
Submission received: 9 January 2019 / Revised: 7 March 2019 / Accepted: 16 March 2019 / Published: 21 March 2019
(This article belongs to the Section F: Electrical Engineering)

Abstract

:
There are few experimental reports combining hybrid energy storage and diesel engine generators as the power source of distributed power generation systems. In this article, a distributed power generation with energy storage system (DG-ES) which contains a diesel engine generator and an energy storage unit is set up and tested in the laboratory to satisfy the dynamic changing load. The hybrid energy storage system is composed of a lead-acid battery and a supercapacitor. The DG-ES supplied power to meet the domestic load demand successfully under different seasons. A simulation model of this system was also set up in MATLAB software used to guide to the experimental operation of this system. The simulation results has 2.69% and 2.35% error. The results of the experimental tests show the DG-ES can provide enough power to meet the dynamic loads of the selected house, especially at peak time in both winter and summer time. Computational simulation results show that the performance of DG-ES is improved by 3.61% in summer and 1.86% in winter when the system’s operations are optimised.

1. Introduction

Distributed power generation systems have been studied and used for many years [1]. They have the following advantages: they provide flexibility in operation, size and expandability to meet different demand requirements because of their small size, shorter construction lead time compared to large power plants and reduced grid losses (the losses are around 6.8%), they are suitable for CHP, which may result in a primary energy savings of about 10%–30% [2]. Other benefits of using distributed systems include: improved power quality, enhancement in system reliability and security, provision of power supply for rural or isolated areas, and increased overall electric power energy efficiency [3,4]. The application of distributed power generation systems also makes it possible to utilise the waste heat from them for either industrial processes or space heating and increase their overall energy efficiency [5,6,7]. In order to meet the dynamic demand of users, it is common for distributed power generation systems to utilise energy storage units as a back-up measure [8,9]. Numerous studies were carried out on different distributed power generation systems and most of them are simulations using different computational models [10,11,12,13,14,15,16]. Distributed CHP and CCHP systems refer to combined heat and power and combined cooling (also called trigeneration), which supplies not only power, but also heat (and cooling) as available energy products [2,3,4]. Distributed trigeneration systems are seen as high efficiency energy systems because the utilises the waste heat for heating and generating cooling [17]. Against the background of global warming and climate change, high efficiency systems are attaching researchers’ attention in recent years.
Domestic load costs a non-ignorable part of the primary energy in the UK and EU. In developed countries, approximately 40% of the energy is supplied for buildings and the housing sector. In EU about 60% [18] and in the UK over 50% [19] of the energy is consumed on buildings and housing energy demand. Since domestic loads are some of the most significant loads for small energy systems, many previous works have focused on using combined heat and power (CHP) and combined cooling, heat and power (CCHP) systems to satisfy the domestic load. For example, Antonucci studied a CHP domestic application with an integration of a solid oxide fuel cell (SOFC) power generator and a NaNiCI2 battery. The system was designed to fulfil the domestic user energy demand and to reduce the primary energy consumption [20]. A new energy storage system design used in a residential m-CHP systems was presented by Jianwei [21]. A hybrid energy storage system (HESS) is combined with the system. Under the management of its control strategy, the system was verified to be able to satisfy the domestic load. Another study about office building applications was presented by Yagoub [19]. Typical test results from operation of the system were presented. The hybrid solar-gas driven CHP system was developed to supply an office building in the UK [22].
In distributed generation systems, especially the isolated ones, batteries are widely used as electrical energy storage units because of their high efficiency and flexible power capacity. Among these electric energy storage techniques, the lead-acid battery is a well-developed solution for small scale domestic demand with relative low cost. The lead-acid battery’s power supply capability is limited by the chemical reactions of the conduction mechanism at the surface of the electrode. Contrary to the advantages, the power density of the lead-acid batteries makes the energy storage system have a slow response speed to the energy demand fluctuations [23]. The power demand of the domestic load varies with the people’s activities, which require the electrical storage units to have more frequent charge and discharge processes. The high frequency operation and variable energy demand shows the necessarily of combining a fast response power unit with the lead-acid battery in the energy storage system [21]. The requirement of high-power density makes supercapacitors the best option for supporting batteries’ operation. The supercapacitor is a new technology, which has emerged with the potential to bring advantages to energy storage systems. Utilizing higher surface area electrodes with relative thinner dielectrics leads the equipment to have larger capacitances compared to normal capacitors. Forming a hybrid energy storage system has been attempted by other researchers in their studies [24]. Xiong tested a battery and supercapacitor hybrid system with a near-optimal power management strategy and the results shows an enhanced performance compared to traditional energy storage units [25]. Another batter-supercapacitor hybrid energy storage system was modelled and simulated with a PV system for a rural household [26]. The performance of the PV system was simulated under with and without the energy storage system. The results show the battery’s lifespan was extended by the new configuration [27].
The control and operation strategy of the distributed power generation system with energy storage plays an important role in the design and operation of distributed power generation systems. For this research, the control system is mainly responsible for the operations of the engine and the energy storage system. Some research work exists in this area on distributed power generation systems with energy storage but most of them are simply computational simulations. Few experimental works with experimental tests have been done to investigate the performance of a distributed power system to meet the electrical demand of a dynamic domestic load. Also few studies have tried to combine a hybrid storage unit with the supercapacitors.
The aim of this study is to carry out an experimental and simulation investigation of a distributed power generation system with a hybrid battery and supercapacitor energy storage unit to meet dynamic domestic loads 24 h a day and to find its optimal control and operation strategy.

2. System Design and Methodology

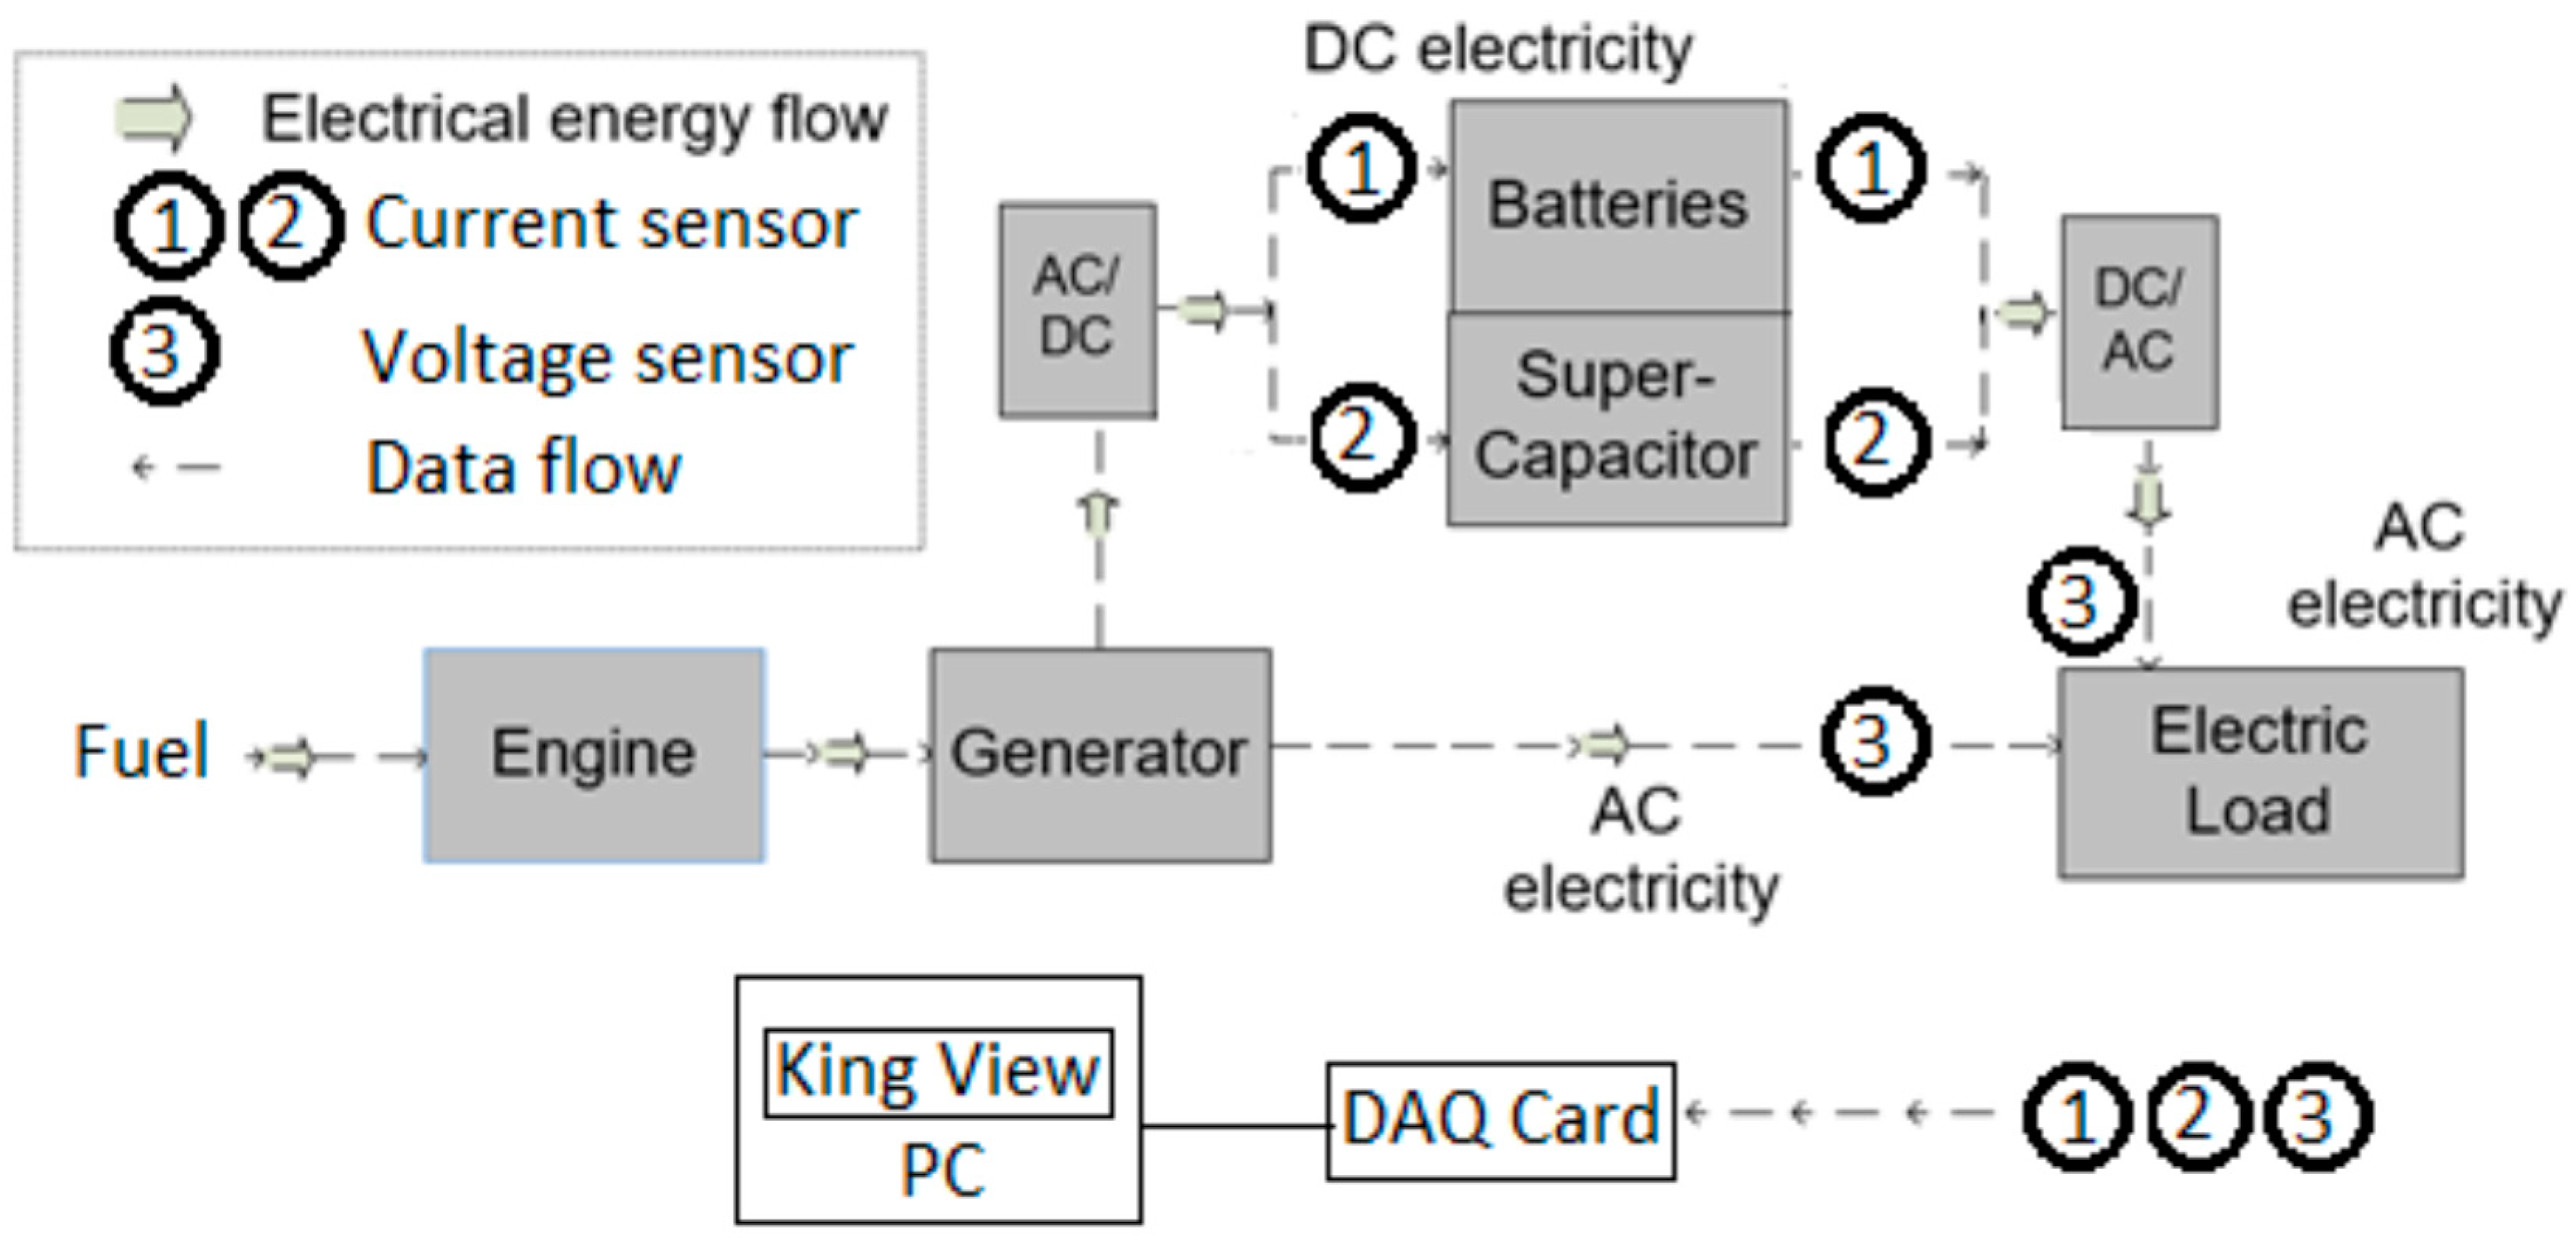
2.1. System Configuration

Figure 1 shows the schematic diagram of the experimental test rig of distributed power generation system with energy storage system. The prime mover is connected parallel with the energy storage unit. Current and voltage sensors are connected with the data logging equipment’s for continuous data measuring and recording. During the experimental test of the system, the signal are transmitted to the data logging card which can be monitored and control by the King View software.

2.2. The Dynamic Electrical Loads

The electricity demand profiles used in the tests are from an onsite measurement data of a selected household in the UK. The data is available in previous research work from the Sir Joseph Swan Centre for Energy Research at Newcastle University. The selected data shows high resolution electricity demand data of a household for 24 h on a summer day and a winter day, respectively. The load profile, shown in the following section, is used as the primary input for the tests and simulation. Two 5-kW load banks are connected in parallel to simulate the fluctuations of a real household load. In order to simulate the dynamic electrical loads of the house for 24 h, a simulator for dynamic electric loads is designed, made and used as the controller of the 10-kW loads. The integrated load kit of the controller and the load banks can continuously provide energy consumption as the input from 0–10 kW re-producing the dynamic fluctuations of the actual loads.

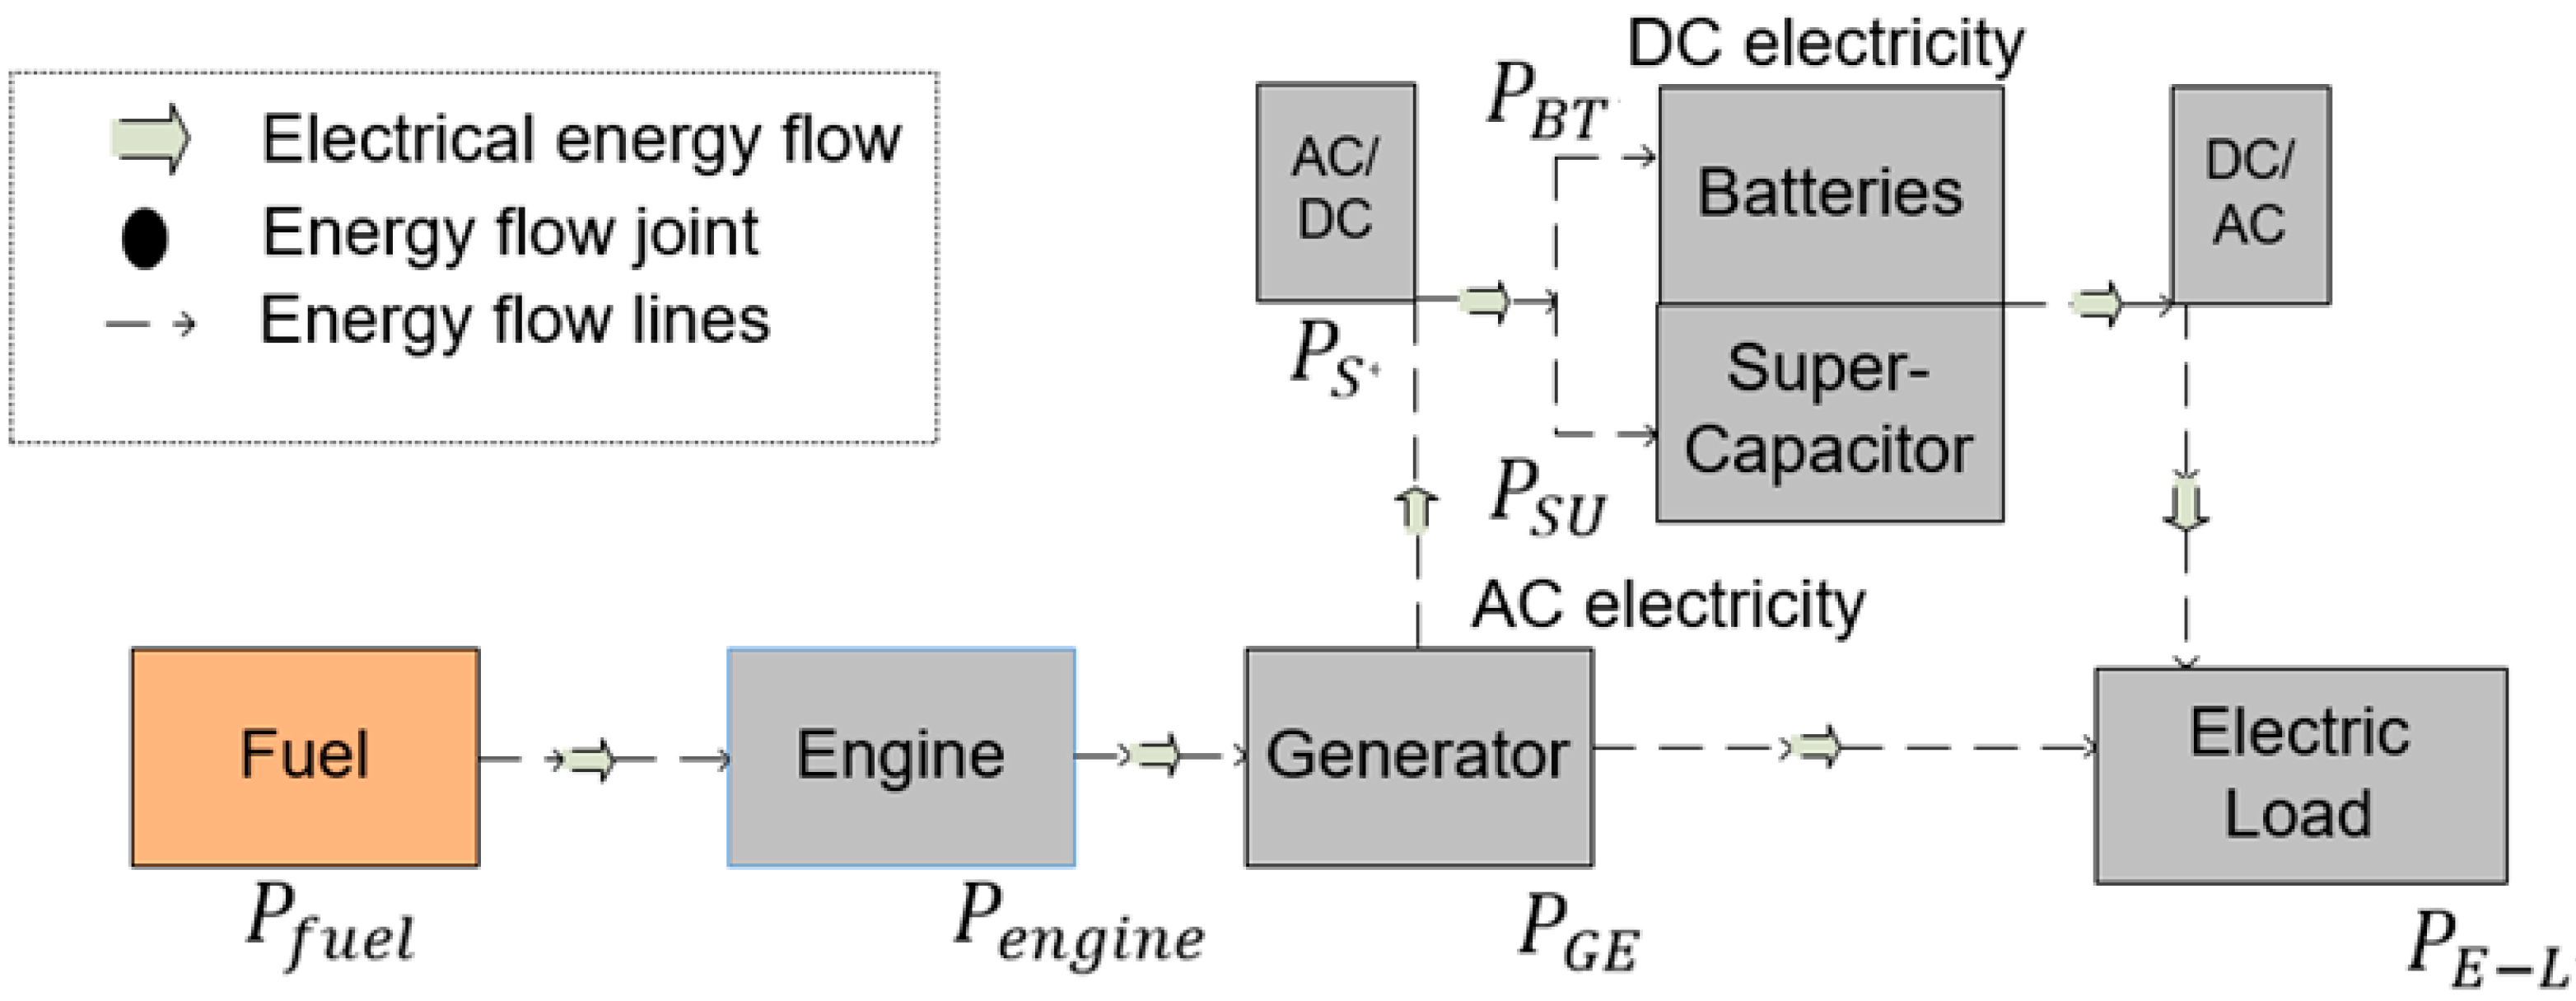
2.3. The Distributed Power Generation with Energy Storage System

2.3.1. The Generator

In the experimental tests, the generator selected is a 6.5 kW Yanmar engine generator (Yanmar, Oska), which is located in the laboratory of our energy research centre [1]. The maximum power supply from the generator is 6.5 kW. For saving testing costs, the power supply from the grid was used to replace the Yanmar engine genset with the maximum power supply limited to 6.5 kW.

2.3.2. Battery

The battery used in this study is a lead-acid battery. Lead-acid batteries are recognized as the most cost-efficient electric power storage equipment currently. A various range of capacities have been considered when sizing the battery, such as 7, 17, 24, 38, 65, 100, 120, 200, 250 Ah. After calculation, the most appropriate battery capacity 12 V 38 Ah capacity was chosen to achieve the longest operation life.

2.3.3. Supercapacitor

A 12 V 300 F supercapacitor was selected in the study. The supercapacitor is responsible for supplying additional power for the load. In the energy storage system, it is connected in parallel with the battery. Its voltage drop based on the formula 1/2 C (U12–U22) can be used to calculate the power release.

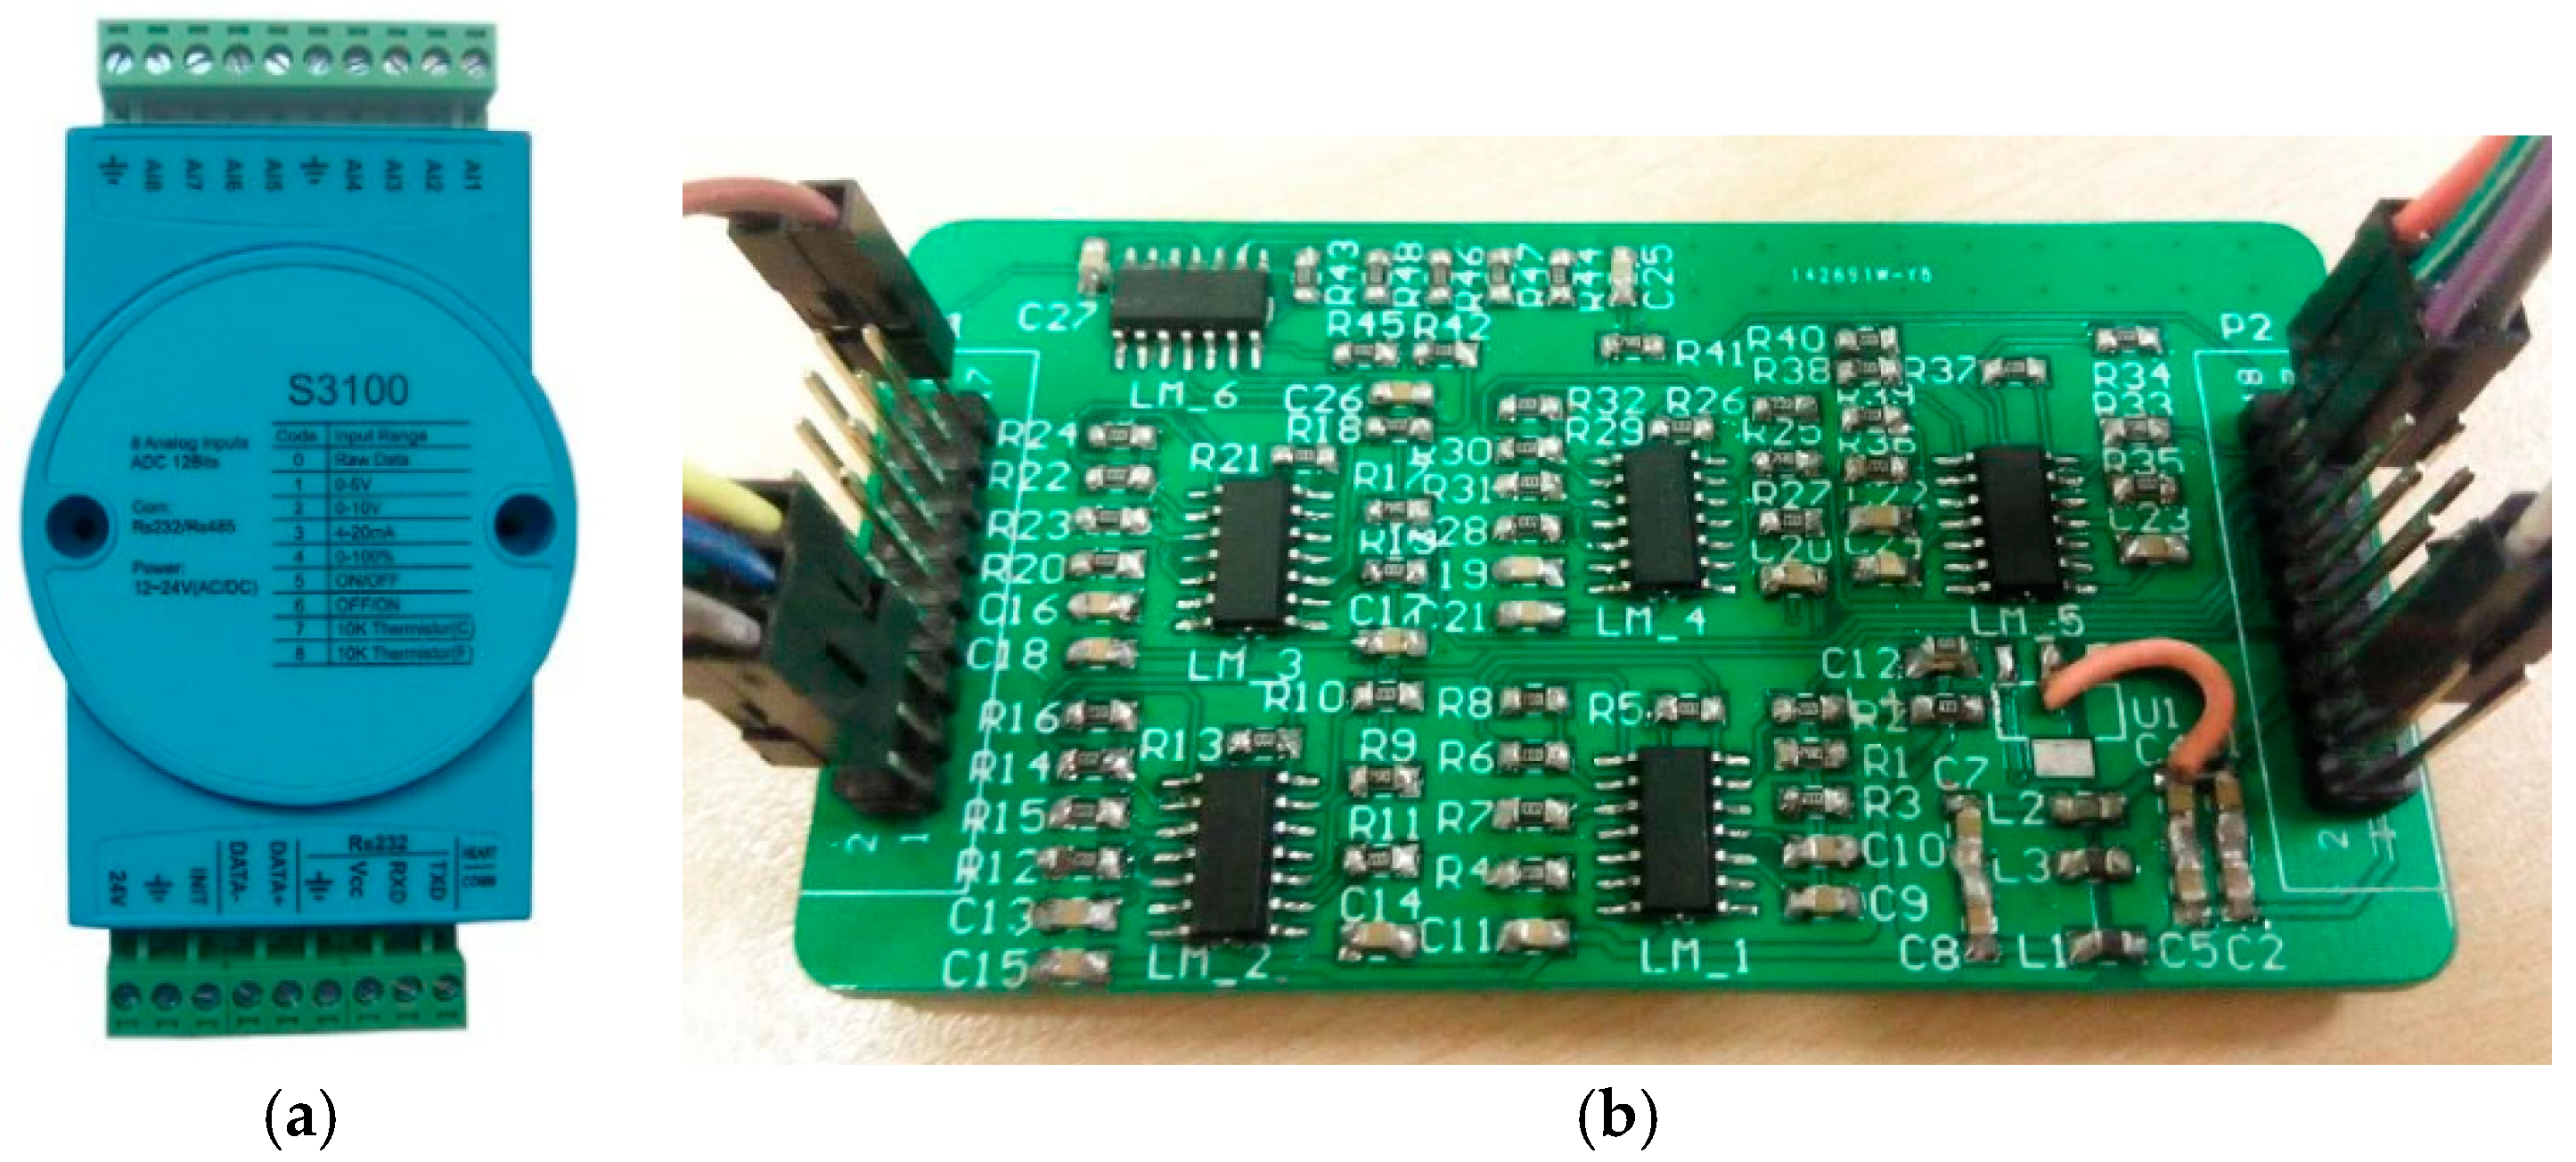
2.4. Data Acquisition System

The data acquisition card is connected with the voltage sensors and the current sensors. It is managed by a software package named KingView (Kingview, Beijing). Real time data is recorded during the experimental test. Different from the generation, the energy storage system has two working modes which requires the DAS card, as shown in Figure 2a, to have two different status (discharging and charging). Therefore, a specially designed signal amplifier is applied which is used for adjusting the circuit and obtaining the current data.
The construction of the amplifier is shown in Figure 2b. Four operational amplifiers are combined to process one signal conversion. A PCB board combined six channels as well as a LM324 chip is applied in the experimental test. A positive and negative current with a 15 V source is applied for the panel for power supply. The software records real-time data, including all the inputs and outputs in the tests. The designed interface of monitoring configuration allows four channels of current signals and one voltage signal channel. It has a data storage function which is a ‘live’ database to record all the inputs and outputs data every second. The database is also available to check the data for a certain period at any time. The stored data will finally be transformed to Excel format which can be further analysed.

2.5. Computer Simulation and Control Strategy of the System

Implementation of the operation strategies aims at supplying the dynamic load with this system successfully. For achieving this goal, the control strategy allocates the available power to satisfy the load at the first place. The selected load lasts for 24 h. During this period, the electrical energy demand has the most drastic swings influenced by human activities. Therefore, the control strategy of this integrated system makes the generator supplies most of the power at peak time with the help of the energy storage system. In the off-peak time, the diesel engine generator operates to charge the energy storage units. Whenever a fast-changing power demand appears, the supercapacitor operates to assist the power supplying of the system. In both the simulations and the experimental tests, the system obeys the same principle of control strategy to supply power for the load.
In order to optimise the design of the distributed power generation system with energy storage to meet dynamic household electricity demand, a computational simulation programmer is developed to carry out further study for optimisation of the DG-ES system, after the experimental tests. The computational model of the DG-ES system configuration is shown in the Figure 3. The system is the same as the experimental system shown in Figure 1. The power rate of each of the system’s component is labelled in the figure. The system’s operation method and the optimization strategy is shown in the equation below.
The electricity generator is driven by a diesel engine. The engine and the generator’s output are shown in the equations below:
{ T d Ω = E I A E = K φ Ω T d = K φ P = T d Ω × η = E I A × η
The engine transfers the chemical energy to mechanical energy, then the generator produces electricity driven by the engine. Base on the equation listed, the model of generator is established in the MATLAB software. Table 1 shows the simulation results of the engine. Compared to the experimental date, the simulation errors are also recorded.
The batteries have high energy density. They responsible for supplying enough electricity to the load. The formula which express the operation of the lead acid batteries using state of charge as its variable is Equation (2) [1]:
SOC ( t + 1 ) = SOC ( t ) SOC ( t ) · σ + I B a t ( t ) t · η B a t C B a t ( t )
In the equation, I B a t is the current of batteries’ charging and discharging. η B a t is the efficiency of the batteries’ operation. The σ is self-discharge rate of the battery whose value is set as 0.2% per day. The C B a t is the capacity of the battery, SOC is the state of charge of the batteries.
The supercapacitor is different from the conventional batteries from its high-power density. The formula of supercapacitor is displayed in Equation (3). The formula is displayed as:
{ P S U = 1 2 C · U 2 = 1 2 ε · S d U 2 ε = 2 W V E 2
where, ε is the dielectric constant, E is the electric field intensity, C is volume of the supercapacitor, and U is the operation voltage of the supercapacitor.

2.6. System Optimisation Process

The optimisation process aims at satisfying the same power demand with less fuel consumption. The principle of the optimisation is cutting down the operation time of the engine. Because of the diesel engine generator has the peak efficiency with full load, the optimisation process changes the system’s control conditions.
In this system, the primary energy source is from the engine, which consumes fuel. The primary energy is converted to the system by the engine at certain thermal efficiency. The efficiency is known from the manufacturer(s) or from experimental tests when the engine generator is selected. Two equations describe that the power transferred from the fuel to the electricity is limited by the engine’s and the generator’s efficiency:
{   P f u e l . η e n g i n e   =   P e n g i n e   P e n g i n e . η g e n e r a t o r   =   P G E
P s = P S U + P B T
The system is designed to satisfy a dynamically changing load. For a certain operation period (in the experimental tests and the simulations, the time period is set to 24 h). In this study, there are peak time and off-peak times during the power supply process. The system’s operation is simply divided into two modes: during the peak time, the generator is working; in the off-peak time, the generator stops working and only the energy storage units are working. When generator is operating:
P L O A D = P G E + P S
The electric energy demand is satisfied by the power of engine and energy storage units.
When the generator is not operating:
P L O A D =   P S = P S U + P B T
When the engine is not working, the electric load is supplied by the energy storage system which consists of the supercapacitor and the batteries. In Equation (7), P S U means the power supplied by the supercapacitor, P B T means the power supplied by the batteries.
Limiting conditions:
40 % < S O C ( t ) < 100 %
P G E + P s P L o a d
t 0 t e ( P G E P L O A D ) d t t 0 t e P B T ( t ) d t + C S · [ S O C ( t e ) S O C ( t 0 ) ]
For the system’s operation, the energy demand of the electric load must be satisfied. In case of over-discharging and energy wasting, the state of charge of batteries is controlled within a range from 40% to 100%. The system also is configured to provide enough energy for the energy peak demand.
The energy saved:
E n e r g y S a v e d = t 1 t 1 e P e n g i n e ( t ) η e n g i n e d t + t 2 t 2 e P e n g i n e ( t ) η e n g i n e d t P e n g i n e ( m a x ) t o p
The system’s prime mover works at full load with the shortest time during the peak time. In the off-peak time, the power demand is supplied by the energy storage unit. The two parameters t1 and t2 mean the engine starting time during two peak time zones. The two parameters t1e and t2e are the engine ending time of the two peak time zones. The top means the optimised engine working time. Theoretically, the optimised time should be less than the engine working time in the original system operations. The energy saved by the optimization process is calculated by the difference between the original energy consumption amount and the optimized energy consumption amount.

3. Results and Discussion

The results include the test results of supplying the dynamic domestic load and simulation results from Matlab software. The results are displayed in two sets in the following section. During the experimental tests, the energy required is adjusted according to the electrical load profiles of the selected house. As a real time, experimental test, the energy consumption in the experimental test does not fit the raw energy demand data exactly, but the amount of energy requirement in this test shows a general law of the domestic energy equipment on either a summer day or on a winter day.

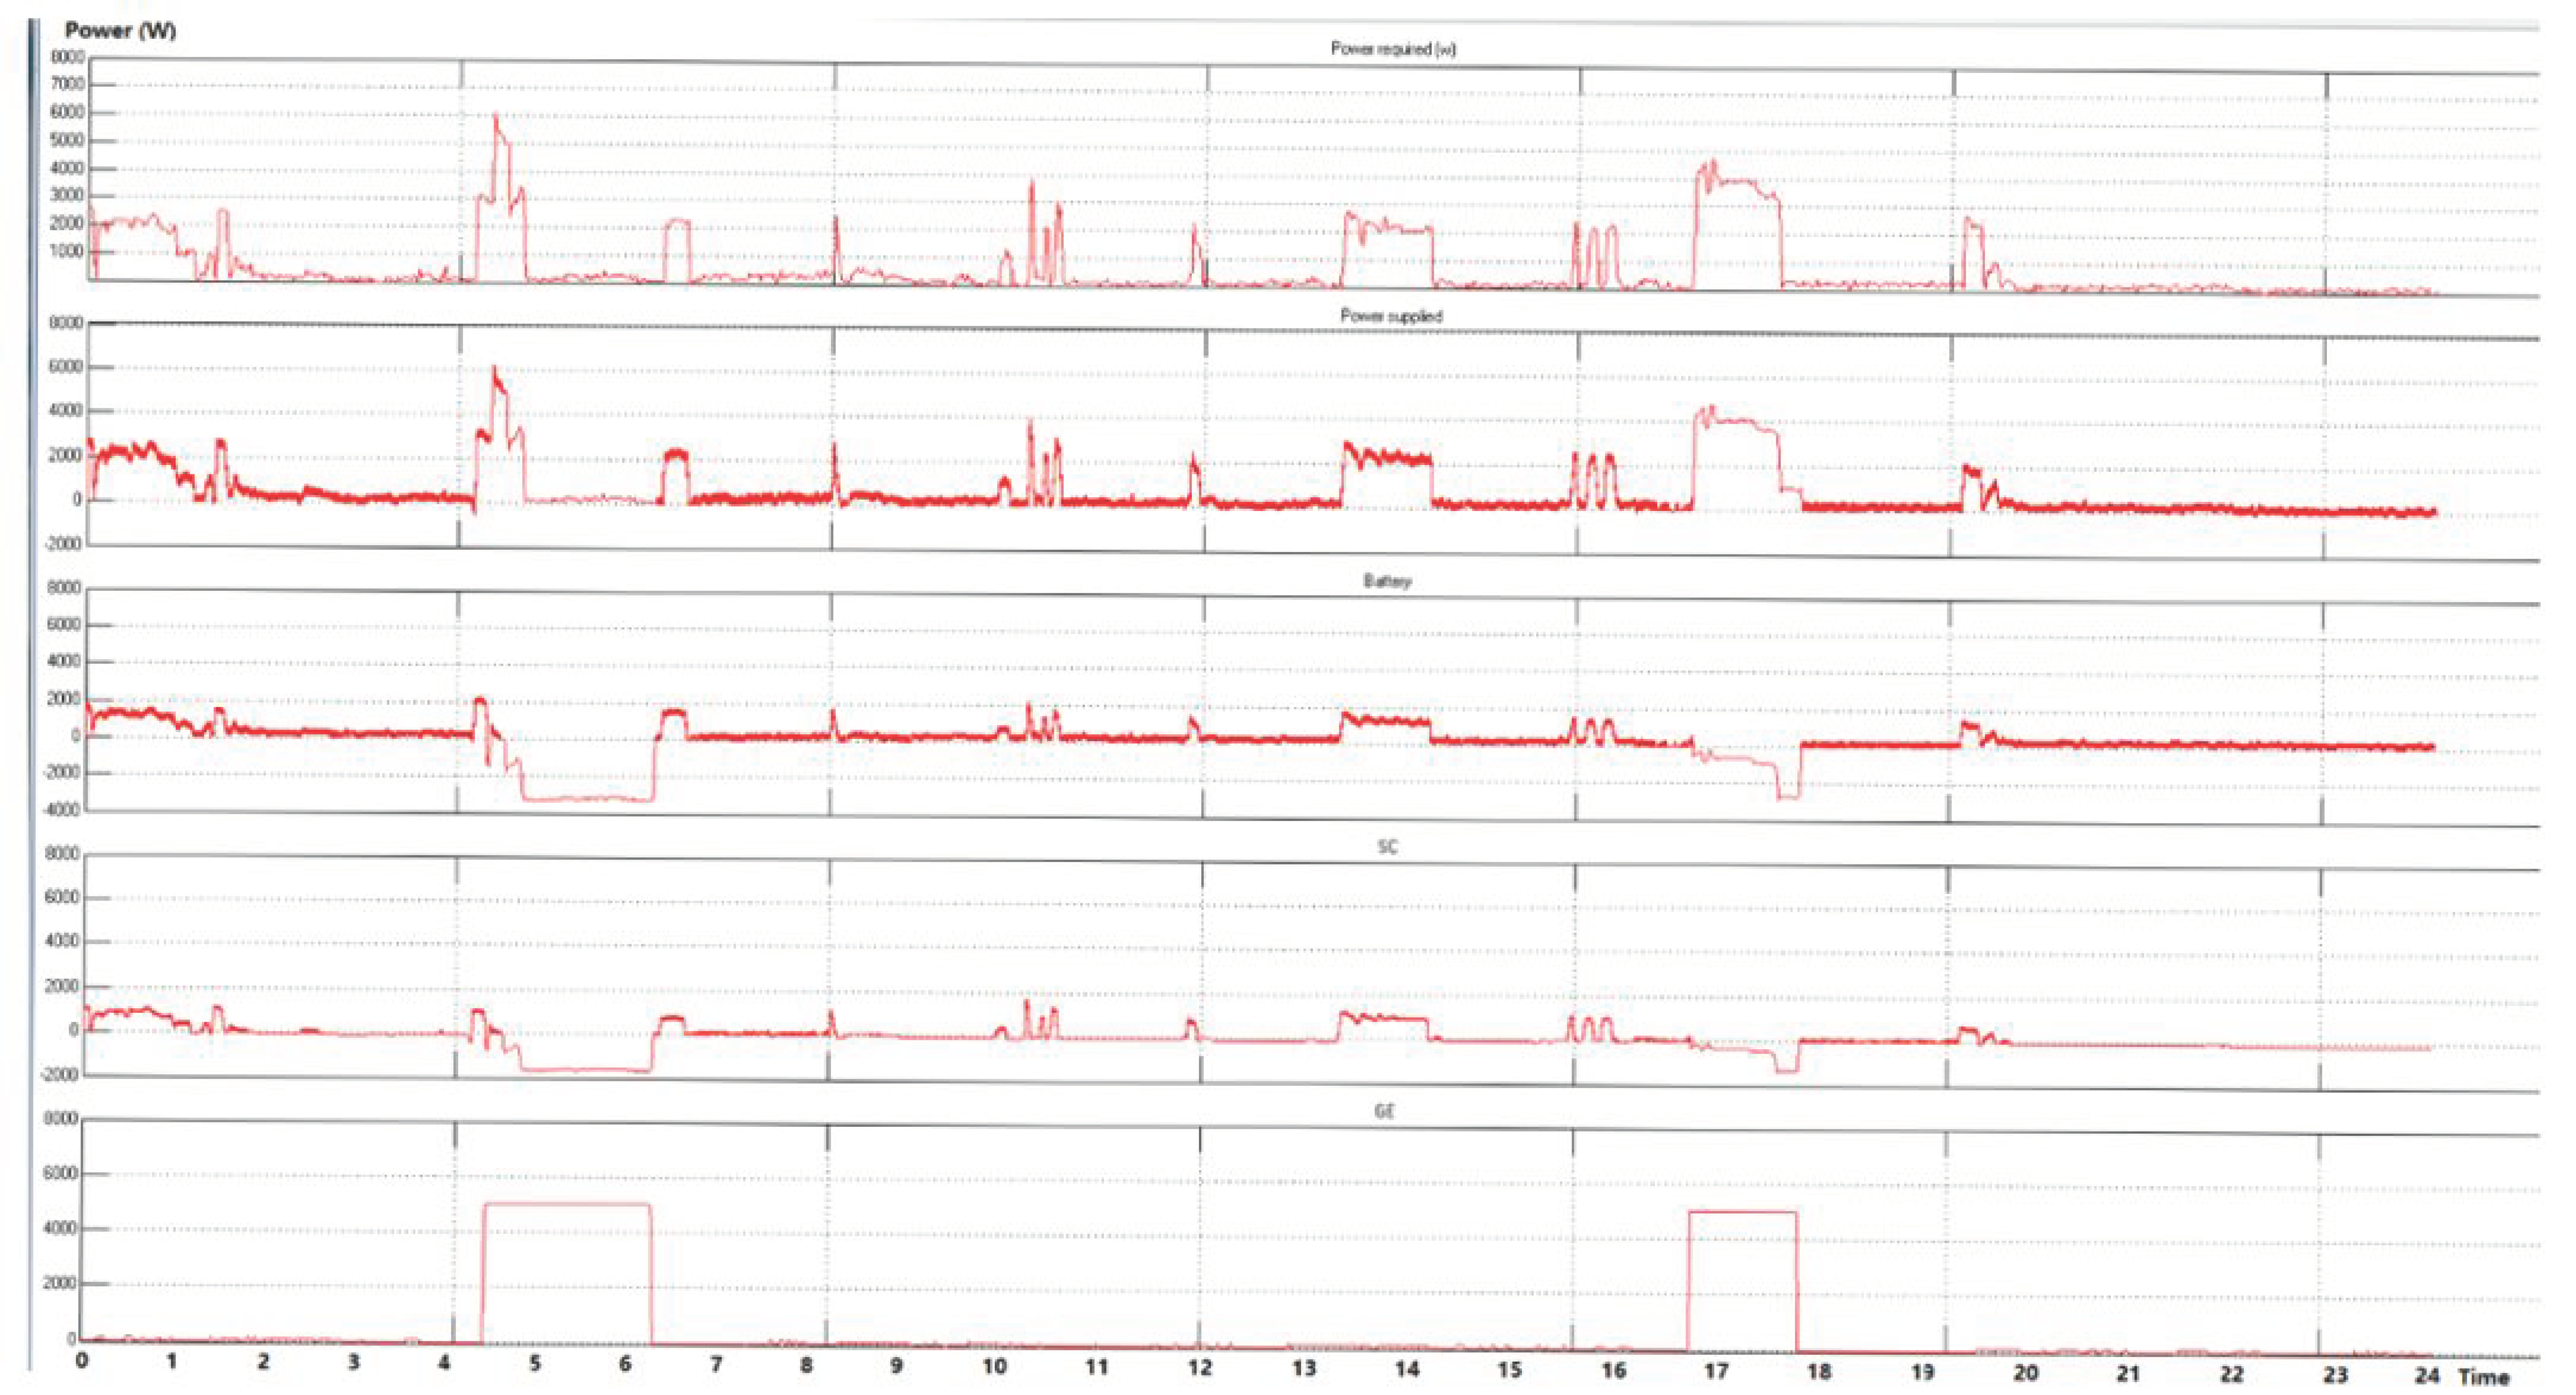
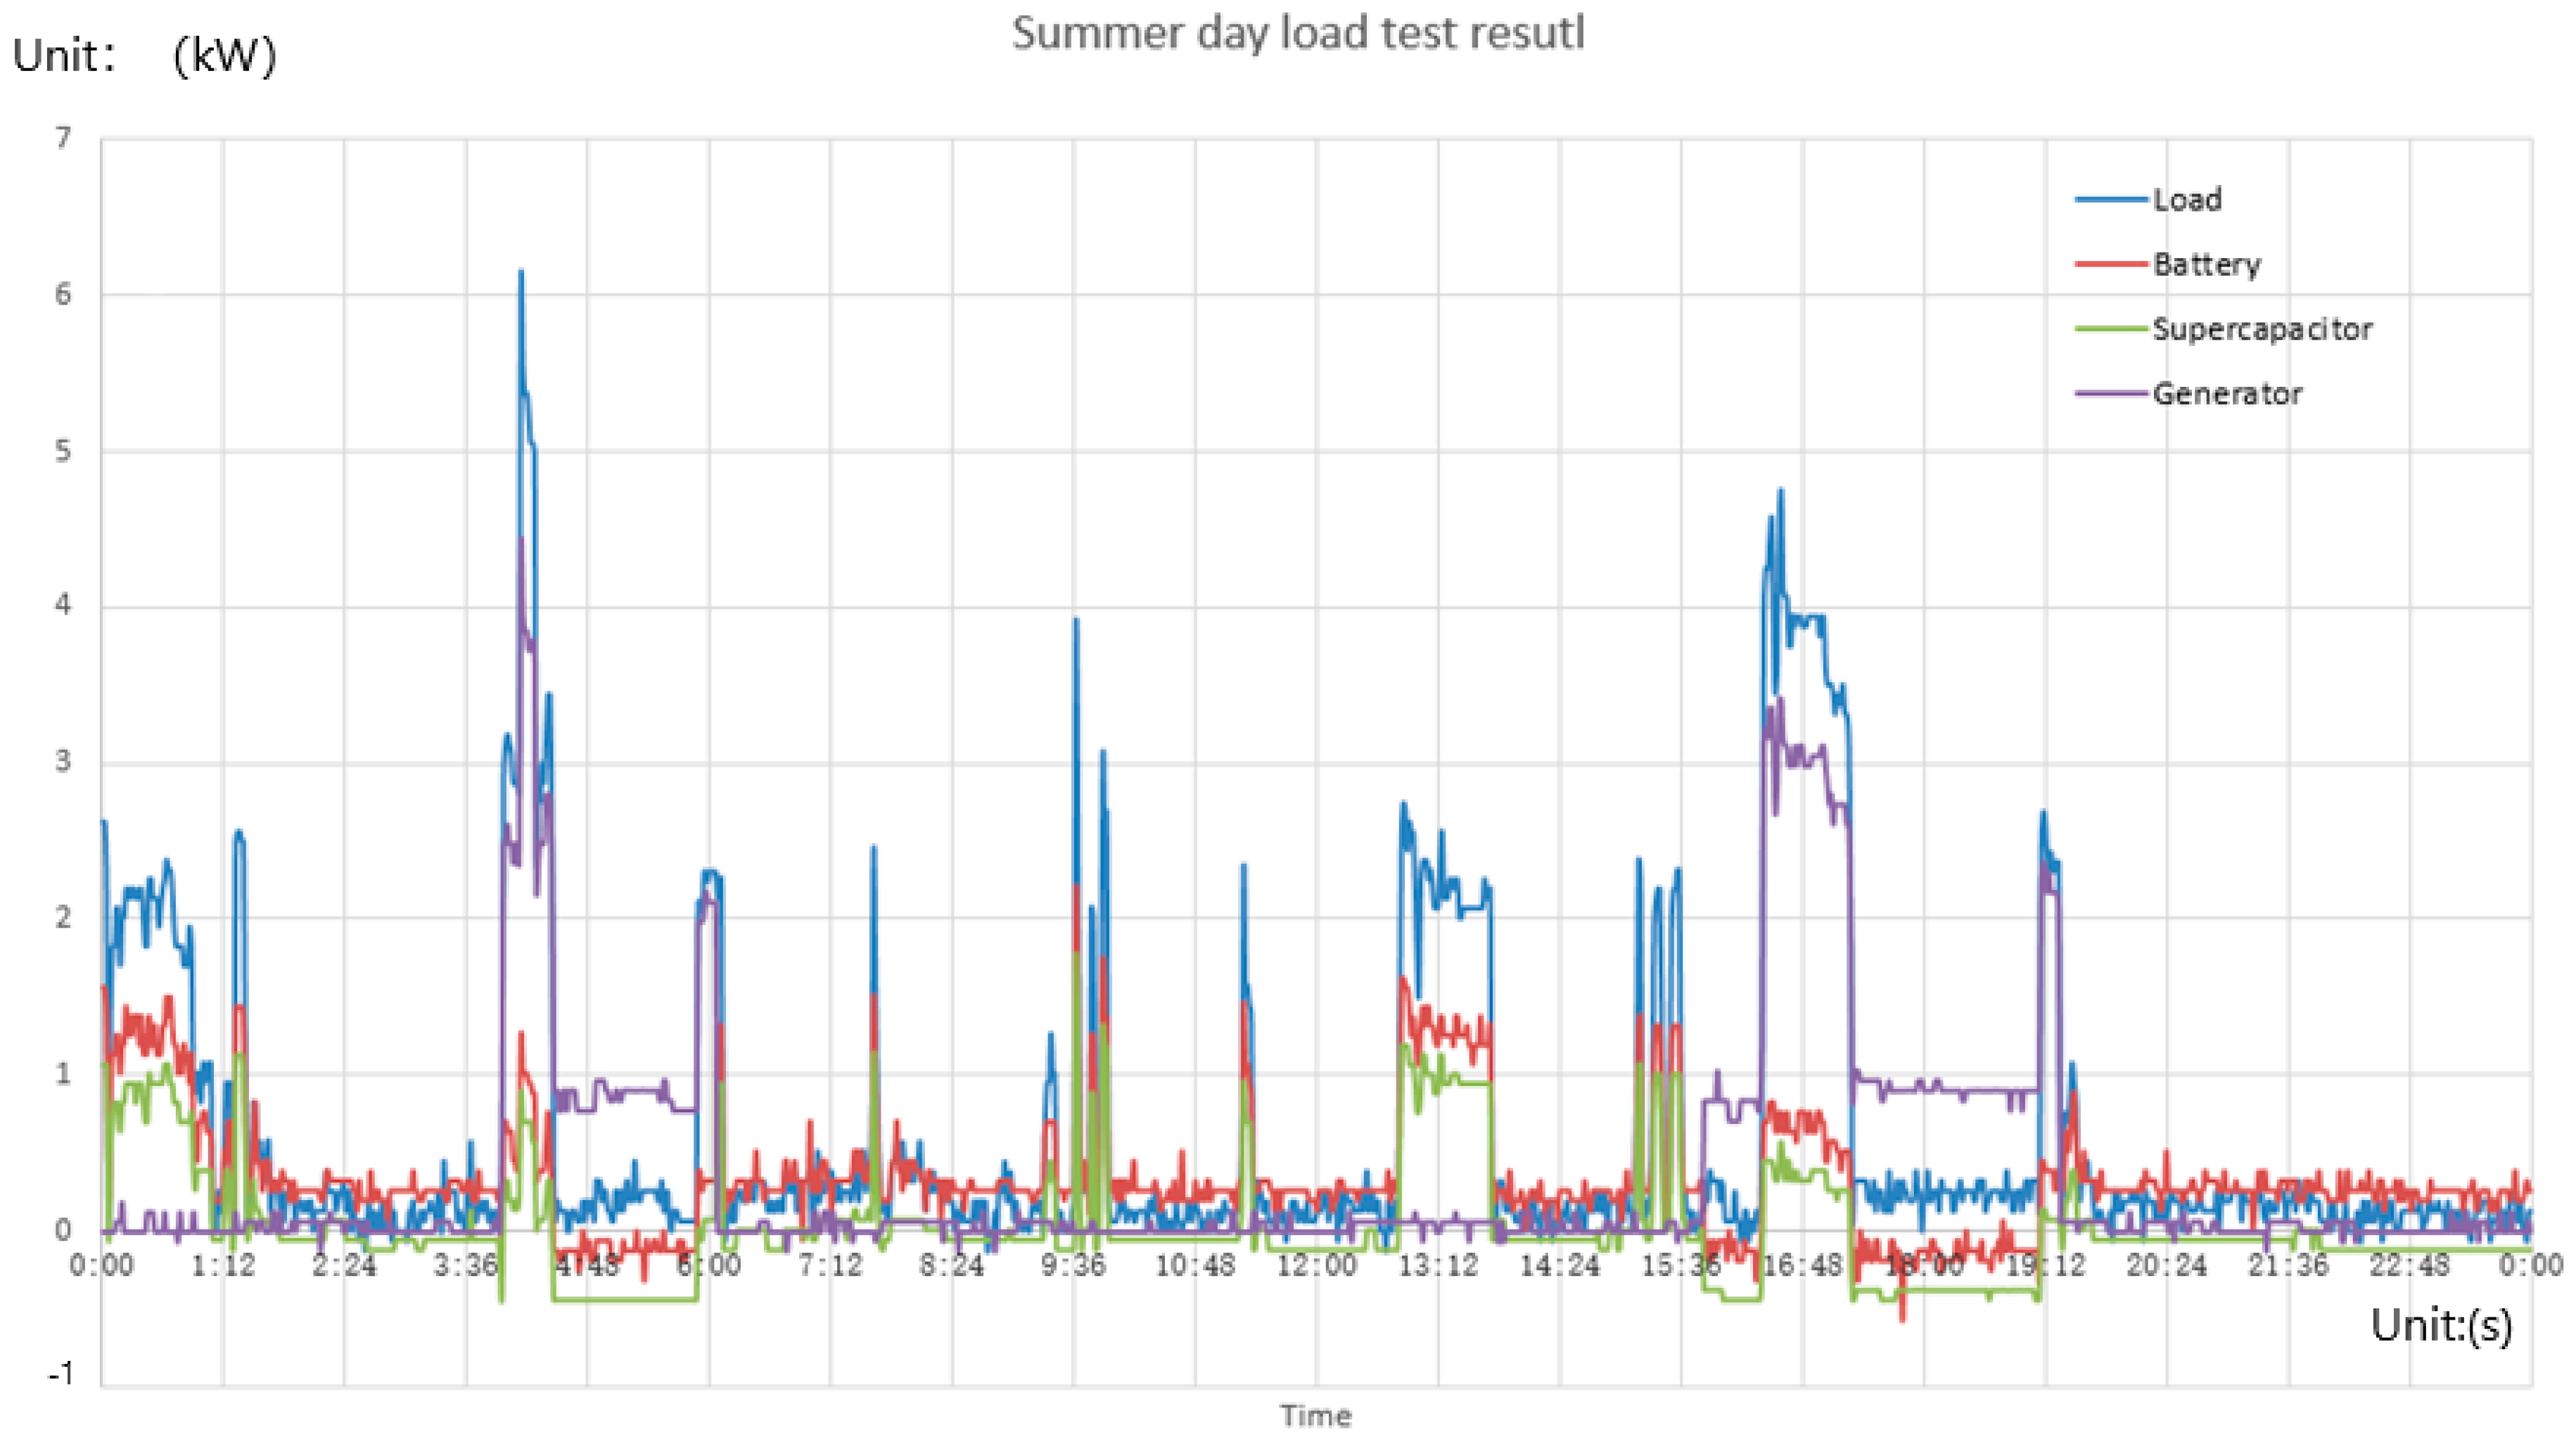
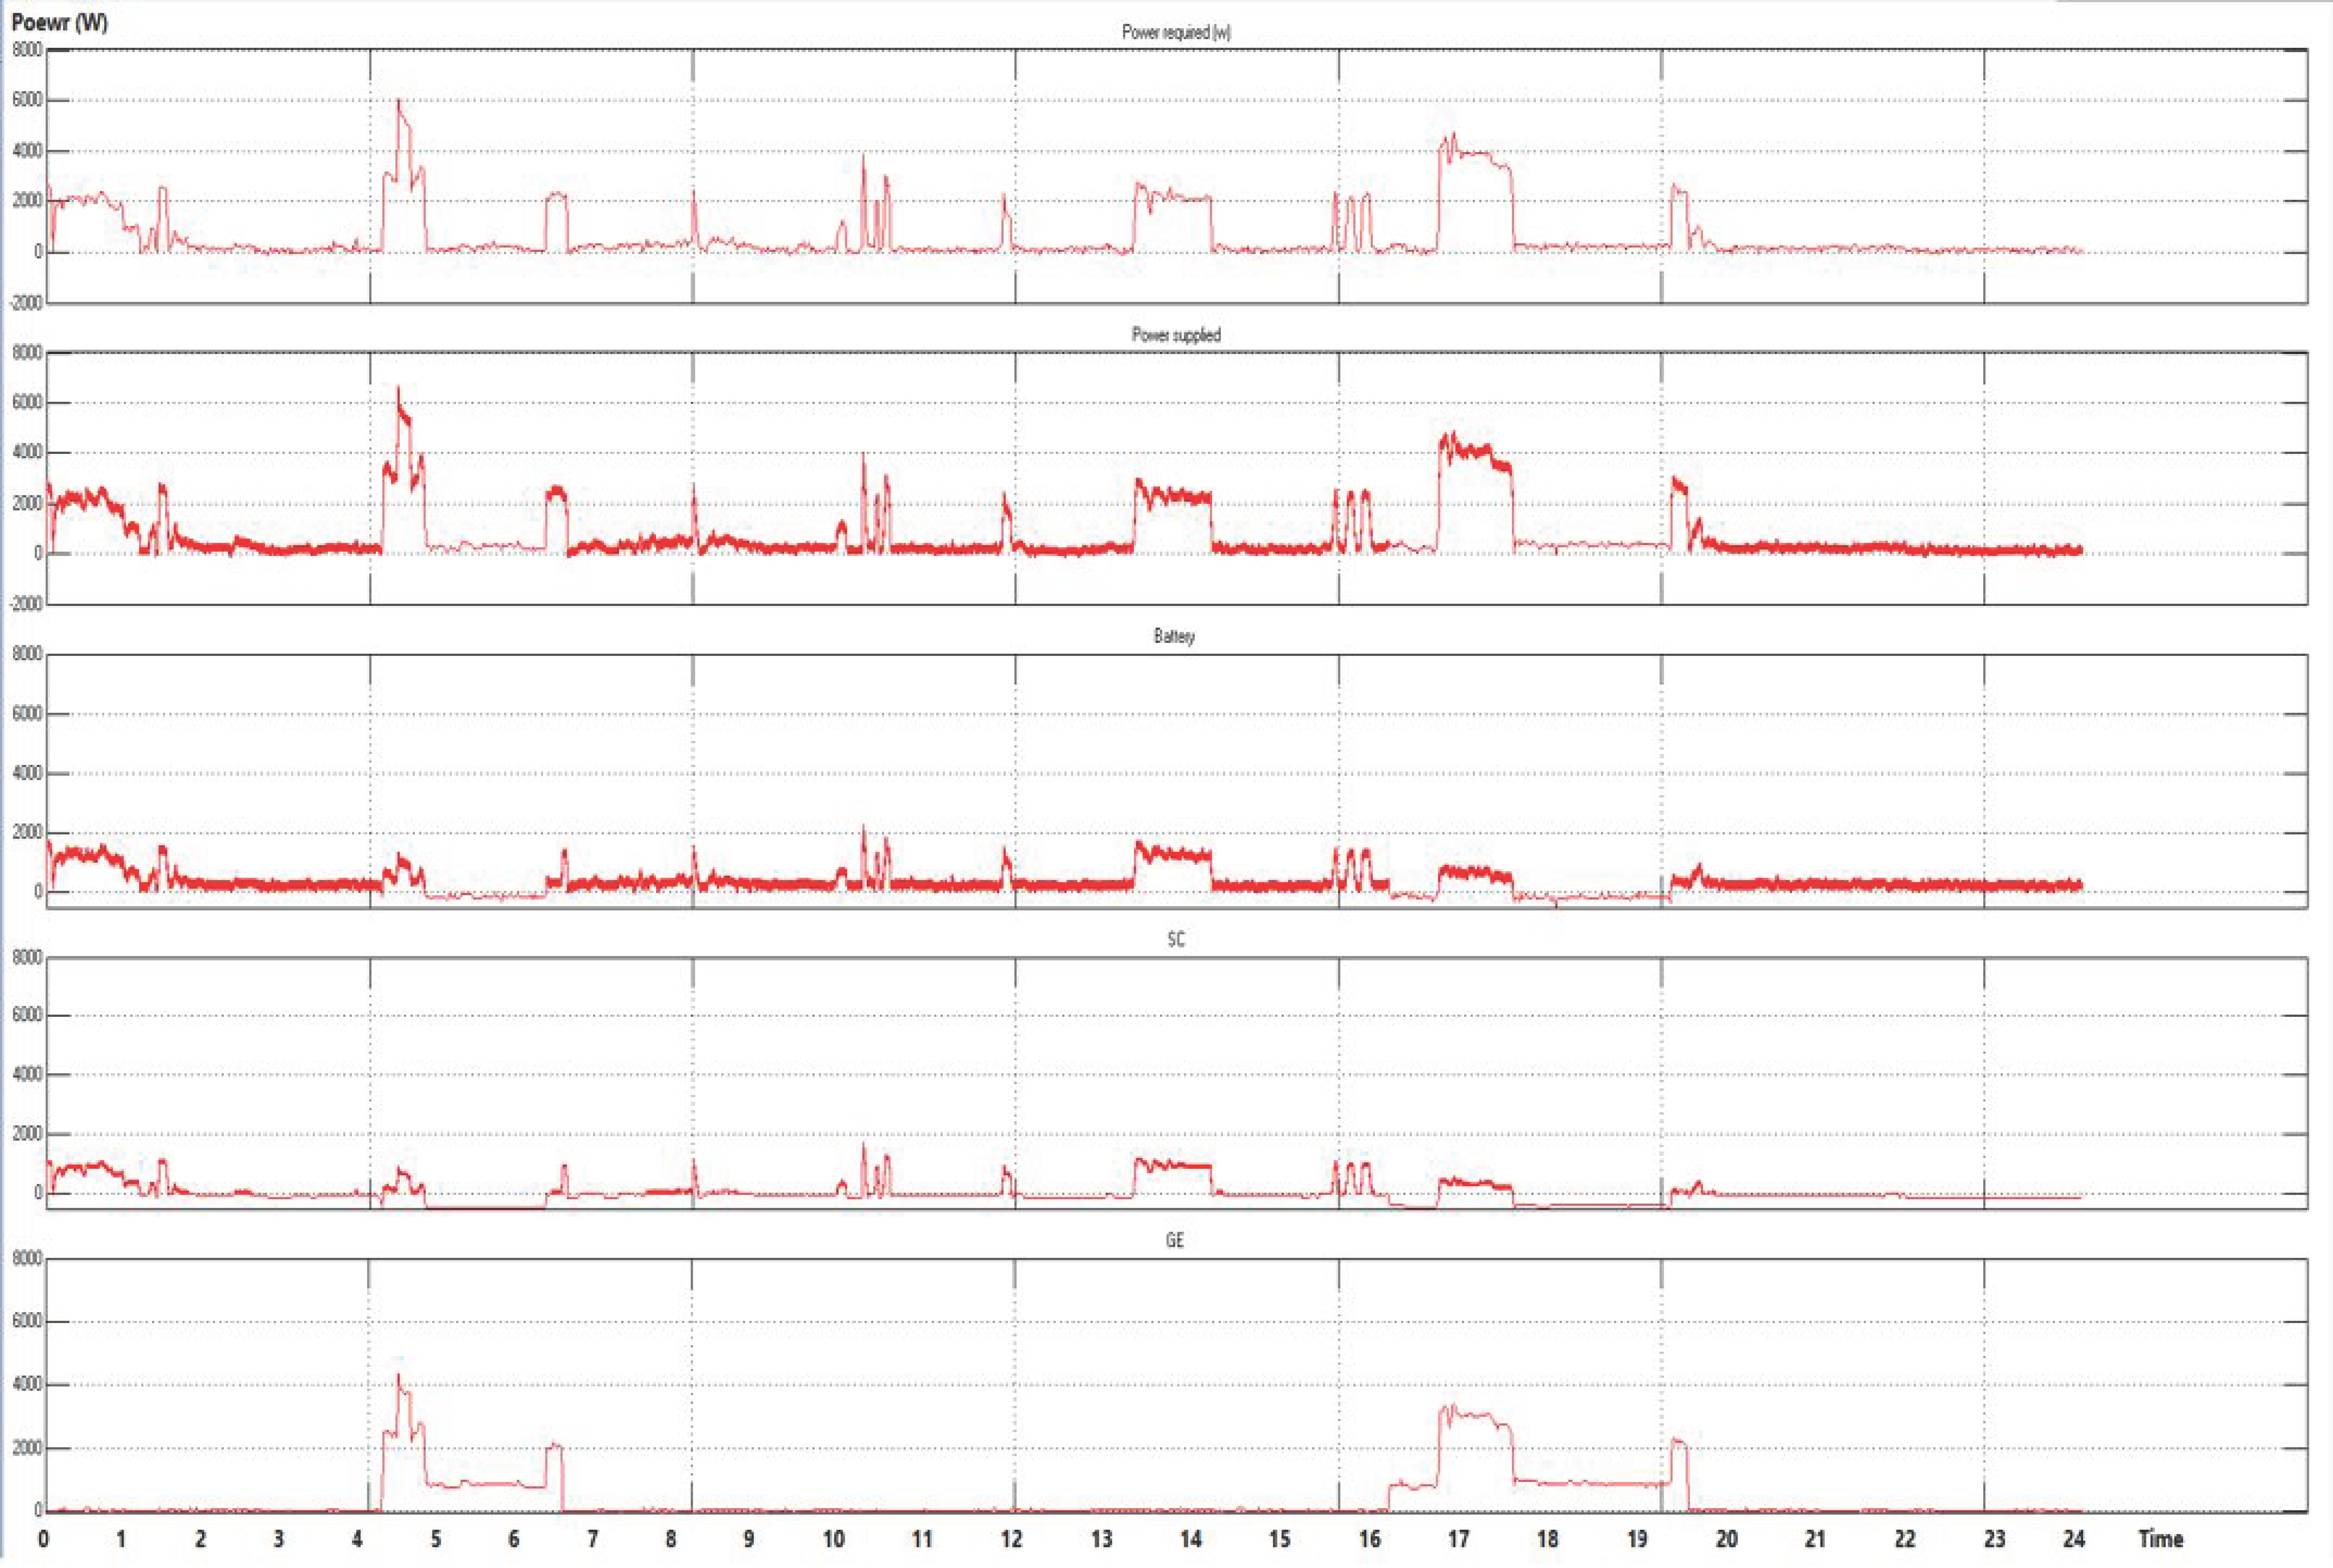
3.1. Summer Day Load

3.1.1. Experimental Result

Figure 4 shows the results from the experimental test. During the test, the generator supplied the domestic load for 24 h with the support from the electric energy storage units. The four curves in the figure are load required (blue line), energy supplied or stored by batteries (red line), energy supplied or stored by supercapacitors (green line) and by the generator (purple line) respectively. In the figure, when the power of batteries and supercapacitor are positive, that means the energy storage units are discharging the power to the load. When the value is negative, it indicates the energy storage units were in charging process. For a summer day load profile, the energy demand fluctuates with the human activities. There are a few energy demand peaks during the 24 h which happen in the morning when people are getting up, in the afternoon when people are back home and in the evening before sleep. The two main peak occurs at round 05:00 am and at 17:00 pm. Most of the peak energy demand lasted for short time. In the figure, the energy supplied by the generator and the energy storage units follow the shape of the energy demand. The generator is designed to be operating only during the peak time. During the two main peak energy demand periods, the generator supplied most of the energy for the load, with a certain amount coming from the storage unit (batteries and supercapacitor); and during the running period of the generator, it also supplies some electricity to the storage units (batteries and supercapacitor) for storage, when the stored electricity was used and reduced. During the rest of the time, the batteries and the supercapacitor supply the energy for the load. As mentioned in the last section, the batteries in the test have larger capacity. In the experimental test, the batteries supplied twice the amount of the electricity compared to the supercapacitors. Batteries supplied the major part of the energy demand and the supercapacitors supplied less energy during the same operation period.

3.1.2. Simulation Result
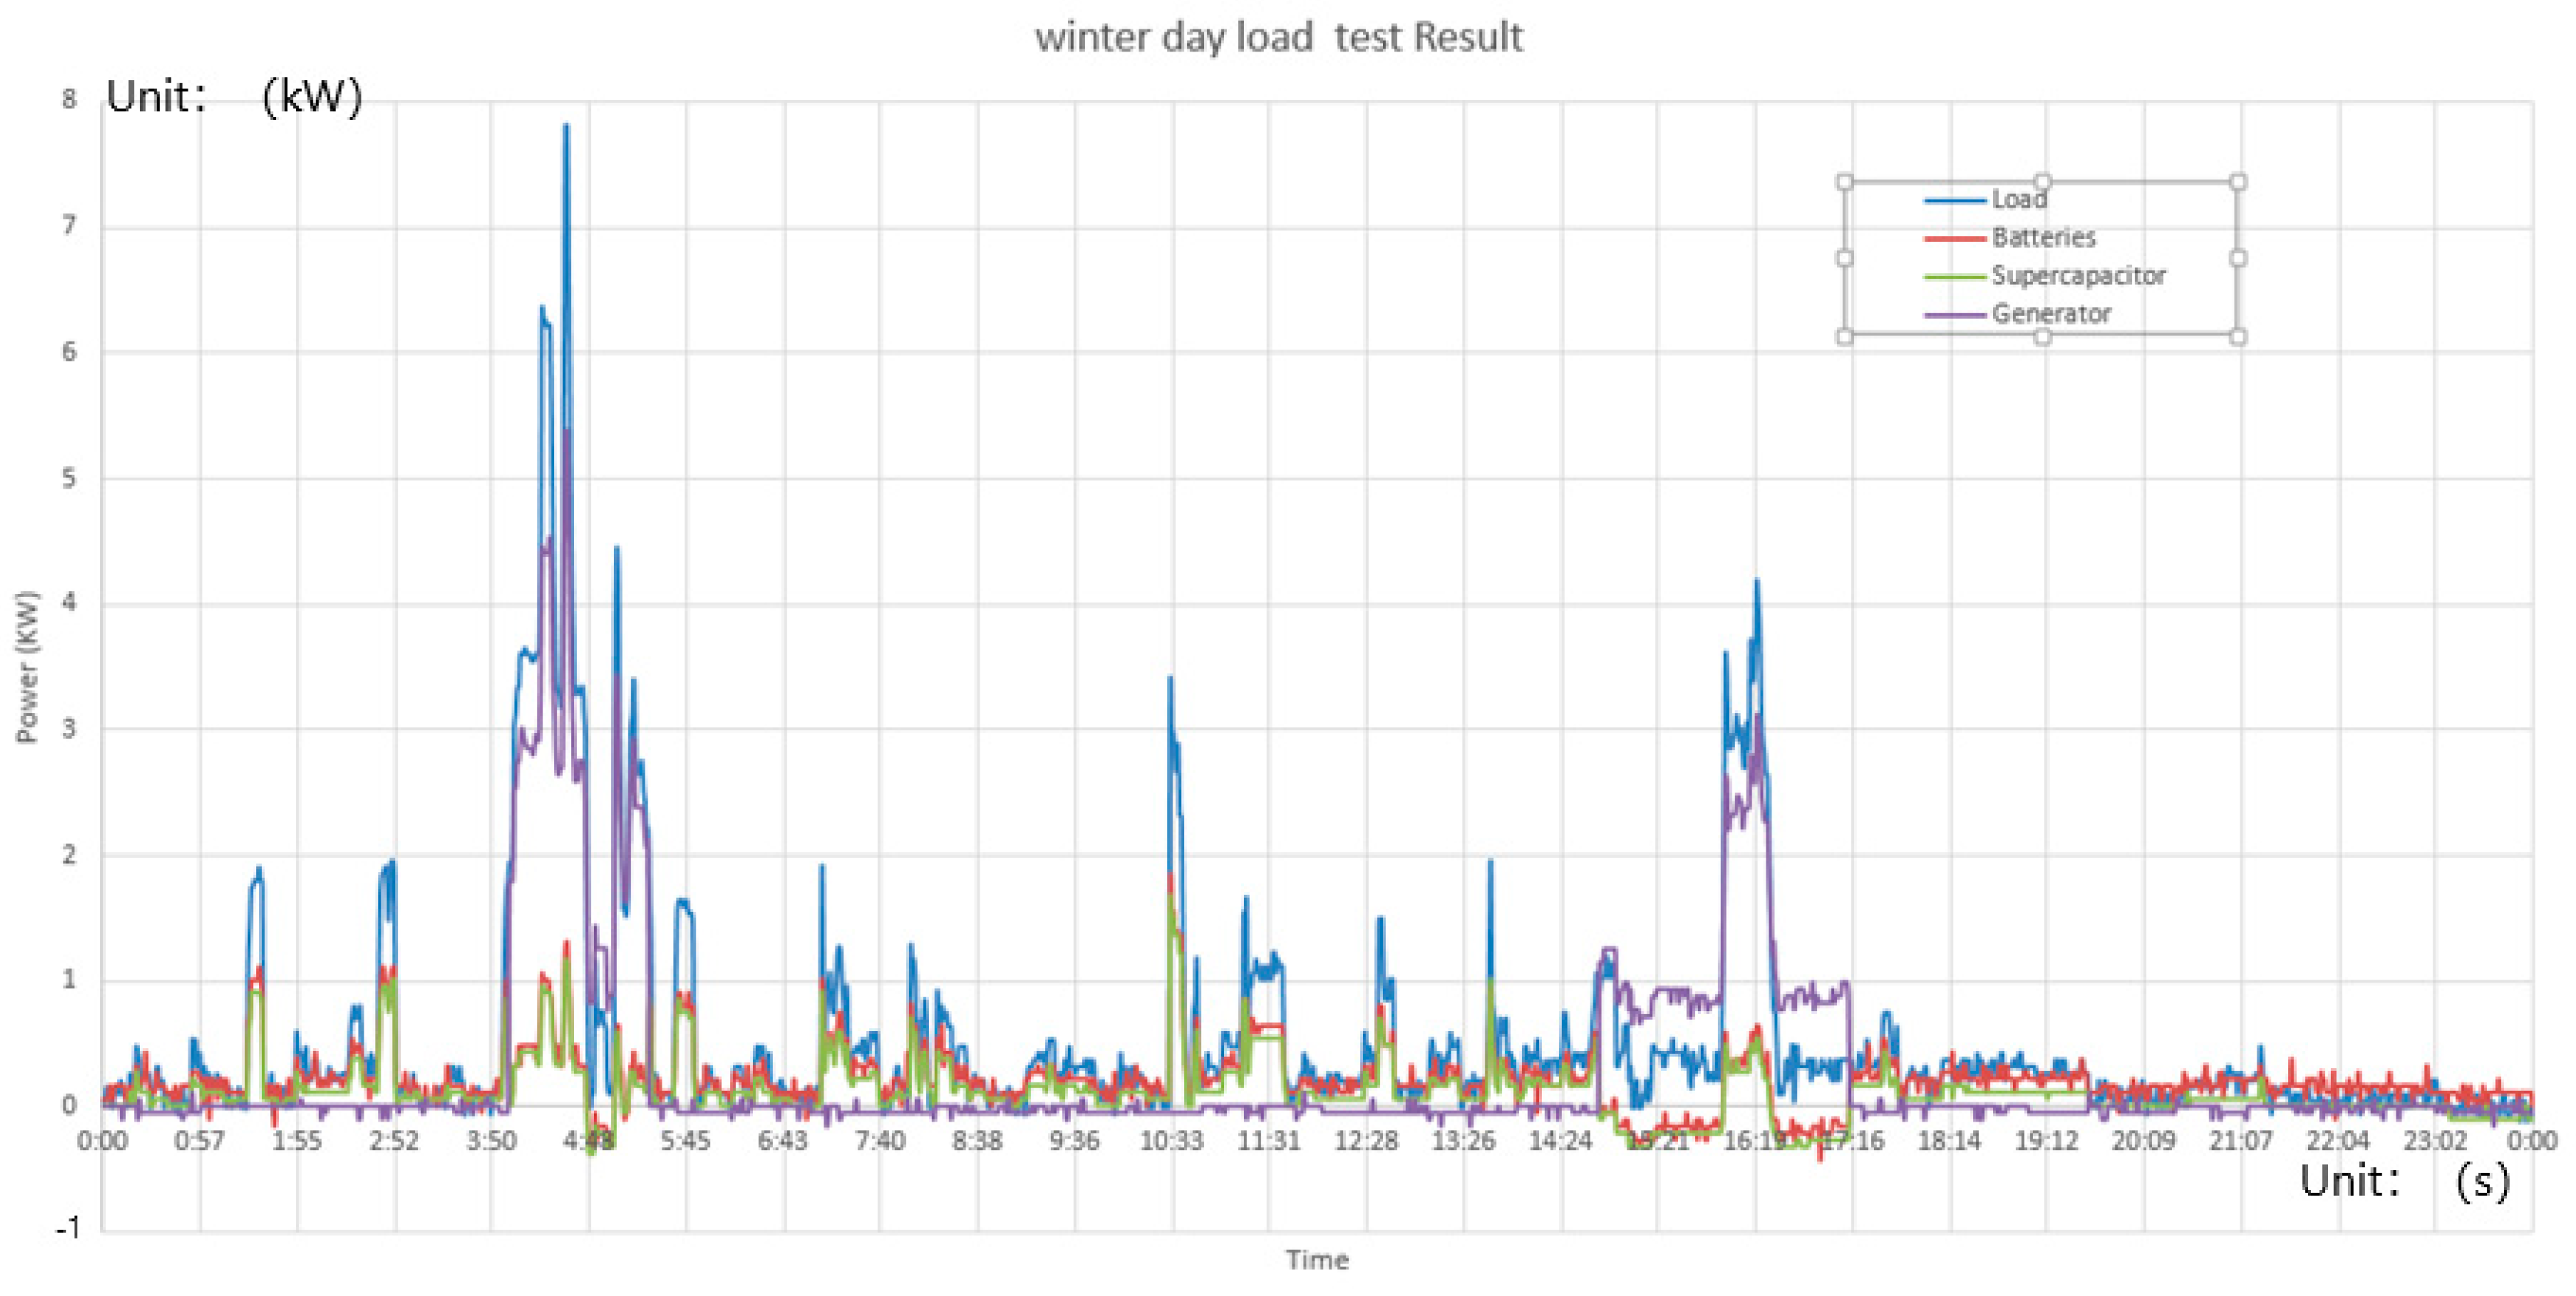
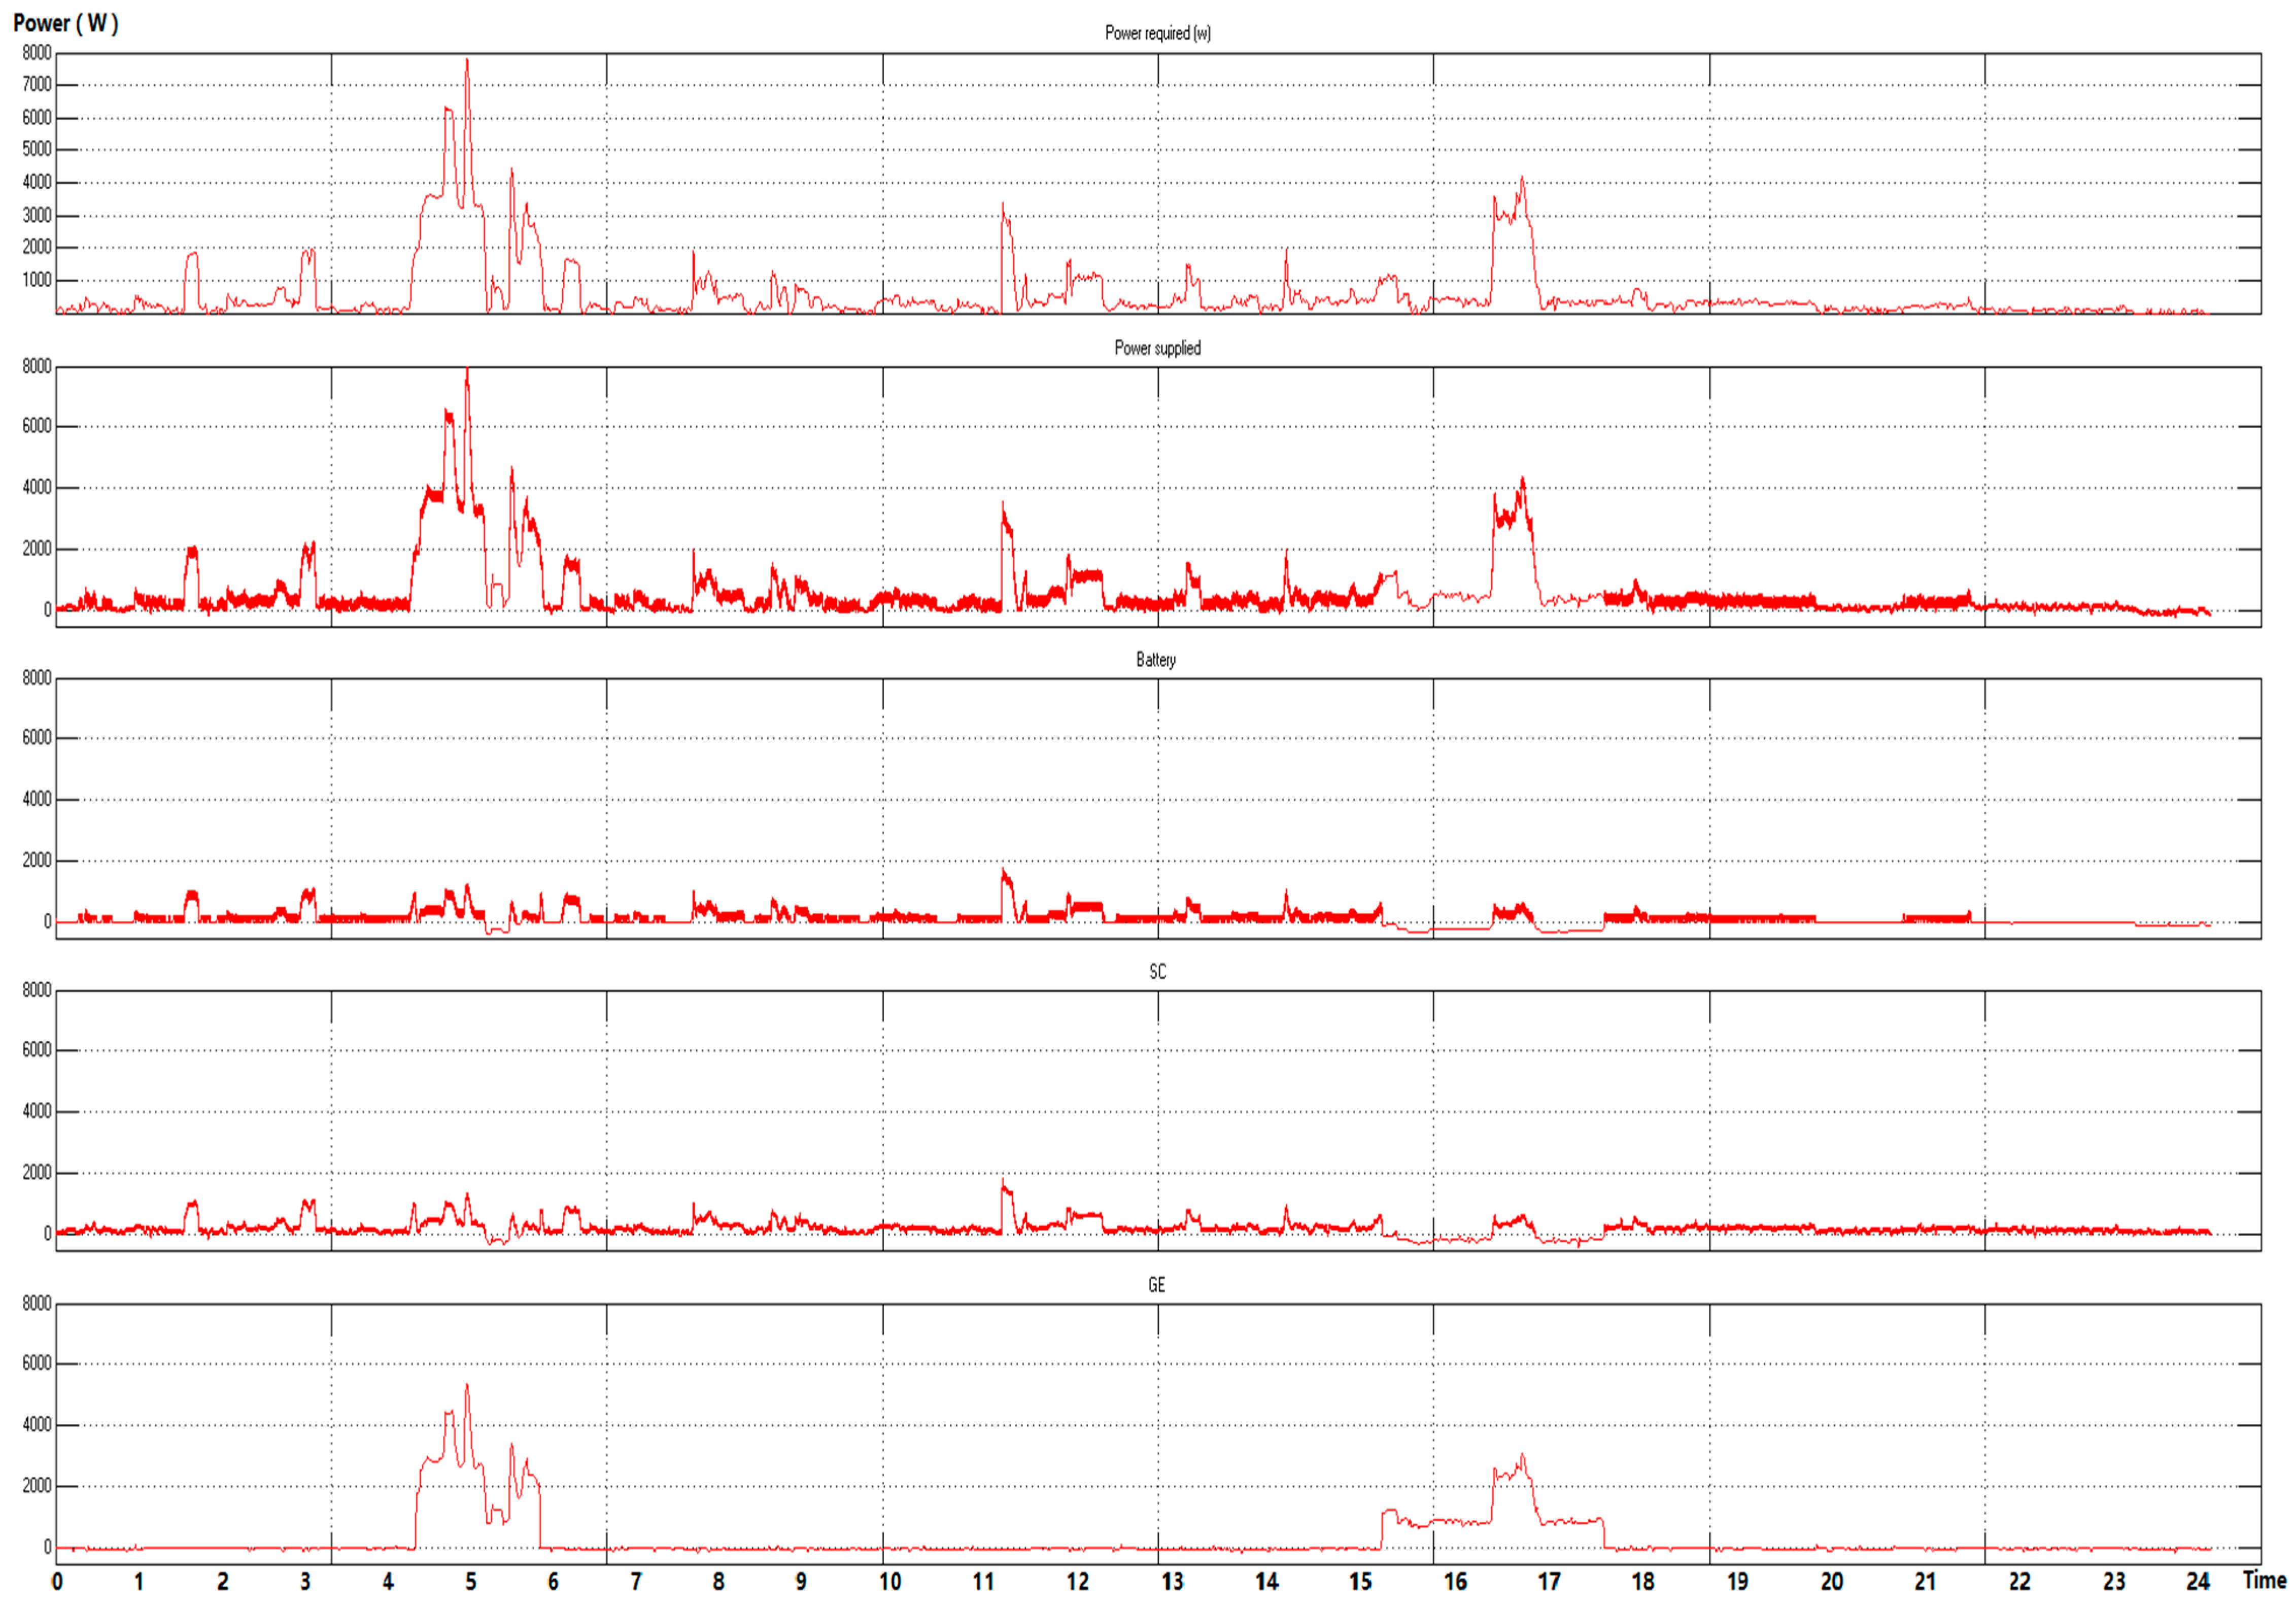
Figure 5 shows the simulation results of the system’s operation on the same summer day shown in Figure 4. The required energy is identical to the load in the experimental test. In the simulation, the generator was designed to operate in the same period and the generator and the electrical energy storage units supply the energy demand.
From the figure, it can be seen that the total electrical energy required equalled the electrical energy supplied. This means that the energy demand is satisfied by the system in this simulation. The amount of energy supplied has a 2.69% error compared to the experimental results, which is acceptable in this simulation. Figure 5 shows that the results from simulation are the same as the experimental test results. The generator only worked during the peak hours. In the two main peak energy demand periods, the generator supplied the energy to the load together with the energy storage units. In the other off-peak energy demand period, the load was satisfied by the energy storage units only.
From the figure, the batteries supplied a larger amount of energy because of their larger capacity. The energy supplied by the supercapacitor had the same trend of energy supply as batteries but supplied less energy compared to the batteries. In the simulation, a power regulator governs the batteries’ power rate. A pulse-width modulation wave was used to the control the operation of the batteries. Most of the error comes from the ripples of batteries’ power rate. During the 24 h simulation period, most of the time the power supply curves of the generator and the energy storage units were similar except when the generator was operating. When the generator was operating, it supplied the load in two scenarios. It charges the energy storage units when the energy demand was fully satisfied. It supplies the load with the energy storage system as soon as the peak demand is higher than the engine’s rate power.

3.2. Winter Day

3.2.1. Experimental Result

In this experimental test, the energy system supplied a winter day load for 24 h. The configuration of the energy system is the same as the experimental data of the test of a summer day. The energy demand of the winter day is similar to that of the summer day, and the peak energy demand lasted for short time. During most of the time in the 24 h the energy demand is less than 2 kW. In the figure, the two main energy demand peak occurs in the morning and in the evening. The energy demand in the morning has the highest energy consumption rate, which is up to 8 kW. There are another two energy peak demand peaks during the rest of the day that reached 3.7 kW (in the noon) and 4.1 kW (in the evening).
Figure 6 shows the experimental results of the system. In the test results chart, the power requirement, the power rate of the generator and the energy storage units are recorded as the figure. The shape of the power supplied by the system followed the power requirement in the test. As shown in the figure, the generator operated only during the peak energy demand time period. When the generator’s power is higher than the power demand, the extra energy is used to charge the energy storage units.

3.2.2. Simulation Results

Figure 7 shows the simulation results of the domestic load on a winter day. Similar to the summer day load simulation, the target of the simulation is to satisfy the energy demand with the system. In the simulation, the loads varied during the 24 h. The first and the second curves in the figure shows the required energy demand in the simulation and the power supplied during the simulation. From the comparison of the two curves, it can be seen that the load was fully supplied by the energy supply system, i.e., the generator and the energy storage system. The error of the simulation was under 2.35%.
The third and the fourth curves are the power supplied by the batteries and the supercapacitors (labelled Battery and SC). The specifications of the equipment are set the same as the energy storage units in the experimental test. During most of the simulation process, the power was supplied by the batteries and the supercapacitors which followed the load. The batteries supplied roughly two times more energy than the supercapacitors. The fifth curve was the energy supplied by the engine. When the engine was working, a large amount of energy was used to supply the peak electrical load. The extra energy was used to charge the energy storage units to keep the batteries’ state of charge (SOC) and the charge of supercapacitor in the designed range.

4. Optimisation Results and Discussion

The optimization results of the engine’s operation for the summer load and the winter load are shown in Figure 8 and Figure 9, respectively. Table 2 shows a comparison of the original operation and the optimised operation of the distributed power generation system with energy storage. As discussed in the system optimization design in the last section, the primary energy consumption can be saved by reducing the engine’s operation time. In the original operation of the system, the engine worked during the peak energy demand time period. The engine’s operation was adjusted based on the peak power. Because of the engine’s maximum electrical efficiency can only be reached when the engine is working at full load, reduction of the engine’s operation time accounts for a certain part of primary energy savings. The table shows that, for both sets of simulations, the engine supplied most of the energy and the energy storage units supplied the rest of energy demand. After the system optimization process, the operation time of engine shows a significant reduction. The energy saved by the process was 3.61 kWh (for the summer load) and 1.86 kWh (for the winter load) which shows a remarkable enhancement. Comparing the simulation results for the summer load and the winter load, with the previous experimental and simulation results, the operation time of the engine generator was shorter. The engine generator operation time was cut down by 1.47 h on the summer day and 0.86 on the winter day. The energy saved was 3.61% in summer and 1.86% in winter.

5. Economic Analysis of the EG System

In order to obtain a comprehensive understanding of the economic efficiency of the presented energy system, an economic analysis of the DG-ES system estimates the price of the energy generation. A levelized cost of electricity which includes the fuel cost and the capital costs of the equipment is discussed in this section.
The maximum power of the system is designed as 10 kW. The primary energy source- the diesel engine electricity generator is a 6.5 kW Yanmar engine generator. It consumes diesel oil for electricity generation. The selection of the energy storage system includes the product selection of batteries and supercapacitors. Aiming at serving small load, the most appropriate capacity of battery is: 12 V 38 AH. The corresponding capacity of the Supercapacitor is: 12 V 300 F. The equipment initial cost and the energy production cost are shown in Table 3.
Although the EG-ES system could be an alternative method for supplying energy, the initial cost if over 3300 £ in the selected area. The purchase and installation fee of the diesel engine is estimated to be 1350 £. For an extra 690 £, the householder can upgrade the capacity of the house’s distributed power system. For another 1450 £ and 450 £, the supercapacitor module can be added for a more stable power supplying under the optimisation control system. Furthermore, the cost of energy generation is also a bit higher than the centralized power generation plants. Even though the EG-ES system is not the cheapest option for energy generation, the investigation for this structure of system is meaningful for further research in the area of integrated energy system.

6. Conclusions

  • From the experimental tests and the computational simulation on the DG-ES system, it is proved that the designed DG-ES can meet the selected 24-hours’ dynamic load demands with stable operation during either winter or summer.
  • The maximum error of the two sets of simulation are 2.69% and 2.35%, respectively. The simulation of the system has successfully predicted the performance of the system.
  • The performance of the DG-ES system can be improved through optimised operation process. The results showed that the energy saved was 3.61% in summer and 1.86% in winter, compared to the original operation arrangement.

Author Contributions

Conceptualization, J.J.; methodology, W.N.; software, C.M.; validation, J.J.; formal analysis, J.J.; investigation, J.J.; resources, K.T.; data curation, J.J.; writing—original draft preparation, J.J.; writing—review and editing, X.X.; visualization, J.J.; supervision, Y.W. and T.R.; project administration, Y.W.; funding acquisition, Y.W.”

Funding

This research received no external funding.

Acknowledgments

Thanks to all the supports given by my colleagues. I especially thank the guidance from my supervisor Yaodong Wang.

Conflicts of Interest

The authors declare no conflict of interest.

Nomenclature

P f u e l Power the primary energy can release
η e n g i n e Efficiency of engine
P e n g i n e Power of diesel engine generator
P s Power of energy storage system
P S U Power of supercapacitor
P B T Power of batteries
P L O A D Energy demand of load
S O C Batteries’ state of charge
t e At the end of operation time
C S Batteries’ capacity
DG-ESDistributed power generation with energy storage system
t1Starting time of peak time zone 1
t2Starting time of peak time zone 1
topOptimised time of engine operation
E Generated Electromotive Force (EMF) in volts
φ Air gap flux per pole in webers
Ω Angular velocity in radians per second
T d Developed torque in newton-meters
T d Armature current in amperes
K constant for the given machine
η Electrical efficiency of the engine
I A The armature current of the engine
ε dielectric constant
E the electric field intensity
CVolume of the supercapacitor
U The operation voltage of the supercapacitor
t1eEnding time of peak time zone 1
t2eEnding time of peak time zone 1

References

  1. Clark, W.; Isherwood, W. Distributed generation: Remote power systems with advanced storage technologies. Energy Policy 2004, 32, 1573–1589. [Google Scholar] [CrossRef]
  2. Pepermans, G.; Driesen, J.; Haeseldonckx, D.; Belmans, R.; D’haeseleer, W. Distributed generation: Definition, benefits and issues. Energy Policy 2005, 33, 787–798. [Google Scholar] [CrossRef]
  3. Zubo, R.H.A.; Mokryani, G.; Rajamani, H.-S.; Aghaei, J.; Niknam, T.; Pillai, P. Operation and planning of distribution networks with integration of renewable distributed generators considering uncertainties: A review. Renew. Sustain. Energy Rev. 2018, 72, 1177–1198. [Google Scholar] [CrossRef]
  4. Theo, W.L.; Lim, J.S.; Ho, W.S.; Hashim, H.; Lee, C.T. Review of distributed generation (DG) system planning and optimisation techniques: Comparison of numerical and mathematical modelling methods. Renew. Sustain. Energy Rev. 2017, 67, 531–573. [Google Scholar] [CrossRef]
  5. Moreno-Munoz, A.; de-la-Rosa, J.J.G.; Lopez-Rodriguez, M.A.; Flores-Arias, J.M.; Bellido-Outerino, F.J.; Ruiz-de-Adana, M. Improvement of power quality using distributed generation. Int. J. Electr. Power Energy Syst. 2010, 32, 1069–1076. [Google Scholar] [CrossRef]
  6. Evangelisti, S.; Lettieri, P.; Clift, R.; Borello, D. Distributed generation by energy from waste technology: A life cycle perspective. Process Safety Environ. Prot. 2015, 93, 161–172. [Google Scholar] [CrossRef]
  7. Touretzky, C.R.; McGuffin, D.L.; Ziesmer, J.C.; Baldea, M. The effect of distributed electricity generation using natural gas on the electric and natural gas grids. Appl. Eng. 2016, 177, 500–514. [Google Scholar] [CrossRef]
  8. Abbassi, A.; Dami, M.A.; Jemli, M. A statistical approach for hybrid energy storage system sizing based on capacity distributions in an autonomous PV/Wind power generation system. Renew. Energy 2017, 103, 81–93. [Google Scholar] [CrossRef]
  9. Ho, W.S.; Macchietto, S.; Lim, J.S.; Hashim, H.; Muis, Z.A.; Liu, W.H. Optimal scheduling of energy storage for renewable energy distributed energy generation system. Renew. Sustain. Energy Rev. 2016, 58, 1100–1107. [Google Scholar] [CrossRef]
  10. Erdinc, O.; Paterakis, N.G.; Pappi, I.N.; Bakirtzis, A.G.; Catalão, J.P.S. A new perspective for sizing of distributed generation and energy storage for smart households under demand response. Appl. Eng. 2015, 143, 26–37. [Google Scholar] [CrossRef]
  11. Zheng, M.; Meinrenken, C.J.; Lackner, K.S. Smart households: Dispatch strategies and economic analysis of distributed energy storage for residential peak shaving. Appl. Eng. 2015, 147, 246–257. [Google Scholar] [CrossRef] [Green Version]
  12. Falke, T.; Krengel, S.; Meinerzhagen, A.-K.; Schnettler, A. Multi-objective optimization and simulation model for the design of distributed energy systems. Appl. Eng. 2016, 184, 1508–1516. [Google Scholar] [CrossRef]
  13. Wang, Y.; Ronilaya, F.; Chen, X.; Roskilly, A.P. Reprint of “Modelling and simulation of a distributed power generation system with energy storage to meet dynamic household electricity demand”. Appl. Thermal Eng. 2013, 53, 312–324. [Google Scholar] [CrossRef]
  14. Brandoni, C.; Renzi, M. Optimal sizing of hybrid solar micro-CHP systems for the household sector. Appl.Thermal Eng. 2015, 75, 896–907. [Google Scholar] [CrossRef]
  15. Widmann, C.; Lödige, D.; Toradmal, A.; Thomas, B. Enabling CHP units for electricity production on demand by smart management of the thermal energy storage. Appl. Thermal Eng. 2017, 114, 1487–1497. [Google Scholar] [CrossRef]
  16. Magnani, S.; Pezzola, L.; Danti, P. Design Optimization of a Heat Thermal Storage Coupled with a Micro-CHP for a Residential Case Study. Energy Procedia 2016, 101, 830–837. [Google Scholar] [CrossRef]
  17. Ebrahimi, M.; Keshavarz, A. 1-CCHP Literature. In Combined Cooling, Heating and Power; Elsevier: Boston, MA, USA, 2015; pp. 1–34. [Google Scholar]
  18. Bang-Møller, C.; Rokni, M.; Elmegaard, B.; Ahrenfeldt, J.; Henriksen, U.B. Decentralized combined heat and power production by two-stage biomass gasification and solid oxide fuel cells. Energy 2013, 58, 527–537. [Google Scholar] [CrossRef]
  19. Yagoub, W.; Doherty, P.; Riffat, S.B. Solar energy-gas driven micro-CHP system for an office building. Appl. Thermal Eng. 2006, 26, 1604–1610. [Google Scholar] [CrossRef]
  20. Antonucci, V.; Branchini, L.; Brunaccini, G.; de Pascale, A.; Ferraro, M.; Melino, F.; Orlandini, V.; Sergi, F. Thermal integration of a SOFC power generator and a Na–NiCl2 battery for CHP domestic application. Appl. Energy 2017, 185, 1256–1267. [Google Scholar] [CrossRef]
  21. Li, J.; Wang, X.; Zhang, Z.; le Blond, S.; Yang, Q.; Zhang, M.; Yuan, W. Analysis of a new design of the hybrid energy storage system used in the residential m-CHP systems. Appl. Energy 2017, 187, 169–179. [Google Scholar] [CrossRef] [Green Version]
  22. Yagoub, M.Y.A.; Swart, H.C.; Coetsee, E. Energy transfer study between Ce3+ and Tb3+ ions in a calcium fluoride crystal for solar cell applications. J. Luminesc. 2017, 187, 96–101. [Google Scholar] [CrossRef]
  23. McKenna, E.; McManus, M.; Cooper, S.; Thomson, M. Economic and environmental impact of lead-acid batteries in grid-connected domestic PV systems. Appl. Energy 2013, 104, 239–249. [Google Scholar] [CrossRef] [Green Version]
  24. Morin, B.; Hennessy, J.; Arora, P. 11-Developments in nonwovens as specialist membranes in batteries and supercapacitors A2—Kellie, George. In Advances in Technical Nonwovens; Woodhead Publishing: Cambridgeshire, UK, 2016; pp. 311–337. [Google Scholar]
  25. Zhang, S.; Xiong, R.; Cao, J. Battery durability and longevity based power management for plug-in hybrid electric vehicle with hybrid energy storage system. Appl. Energy 2016, 179, 316–328. [Google Scholar] [CrossRef]
  26. Chong, L.W.; Wong, Y.W.; Rajkumar, R.K.; Isa, D. Modelling and Simulation of Standalone PV Systems with Battery-supercapacitor Hybrid Energy Storage System for a Rural Household. Energy Procedia 2017, 107, 232–236. [Google Scholar] [CrossRef]
  27. Bogno, B.; Sawicki, J.-P.; Salame, T.; Aillerie, M.; Saint-Eve, F.; Hamandjoda, O.; Tibi, B. Improvement of safety, longevity and performance of lead acid battery in off-grid PV systems. Int. J. Hydrog. Energy 2017, 42, 3466–3478. [Google Scholar] [CrossRef]
Figure 1. Schematic diagram of the experimental test rig of distributed power generation system with energy storage system.
Energies 12 01091 g001
Figure 2. The data acquisition card S3100 and the signal condition circuits; (a) data acquisition card; (a) electronic board for signal collection.
Energies 12 01091 g002
Figure 3. The computational model of the DG-ES system configuration.
Energies 12 01091 g003
Figure 4. A typical summer day load test result.
Energies 12 01091 g004
Figure 5. Summer day simulation results.
Energies 12 01091 g005
Figure 6. Winter day test results.
Energies 12 01091 g006
Figure 7. Winter day simulation results.
Energies 12 01091 g007
Figure 8. Summer load optimization results.
Energies 12 01091 g008
Figure 9. Winter load optimisation results.
Energies 12 01091 g009
Table 1. Engine simulation results and errors.
Load of the Engine (%)Engine Efficiency (%)Error (%)
000
107.81.13
2516.360.36
5024.30.41
7527.530.82
10028.51.42
Table 2. Optimisation results summary.
Core Parameters about System’s OperationSummer LoadWinter Load
Energy required (kWh)9.767.28
Energy supplied (kWh)9.817.36
Energy supplied by the engine (kWh)7.384.33
Energy supplied by the storage units (kWh)2.233.03
Maximum battery power (kW)2.1131.96
Maximum supercapacitor power (kW)1.0781.76
Simulation error (%)2.692.35
Previous engine working time (h)43.83
Improved engine working time (h)1.470.86
Energy saved by the optimization process (kWh)3.611.86
Table 3. Cost analysing of the system.
Equipment Initial Cost
Diesel engine1350 £
Lead acid batteries 6 sets115 × 6 = 690 £
Supercapacitor 12 V 300 F1450 £
Control system for optimisation450 £ (including software and hardware)
System constructionFuel consumptionCost of energy production
Centralized power generation plant\0.15 £/kWh
Diesel engine generator with CHP0.2 L/kWh0.262
Diesel engine generator with ORC0.22 L/kWh0.288

