Application of the Nacelle Transfer Function by a Nacelle-Mounted Light Detection and Ranging System to Wind Turbine Power Performance Measurement

1
Multidisciplinary Graduate School Program for Wind Energy, Jeju National University, 102 Jejudaehakro, Jeju 63243, Korea
2
Faculty of Wind Energy Engineering, Graduate School, Jeju National University, 102 Jejudaehakro, Jeju 63243, Korea
*
Author to whom correspondence should be addressed.
Energies 2019, 12(6), 1087; https://doi.org/10.3390/en12061087
Submission received: 17 February 2019
/
Revised: 15 March 2019
/
Accepted: 15 March 2019
/
Published: 21 March 2019
(This article belongs to the Section F: Electrical Engineering)
Abstract
:To examine the applicability of the nacelle transfer function (NTF) derived from nacelle light detection and ranging (LIDAR) measurements to wind turbine power performance testing without a met mast, wind turbine power performance measurement was carried out at the Dongbok wind farm on Jeju Island, South Korea. A nacelle LIDAR was mounted on the nacelle of a 2-MW wind turbine to measure wind conditions in front of the turbine rotor, and an 80-m-high met mast was installed near another wind turbine to measure the free-stream wind speed. The power measurement instruments were installed in the turbine tower base, and wind speeds measured by the nacelle anemometer of the turbine were collected by the SCADA (Supervisory control and data acquisition) system. The NTF was determined by the table method, and then the power curve drawn using the NTF by the nacelle LIDAR (PCNTF, NL) was compared with the power curves drawn in compliance with International Electrotechnical Commission (IEC) standards, 61400-12-1 and 61400-12-2. Next, the combined standard uncertainties of the power curves were calculated to clarify the magnitude of the components of the uncertainties. The uncertainties of annual energy production (AEP) were also estimated by assuming that wind speed is a Rayleigh cumulative distribution. As a result, the PCNTF, NL was in good agreement with the power curves drawn in accordance with the IEC standards. The combined standard uncertainty of PCNTF, NL was almost the same as that of the power curve based on IEC 61400-12-2.
1. Introduction
Wind energy is the most well-known form of renewable energy. Studies on wind resource assessment, wind farm design, and wake effect analysis [1,2,3,4,5,6] have been conducted to increase the energy efficiency of wind farms. To obtain reliable results from these studies, accurate wind measurement is very important, for which the installation of a met mast is essential. However, installing a met mast is expensive and time consuming. In particular, it is known to be very difficult to install an offshore met mast in the ocean for measuring offshore wind conditions.
IEC 61400-12-1 1st edition [7] for wind turbine power performance testing requires installing a met mast with a hub height within a distance of 2 to 4 times the rotor diameter from a test wind turbine. Although power performance testing should be carried out for all wind turbines at a wind farm, it has been generally performed for a representative wind turbine due to the difficulty in installing met masts for all turbines. IEC 61400-12-2 [8] describes the methodology to estimate power curves of multiple wind turbines using the nacelle transfer function (NTF), which is the correlation between wind speeds measured using a cup anemometer on a met mast and a nacelle anemometer on a wind turbine. Using the NTF derived from a representative wind turbine, the power performance of other wind turbines can be evaluated if some requirements are satisfied. Kim et al. [9] conducted power performance testing for two 3-MW wind turbines in compliance with the IEC 61400-12-2 procedure. Shin et al. [10,11,12] proposed a method for identifying wind turbine degradation using NTF and analysed the annual capacity factor reduction rate for multiple wind turbines.
Light detection and ranging (LIDAR) systems have received attention from the wind energy industry because of the advantages, including easy installation and a wide measurement range. Based on many research results on the reliability verification of ground LIDAR wind data [13,14,15,16,17,18,19,20,21], the IEC 61400-12-1 2nd edition was published in 2015 [22]. It describes the procedure and requirements for a wind turbine power performance test using the rotor equivalent wind speed (REWS), which considers the wind shear covering the wind turbine rotor swept area. For this, the wind data above a hub height should be measured, for which the ground LIDAR has been mostly used.
Recently, many investigations have been conducted to apply the nacelle LIDAR to wind turbine power performance testing. Wagner et al. [23,24,25,26,27] proposed a procedure for drawing a wind turbine power curve using nacelle LIDAR measurements and evaluated the uncertainty of the power curve. Shin et al. [28,29] clarified the reliability of the nacelle LIDAR measurements through comparison with the reference cup anemometer wind data. They also compared the power curves from the nacelle LIDAR, the cup anemometer and REWS measurements, which led to the conclusion that the nacelle LIDAR power curve was quite similar to the other power curves, with a relative error of less than 3.01% [30]. According to the demand for using nacelle LIDAR for power performance testing, the project team IEC 61400-50-3 was organized and has been working to publish the official international standard by the end of 2020 so that nacelle LIDAR can be used for wind turbine power performance testing without a met mast [31].
If it is possible to apply NTF derived from nacelle LIDAR measurements without a met mast to power performance testing, power curves of other wind turbines can be drawn, which will be done at a comparatively low cost and in a short period of time. In particular, it will be helpful for offshore wind turbine testing. The purpose of this study is to identify the applicability of NTF from nacelle LIDAR measurements (NTFNL) to wind turbine power performance measurements without a met mast and to further estimate the uncertainties of the power curves and the annual energy productions (AEP). NTFNL was derived from the correlation between the wind data from a nacelle LIDAR and a nacelle anemometer on a 2-MW wind turbine. For the same types of wind turbines as the test wind turbine, PCsNTF, NL were compared with the power curves using the cup anemometer wind speed in IEC 61400-12-1 (PCCup), the wind speed corrected using NTFCup in IEC 61400-12-2 (PCNTF, Cup) and the nacelle LIDAR wind speed (PCNL). In addition, the combined standard uncertainties of the power curves were evaluated, and the uncertainties of each component involved in their construction were estimated in detail. Finally, the uncertainties of AEP (uAEP) were evaluated assuming that the wind follows a Rayleigh wind distribution.
2. Test Setup
2.1. Test Site
This study was performed at the Dongbok wind farm on Jeju Island, South Korea. The island is located off the southern part of the Korean peninsula, and the Dongbok wind farm is situated on the north-eastern part of the island, as shown in Figure 1. Fifteen 2-MW wind turbines were in operation, and wind turbines no. 1 and 15 were tested in this work. A nacelle LIDAR was installed on the nacelle of wind turbine no. 1, and a met mast was positioned at 2.5 times the rotor diameter from wind turbine no. 15. Topographical conditions were slightly complex, with a ruggedness index (RIX) of 0.2. There are two quarries to the south and north of wind turbine no. 1.
To exclude the wind data disturbed by the wake due to blade rotation of neighbouring wind turbines and the two quarries, the measurement sectors were determined using Equations (1) and (2):
where De is the equivalent rotor diameter. lh and lw are the respective height and width of the obstacle. Dn is the rotor diameter of a nearby wind turbine. Le and Ln are the distance from the neighbouring wind turbine and obstacle, respectively.
The calculated measurement sectors were from 223° to 347° for wind turbine no. 1 and from 333° to 97° for wind turbine no. 15, as shown in Figure 1. The 10-min average wind conditions for one year from 1 January 2017 to 31 December 2017 were measured by the nacelle LIDAR, the met mast, and the nacelle anemometers on the wind turbines, and these were analysed in this work.
2.2. Test Turbines and Measurement Instruments
Table 1 presents the specifications of the wind turbines (no. 1 and 15) tested in this work; they are the same 2-MW wind turbines, HJWT 2000. Their hub height and rotor diameter are 80 m and 87 m, respectively.
Table 2 presents specifications of nacelle wind sensors and the supervisory control and data acquisition (SCADA) system. The nacelle anemometers and the nacelle wind vanes were installed on the top of the nacelle, and the wind data were collected by the SCADA system, whose model is Gateway, developed by Mita-teknik.
Table 3 shows the specifications of electric power measurement instruments. The current transformer and the power transducer of class 0.5 were used in the wind turbine tower bases in compliance with IEC 61400-12-2. The electric power measured by the instruments was used as power output data in this work.
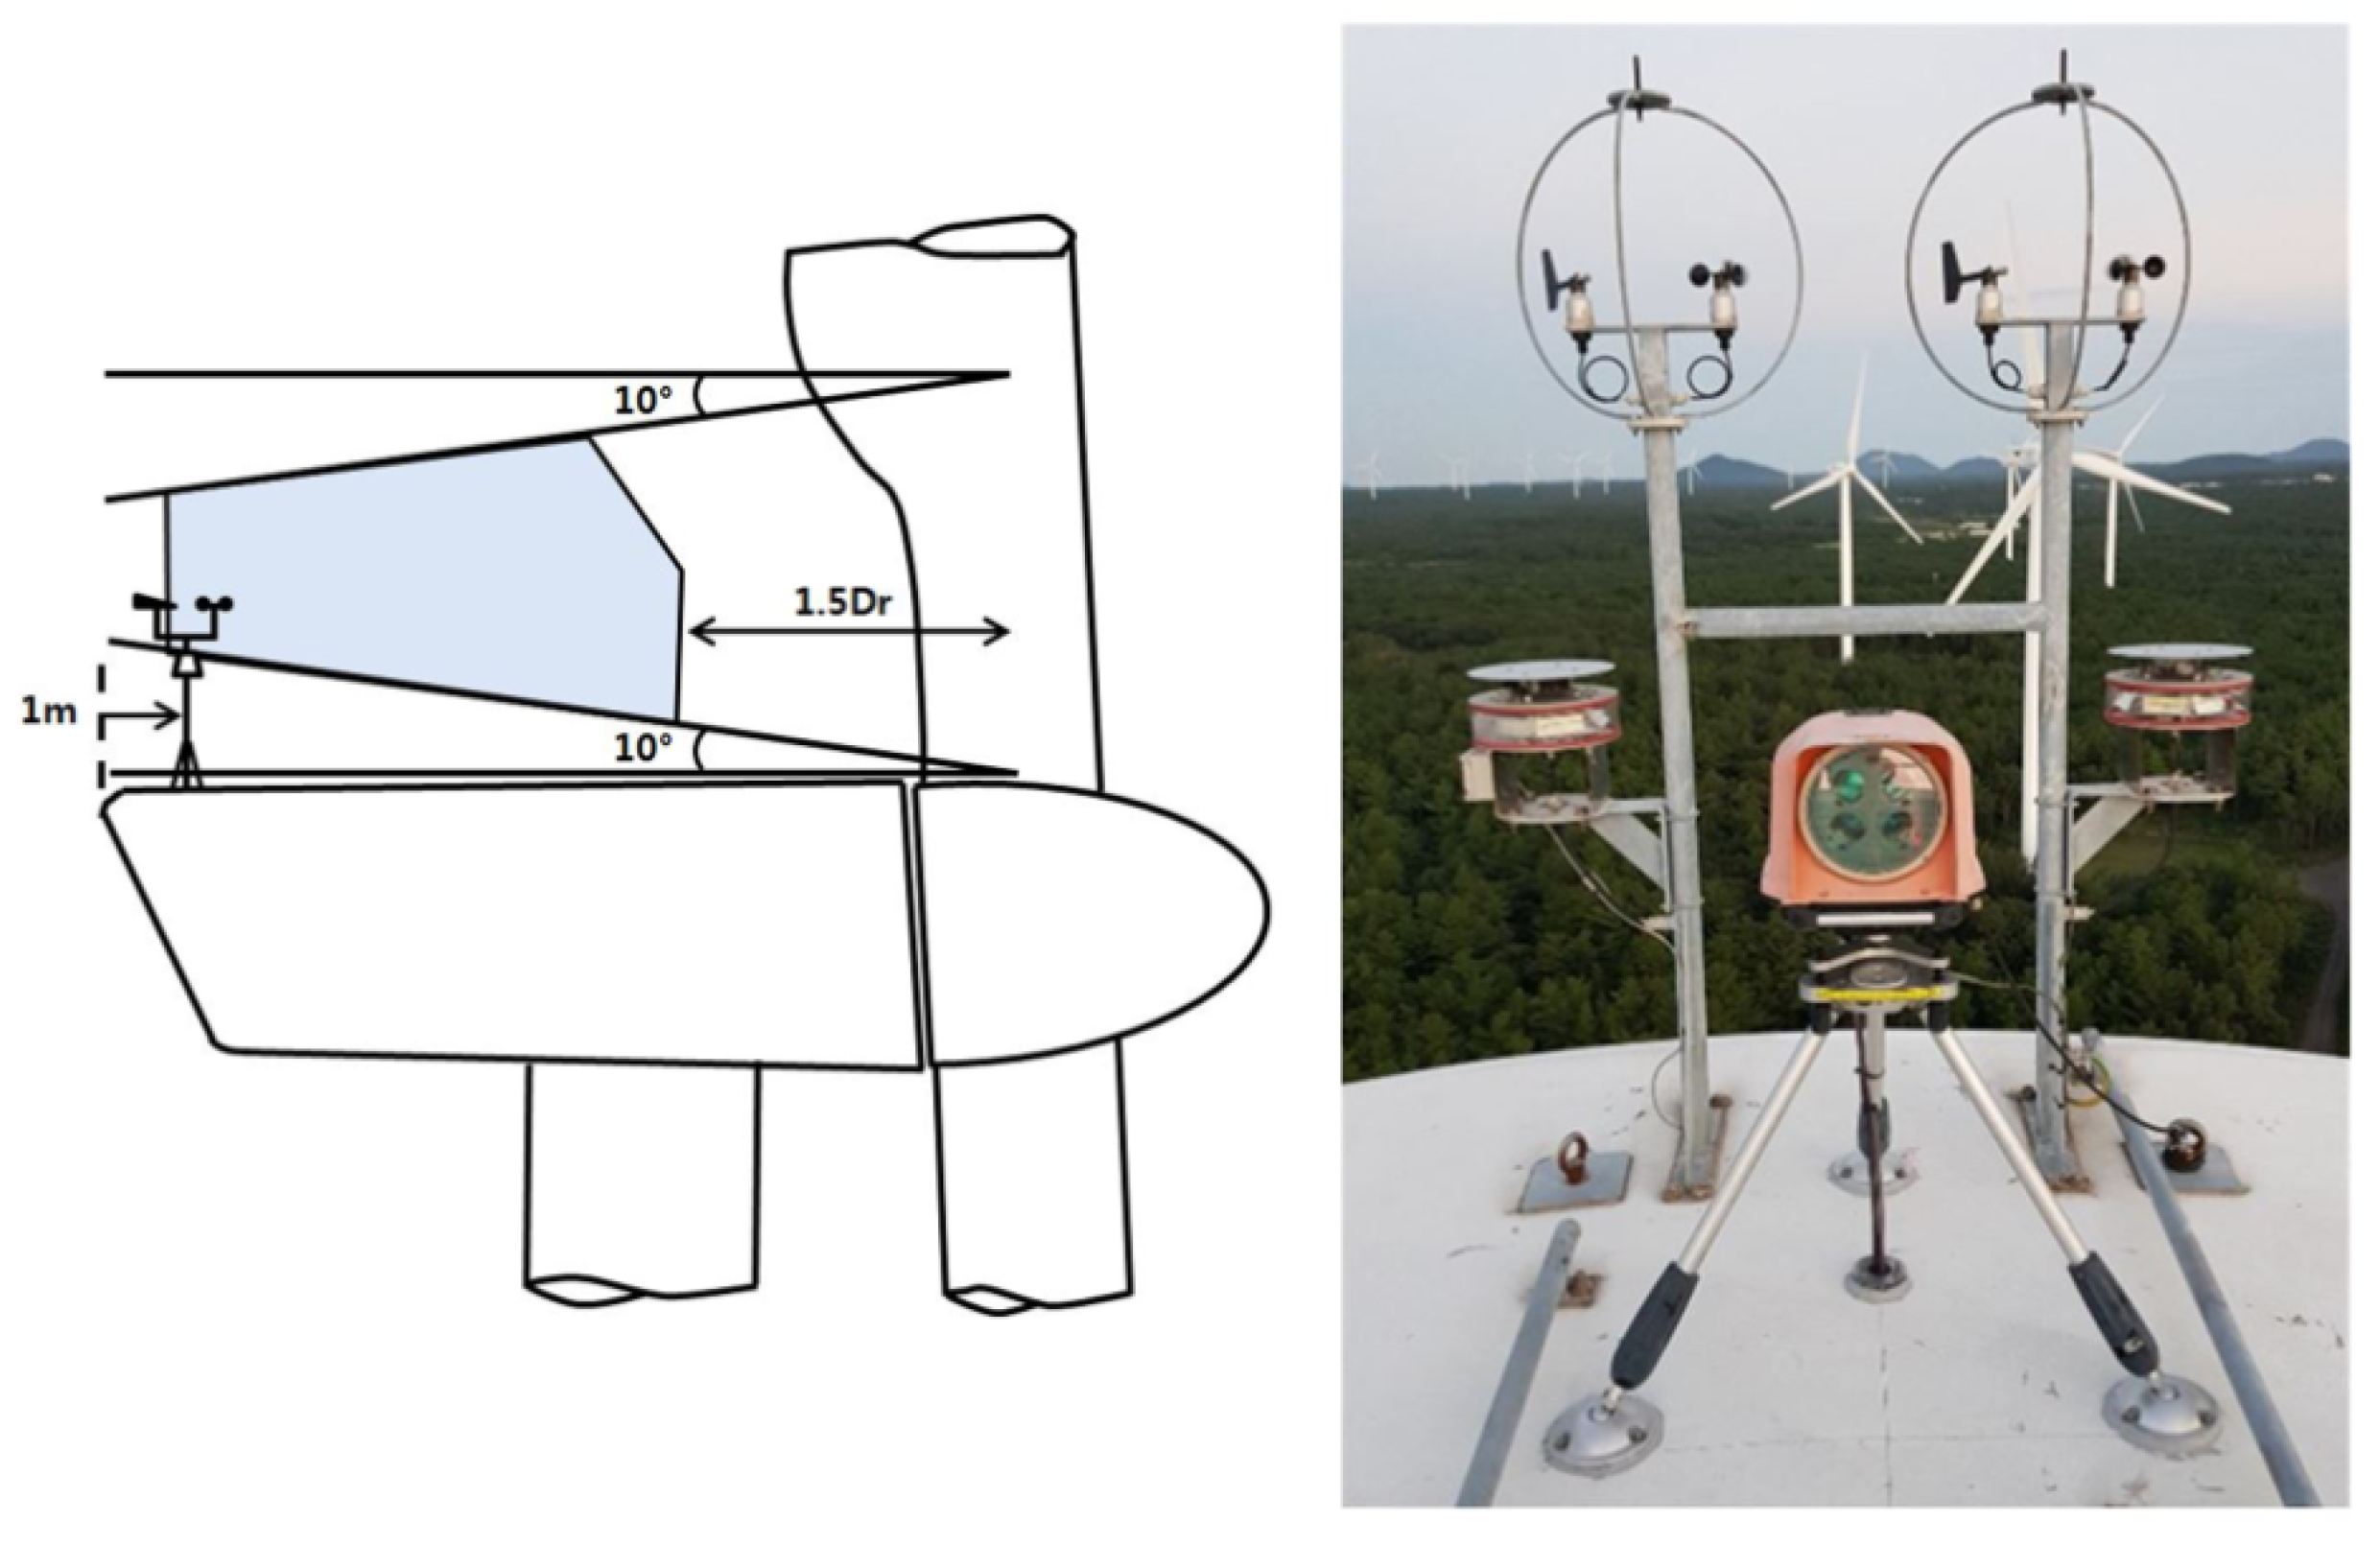
To avoid the flow distortions caused by the rotor blades and the nacelle itself, the nacelle wind sensors should be positioned in accordance with the criteria provided in Annex A of IEC 61400-12-2 [8]. Figure 2 shows the criteria of mounting the nacelle wind sensor and the actual image of the nacelle anemometers and the nacelle wind vanes with a nacelle LIDAR on the nacelle of wind turbine no. 1. The nacelle wind sensors should be mounted above the boundary layer, indicated by the 10° line from the cylindrical blade root to the profiled blade, and at least 1.5 times the blade root diameter behind the blade root centre. Additionally, they should not be situated within 1 m of the downwind end of the nacelle. According to the criteria, the mounting status of the nacelle anemometers and wind vanes of the wind turbines tested was carefully checked, and it was confirmed that those sensors were properly mounted.
Table 4 presents the specifications of the nacelle LIDAR, which is the Wind Iris 2nd edition developed by Avent. It emits four laser beams as a stream of pulses with four lines of sight, separated by a horizontal angle of 30° and a vertical angle of 10°. It can measure wind conditions at up to 10 points between 80 m and 400 m horizontally from its optical head. The horizontal wind speed is calculated by taking account of wind shear from 4 beams. In this work, the nacelle LIDAR measurements at 2.5 times the rotor diameter from wind turbine no. 1 were analysed for wind turbine power performance testing.
This nacelle LIDAR was calibrated through a collaborative research project with KTL (Korea testing laboratory) according to the procedure suggested by DTU (Technical University of Denmark) [32,33], and the reliability of nacelle LIDAR measurements at this site was verified in a previous study [29].
Table 5 lists the specifications of the sensors on the met mast that were installed north of wind turbine no. 15. An 80-m-high lattice type met mast was installed for wind turbine power performance testing in accordance with IEC 61400-12-1. The wind speed at the hub height was measured by a Thies first class cup anemometer. Moreover, air temperature, humidity, and atmospheric pressure were measured by a thermometer, hygrometer, and barometer, respectively. The meteorological data were used to derive the normalized wind speed from the specific air density at the test site.
3. NTF Derivation and Application
3.1. NTF Derivation
Although the data rejection criteria are clearly given for the met mast wind data in IEC 61400-12-2, no data rejection criteria are available for the nacelle LIAR measurements. Thus, the following nacelle LIDAR measurements and the concurrent data of the other sources were discarded according to suggestions from previous studies [28,29,30,34,35]:
- -
- data without a measurement sector;
- -
- data with nacelle LIDAR measurement availability less than 80%;
- -
- data with a carrier-to-noise ratio less than −23 dB;
- -
- data in the case of the nacelle LIDAR or the test wind turbine in abnormal operation.
Using the table method given in IEC 61400-12-2, the nacelle anemometer wind speed can be corrected to free-stream wind speed, Vfree. The selected wind data after the data rejection were binned in 0.5-m/s intervals, and then, linear interpolation was performed between the bins using the following equation to obtain Vfree:
where Vfree,i and Vfree,i+1 are the bin-averaged free-stream wind speeds in bins i and i + 1, respectively. Vnacelle,i and Vnacelle,i+1 are the bin-averaged wind speeds measured by the nacelle anemometer in bins i and i + 1, respectively. Vnacelle is the wind speed measured by the nacelle anemometer.
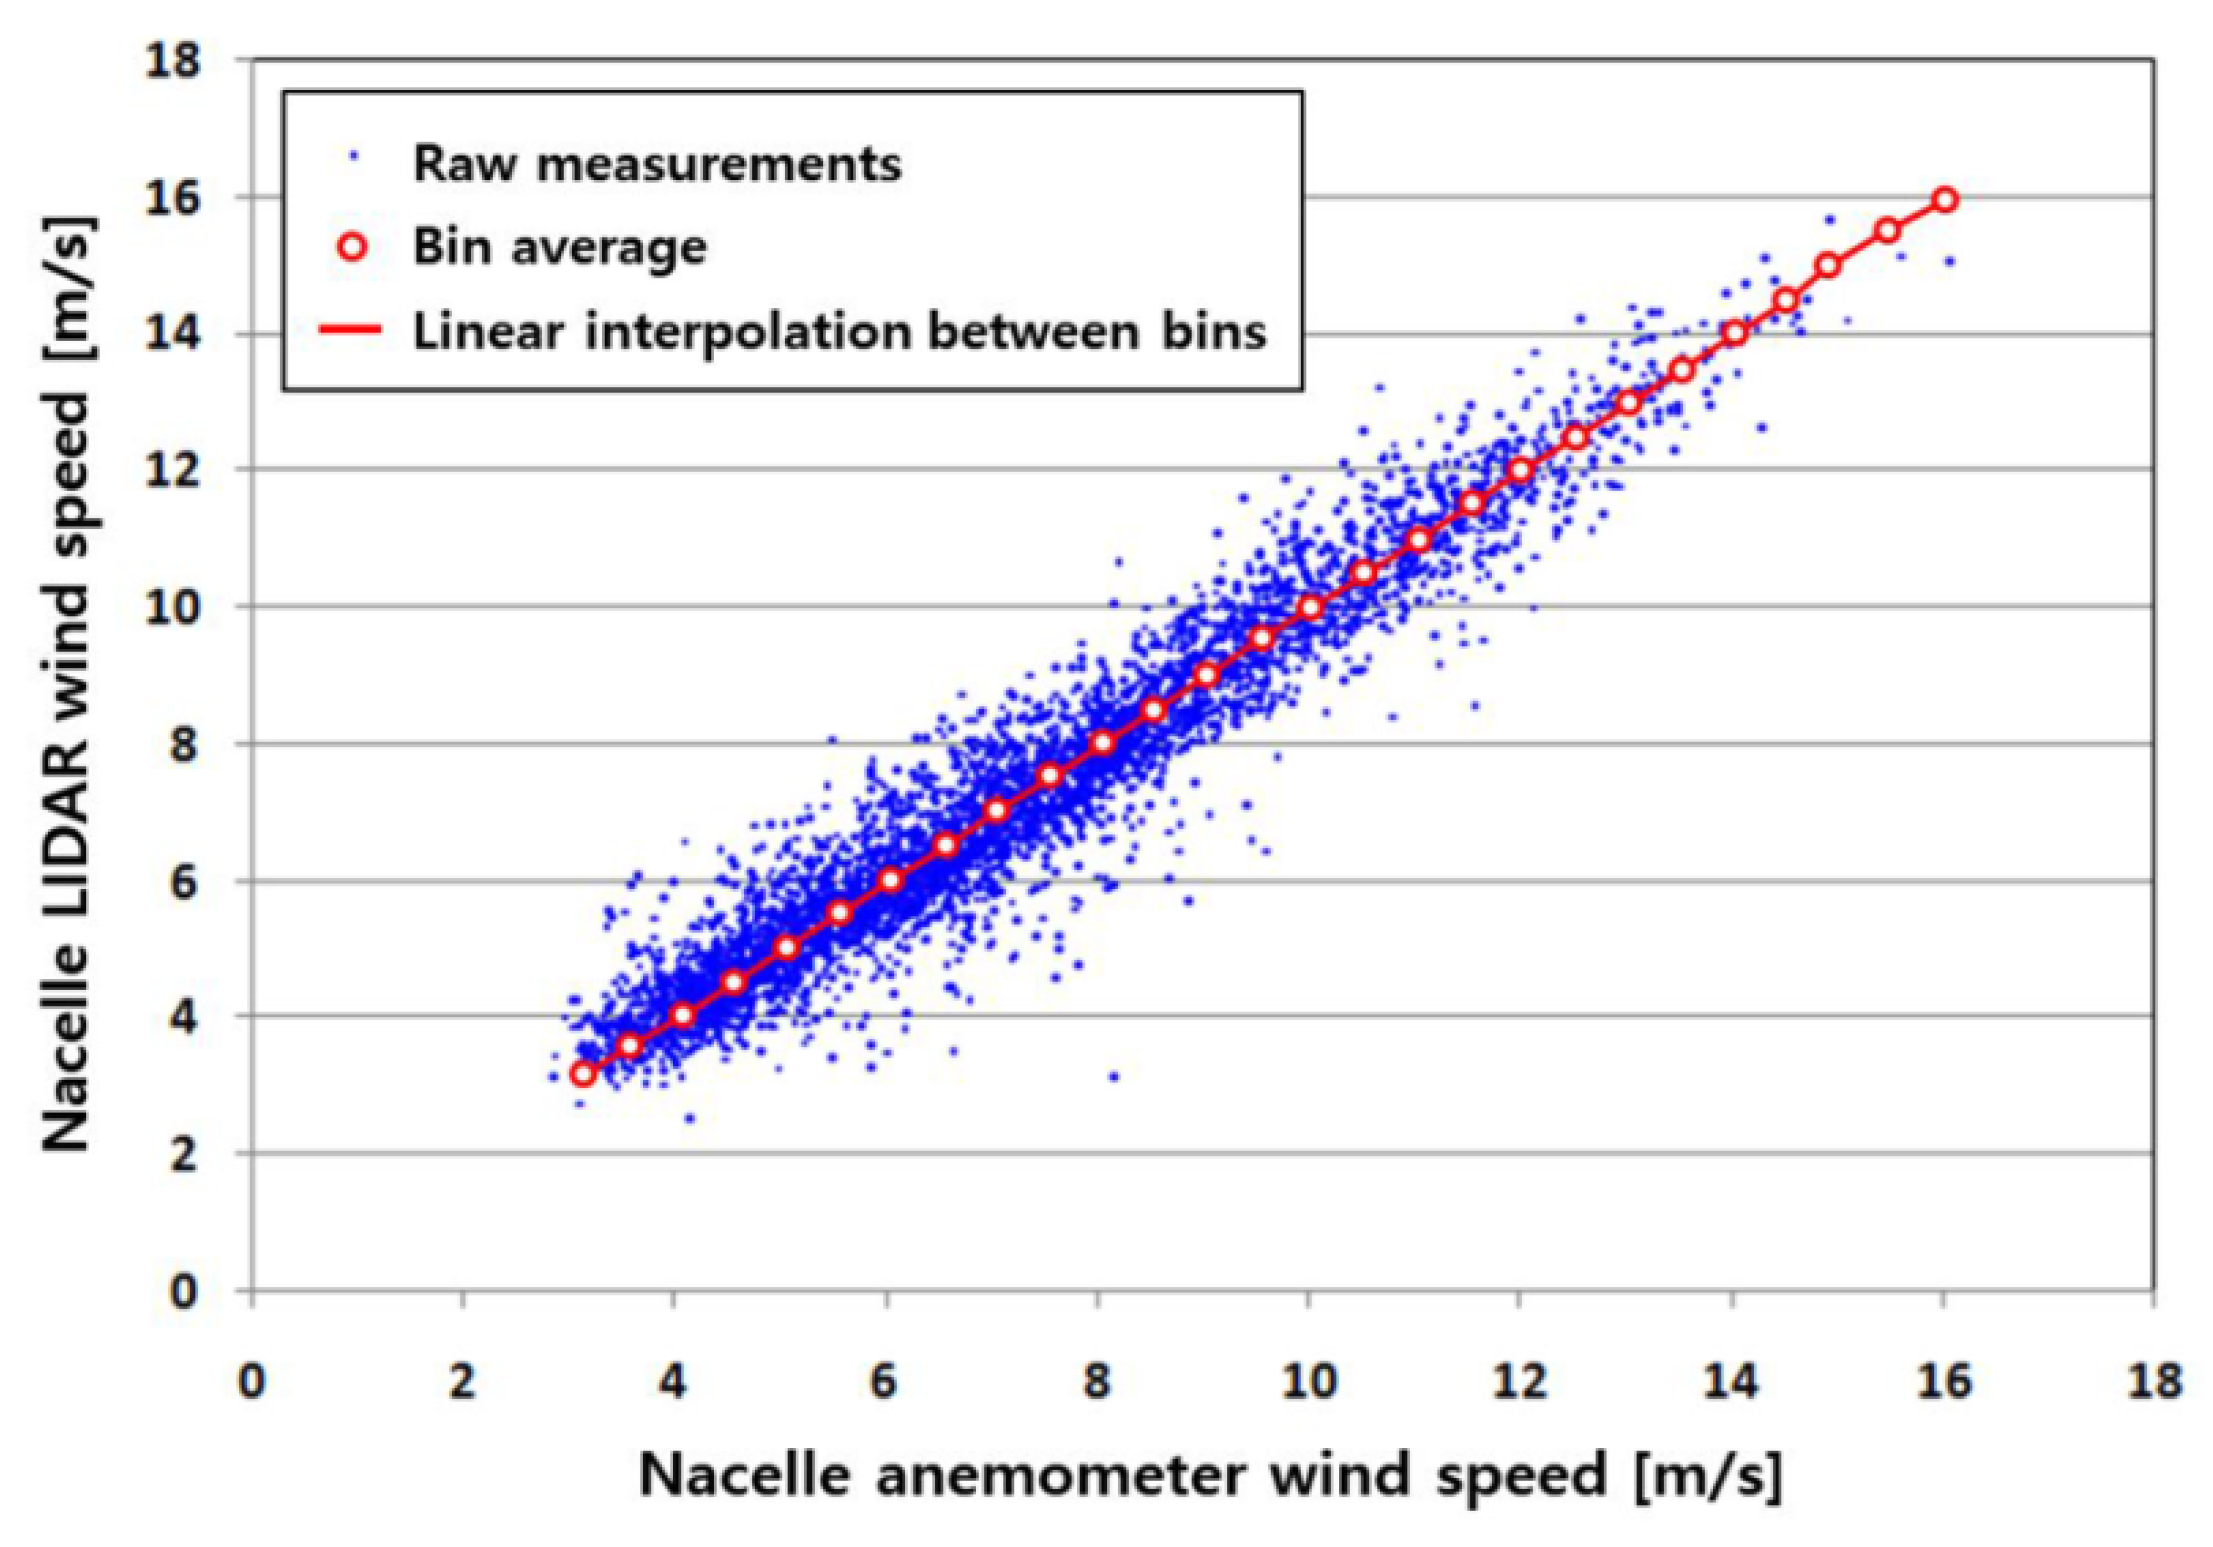
NTFNL and NTFCup were computed using the nacelle wind speeds of the test wind turbines with free-stream wind speeds measured by the nacelle LIDAR and the cup anemometer of the met mast, respectively. Figure 3 shows the relationship between the nacelle LIDAR and the nacelle anemometer wind speeds for turbine no. 1, from which NTFNL was calculated using the table method. The relationship was close to the slope of one, which means that the correlation between the nacelle LIDAR and nacelle anemometer wind speeds was very high and consequently, NTFNL was considered to be derived properly.
3.2. NTF Application
NTF can be applied to other wind turbines if they are the same type as the turbine tested, and further, the requirements for terrain class are satisfied [8]. The two test wind turbines met the requirements; they are the same type, and their terrain classes are the same because they are operating at the same wind farm. The nacelle anemometer wind speeds of wind turbines no. 1 and 15 were corrected to free-stream wind speeds by applying the derived NTFs. The corrected wind speeds were corrected again to the normalized wind speed at the reference air density to exclude the effect of wind variation with air density. The power curves were finally drawn using the bin method with an interval of 0.5 m/s.
Figure 4a,b show PCNTF, NL, PCNTF, Cup, PCCup and PCNL with respective power coefficients for the test wind turbines. In the figures, the power output ratio represents the measured power output, Pm, divided by the rated power output, Pr, and the wind speed ratio denotes the measured wind speed, Vm, divided by the rated wind speed, Vr. Each bin of all power curves had a minimum of three sample data points.
In Figure 4a, the power curves and the power coefficients for wind turbine no. 1 were compared. Here, PCNL is a nacelle LIDAR power curve that was drawn according to the procedure proposed by Wagner et al. [23,24,25]. PCNTF, NL and CP, NTF, NL were very similar to the references PCNTF, Cup and CP, NTF, Cup, respectively. On the other hand, PCNL and CP, NL were lower than the others. The power curves and the power coefficients for wind turbine no. 15 were compared in Figure 4b. Here, PCCup was drawn in accordance with IEC 61400-12-1 1st edition, which was a reference. PCNTF, NL was higher and PCNTF, Cup was lower than PCCup. PCNTF, NL, was similar to that for wind turbine no. 1. A higher CP, Cup than the others was observed under low wind speeds, which was caused by very low wind speeds compared to the high power output in the early stage of the wind speeds.
Table 6 lists the results of the two-parametric linear regression analysis between the power curves when PCNTF, Cup of wind turbine no. 1 and PCCup of wind turbine no. 15 were references. The correlations of PCsNTF, NL of wind turbines no. 1 and 15 were very high, with slopes of 1.002 and 0.997 and a coefficient of determination, R2, of 0.999 and 0.997, respectively. Because PCsNTF, NL were very similar to the reference power curves, PCNTF, Cup and PCCup, which were derived from current IEC standards, the NTF from nacelle LIDAR measurements could be applied to other wind turbines for power performance testing. The slopes and R2 values of the other power curves had a high correlation.
4. Power Curve Uncertainty
The uncertainties of the power curves for wind turbine no. 15 were analysed as a representative case. The uncertainties of PCNTF, NL and PCNTF, Cup were estimated by taking into account the following categories [8]:
- -
- Category A, uncertainty in electrical power (Sp,i);
- -
- Category B, uncertainty in power output (uP,i);
- -
- Category B, uncertainty in wind speed (uV,i);
- -
- Category B, uncertainty in air density (uAD,i);
- -
- Category B, uncertainty in the method (uM,i).
Category A uncertainty in electrical power was calculated by statistical analysis based on the standard deviation of power outputs in bin i divided by the square root of the number of sampled data in bin i. Category B uncertainties in the power output, air density and method were obtained by applying the uncertainty estimates provided in IEC 61400-12-2. Category B uncertainty in the method is the uncertainty associated with air density correction, dynamic power measurement, seasonal variation, variation of rotor inflow, and the turbulence effect on averaging and binning. Category B uncertainty in wind speed will follow in the next section.
4.1. Uncertainty in Free-Stream Wind Speed from Nacelle LIDAR
Category B uncertainty in wind speed includes the uncertainty in NTF, which contains the uncertainty in free-stream wind speed. Although the uncertainty component in free-stream wind speed from a met mast, uFS,Cup, can be calculated in compliance with IEC 61400-12-2, the uncertainty in free-stream wind speed from nacelle LIDAR, uFS,NL, cannot be computed because of no regulation in current IEC standards. Thus, the following components were taken into account according to the following references:
uFS,NL1 was calculated from the standard deviation of nacelle LIDAR measurements in bin i divided by the square root of the number of data in bin i. uFS,NL2 was estimated to be 2% of the wind speed given in IEC 61400-12-2 because the distance between the test wind turbine and the measurement point was less than three times the rotor diameter, and no site calibration was undertaken.
Because the nacelle LIDAR tilts due to the motion of the wind turbine nacelle by wind variation, the tilt of the nacelle LIDAR should be set at −2.5% of the hub height to measure wind conditions. In addition, nacelle LIDAR measurements should be performed within ±2.5% of the hub height. Figure 5 illustrates the nacelle LIDAR measurement height relative to the hub height along with the wind speed ratio. The mean values of the bin interval of 0.5 m/s are presented as well. The measurement height increased with an increase in the wind speed until the rated speed and then steadily decreased. This is because of blade pitching, which decreases the thrust force on the rotor after the rated wind speed. It was confirmed that the nacelle LIDAR measurement was carried out within ±2.5% of the hub height.
The uncertainty caused by variation in measurement height due to tilting motion, uNL,FS3, can be calculated using Equations (4) and (5) [27]:
where VNL,i is the average nacelle LIDAR wind speed in bin i, and Vhub,i is the wind speed extrapolated to the hub height. zNL,i is the average nacelle LIDAR measurement height in bin i, and zhub is the hub height. In Equation (5), the power law exponent was assumed to be 0.5.
Figure 6 shows the relative uncertainty in the nacelle LIDAR wind speed due to the tilt motion, uNL,FS3, with wind speed ratio. Uncertainties of approximately 0.12% were distributed in low wind speed regions and were very close to zero at 56% rated wind speed. Next, the uncertainty rapidly increased until the rated wind speed, and it gradually decreased after the rated wind speed due to blade pitching.
To evaluate uFS,NL4, the calibration of the tilt inclinometers was carried out in accordance with the procedure in DTU Wind Energy E-0020 [32,33]. The opening angle, α, was first calibrated by an iterative process of blocking and unblocking using a jig designed for beam detection at a distance of 29.85 m. The measured opening angle was confirmed to be 30.06°, and the maximum error of beam detection pointing, ΔH, was 21 mm. Next, the tilt value was measured using a theodolite Leica TM50. The uncertainty for tilt, uβ, was estimated using the following equation:
where ΔβT2 is the standard uncertainty of the theodolite associated with the tilt measurement, which was 0.03° according to the instrument calibration report. uβ can be used to obtain the vertical length at a measurement distance of 2.5 times the rotor diameter, Δz1, using Equation (7) [27]:
Finally, uFS,NL4 can be determined by the following equation assuming that wind shear follows a power-law profile with a shear exponent of 0.2:
Additionally, the two sensitivity factors for category B uncertainty in wind speed for estimating power curve uncertainty, cV,PC,i, and AEP uncertainty, cV,AEP,i, were calculated using the following equations [22]:
where Pi + 1, Pi and Pi − 1 are bin-averaged power output in bins i + 1, i and i − 1, respectively. Vi + 1, Vi and Vi − 1 are bin-averaged wind speed in bins i + 1, i and i − 1, respectively.
The sensitivity factors for category B uncertainties in the air density and method were also evaluated using other related equations presented in IEC 61400-12-2.
4.2. Combined Standard Uncertainty
Finally, the combined standard uncertainties of the power curves, uc,i, were evaluated using the following equation:
where ui is the combined category B uncertainty. uT,i and uB,i are the respective uncertainties in air temperature and pressure in bin i. cT,i and cB,i are the respective sensitivity factors of air temperature and pressure in bin i.
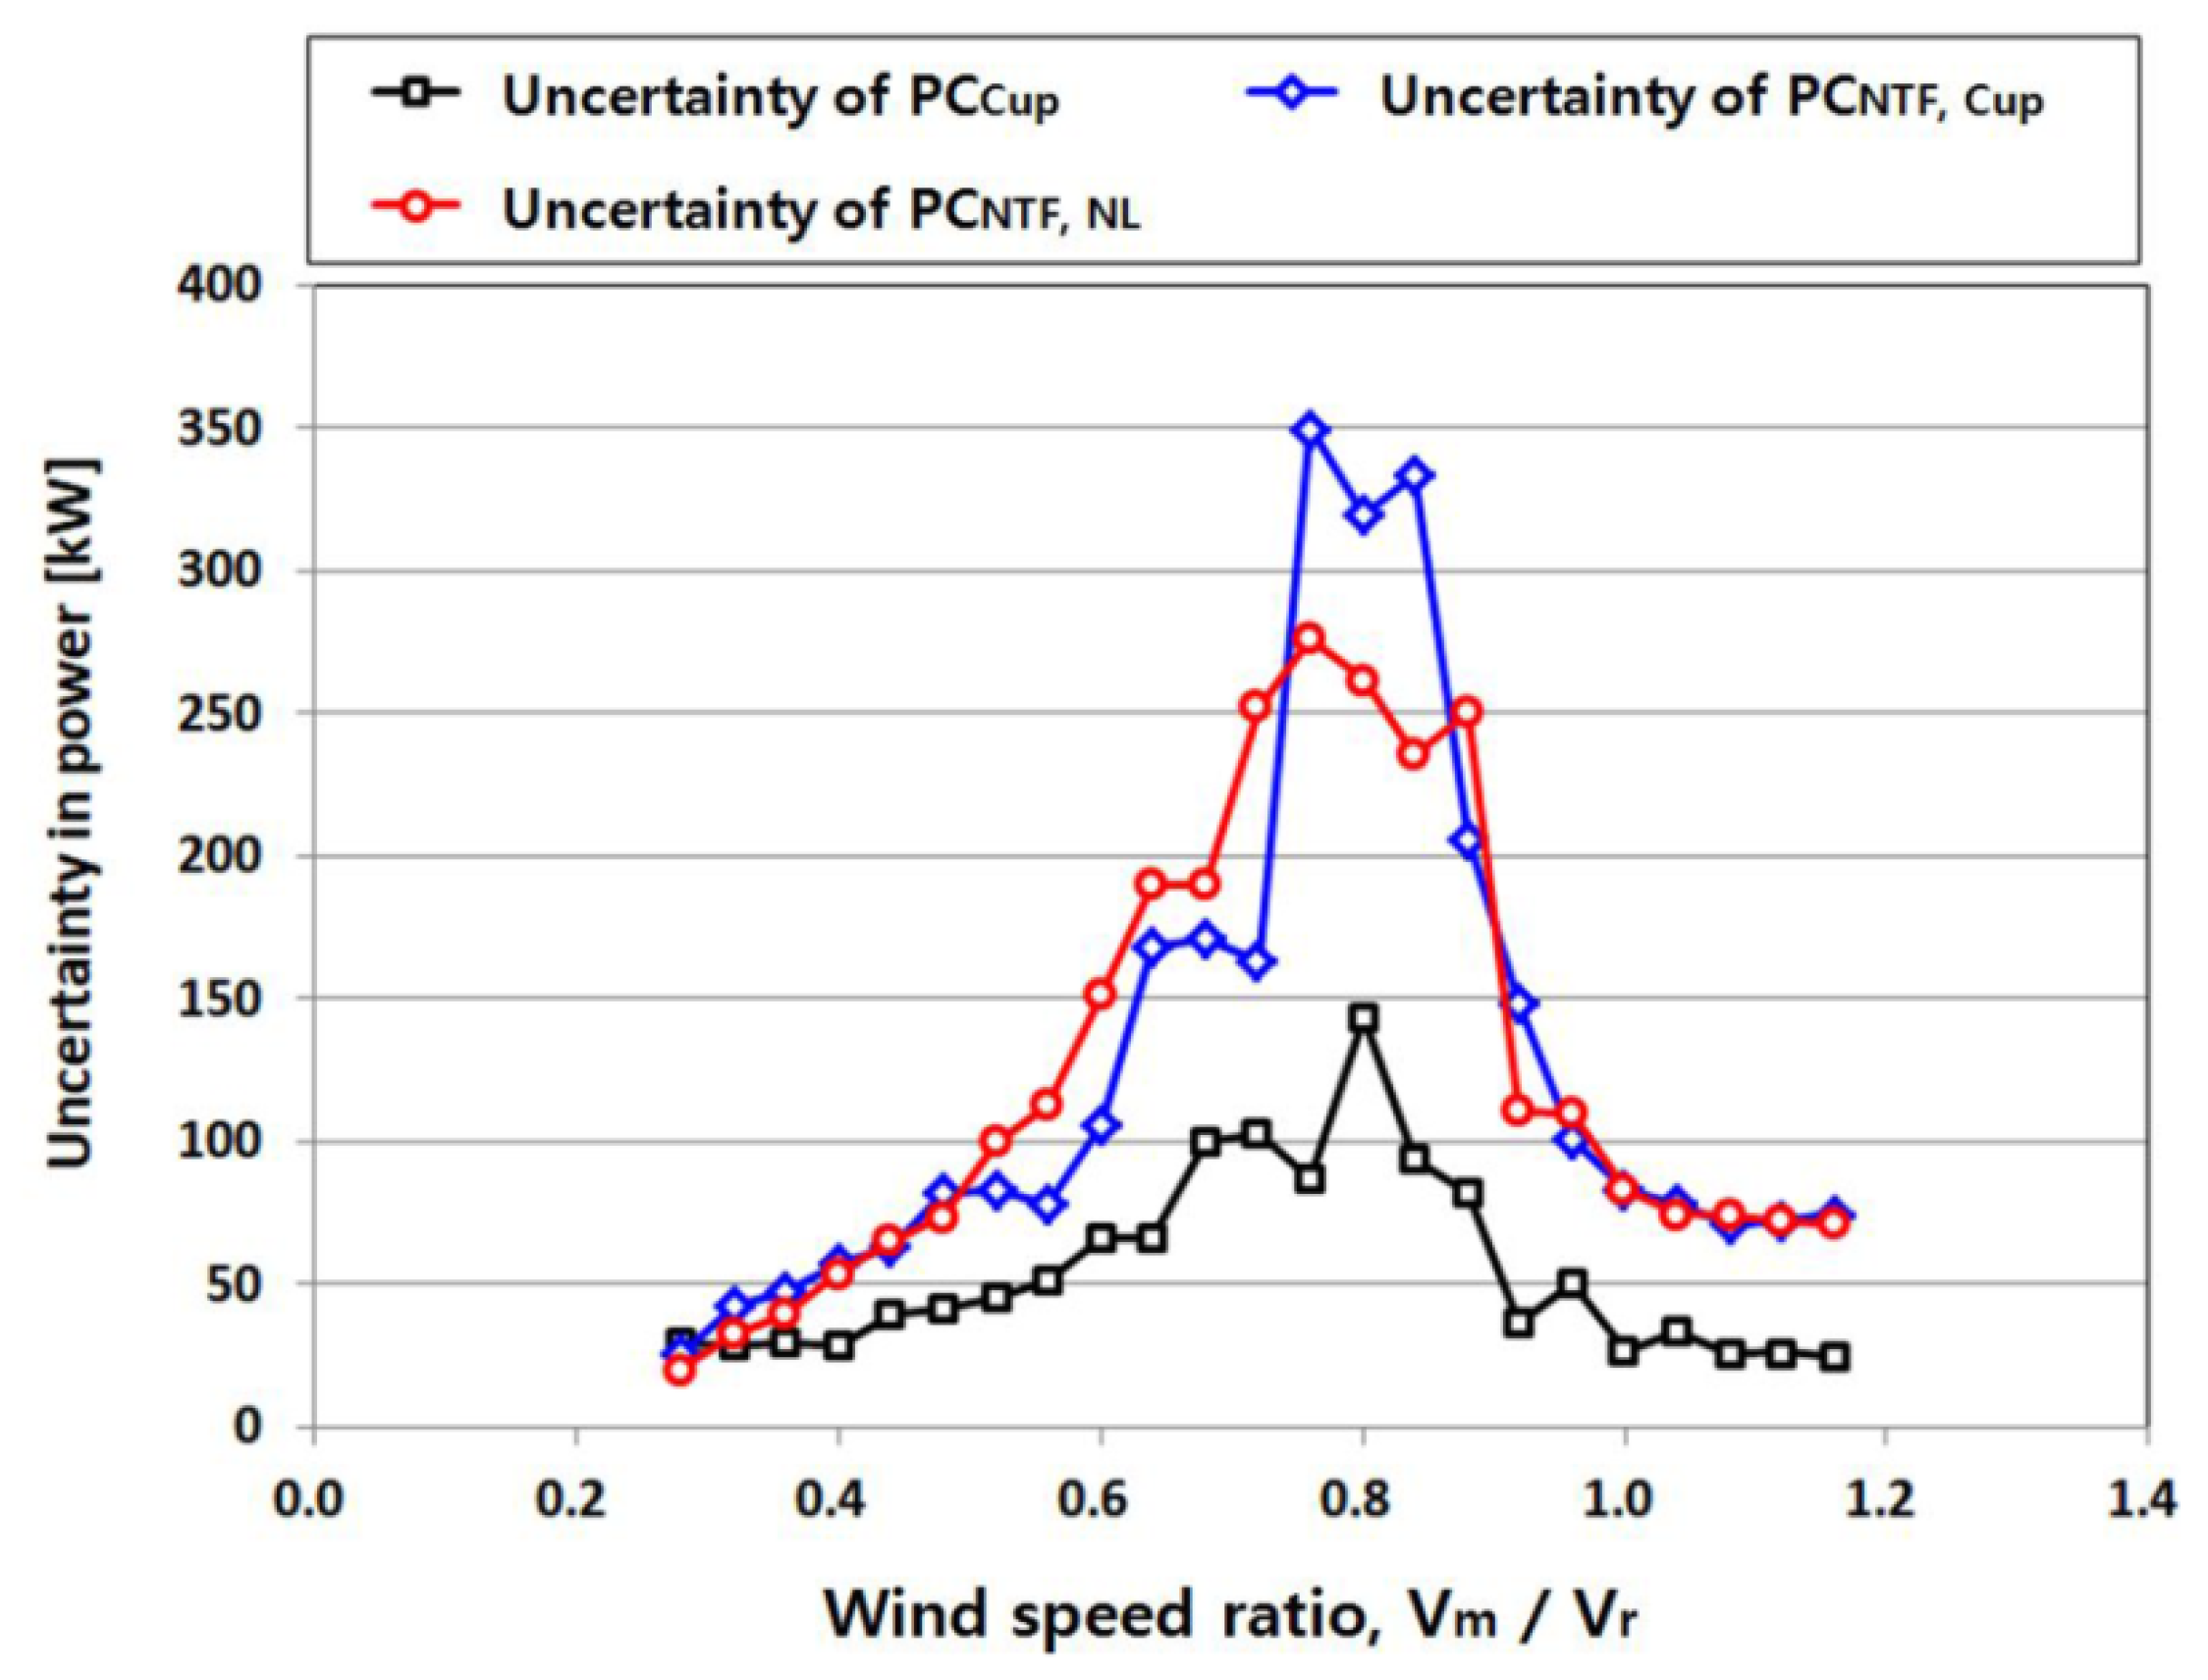
Figure 7 shows the combined standard uncertainties in PCNTF, NL and PCNTF, Cup of wind turbine no. 15 with that in PCCup, which was a reference complying with IEC 61400-12-1 1st edition. For all the uncertainties, higher uncertainties were generally found between wind speed ratios of 0.5 and 0.9, while lower uncertainties were estimated for the other wind speed ratios. The uncertainties of power curves from NTFs were higher than that of PCCup. Because the uncertainty of PCNTF, NL was similar to that of PCNTF, Cup calculated in compliance with IEC 61400-12-2, the NTF derived from the nacelle LIDAR measurements could be utilized to estimate power curves without a met mast.
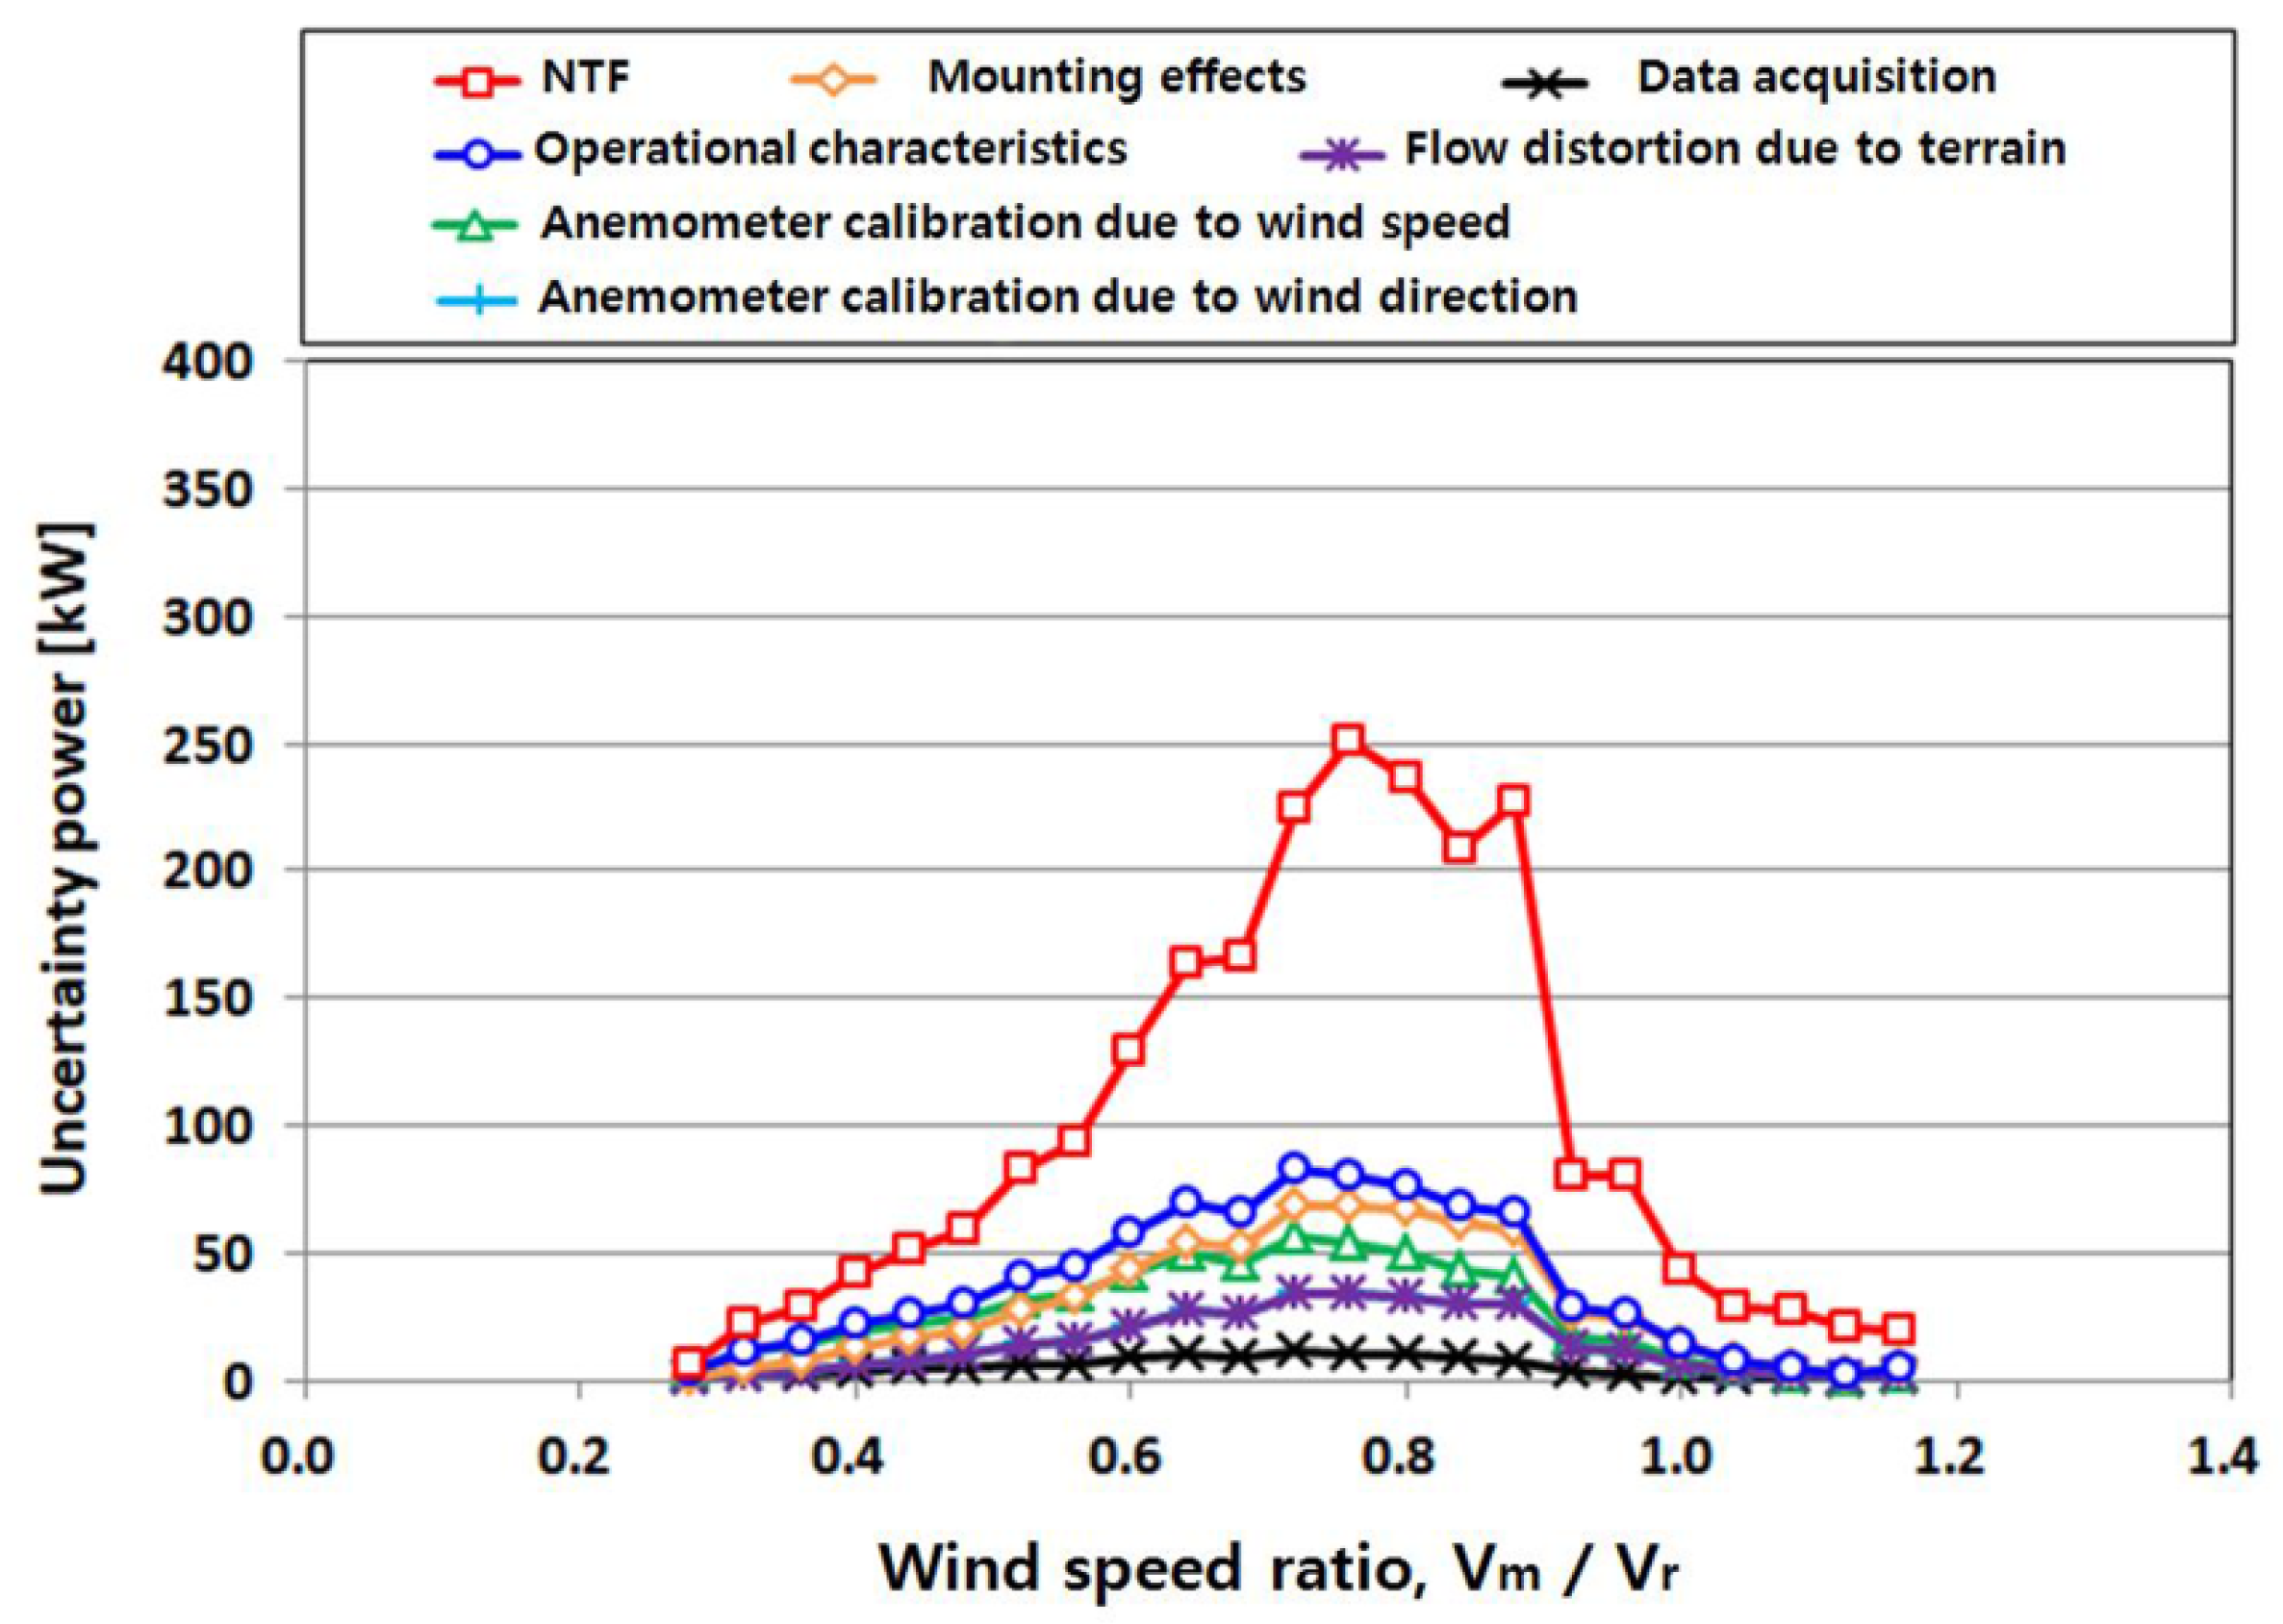
Figure 8 presents the individual uncertainties of components in category B uncertainties for PCNTF, NL of wind turbine no. 15. It was clear that the combined standard uncertainty of PCNTF, NL originated mainly from wind speed. The high uncertainties of PCNTF, NL and PCNTF, Cup after the rated wind speed (Figure 7) resulted from the uncertainty in the method, which was not taken into account when the uncertainty of PCCup was estimated. The power output, the temperature and the atmospheric pressure did not have a significant impact on uc,i.
The individual uncertainties of each component in wind speed in Figure 8 are further presented in Figure 9. The uncertainty of NTF derived from the nacelle LIDAR measurements was the highest among the uncertainty components. All other uncertainties related to the nacelle anemometer, such as operational characteristics and mounting effects, had comparatively low uncertainties of less than 100 kW. From Figure 7, Figure 8 and Figure 9, the combined standard uncertainty of PCNTF, NL, was confirmed to result mostly from NTF because the uncertainty for each bin of NTF in Figure 9 was slightly lower than the combined standard uncertainty for each bin in Figure 7.
5. AEP Uncertainty
According to IEC 61400-12-2, a Rayleigh cumulative distribution with annual mean wind speeds of 4 to 11 m/s is assumed to estimate the AEPs from PCNTF, NL (AEPNTF, NL), PCNTF, Cup (AEPNTF, Cup) and PCCup (AEPCup). The AEPs can be calculated using Equation (12):
where Nh is the number of hours in a year and N is the number of bins. F(Vi) and F(Vi − 1) are the Rayleigh cumulative probability distribution functions for wind speeds Vi and Vi − 1 in bins i and i − 1, respectively. Pi and Pi − 1 represent the average power output in bins i and i − 1, respectively.
uAEP can be derived from the following equation:
where fi is the relative occurrence of wind speed between Vi − 1 and Vi within bin i.
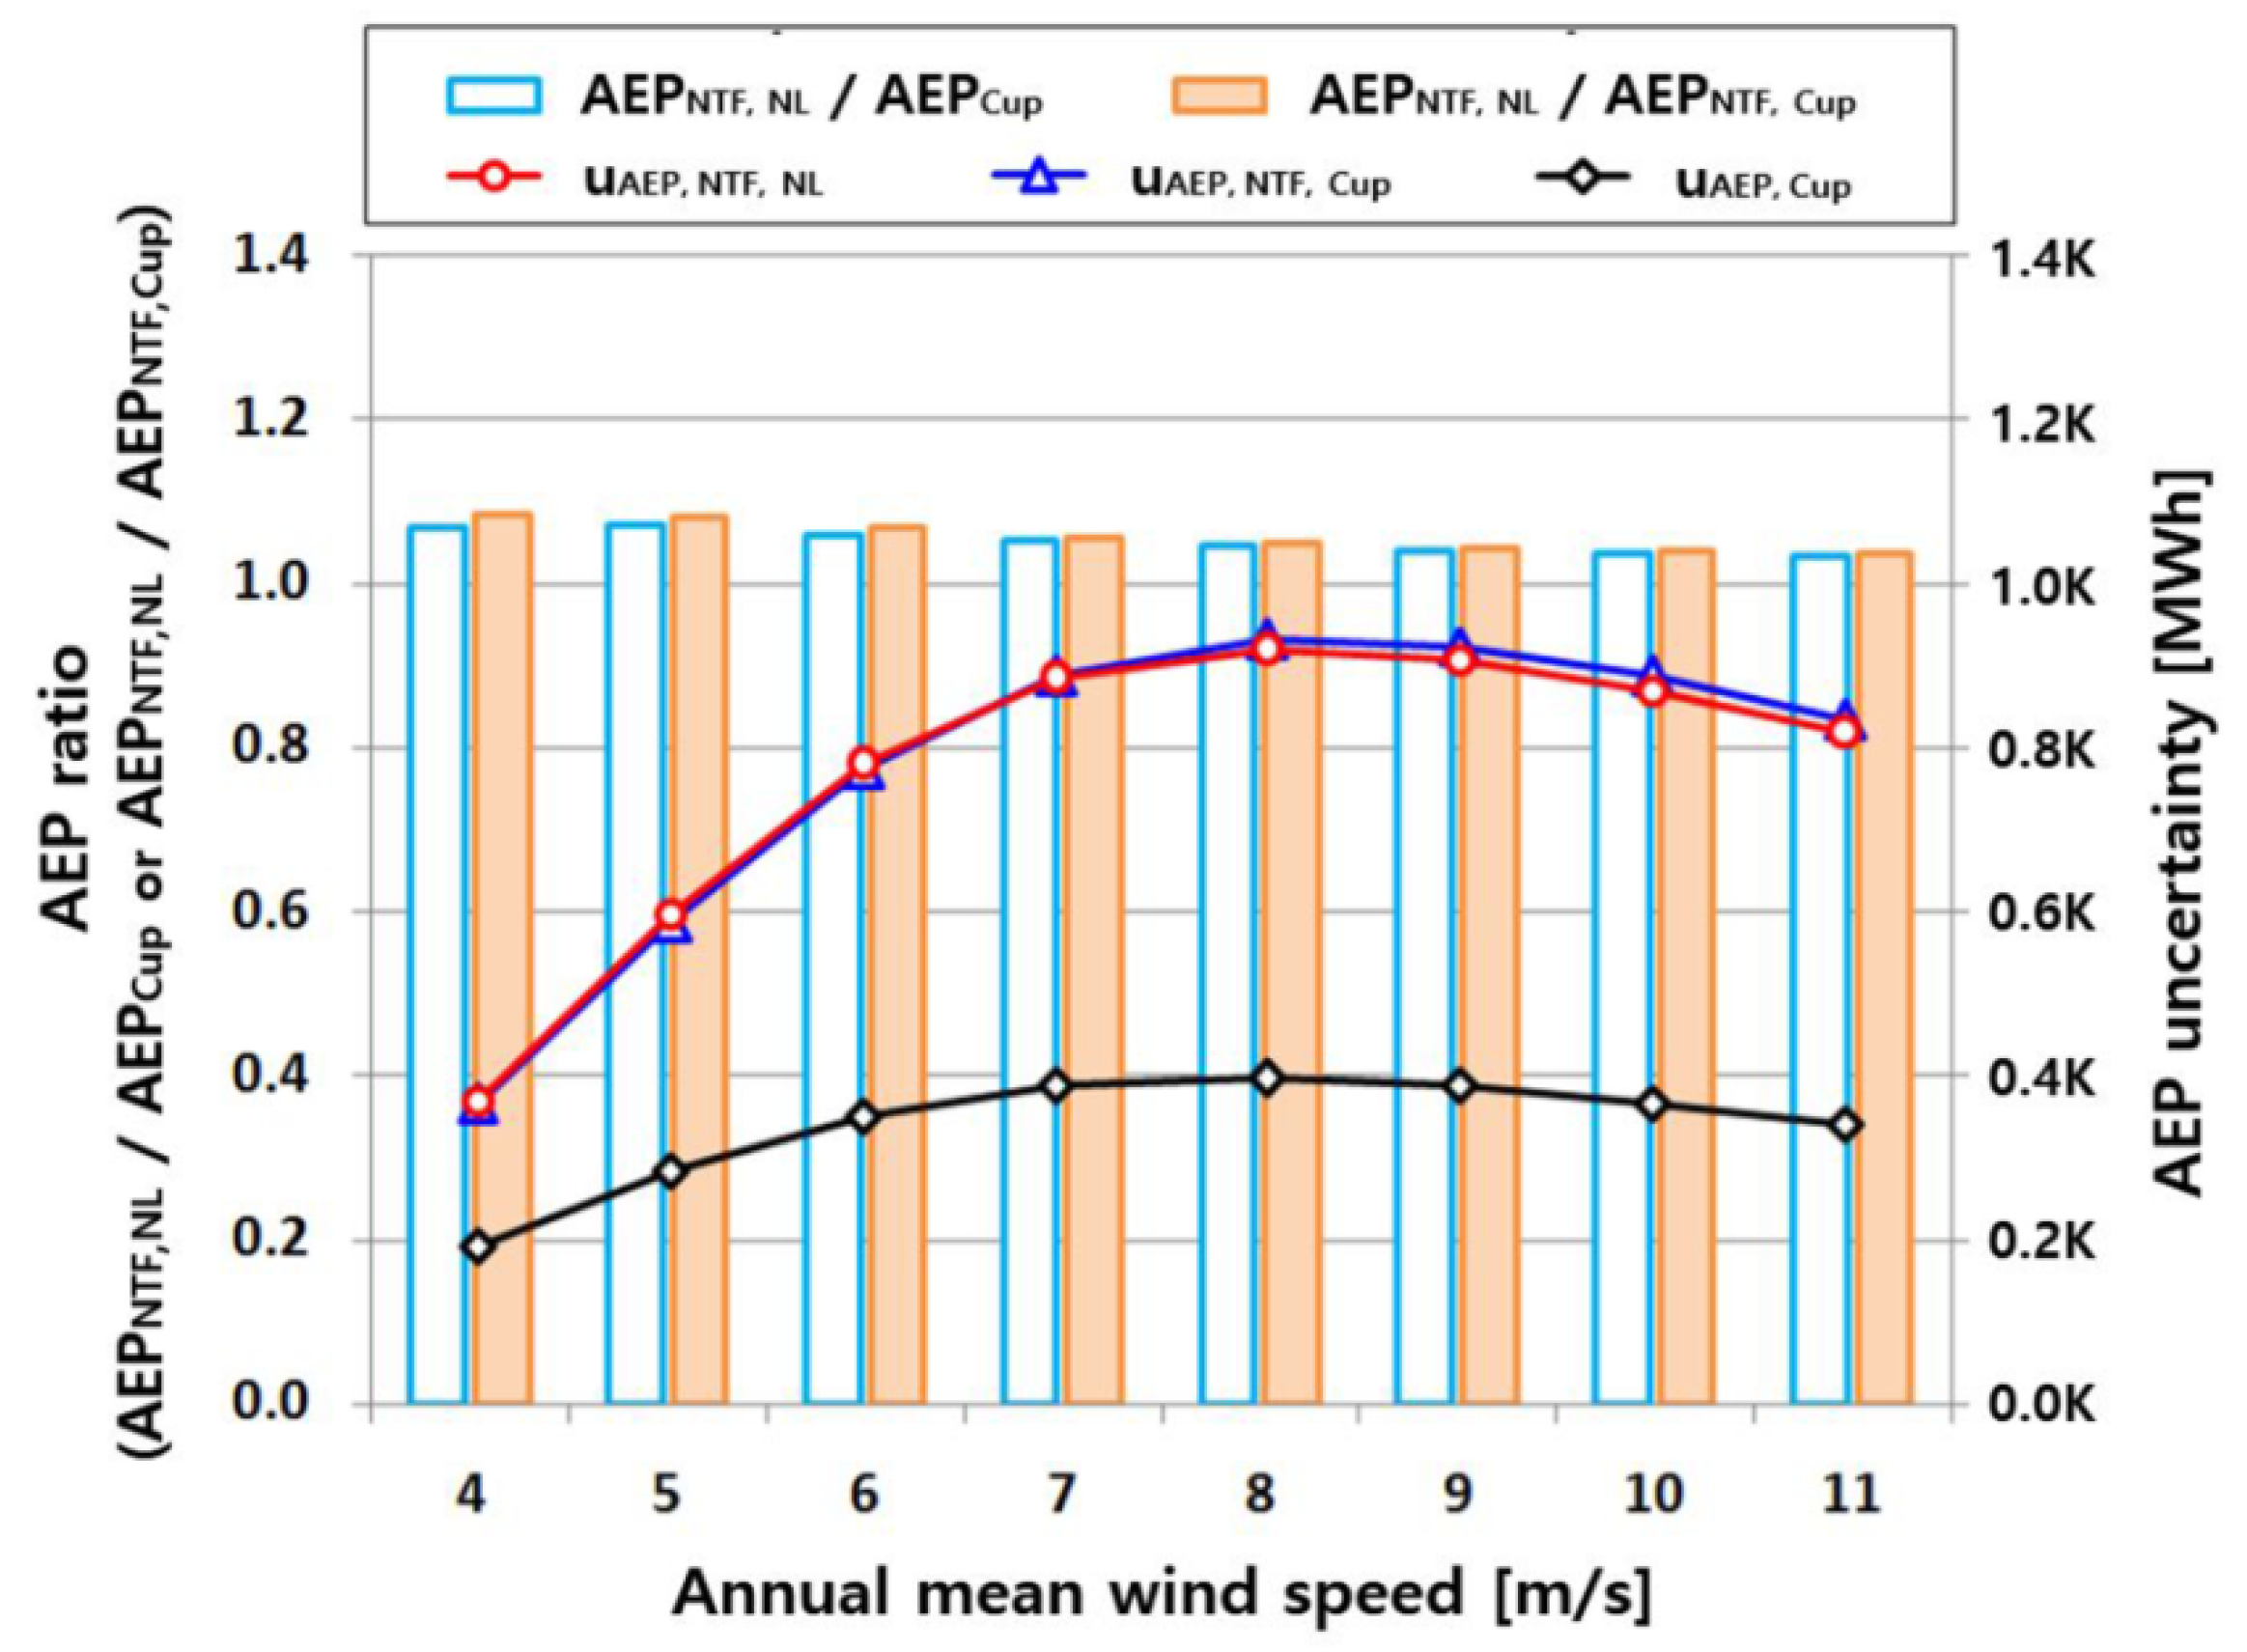
Figure 10 shows the AEP ratio and the uncertainties of AEPNTFL, NL (uAEP, NTF, NL), AEPNTF, Cup (uAEP, NTF, Cup) and AEPCup (uAEP, Cup). A difference of 3.4% to 7.0% was found between AEPNTF, NL and AEPCup by means of IEC 61400-12-1. Additionally, AEPNTF, NL was 3.5 ~ 8.3% higher than AEPNTF, Cup based on IEC 61400-12-2 for all annual mean wind speeds. uAEP, NTF, NL and uAEP, NTF, Cup were higher than uAEP, Cup. On the other hand, uAEP, NTF, NL was almost the same as uAEP, NTF, Cup for every annual wind speed.
6. Conclusions
This study was conducted to identify the applicability of NTF derived from nacelle LIDAR measurements for wind turbine power performance testing. PCNTF, NL was compared with PCCup, PCNTF, Cup and PCNL. Next, the uncertainties of the power curves and the AEPs were discussed in detail. The results can be summarized as follows:
- (1)
- NTFNL was estimated using the table method given in IEC 61400-12-2, and a strong relationship was found between the nacelle LIDAR and the nacelle anemometer wind speeds, which was close to a slope of one.
- (2)
- PCNTF, NL had a high correlation (based on the slope and R2) with the reference power curves based on the IEC standards, which led to the conclusion that NTFNL can be used for power performance testing of other wind turbines.
- (3)
- The combined standard uncertainty of PCNTF, NL, was similar to that of PCNTF, Cup based on IEC 61400-12-2. Additionally, the uncertainty in NTF mostly accounted for the combined standard uncertainty of the power curve derived from NTF.
- (4)
- Because AEPNTF, NL and uAEP, NTF, NL were very similar to AEPNTF, Cup and uAEP, NTF, Cup by means of the IEC 61400-12-2 in this work, there is potential for application of the NTF from the nacelle LIDAR measurements for wind turbine power performance testing without a met mast.
Author Contributions
A major part of the work was done by D.S. He analyzed the data and wrote a manuscript. K.K. contributed the format of a paper and thoroughly reviewed the manuscript.
Acknowledgments
This work was supported by Jeju Energy Corporation (JEC) and Korea Testing Laboratory (KTL) with funding provided by the Human Resources Program in Energy Technology (No. 20164030201230) of the Korea Institute of Energy Technology Evaluation and Planning (KETEP), with financial resources provided by the Ministry of Trade, Industry, and Energy, Republic of Korea.
Conflicts of Interest
The authors declare no conflict of interest.
References
- Probst, O.; Cardenas, D. State of the art and trends in wind resource assessment. Energies 2010, 3, 1087–1141. [Google Scholar] [CrossRef]
- Hasager, C.B.; Nygaard, N.G.; Volker, P.J.H.; Karagali, I.; Andersen, S.J.; Badger, J. Wind farm wake: The 2016 horns rev photo case. Energies 2017, 10, 317. [Google Scholar] [CrossRef]
- Clainche, S.L.; Lorente, L.S.; Vega, J.M. Wind predictions upstream wind turbines from a lidar database. Energies 2018, 11, 543. [Google Scholar] [CrossRef]
- Shen, X.; Zhou, C.; Li, G.; Fu, X.; Lie, T.T. Overview of wind parameters sensing methods and framework of a novel MCSPV recombination sensing method for wind turbines. Energies 2018, 11, 1747. [Google Scholar] [CrossRef]
- Marjan, A.; Shafiee, M. Evaluation of wind resources and the effect of market price components on wind farm income: A case study of Orland in Norway. Energies 2018, 11, 2955. [Google Scholar] [CrossRef]
- Sim, S.K.; Maass, P.; Lind, P. Wind speed modeling by nested ARIMA processes. Energies 2019, 12, 69. [Google Scholar] [CrossRef]
- International Electrotechnical Commission (IEC). Wind Turbine Generator Systems Part 12-1: Power Performance Measurements of Electricity Producing Wind Turbines, 1st ed.; International Electrotechnical Commission (IEC): Geneva, Switzerland, 2005. [Google Scholar]
- International Electrotechnical Commission (IEC). Wind Turbine Generator Systems Part 12-2: Power Performance of Electricity-Producing Wind Turbines Based on Nacelle Anemometry, 1st ed.; International Electrotechnical Commission (IEC): Geneva, Switzerland, 2013. [Google Scholar]
- Kim, H.W.; Ko, K.N.; Huh, J.C. Wind turbine power performance testing using nacelle transfer function. J. Korean Sol. Energy Soc. 2013, 33, 51–58. [Google Scholar]
- Shin, D.H.; Kim, H.W.; Ko, K.N. Analysis of wind turbine degradation via the nacelle transfer function. J. Mech. Sci. Technol. 2015, 29, 4003–4010. [Google Scholar] [CrossRef]
- Shin, D.H. An Analysis of Wind Turbine Degradation Using the Nacelle Wind Speed. Master’s Thesis, Jeju National University, Jeju, Korea, 2015. [Google Scholar]
- Shin, D.H.; Ko, K.N. Comparative analysis of degradation rates for inland and seaside wind turbines in compliance with the International Electrotechnical Commission standard. Energy 2017, 118, 1180–1186. [Google Scholar] [CrossRef]
- Bourgeois, S. Documentation and Results of the SODAR and LIDAR Measurements at the Maligrad Site in Bosnia and Herzegovina; Meteotest: Bern, Switzerland, 2008. [Google Scholar]
- Kim, H.G.; Ji, H.C. Uncertainty analysis on wind speed profile measurements of LiDAR by applying SODAR measurements as a virtual true value. J. Korean Sol. Energy Soc. 2010, 30, 79–85. [Google Scholar]
- Cañadillas, B.; Westerhellweg, A.; Neumann, T. Testing the performance of a ground-based wind LiDAR system: One year intercomparison at the offshore platform FINO1. DEWI Mag. 2011, 38, 58–64. [Google Scholar]
- Lang, S.; McKeogh, E. LIDAR and SODAR measurements of wind speed and direction in upland terrain for wind energy purposes. Remote Sens. 2011, 3, 1871–1901. [Google Scholar] [CrossRef]
- Kim, H.G.; Chyng, C.W.; An, H.J.; Ji, Y.M. Comparative validation of windcube LIDAR and remtech SODAR for wind resource assessment-Remote sensing campaign at Pohang Accelerator Laboratory. J. Korean Sol. Energy Soc. 2011, 31, 63–71. [Google Scholar] [CrossRef]
- Shu, Z.R.; LI, Q.S.; Chan, P.W. Investigation of offshore wind energy potential in Hong Kong based on Weibull distribution function. Appl. Energy 2015, 156, 362–373. [Google Scholar] [CrossRef]
- Kim, D.Y.; Kim, T.W.; Oh, G.J.; Huh, J.C.; Ko, K.N. A comparison of ground-based LiDAR and met mast wind measurements for wind resource assessment over various terrain conditions. J. Wind Eng. Ind. Aerodyn. 2016, 158, 109–121. [Google Scholar] [CrossRef]
- Shu, Z.R.; Li, Q.S.; He, Y.C.; Chan, P.W. Observations of offshore wind characteristics by Doppler-LiDAR for wind energy applications. Appl. Energy 2016, 169, 150–163. [Google Scholar] [CrossRef]
- Wan, S.; Cheng, L.; Sheng, X. Numerical analysis of the spatial distribution of equivalent wind speeds in large-scale wind turbines. J. Mech. Sci. Technol. 2017, 31, 965–974. [Google Scholar] [CrossRef]
- International Electrotechnical Commission. Wind Turbine Generator Systems Part 12-1: Power Performance Measurements of Electricity Producing Wind Turbines, 2nd ed.; IEC: Geneva, Switzerland, 2017. [Google Scholar]
- Wagner, R.; Pedersen, T.F.; Courtney, M.; Gottschall, J.; Antoniou, I.; Møller, R.; Pedersen, S.M.; Velociter, T.; Bardon, M.; Mouritzen, A.S. Power performance measured using a nacelle Lidar. In EWEA Annual Event; European Wind Energy Association: Brussels, Belgium, 2011. [Google Scholar]
- Wagner, R.; Rivera, R.L.; Antoniou, I.; Davoust, S.; Pedersen, T.F.; Courtney, M.; Diznabi, B. Procedure for wind turbine power performance measurement with a two-beam nacelle LiDAR. In DTU Wind Energy Report; Technical University of Denmark: Lyngby, Denmark, 2013. [Google Scholar]
- Wagner, R.; Samuel, D. Nacelle Lidar for power curve measurement_Avedøre campaign. In DTU Wind Energy Report; Technical University of Denmark: Lyngby, Denmark, 2013. [Google Scholar]
- Wagner, R.; Sathe, A.; Mioullet, A.; Courtney, M. Turbulence measurement with a two-beam nacelle lidar. In EWEA Annual Event; European Wind Energy Association: Brussels, Belgium, 2013. [Google Scholar]
- Wagner, R.; Courtney, M.S.; Pedersen, T.F.; Davoust, S. Uncertainty of power curve measurement with a two-beam nacelle-mounted lidar. Wind Energy 2016, 19, 1269–1287. [Google Scholar] [CrossRef]
- Shin, D.H.; Ko, K.N.; Kang, M.S. Characteristics analysis and reliability verification of nacelle lidar measurements. J. Korean Sol. Energy Soc. 2017, 37, 1–11. [Google Scholar]
- Shin, D.H.; Ko, K.N.; Kang, M.S.; Ryu, D.H.; Kang, M.J.; Kim, H.J. Accuracy assessment of four-beam nacelle lidar measurements in complex terrain. Korea Wind Energy Assoc. 2018, 9, 20–27. [Google Scholar]
- Shin, D.H.; Ko, K.N.; Kang, M.S.; Ryu, D.H.; Kang, M.J.; Kim, H.S. Comparison of wind turbine power curves using cup anemometer and pulsed doppler light detection and ranging systems. J. Mech. Sci. Technol. accepted.
- International Electrotechnical Commission. Available online: http://www.iec.ch/dyn/www/f?p=103:38:223 5361504226:FSP_ORG_ID,FSP_APEX_PAGE,FSP_PROJECT_ID:1282,23,100113 (accessed on 10 January 2018).
- Courtney, M. Calibrating nacelle lidars. In DTU Wind Energy; Technical University of Denmark: Lyngby, Denmark, 2013. [Google Scholar]
- Borraccino, A.; Courtney, M.; Wagner, R. Generic methodology for calibrating profiling nacelle lidars. In DTU Wind Energy Report; Technical University of Denmark: Lyngby, Denmark, 2015. [Google Scholar]
- Wind Iris User Manual with Software 1.5.1; Avent Lidar Technology: Orsay, France, 2016.
- Windcube V2 LiDAR Remote Sensor User Manual Version 06; Leoshphere: Saclay, France.
Figure 1.
Location of Jeju Island including the layout of wind turbines and instruments at Dongbok wind farm.
Figure 1.
Location of Jeju Island including the layout of wind turbines and instruments at Dongbok wind farm.

Figure 2.
Criteria and actual image for mounting wind sensors with a nacelle LIDAR.

Figure 3.
Relationship between the nacelle LIDAR and the nacelle anemometer wind speeds.

Figure 4.
Comparison of power curves and power coefficients.

Figure 5.
Nacelle LIDAR measurement height relative to hub height.

Figure 6.
Relative uncertainty in wind speed due to variation in nacelle LIDAR measurement height.

Figure 7.
Comparison of combined standard uncertainties for power curves of wind turbine no. 15.

Figure 8.
Uncertainties of each component in category B uncertainty for PCNTF, NL of wind turbine no. 15.
Figure 8.
Uncertainties of each component in category B uncertainty for PCNTF, NL of wind turbine no. 15.

Figure 9.
Uncertainties of each component comprising the uncertainty in wind speed of wind turbine no. 15.
Figure 9.
Uncertainties of each component comprising the uncertainty in wind speed of wind turbine no. 15.

Figure 10.
Comparison of the AEP ratio and AEP uncertainties.


Table 1.
Specification of wind turbines no. 1 and 15 under test.
| Category | Description |
|---|---|
| Model | HJWT 2000 |
| Rated power | 2000 kW |
| Hub height | 80 m |
| Rotor diameter | 87 m |
| Swept area | 5944.68 m2 |
| Rated rotor RPM | 17.3 rpm |
| Power control | Pitch control |
| Cut-in/rated/cut-out wind speed | 3.5/12.5/25 m/s |
Table 2.
Specifications of nacelle wind sensors and the SCADA system.
| Items | Nacelle Anemometer | Nacelle Wind Vane |
|---|---|---|
| Model | Mita-Teknik WS sensor 690360 | Mita-Teknik WD sensor—0–20 mA |
| Measurement range | 0.5 ~ 50 m/s | 0 ~ 360 deg |
| Accuracy | 0.2 m/s | ±0.5 deg |
| Data acquisition system | Gateway SCADA system | |
Table 3.
Specifications of electric power measurement instruments.
| Items | Current Transformer | Power Transducer |
|---|---|---|
| Model | BC 1009 | P 530 |
| Measurement range | 3000 A | 100–690 V/1–6 A |
| Resolution | Ratio = 3000:5 | 4–20 mA output |
| Accuracy | Class 0.5 | Class 0.5 |
Table 4.
Specification of the nacelle LIDAR.
| Category | Description |
|---|---|
| Model | Wind Iris (2nd ed.) |
| Measurement range | 80 ~ 400 m |
| Data sampling rate | 1 ~ 2.5 Hz |
| Laser source | Fibre-pulsed laser (Four beam) |
| Speed accuracy | 0.1 m/s |
| Direction accuracy | ±0.5 deg |
| Measurement height | 80 m (Hub height) |
Table 5.
Specification of sensors on the met mast.
| Sensor (Height) | Model | Accuracy |
|---|---|---|
| Anemometer (80 m) | Thies first class advanced | 0.2 m/s |
| Wind vane (78.5 m) | Thies first class advanced | ±0.5° |
| Thermometer (78.5 m) | Rotronic hygromer | 0.3 K |
| Hygrometer (78.5 m) | PT 100 class A | ±2% |
| Barometer (78.5 m) | P-GE 6/11 | ±0.1% |
Table 6.
Results from the two-parametric linear regression analysis between power curves.
| WTs | PCs | Slope | R2 |
|---|---|---|---|
| WT no. 1 (Reference: PCNTF, Cup) | PCNTF, NL | 1.002 | 0.999 |
| PCNL | 0.992 | 0.997 | |
| WT no. 15 (Reference: PCCup) | PCNTF, NL | 0.997 | 0.997 |
| PCNTF, Cup | 1.010 | 0.998 |
© 2019 by the authors. Licensee MDPI, Basel, Switzerland. This article is an open access article distributed under the terms and conditions of the Creative Commons Attribution (CC BY) license (http://creativecommons.org/licenses/by/4.0/).
Share and Cite
MDPI and ACS Style
Shin, D.; Ko, K. Application of the Nacelle Transfer Function by a Nacelle-Mounted Light Detection and Ranging System to Wind Turbine Power Performance Measurement. Energies 2019, 12, 1087. https://doi.org/10.3390/en12061087
AMA Style
Shin D, Ko K. Application of the Nacelle Transfer Function by a Nacelle-Mounted Light Detection and Ranging System to Wind Turbine Power Performance Measurement. Energies. 2019; 12(6):1087. https://doi.org/10.3390/en12061087
Chicago/Turabian StyleShin, Dongheon, and Kyungnam Ko. 2019. "Application of the Nacelle Transfer Function by a Nacelle-Mounted Light Detection and Ranging System to Wind Turbine Power Performance Measurement" Energies 12, no. 6: 1087. https://doi.org/10.3390/en12061087
Note that from the first issue of 2016, this journal uses article numbers instead of page numbers. See further details here.