Study and Stability Analysis of Leading Phase Operation of a Large Synchronous Generator


1
School of Electrical and Electronic Engineering, Harbin University of Science and Technology, Harbin 150080, China
2
Heilongjiang Electric Power Company Limited, Daqing Power Supple Company, Daqing 163458, China
*
Author to whom correspondence should be addressed.
Energies 2019, 12(6), 1047; https://doi.org/10.3390/en12061047
Submission received: 22 January 2019
/
Revised: 13 March 2019
/
Accepted: 13 March 2019
/
Published: 18 March 2019
(This article belongs to the Special Issue Analysis for Electrical Machines Monitoring)
Abstract
:This paper proposes a two-dimensional finite element mathematical model taking the mf-15 simulation generator in the dynamic model laboratory as the research object. The electromagnetic performance of the motor under no-load and rated load was analyzed to verify the correctness of the model. By using the method of field-circuit coupling combined with simulation analysis, the limit value of the generator’s phase-in depth is determined, and the variation law of the electric and magnetic field distribution with the depth of the generator’s established Leading phase operation is analyzed, as well as the influence of the phase-in operation on the system’s operation stability. The results obtained provide a reference for the phase-in operation analysis of large generators.
1. Introduction
In the case of maintaining a constant active power, the excitation current is adjusted to change the generator operating states. When the power factor changes from positive to negative, the reactive power changes from inductive to capacitive [1,2,3]. The generator should have the ability of leading phase operation at any time according to the needs of the power grid in order to ensure the power quality and economic operation of the power grid [4]. As the excitation current decreases, the degree of the leading phase is deepened, and the power angle increases, which inevitably affects the system stability. Changes in the power angle can result in increased magnetic leakage at the generator end and heating at the stator end [5,6,7,8,9]. Additionally, during the leading phase operation of the generator, the terminal voltage decreases. Generally, the minimum voltage must be < 90% of the rated voltage, and the stator current should be lower than 1.05 times the rated value. Therefore, the leading phase operation must be limited by the stability limit, the temperature rise of the stator core, and the minimum voltage of the generator terminal [10,11].
The actual leading phase capability of the generator has a significant relationship with the environment; the advantage of leading phase operation for synchronous generators is discussed in [12,13,14]. Thus, data obtained before the generator is shipped can only be used as a reference for operation. In recent years, with the gradual increase of the capacity of the synchronous generator, the requirement for its reliability is also increasing [15]. It is well known that the existing mathematical models of generators are multi-variable, nonlinear, and strongly coupled [16]. The power equations under two different leading phase test conditions have been established to analyze steady state stability of synchronous generator [17]. Some studies provide one new “operating conditions parameter mathematics model of generator” to determine the capability of the generator under leading phase condition instead of the conventional mathematical model based on the ideal assume condition [18]. Establishing an effective and reasonable leading phase operation model will greatly aid the prediction of the leading phase capability of units [19,20,21]. At present, the intelligent control technologies introduced into the leading phase of a generator include the backpropagation neural network, the radial basis function neural network, related vector machines, and the leading phase operation model of supporting vector machines. These techniques overcome the limitations of traditional analysis methods and exhibit a greater generalization ability and a better convergence rate [22,23,24,25].
In this study, the research object is the MF-15 simulation synchronous generator in a dynamic simulation laboratory. After the mathematical model was deduced, simulation software was used to establish a field-circuit coupling model for the leading phase operation of the generator. First, the electromagnetic properties of the no-load and rated-load conditions of the generator leading phase simulation model were analyzed. Then the generator was used to perform a test of the lagging phase to the leading phase operation state and an analysis of the electromagnetic parameter changes when the generator was at its maximum phase advance depth. Finally, the leading phase operating characteristics of the generator were obtained.
2. Block Diagram of Proposed Research
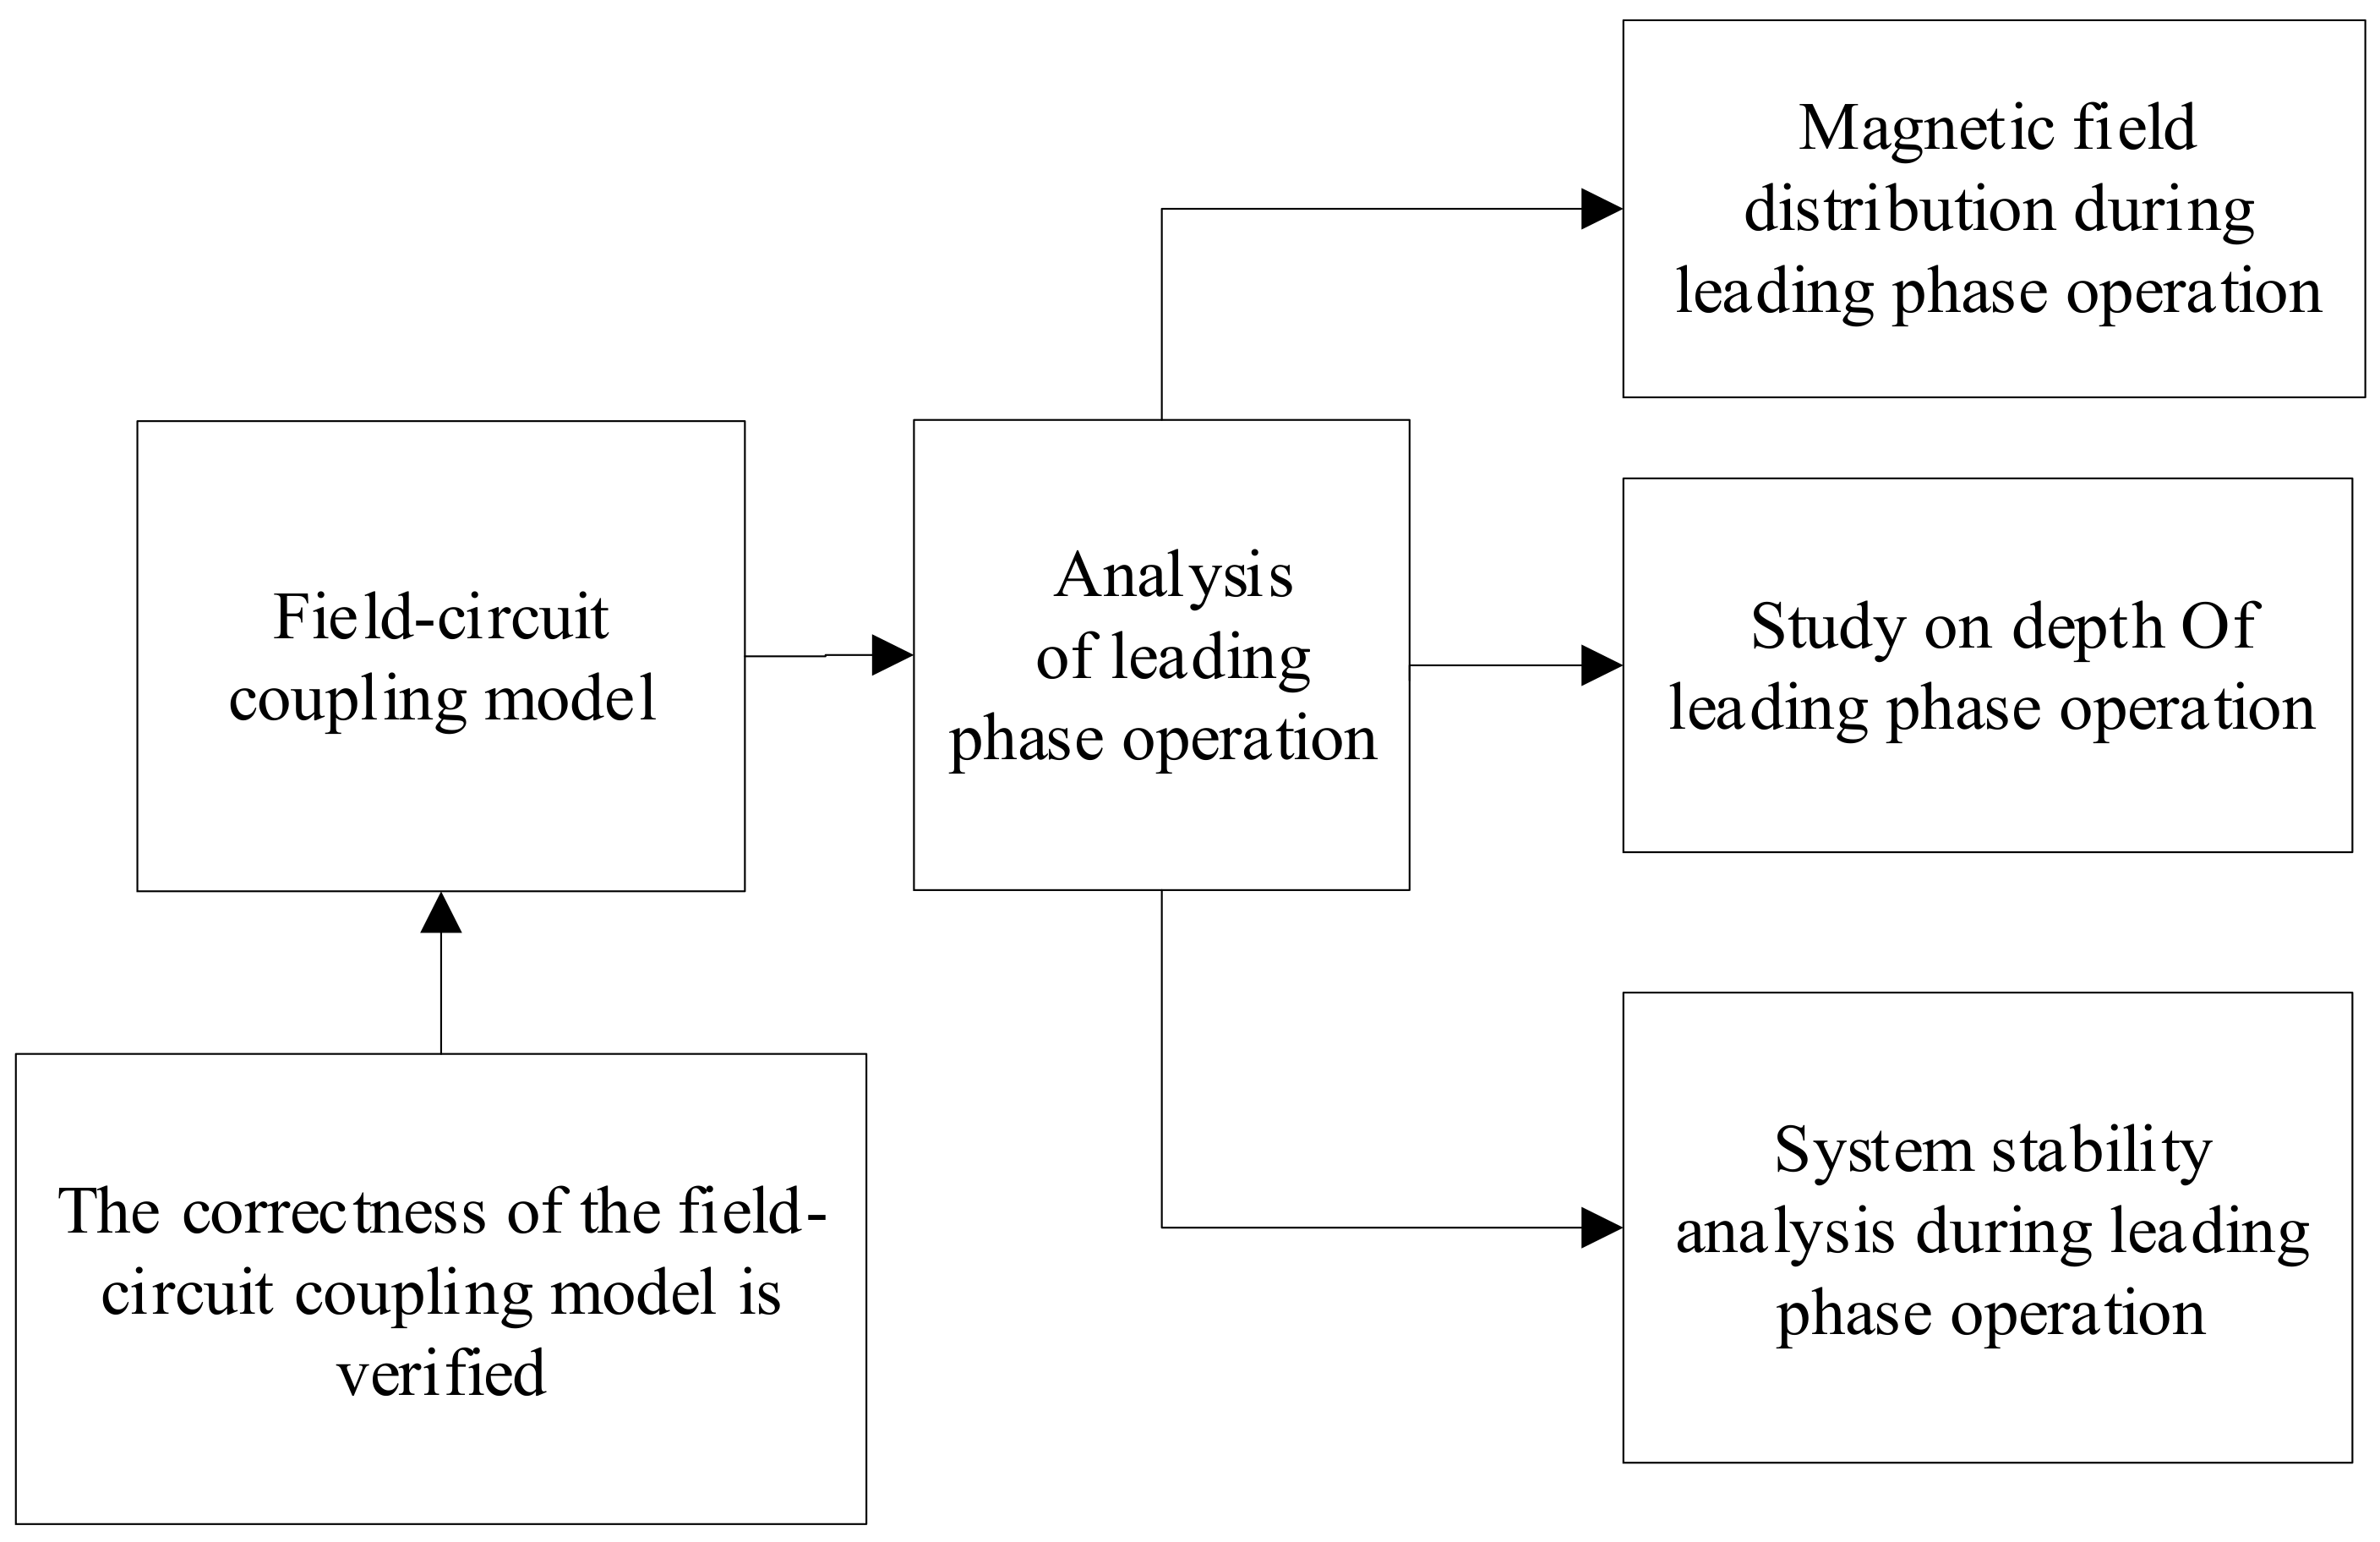
The block diagram of proposed research is shown in Figure 1.
3. Simulation Analysis of Generator Leading Phase Operation System
For synchronous generators, to simplify the analysis, we make the following assumptions:
- 1)
- The magnetic field in the motor has a two-dimensional (2D) distribution, and the stator end effect is described by the constant end leakage reactance;
- 2)
- The material is isotropic, ignoring the hysteresis effect of the ferromagnetic material;
- 3)
- The magnetic field is periodically distributed along the circumferential direction.
3.1. Modeling
The MF-15 simulation synchronous generator is the research object of this study. A finite-element analysis simulation platform is used to establish the generator model. The basic parameters of the generator are presented in Table 1.
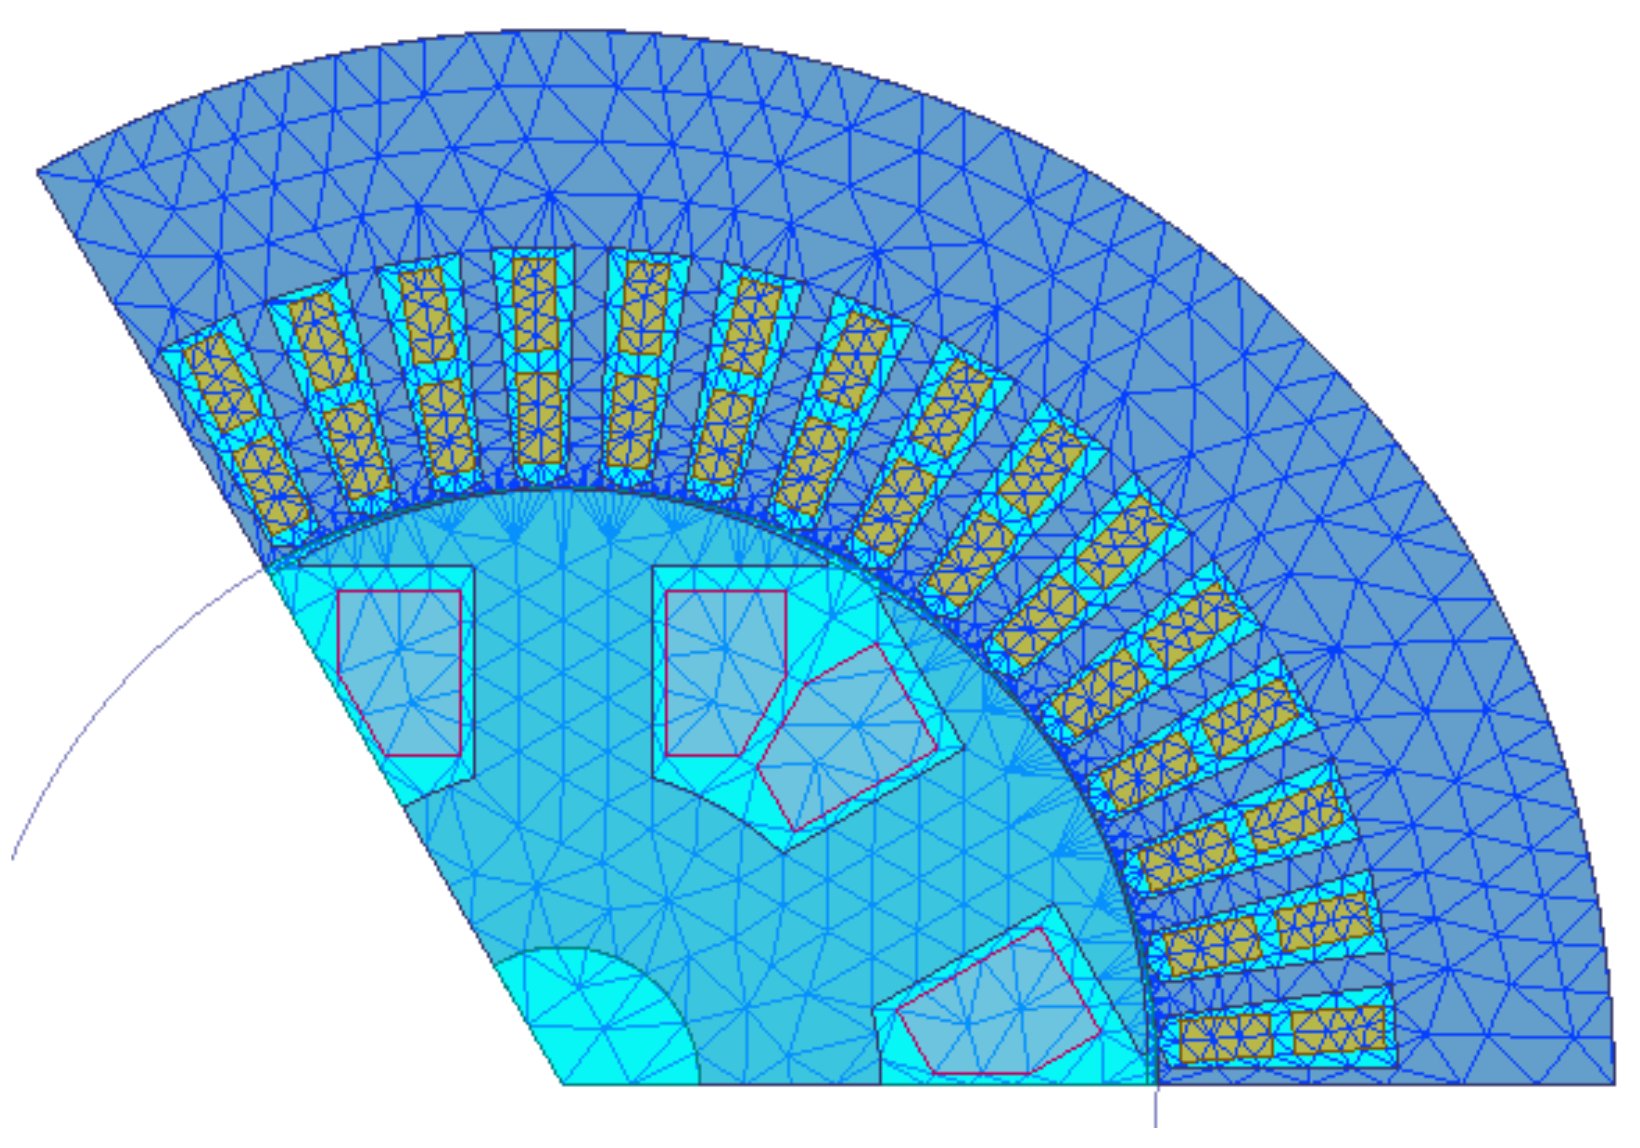
According to the above electromagnetic parameter calculation results and the mathematical model of the internal electromagnetic field of the generator, a time-stepping finite-element 2D field model of the synchronous generator is constructed using simulation software, as shown in Figure 2.
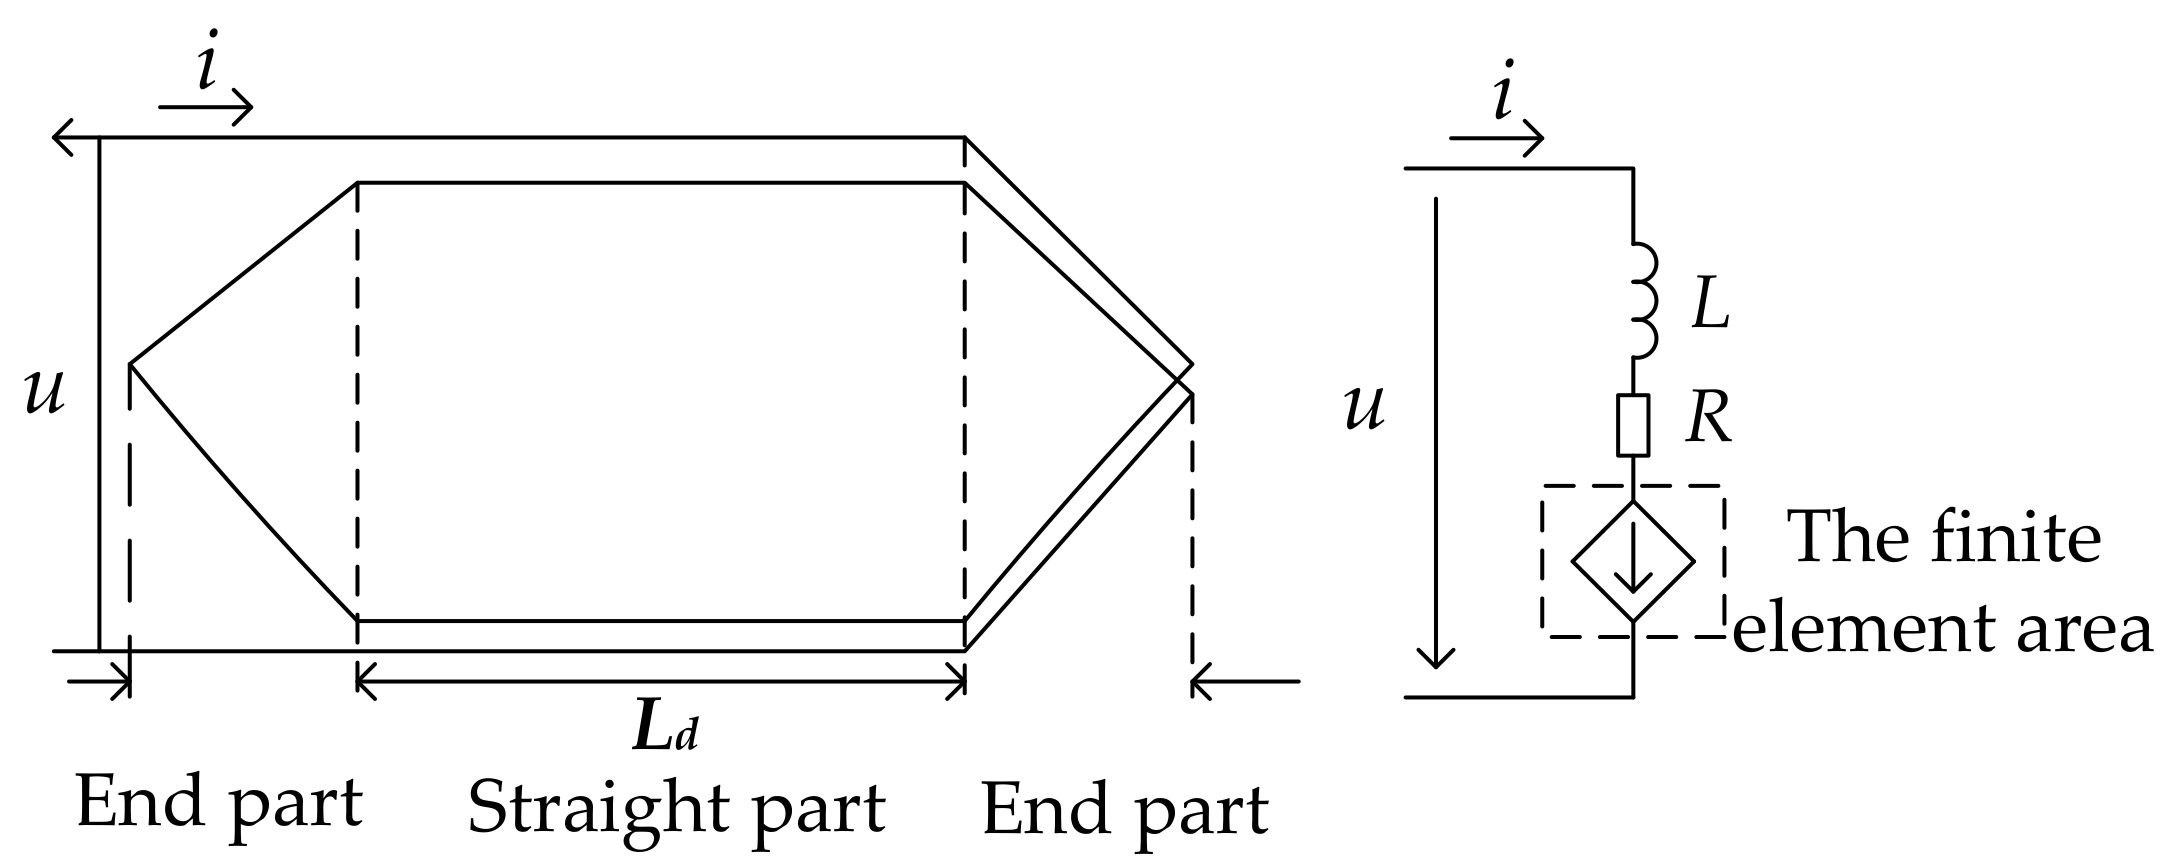
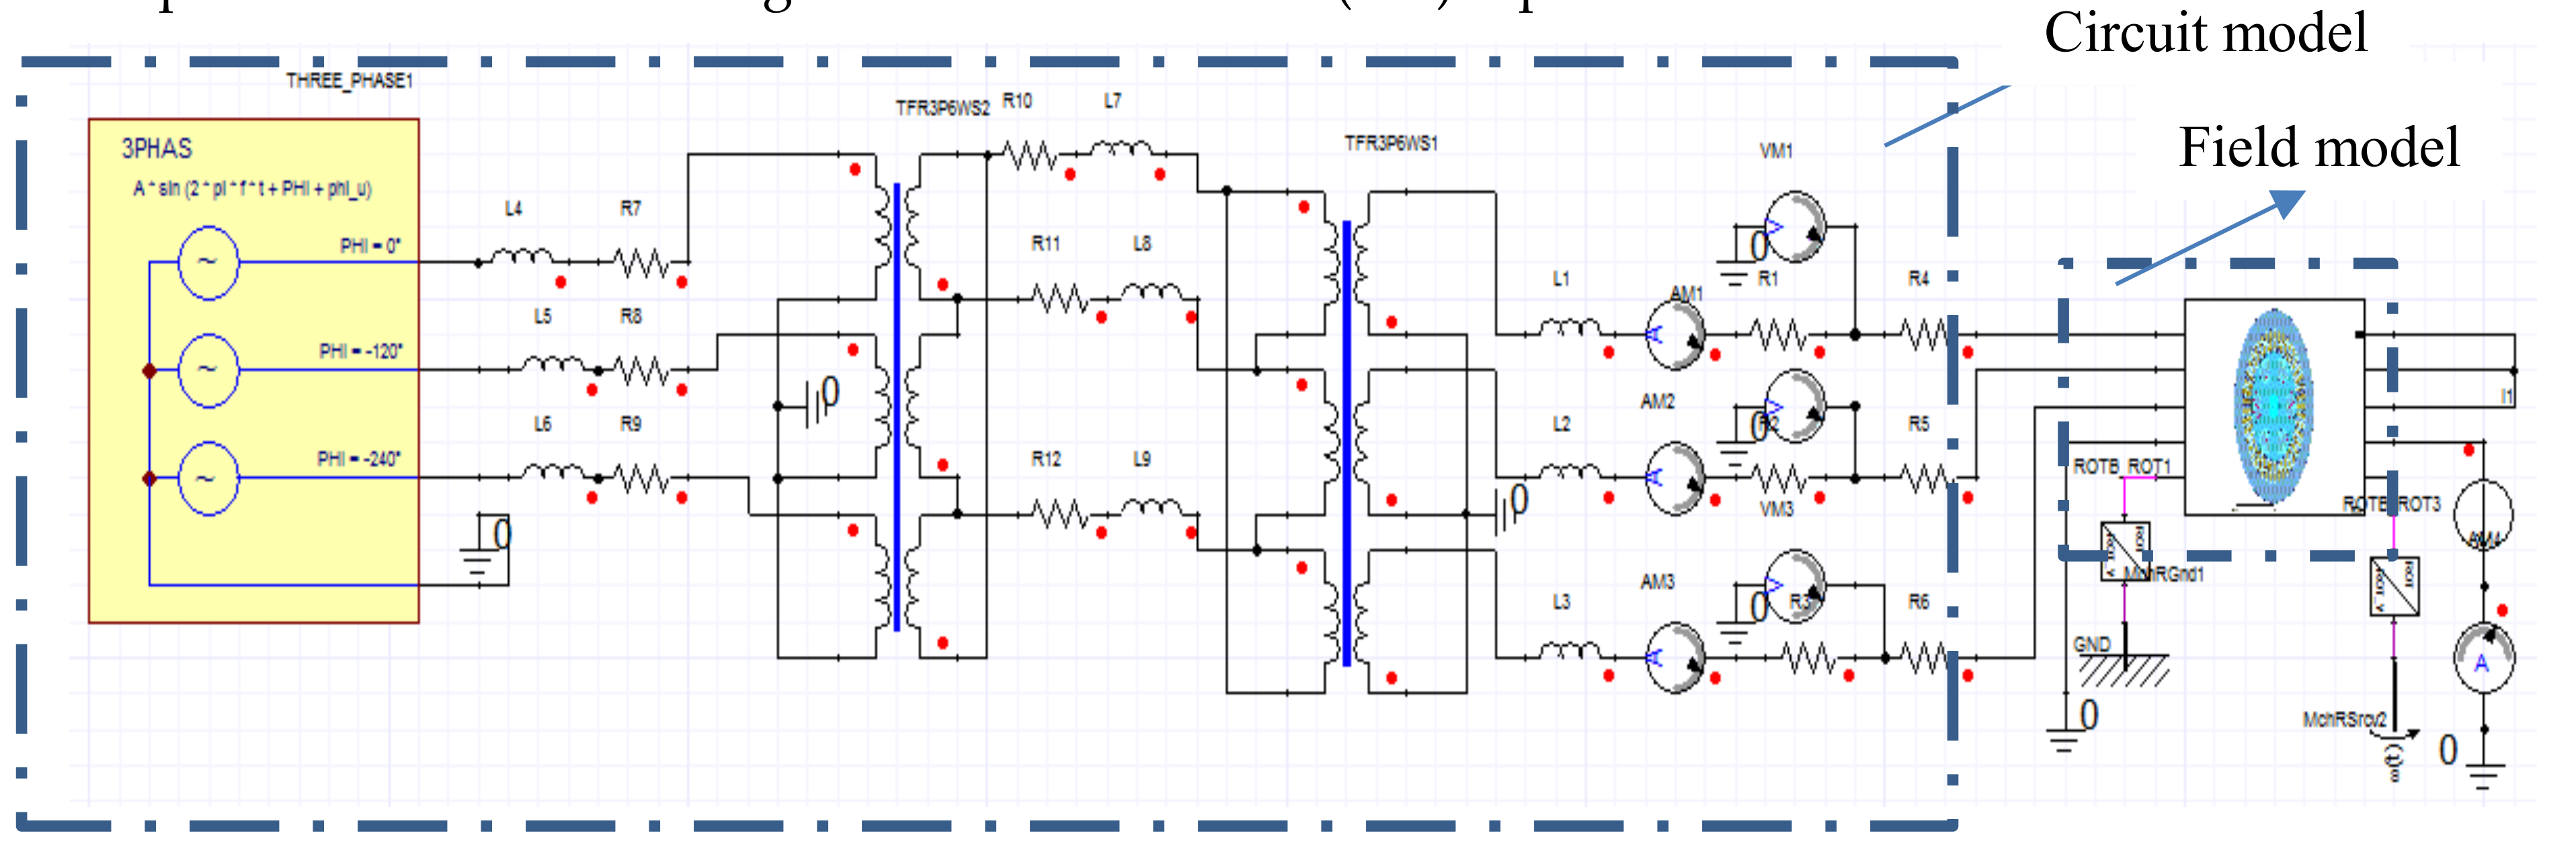
Using the direct field-circuit coupling method, the electromagnetic-field equations and the circuit system equations are solved together to establish an external circuit model [26,27,28,29,30]. Figure 3 shows a schematic of the field-circuit coupling.
The phase resistance of the stator winding ends is given by the following formula:
Here, a1 is the stator winding parallel branch number, S1 is the cross-sectional area of each wire, N1 is the number of wires around each branch, γ is the wire resistivity, l is the half-turn length of the coil, lef is the stator core length, and Zϕ is the number of series conductors per phase.
By using the finite element method, the vector magnetic potential A of each node can be obtained, and then the magnetic field energy can be obtained in the region:
The leakage reactance of the stator end is given by the following formula.
Here, J is the current density, Im is the stator peak current.
The generator is coupled to the external circuit through the stator windings. The external circuit equation is as follows:
Here, Es is the induced electromotive force matrix for the straight part of the stator winding, Us is the load phase voltage matrix, R is the stator winding matrix, I is the stator phase current matrix, and L is the stator leakage inductance matrix.
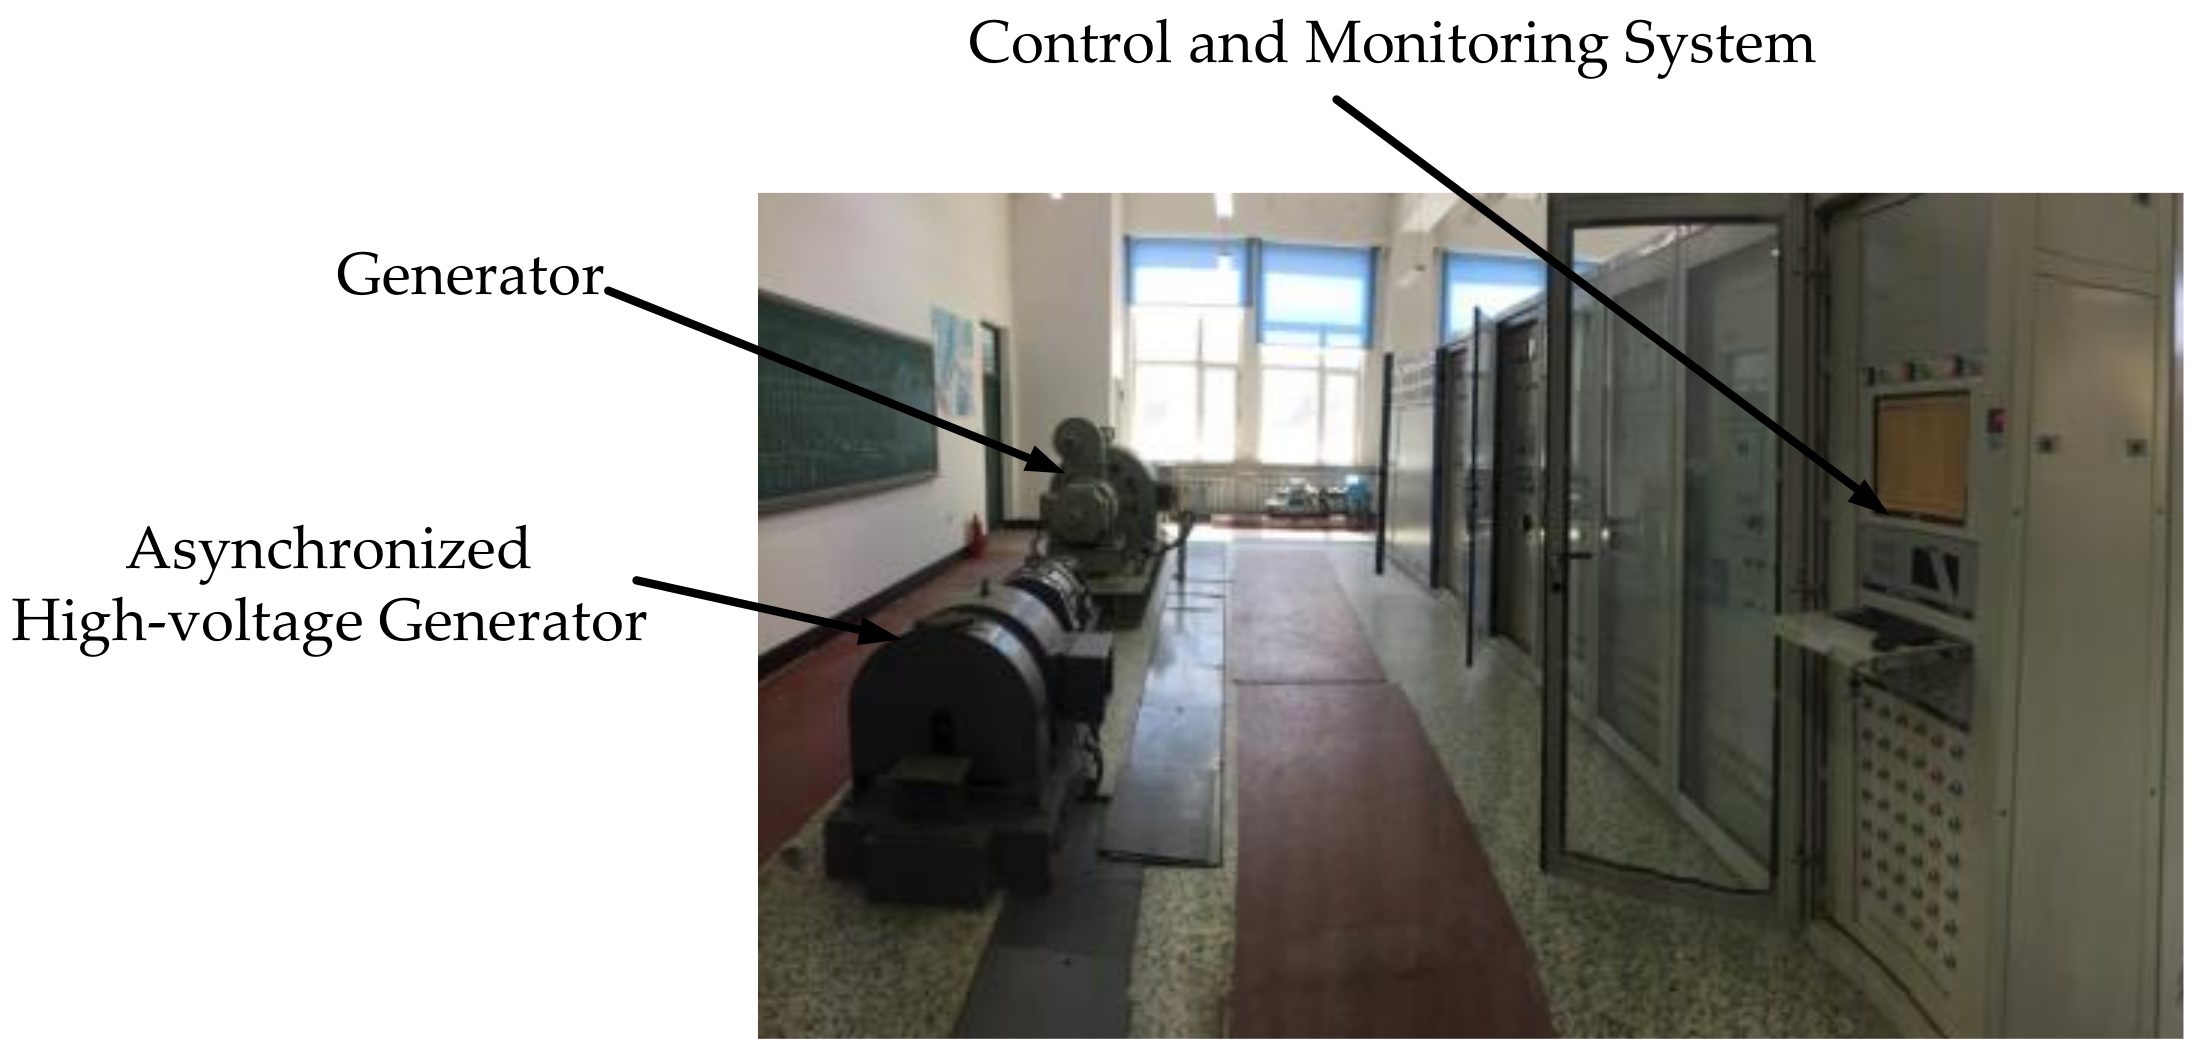
These parameters are based on the main wiring of the dynamic simulation laboratory, which is shown in Figure 4.
A simulation model of the field-circuit coupled system was established based on the main wiring of the dynamic simulation laboratory, and the power system dynamic simulation laboratory is shown in Figure 3. The output of the generator is connected to the school power network via a 400/800 V step-up transformer followed by a line impedance, as well as a step-down transformer of 800/400 V. When building the simulation module, we use ideal linear elements as the model elements. The combination system simulation model is shown in Figure 5, where the synchronous generator adopts a separate excitation winding with a direct-current (DC) input.
3.2. Modeling Validation
According to the MF-15 generator factory test report, when the generator operation terminal voltage is 380 V, the excitation current is 1.96 A with no-load, and the excitation current is 2.35 A under rated operation.
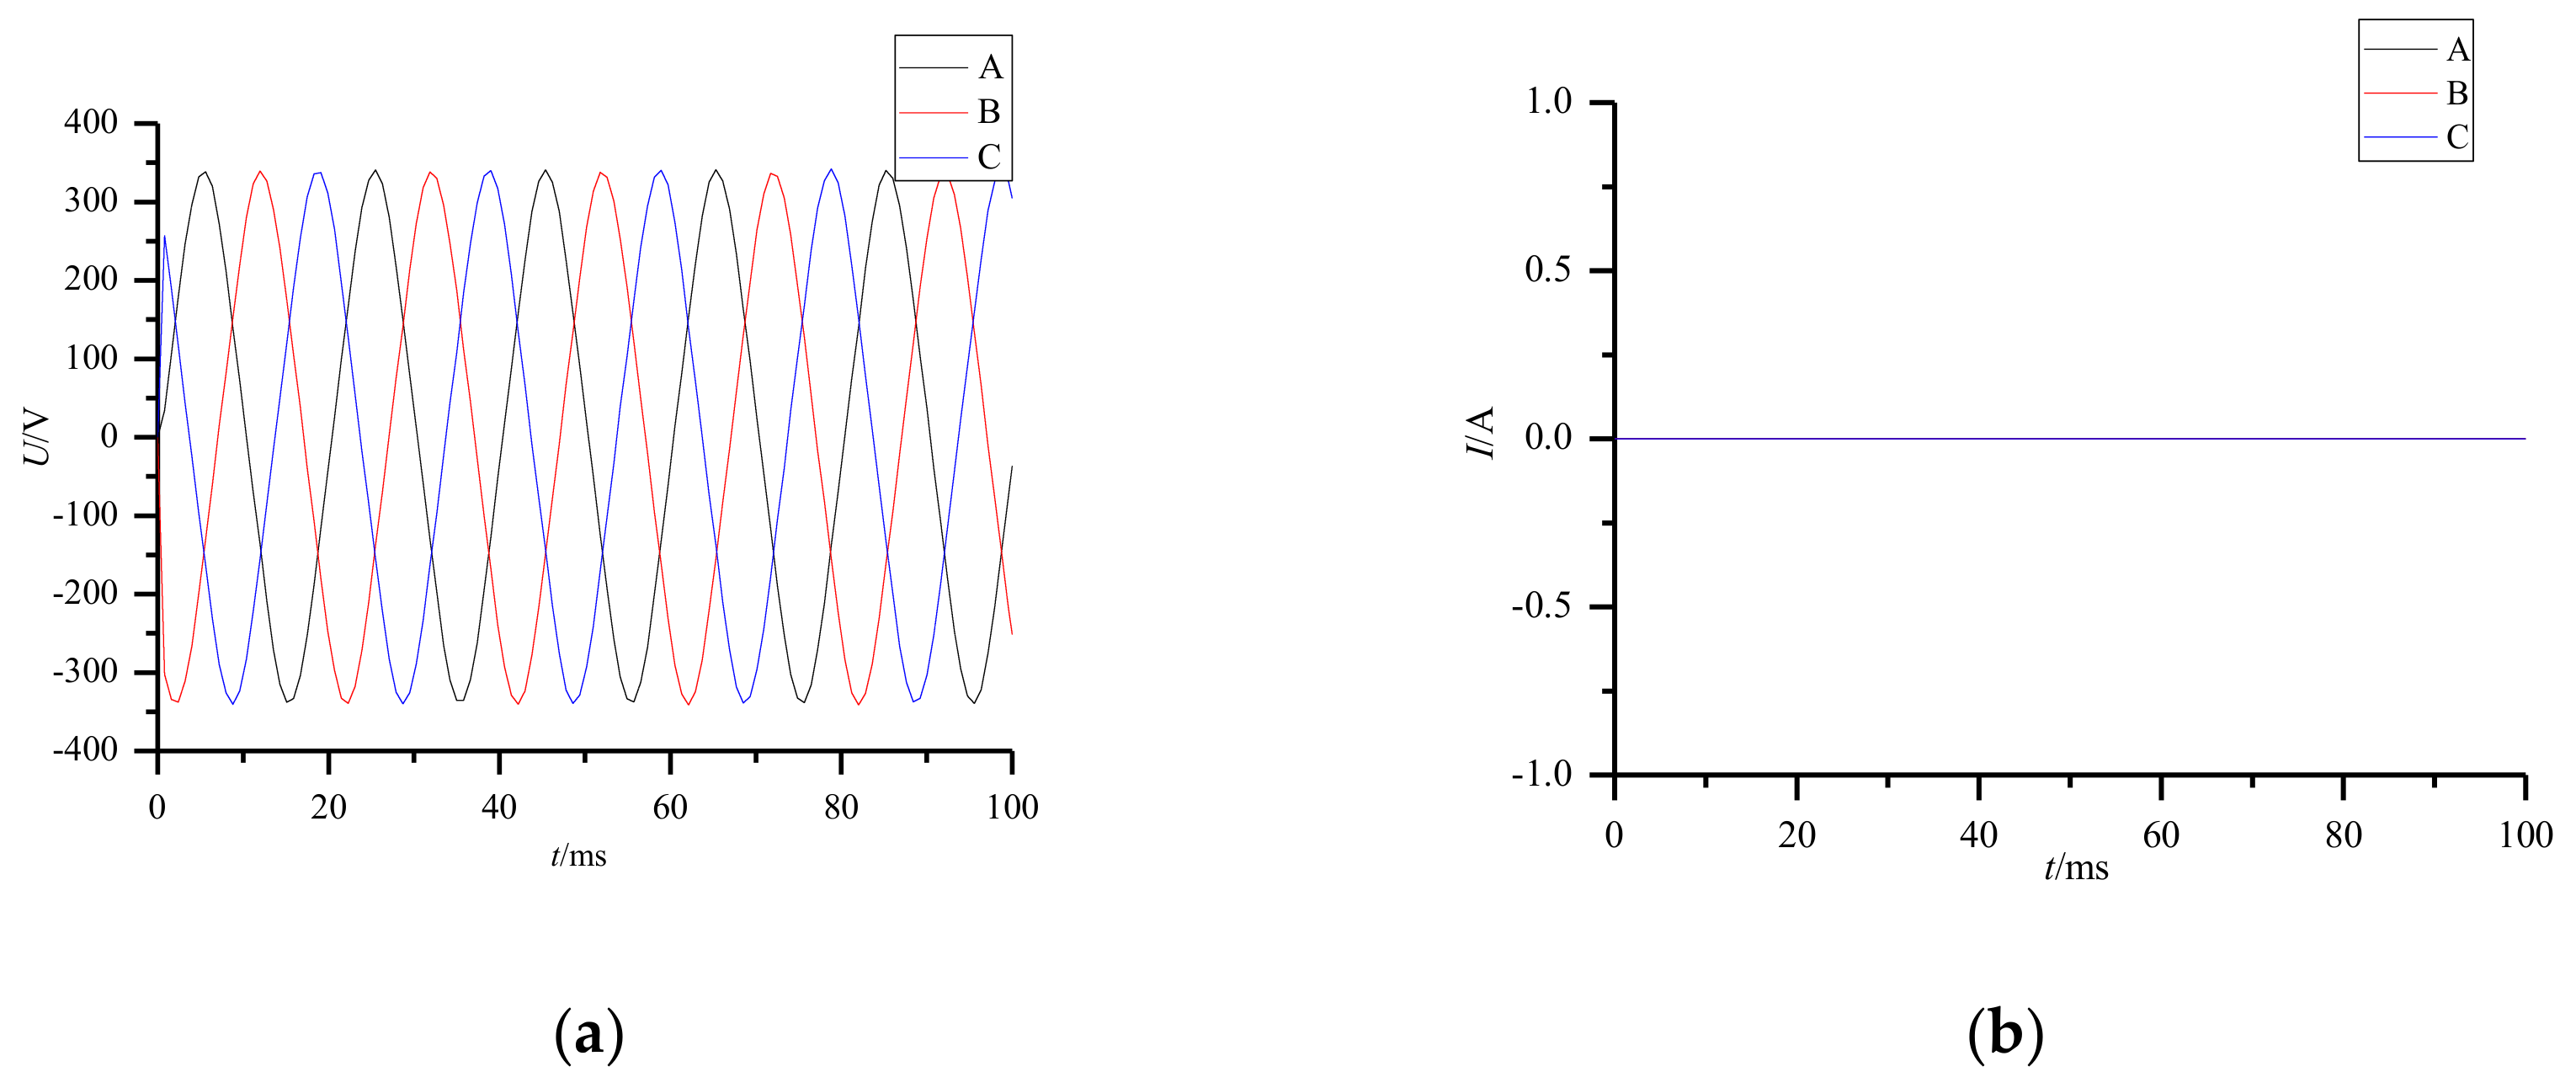
The generator stator windings are opened with no-load. Then, the generator is disconnected from the circuit connected to the system in the simulation model; the field-circuit coupled model is used for joint simulation during rated operation. The no-load excitation current value is input to the DC source, and no-load simulation is performed after the software analyzes the self-check without error.
We set the total simulation time as 0.2 s and observe the simulated generator terminal electromotive force and magnetic-field distribution. The results of the electromagnetic performance test are compared with the results of the joint simulation continued for 0.1 s.
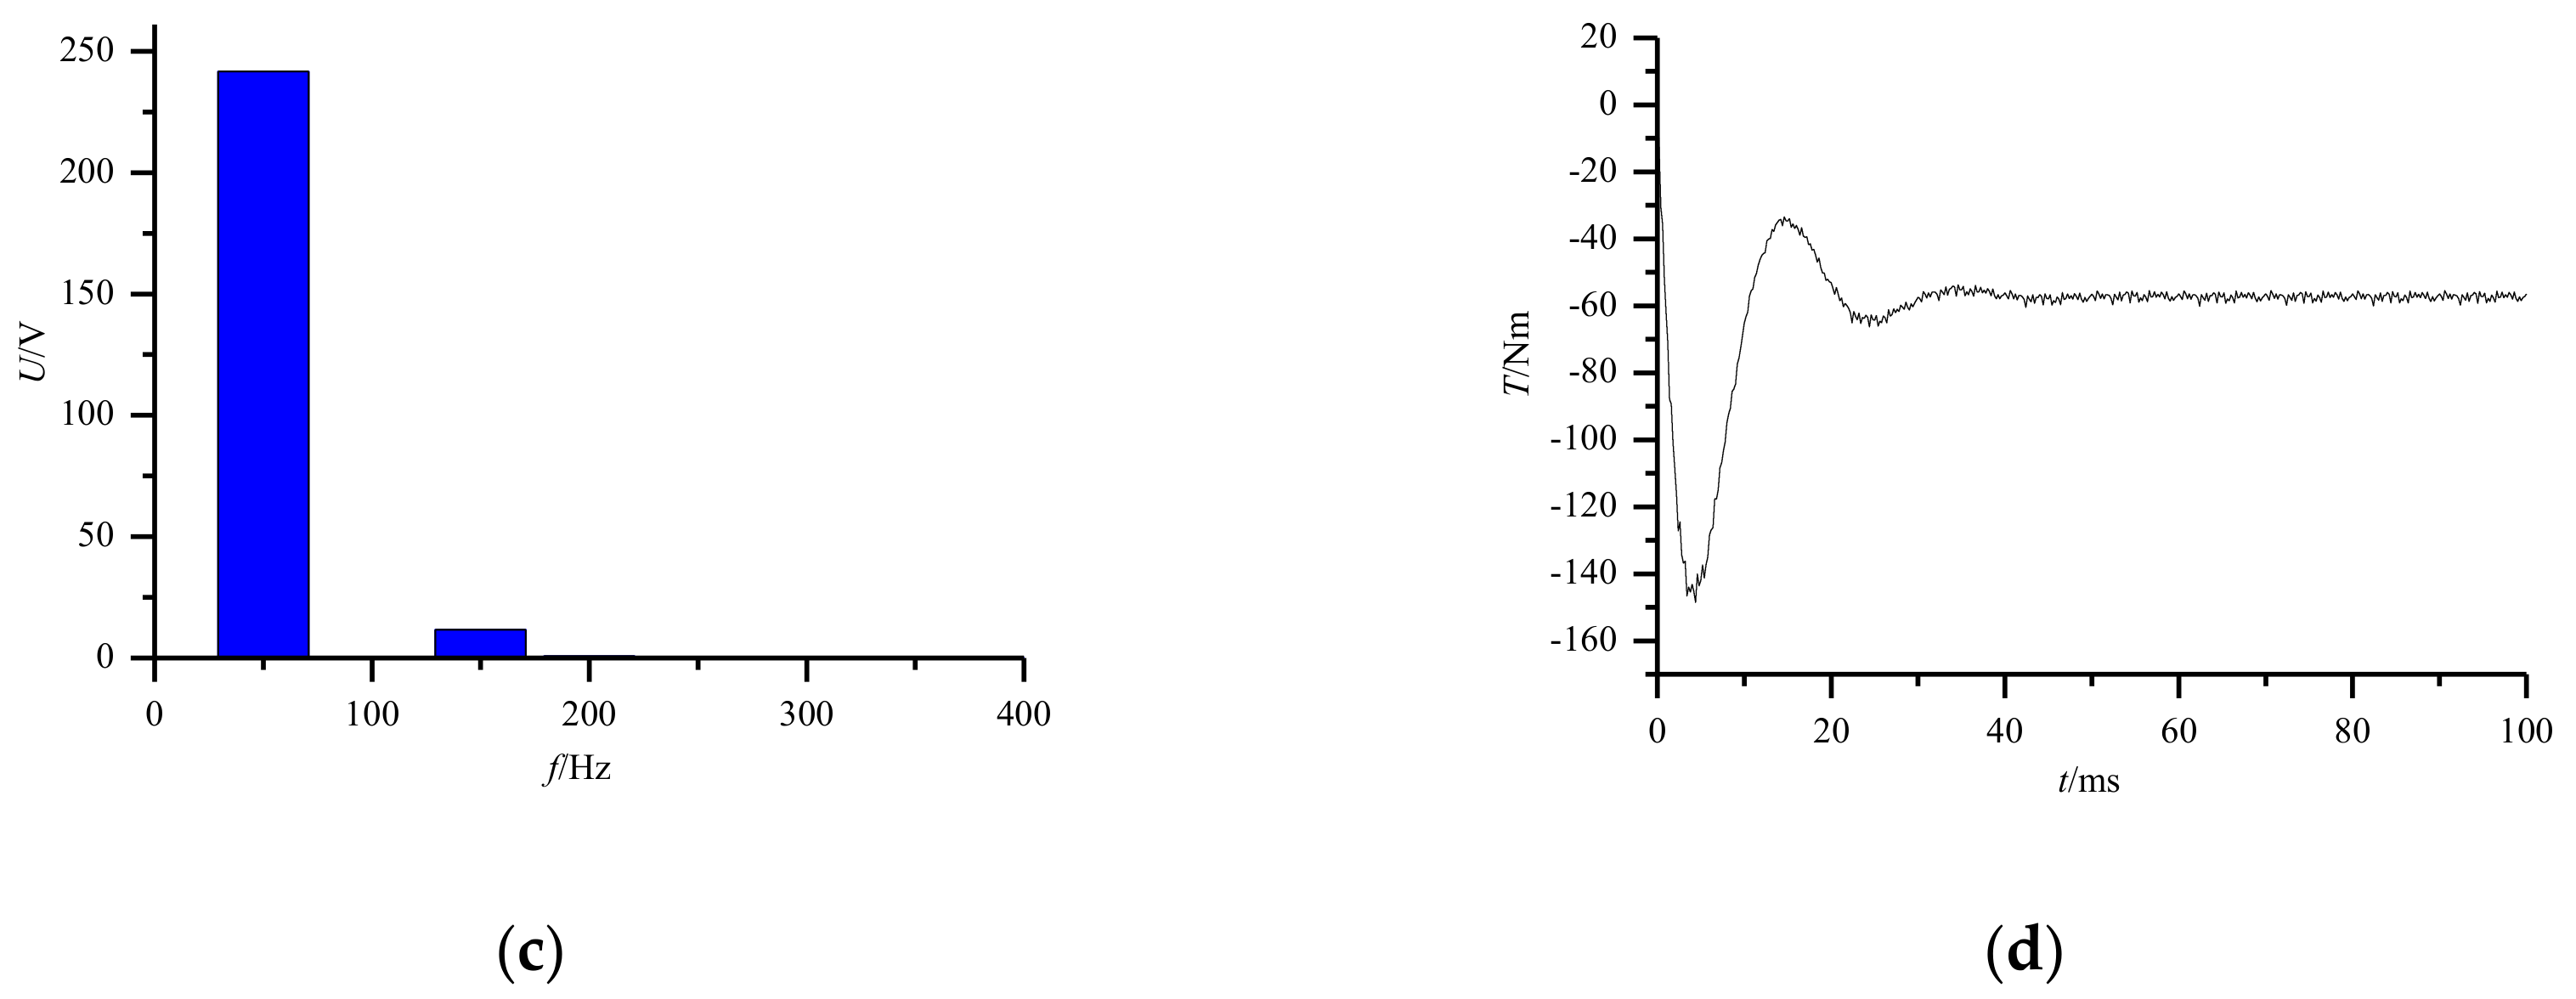
Under no-load conditions, the excitation current is used as the standard for comparing the test results and simulation results. At this time, the simulation value is slightly higher than the test value; the voltage deviation is 7.8%, the air-gap flux density deviation is 5.4%, and the error is relatively large. Because of the characteristics of the simulated generator, it has to maintain stable operation and it is difficult to achieve saturation and the safety margin is large, thus, the error is large. The data of no-load characteristic test and the statistical table of simulation results are presented in Figure 6 and Figure 7 and Table 2.
The generator voltage is relatively low under the rated-load operation. At this time, the voltage offset is 5.2%, and the air-gap flux density error is 4.7%. The comparison reveals that the finite-element calculation results are consistent with the generator test data, indicating the accuracy of the model and the correctness of the calculation results. The data of rated running test and the statistical table of simulation results are presented in Figure 8 and Figure 9 and Table 3.
Through the comparison, it can be concluded that the finite element simulation results are basically consistent with the generator factory test data, which can prove the accuracy of the model and the correctness of the calculation results.
4. Leading Phase Test Analysis
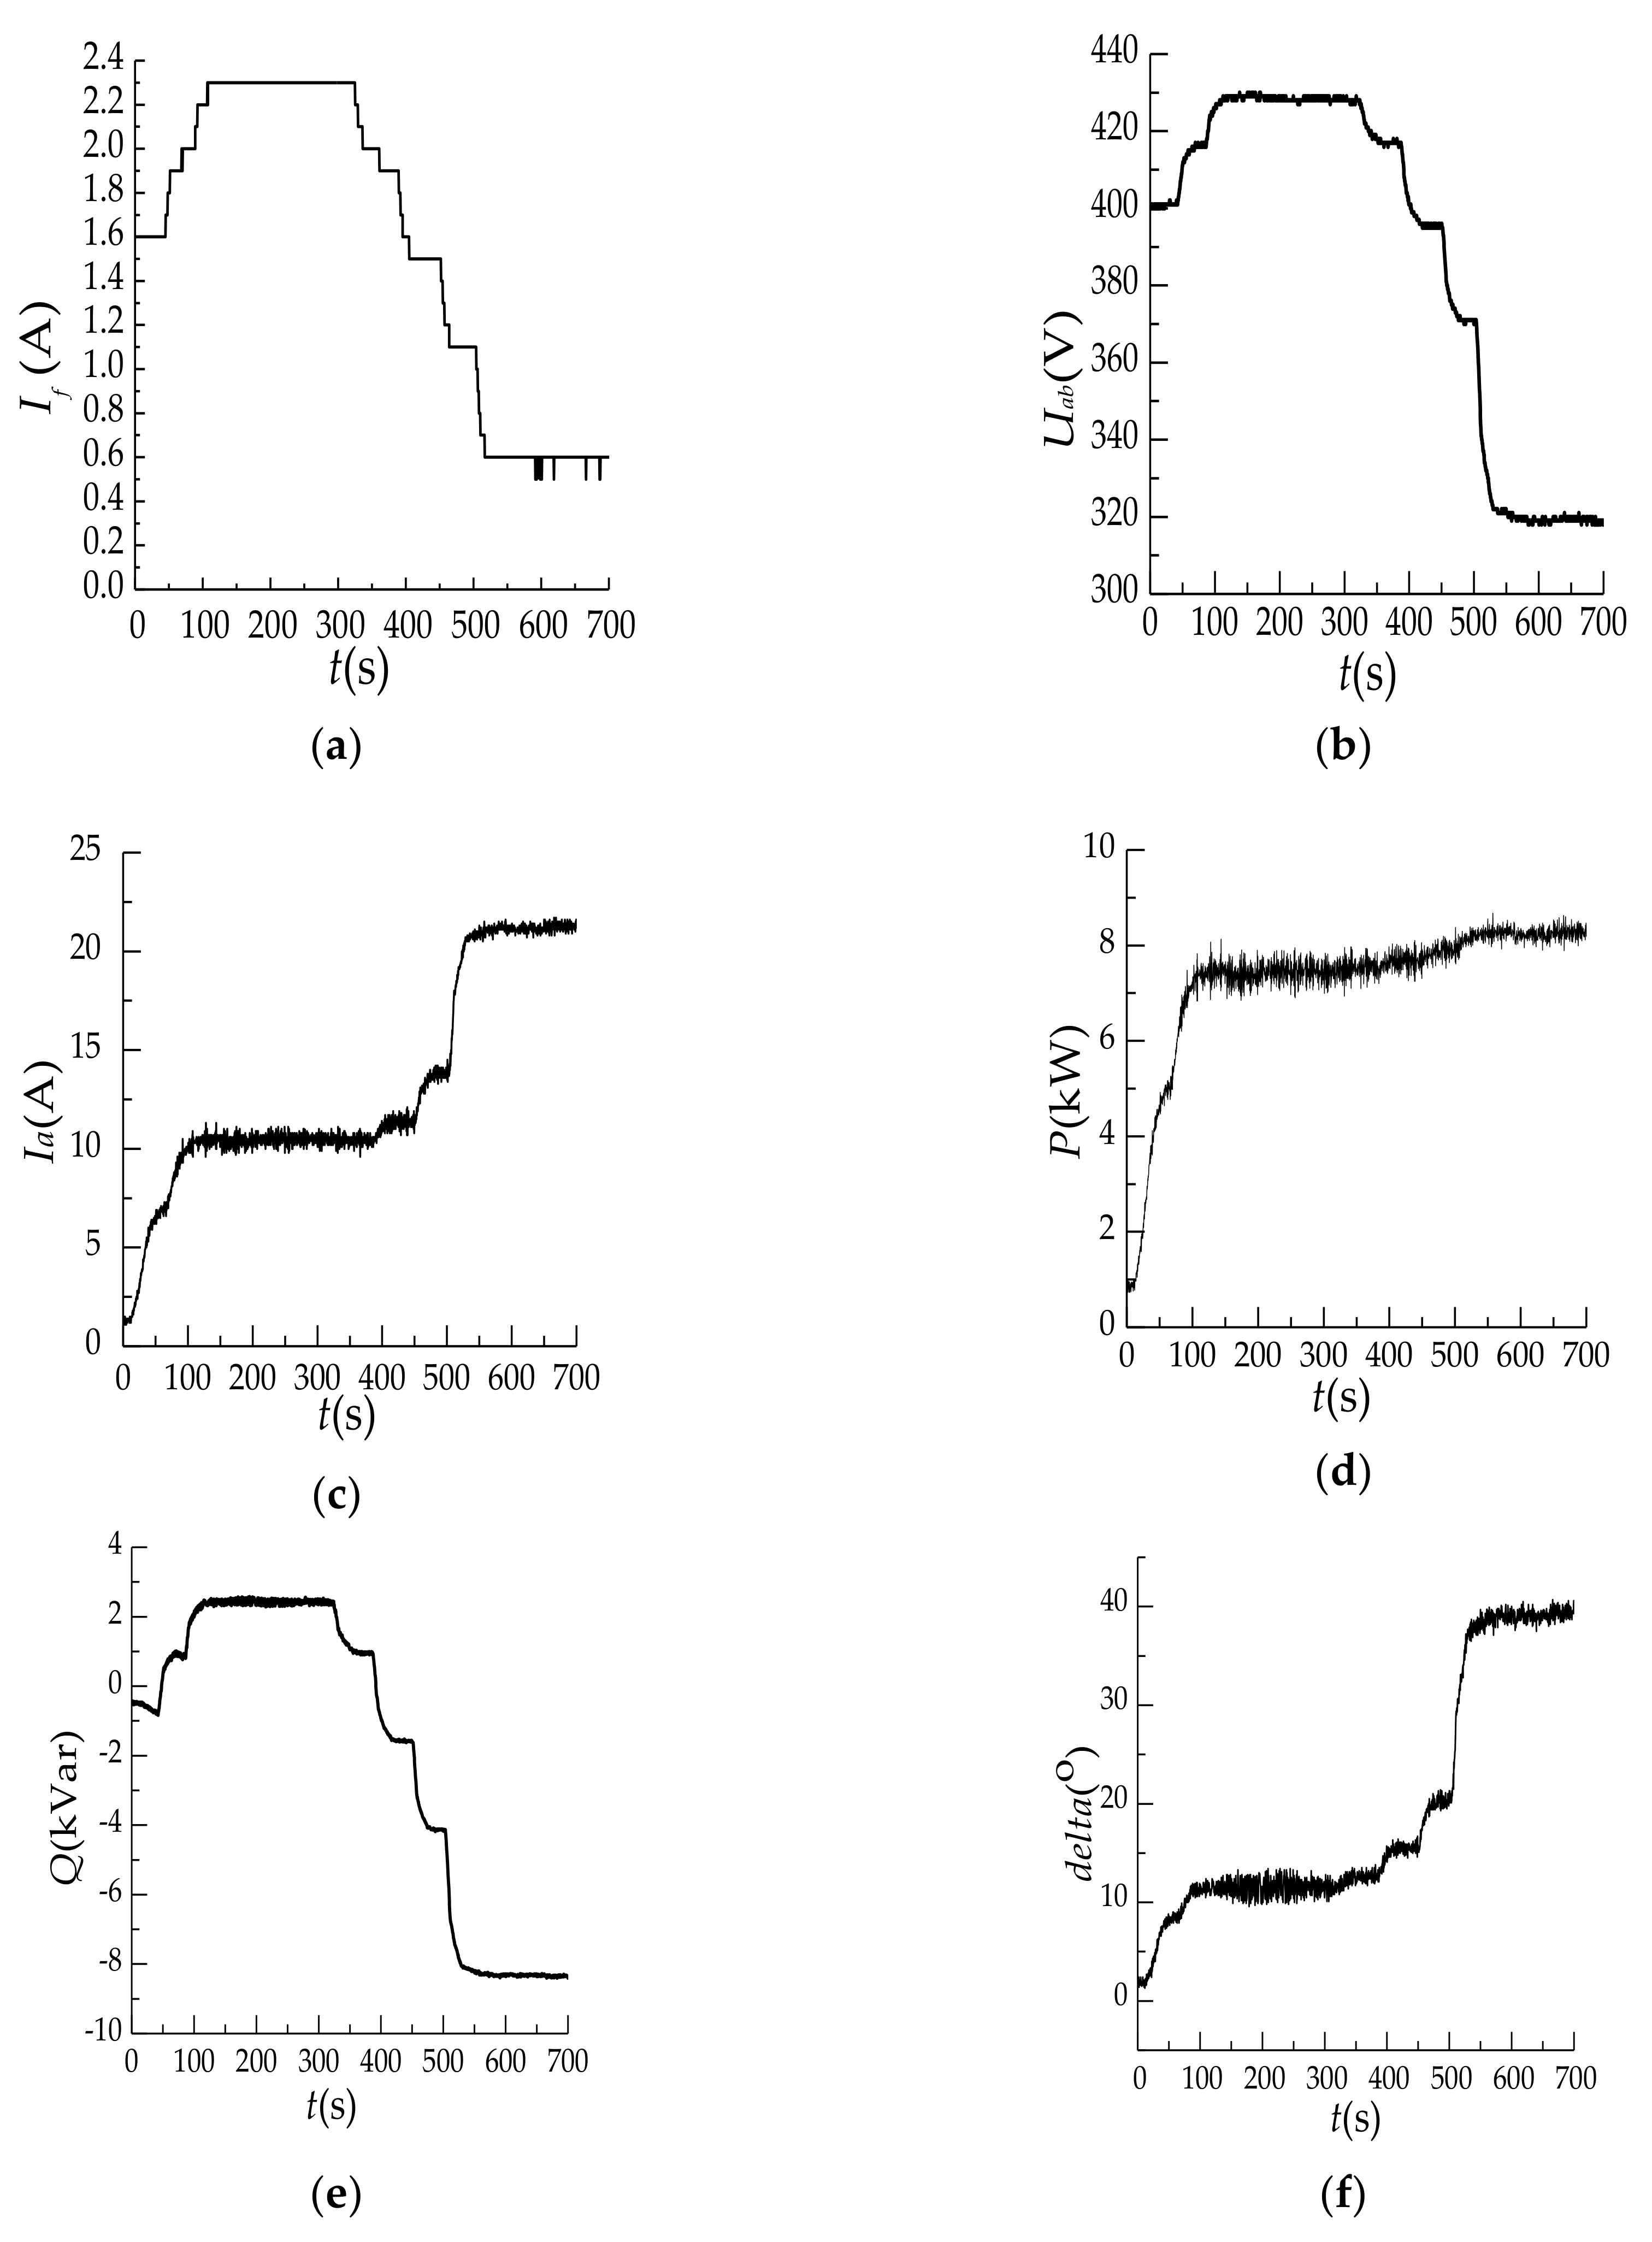
The test is performed using a dynamic simulation laboratory unit. When the generator is transferred from the lagging phase to the leading phase with 50% of the rated-load, the excitation current is reduced for a period of time. After the electrical parameters continued stable in this state, the current decreases continuously. The change of each electrical parameter is shown in Figure 10. The final generator power factor is −0.984.
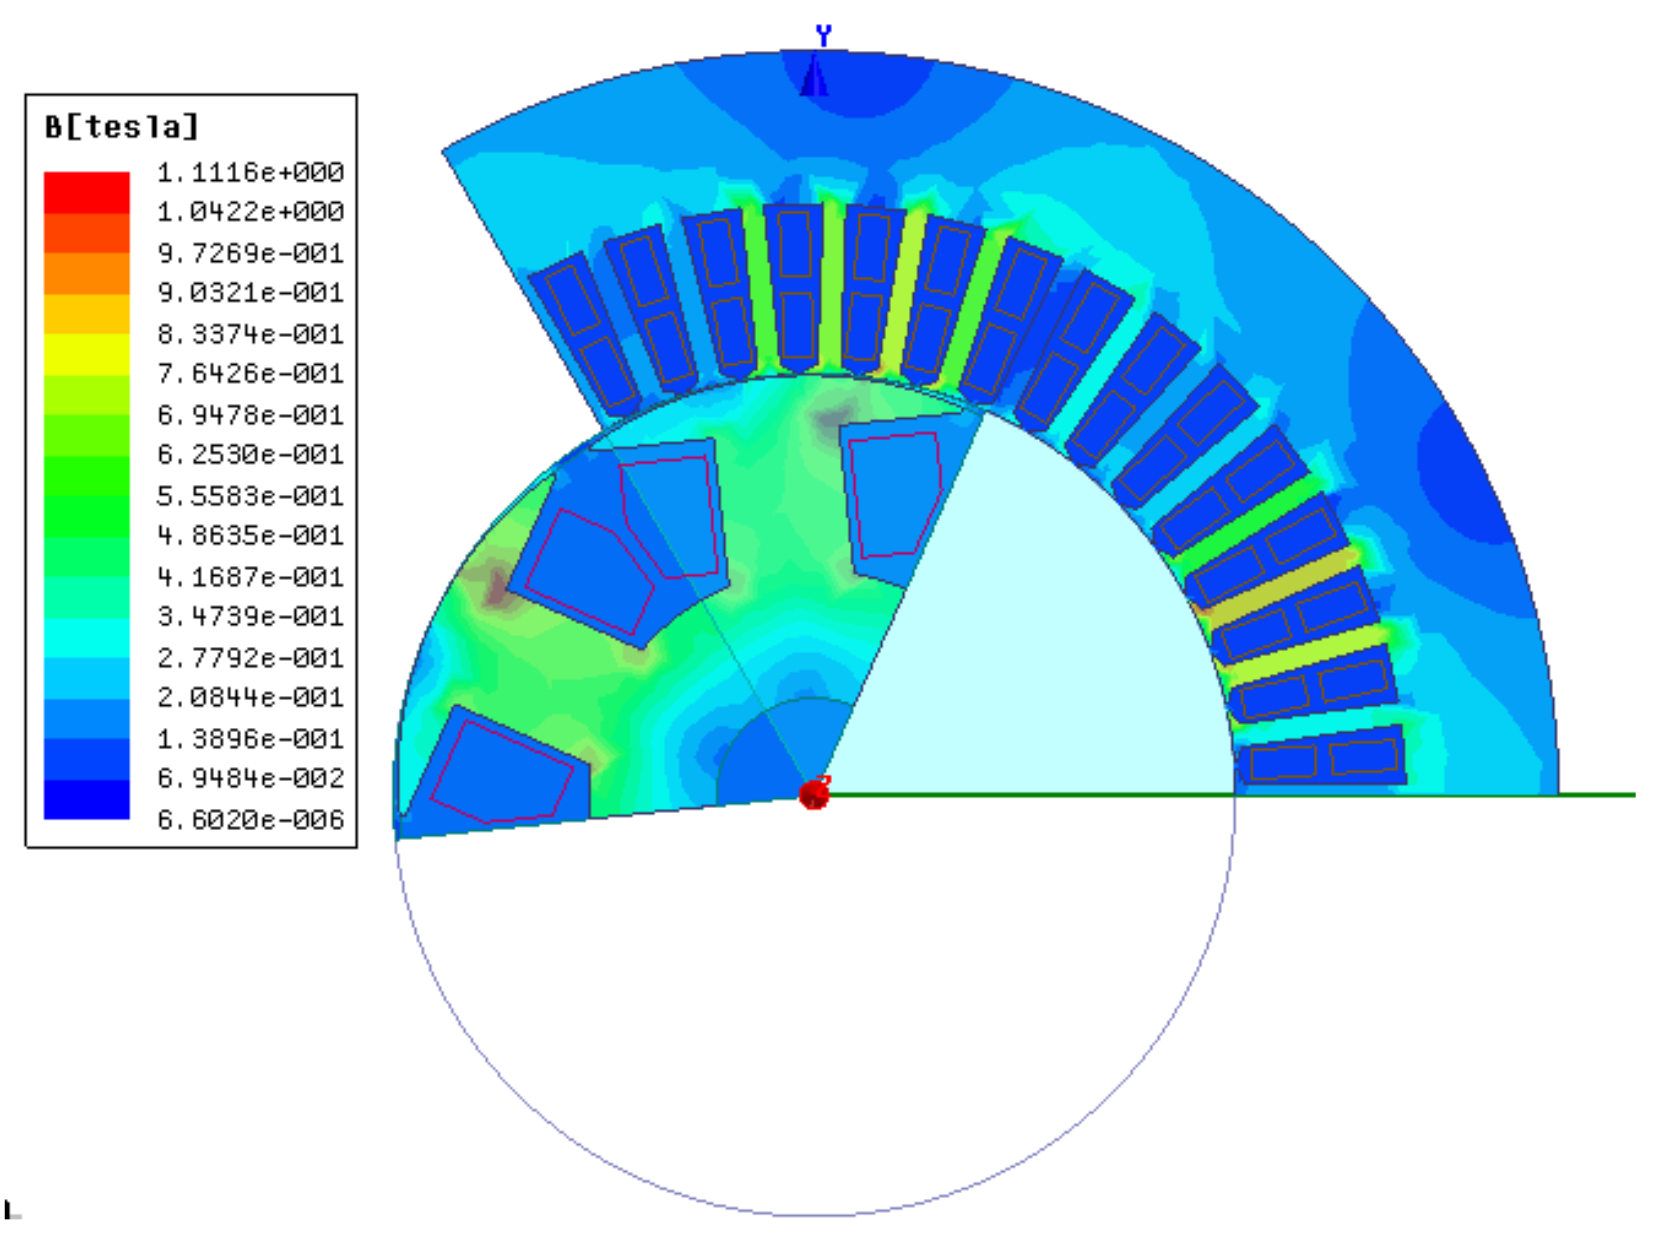
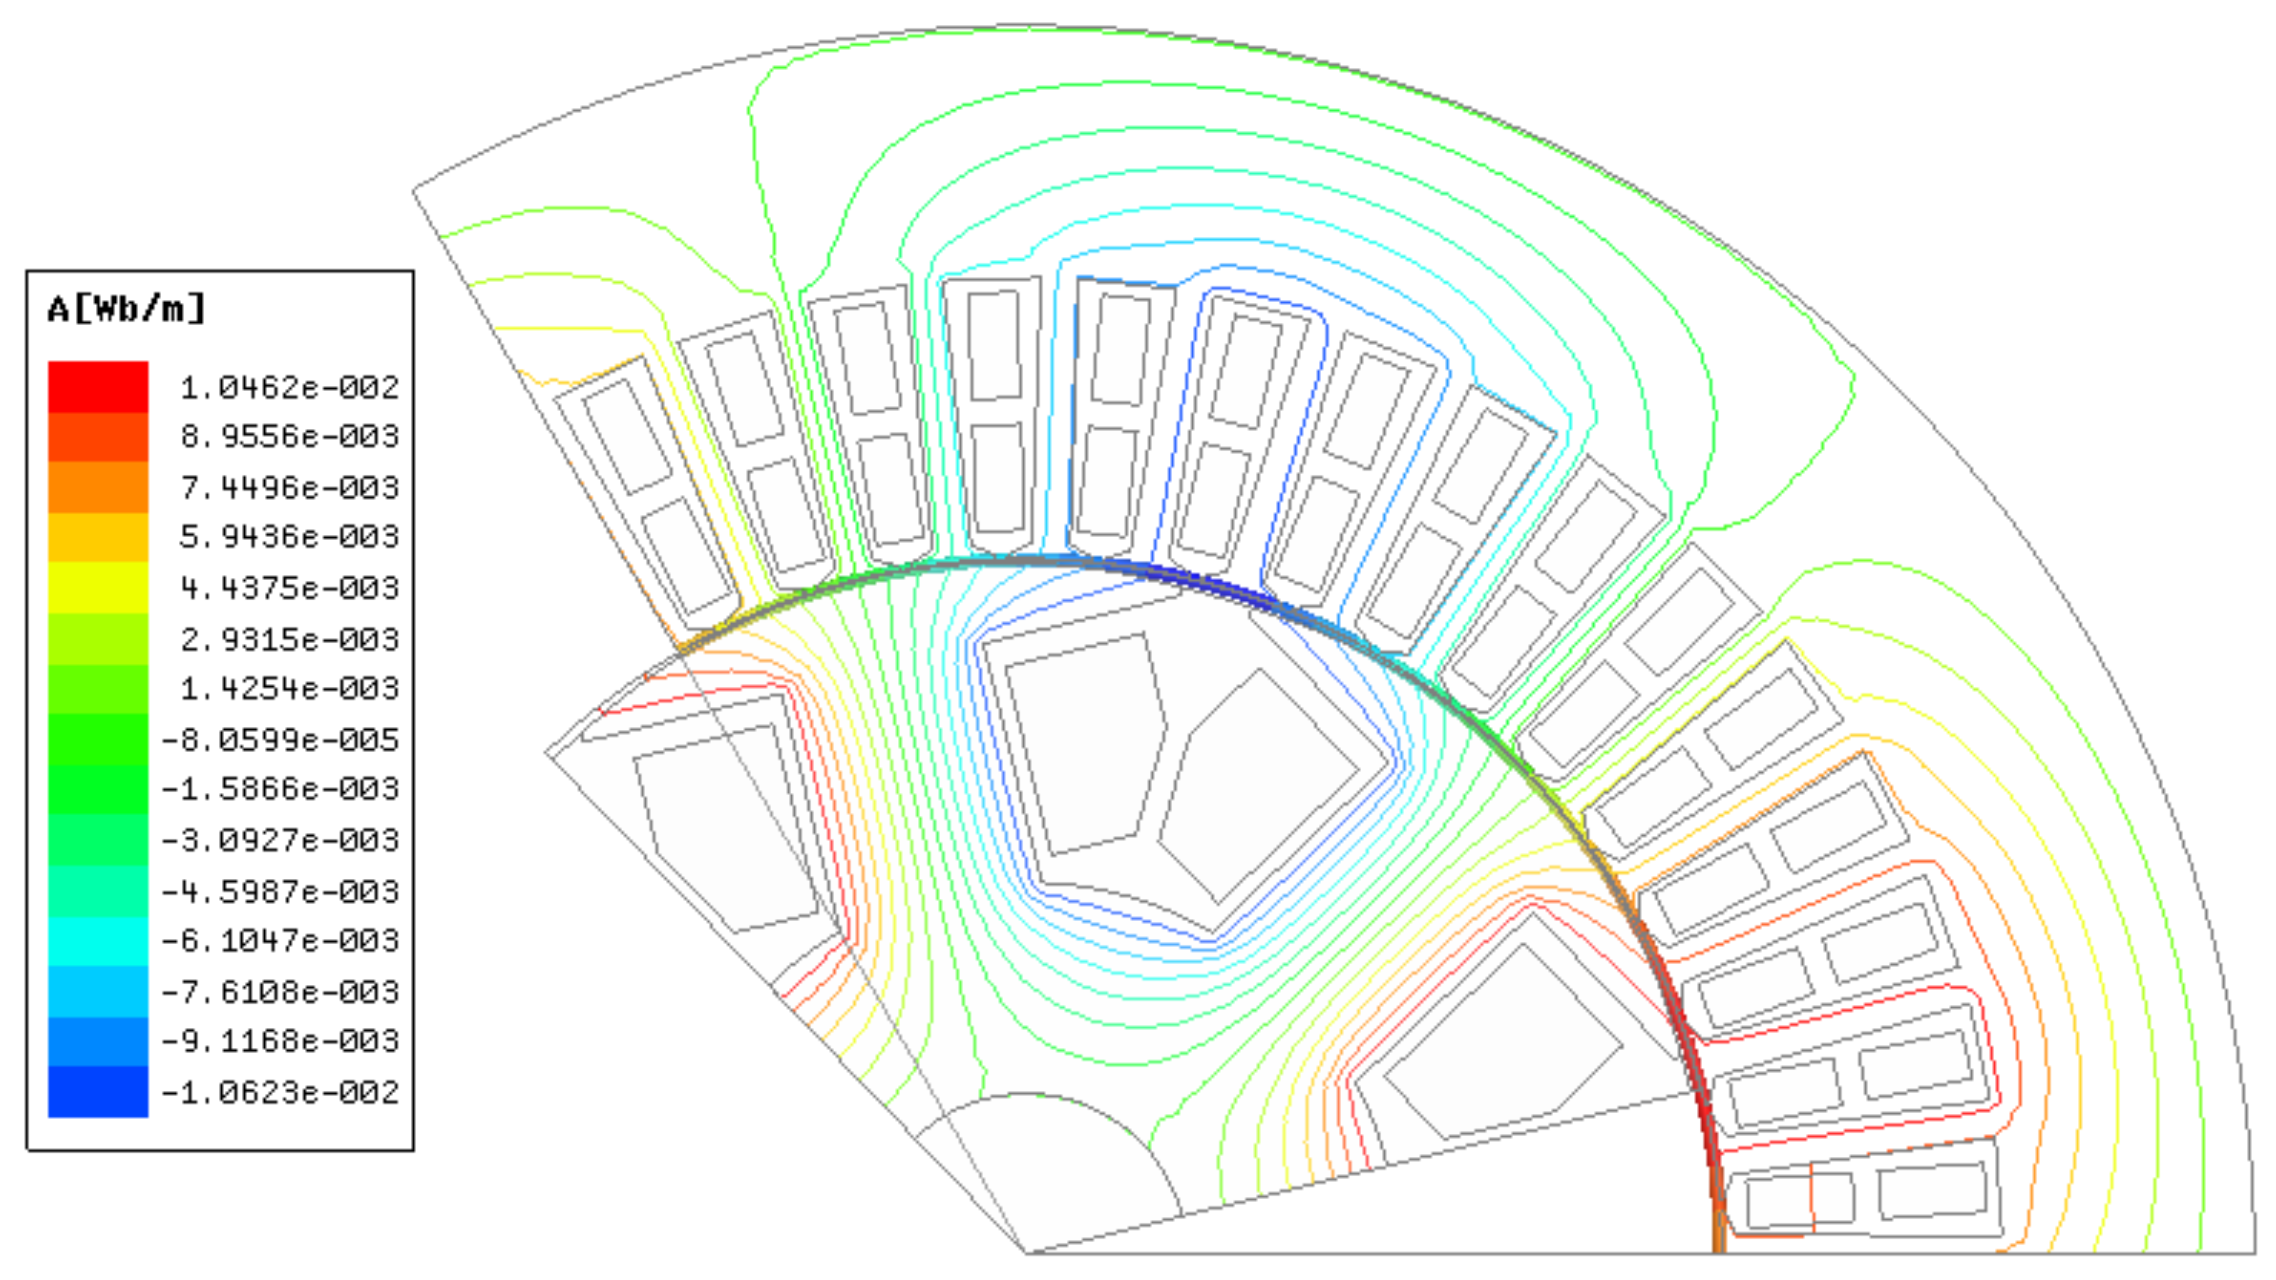
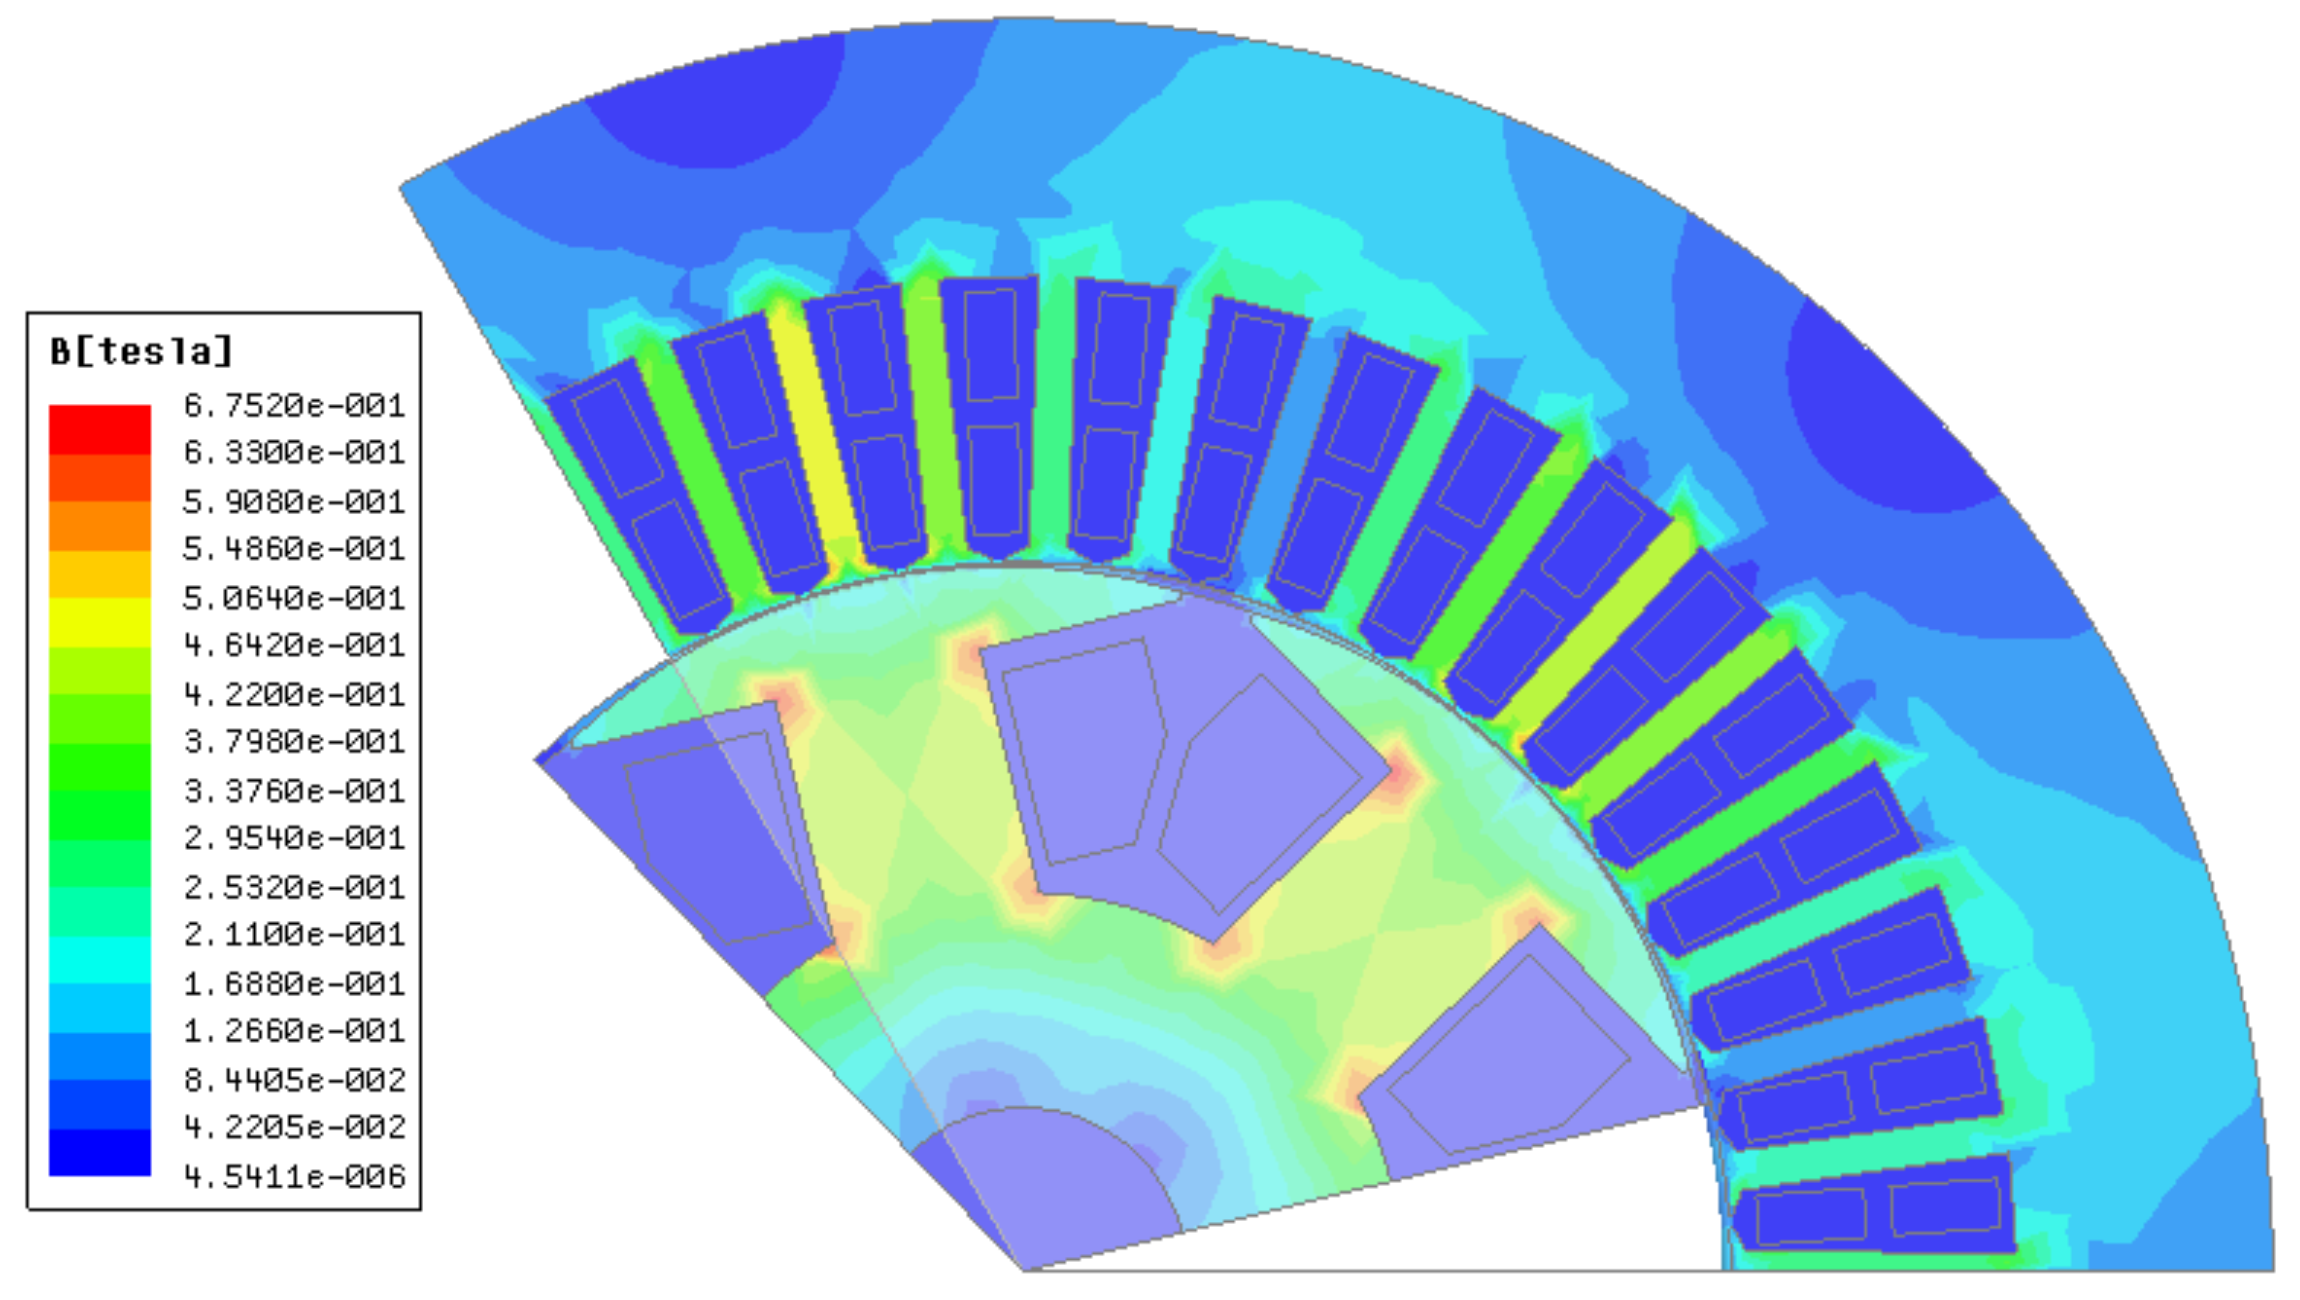
Field-circuit coupling co-simulation is used to analyze the magnetic-field lines, air-gap magnetic-field lines, and magnetic-density distribution of the generator, as shown in Figure 11 and Figure 12.
The simulation results for the internal magnetic field of the generator indicate that the internal magnetic-field lines are densely distributed under the working conditions, and the magnetic flux is maximized at 0.1 Wb. The magnetic density is relatively high near the field winding of the magnetic pole and near the air gap at the edge of the stator core, and its maximum value is approximately 0.7 T. At this time, the stator current is high, the leading phase is already deep, and the superimposed situation of the leakage magnetic field at the winding end is obvious.
5. Leading Phase Depth and Stability Analysis
For the experiment, the generator with a high proportion of load conditions is selected for the maximum depth of the leading phase test. After the generator is stable in the lagging phase operation for a period of time, the larger-magnitude excitation current is reduced so that the generator can quickly enter the leading phase operation state.
According to the leading phase operating standard, the stator currents exceeding 5% of the rated current cause significant temperature rises. Therefore, the overcurrent protection setting value of the generator is set as 1.05 times the rated current [31].
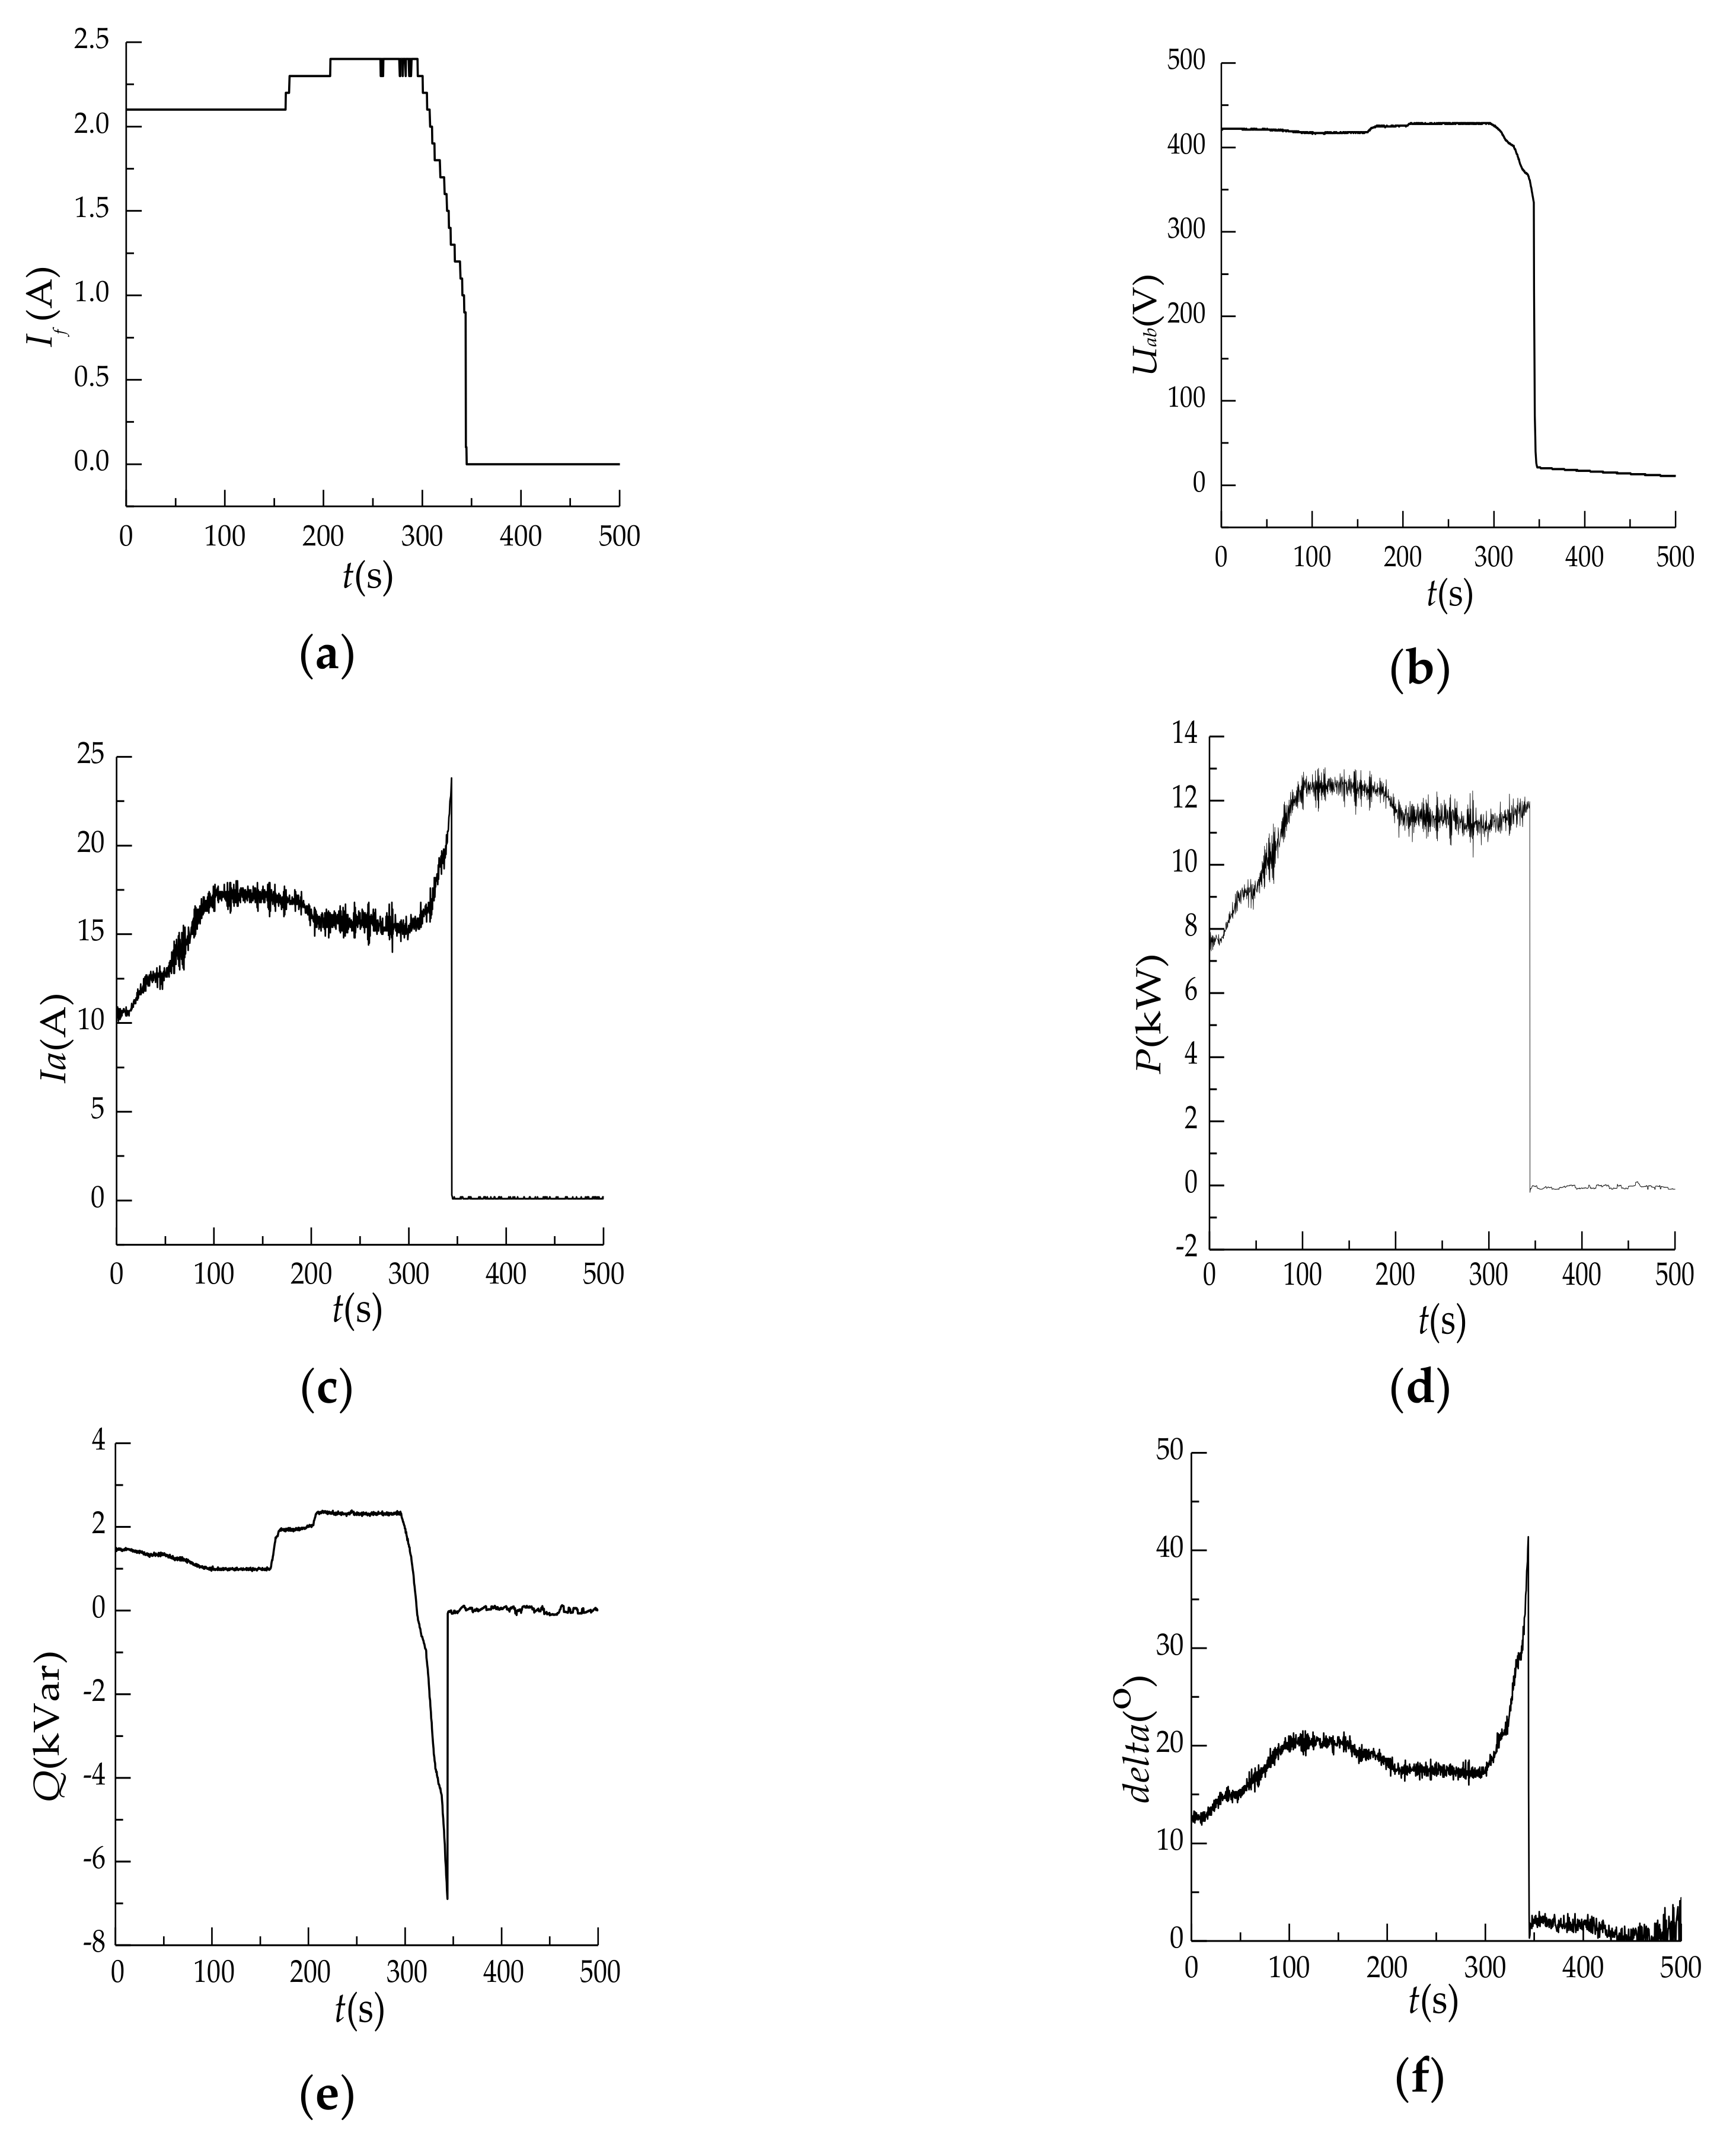
In the test, the speed of generator is first increased to increase the active power, and the generator is loaded to the greatest extent possible. However, considering the comprehensive safety considerations, it is determined that an active power of 1500 W at t = 250 s is the initial state, which means that the generator is loaded to 96%. Then, the excitation current is rapidly reduced to change the operation state. Subsequently, the excitation current is slowly reduced until relay protection occurs.
The fault report shows the overcurrent protection action of the stator loop current. The recorded wave data show that the stator current reaches its maximum value before the generator and system are disconnected. This value is 1.05 times the rated current. The test results are shown in Figure 13.
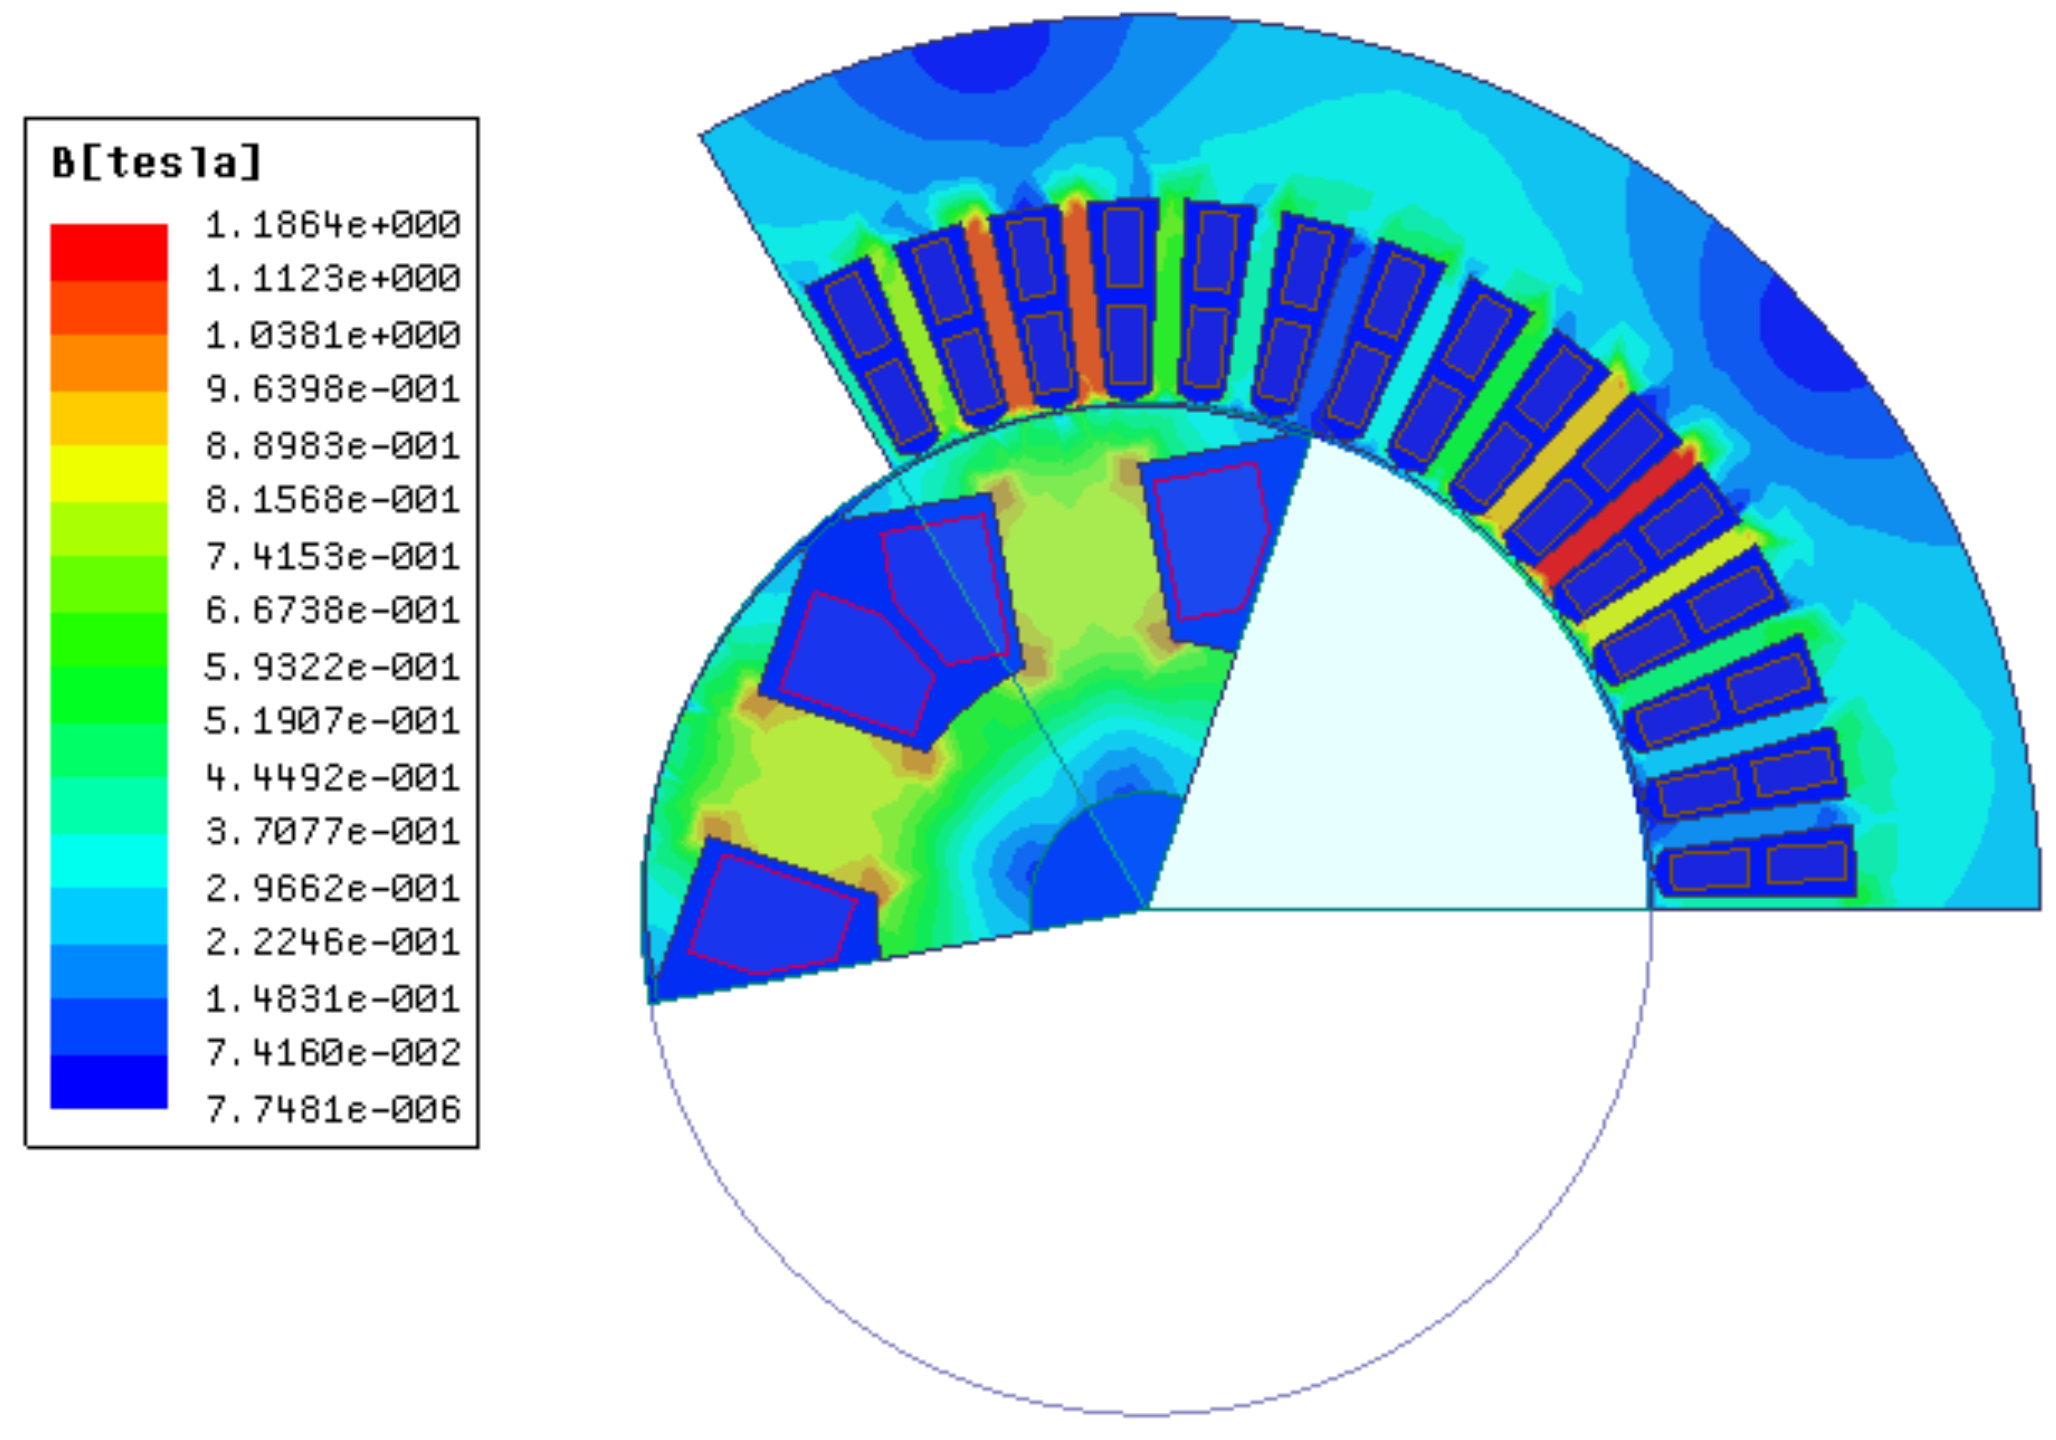
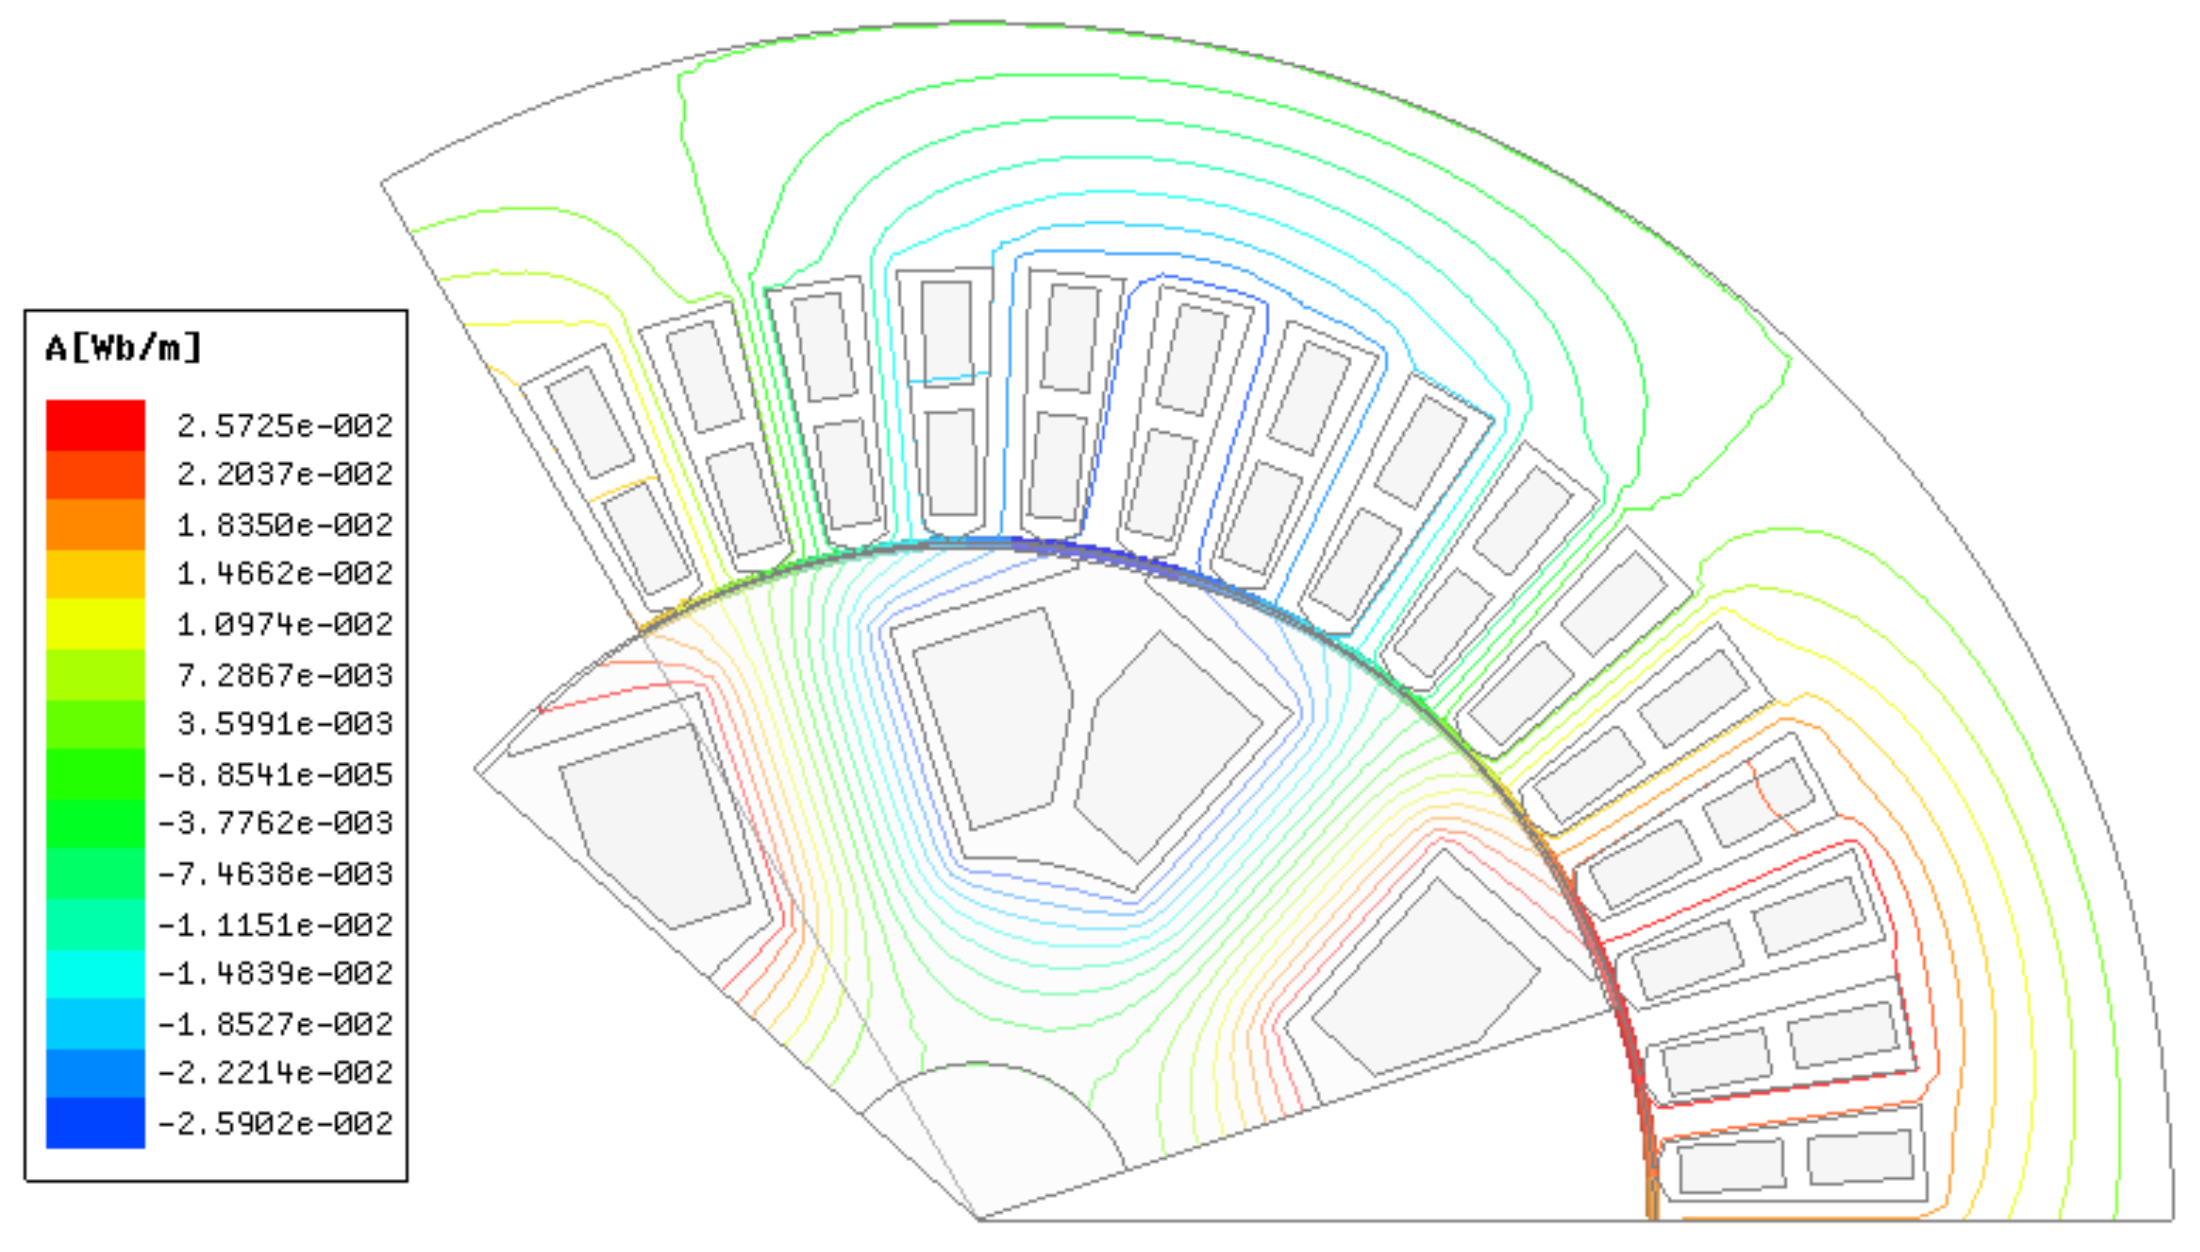
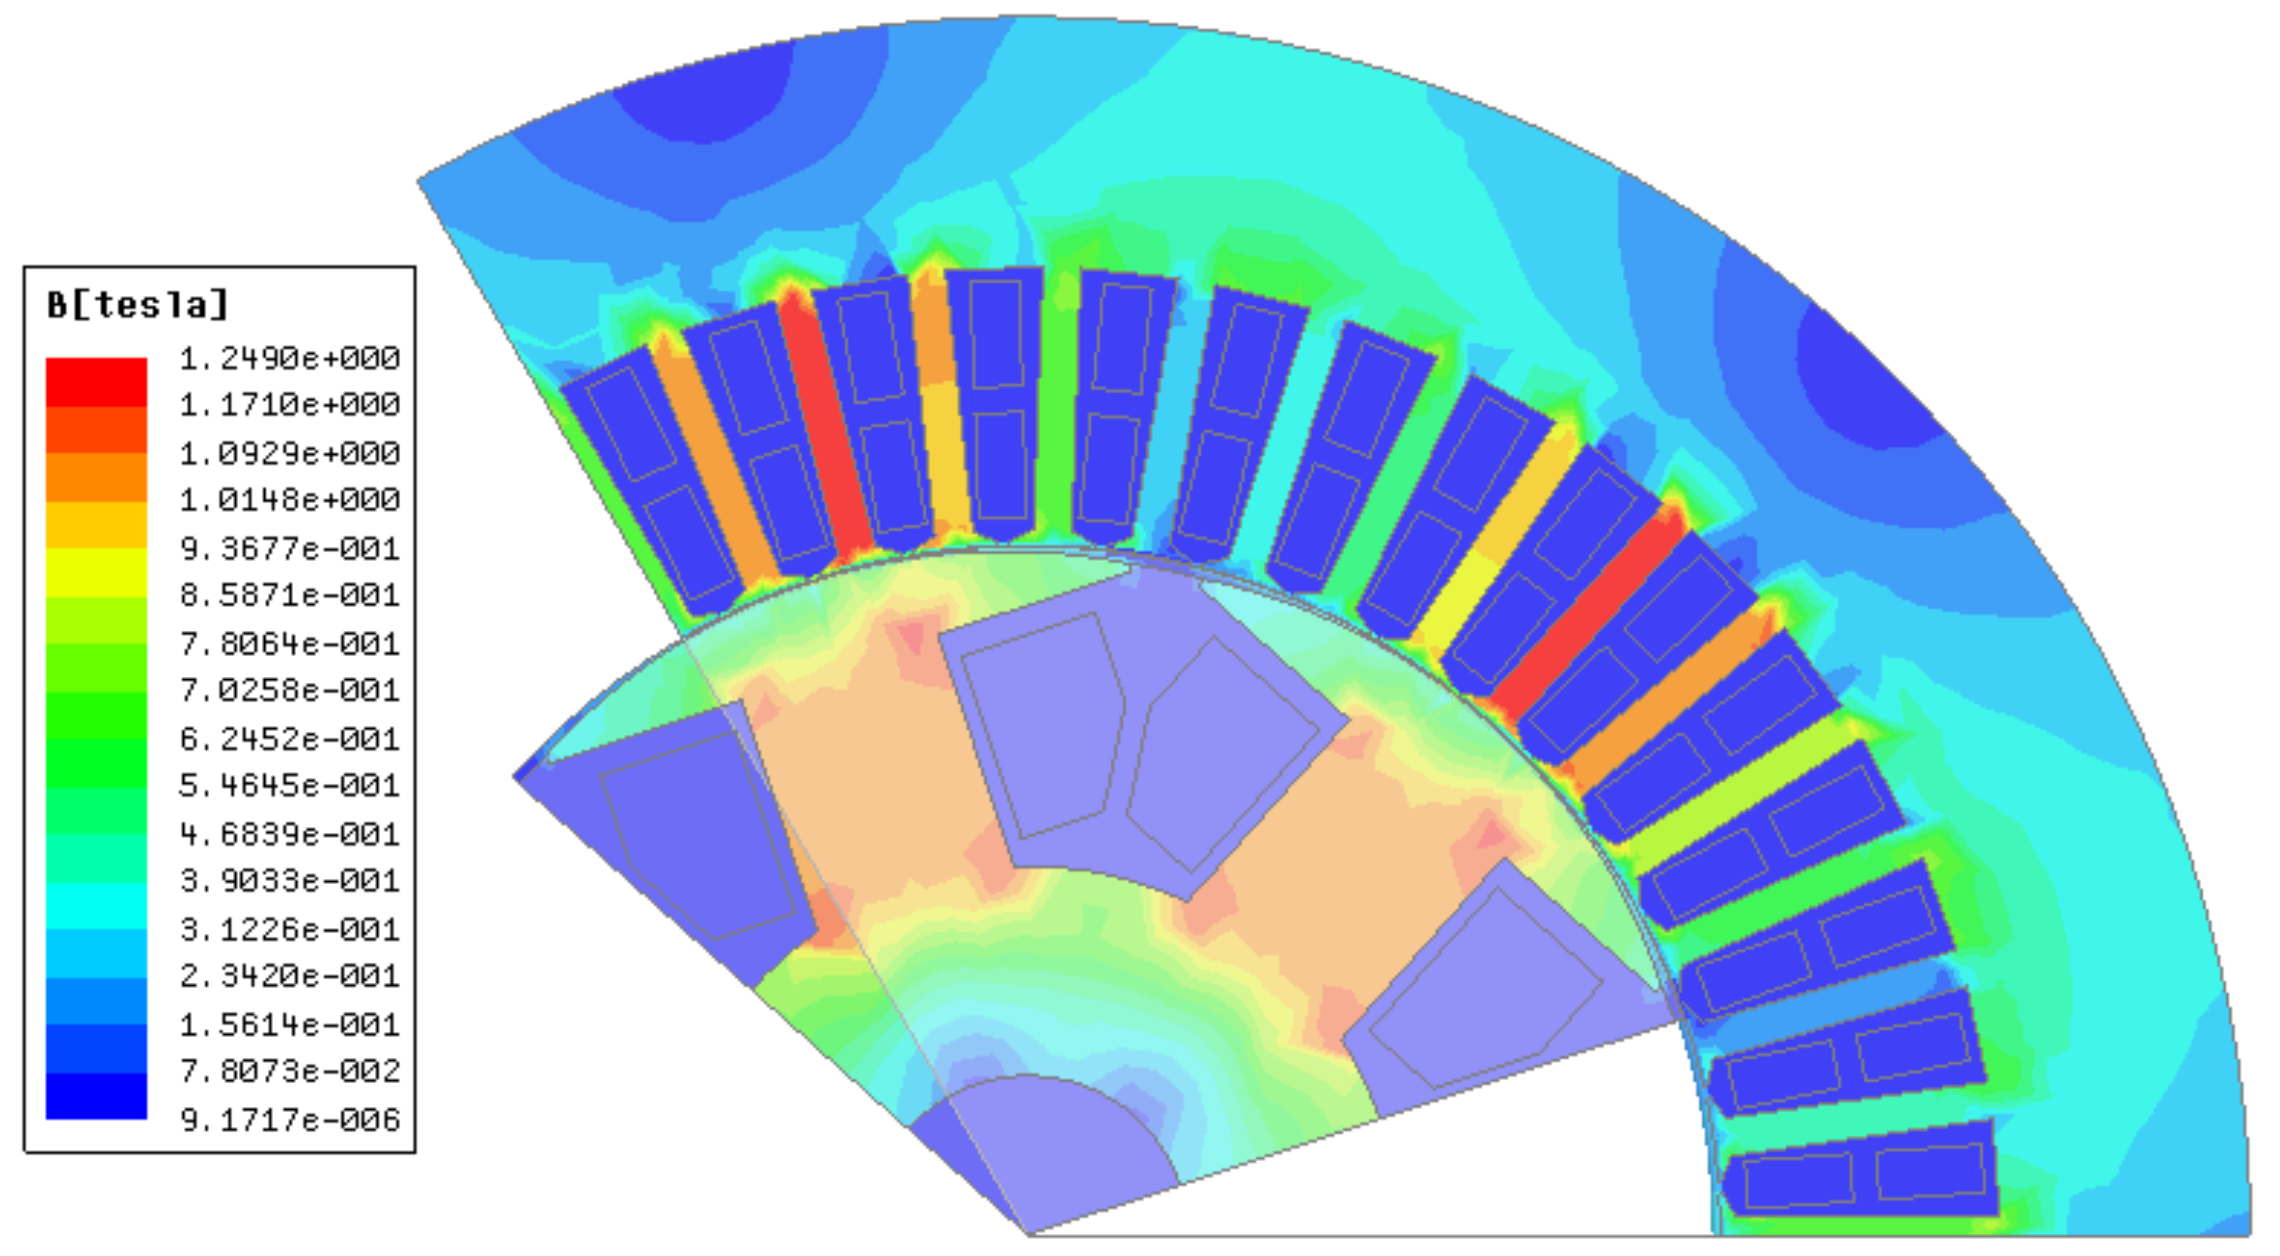
For the rated load of 96% and a power factor of −0.834 in the leading phase condition, the magnetic-field line cloud diagram and magnetic-flux density distribution diagram of the internal magnetic field and the air gap of the generator are shown in Figure 14 and Figure 15, respectively. In the air gap, the distribution of magnetic lines is denser, and the magnetic density is higher.
The simulation results for the internal magnetic field of the generator indicate that the internal magnetic-field lines are densely distributed under the working conditions, and the magnetic flux is maximized at 0.26 Wb. The magnetic density increases significantly near the field winding of the magnetic pole and near the air gap at the edge of the stator core, and its maximum value is approximately 1.2 T. At this time, the generator reaches the maximum depth of the leading phase, and the internal magnetic field reaches its limit.
Comparing the simulation results of the electromagnetic field of the generator under the two aforementioned power factor leading phase operating conditions reveals that a greater depth leading phase yields a greater power-factor reduction and that the generator must be brought to a certain depth properly in order to absorb more reactive power for adjusting the voltage balance of the power system.
A small section of the air gap is selected inside the generator, and a small area is cut on the magnetic pole stamping plate of the stator winding and the salient pole of the rotor near the air gap. During the simulation, the instantaneous maximum value of the magnetic density at this mark under different working conditions is recorded, as presented in Table 4.
Comparing the magnetic field of the partial position of the generator under different power factors reveals that with the change of the power factor angle when the generator is under leading phase operation, although the rotor current is reduced, the magnetic-flux density in the structure increases owing to the leakage of the stator and rotor magnetic fields. A greater depth of the leading phase yields a stronger magnetic field at the end of the generator. The simulation results for the leading phase operation under different power factors reveal that as the excitation current decreases, the magnetic-flux density of the stator winding near the air gap increases, and the magnetic-flux lines become dense.
The above analysis shows that the leading phase operation of the generator increases the power angle and magnetic density at the end and reduces the system stability margin. The test results show that with the deepening of the leading phase operation, the power angle of the generator gradually increases, which means that the static stability margin decreases, the reactive power absorbed from the system increases, and the air-gap flux density increases compared with normal operation. When the stability of the generator is severely degraded, that is, the leading phase operation leads to the disengagement of the generator and the system, it can be seen from the test that the maximum of the absorption capacity of the reactive power and the power angle. The simulation results reveal that the air gap in the internal magnetic field of the generator and the magnetic core density of the stator core increase rapidly, reducing the stability of the system.
6. Conclusions
Taking the simulated generator mf-15 as an example, this paper analyzes the operation characteristics of large generator in phase and the influence of stability, and draws the following conclusions:
- 1)
- The field-circuit coupling method was used to establish a field model of the synchronous generator and the field-circuit coupling model of the leading phase operation system of the synchronous generator. The electromagnetic performance of the generator under no-load and rated-load operating conditions was analyzed to verify the accuracy of the model.
- 2)
- By analyzing the distribution of magnetic field lines and flux density inside the generator when the large motor is in phase operation under different working conditions, it is concluded that the air-gap flux density increases when the generator is in phase operation with a large load. In particular, close to the end of stator winding, the magnetic field lines are dense, and the greater the power factor is, the more obvious the flux density increases.
- 3)
- Through simulation and experimental analysis, it can be concluded that the field-path coupling method is effective in analyzing the phase feed operation of large motor and provides reference for the phase feed operation of large motor.
Author Contributions
Y.L. proposed the main idea and methodology of the paper and did formal analysis to establish a field-circuit coupling model for the leading phase operation of the generator. Q.L. and Y.D. performed the electromagnetic properties analysis in the simulation software. Q.L., Y.D. and S.H. performed the validation in the laboratory. J.Z. performed the data curation. Y.D. performed the visualization. Y.L. and Q.L. performed the writing-original draft preparation. Y.D. performed the writing-review & editing. Y.L. performed supervision during the study.
Funding
This research was funded by National Natural Science Foundation of China (grant number: 5140070496).
Conflicts of Interest
The authors declare no conflict of interest.
References
- Xue, M.; Zheng, H.P.; Yang, W.W. Impact of leading phase operation of 600 MW generator on system voltage. Electr. Eng. 2013, 12, 81–93. [Google Scholar]
- Xia, H.X.; Yao, Y.Y.; Xiong, S.M.; Ni, P.H.; Ni, G.Z.; Liang, X.B.; Xian, Z.-L.; Fan, C.-X. Magnetic-thermal coupling analysis of end region of 1000 MW turbine-generator. Proc. CSEE 2008, 28, 118–122. [Google Scholar] [CrossRef]
- Vicatos, M.S.; Tegopoulos, J.A. Steady state analysis of a doubly-fed induction generator under synchronous operation. IEEE Trans. Energy Convers. 1989, 4, 495–501. [Google Scholar] [CrossRef]
- Wang, X.; Freitas, W. Influence of voltage positive feedback anti-islanding scheme on inverter-based distributed generator stability. IEEE Trans. Power Deliver. 2009, 24, 972–973. [Google Scholar] [CrossRef]
- Wang, C.L.; Wang, C.H. Synchronous generator progress research summary. Electr. Power Autom. Equip. 2012, 32, 131–135. [Google Scholar]
- Li, J.Q.; Li, H.M. Determination of standard temperature of stator iron-core in turbo generator for condition monitoring. Proc. CSEE 2004, 24, 156–160. [Google Scholar] [CrossRef]
- Li, W.; Chai, F.; Zhao, F. Study on eddy current loss and heat-transfer character of stator windings in synchronous generator. In Proceedings of the 2008 International Conference on Electrical Machines and Systems, Wuhan, China, 17–20 October 2008; pp. 479–484. [Google Scholar]
- Choi, S.S.; Jia, X.M. Under excitation limiter and its role in preventing excessive synchronous generator stator end-core heating. IEEE Trans. Power Syst. 2000, 15, 95–101. [Google Scholar] [CrossRef]
- Hammons, T.J. Effect of load and damper modelling on evaluation of negative sequence capability of large generators. IEEE Trans. Energy Convers. 1987, EC-2, 629–637. [Google Scholar] [CrossRef]
- Wang, C.L.; Wang, C.H. Design of the dynamic simulation test for leading phase of large synchronous generator. Electr. Meas. Instrum. 2016, 53, 118–124. [Google Scholar]
- Wang, C.; Wang, H.; Xu, G. System voltage regulation of power grid based on synchronous generator’s leading phase operation. In Proceedings of the CICED 2010, Nanjing, China, 13–16 September 2010; pp. 1–4. [Google Scholar]
- Zhang, C.; Chu, X.; Zhang, B.; Ma, L.; Li, X.; Wang, X.; Wang, L.; Wu, C. A coordinated DC power support strategy for multi-infeed HVDC systems. Energies 2018, 11, 1637. [Google Scholar] [CrossRef]
- Fan, Z.N.; Zhou, Z.T.; Li, J.F.; Wen, K.; Wang, J.; Sun, Z.; Wang, T.; Yao, B. Study on leading-phase operation capability of a 770 MW jumbo hydro-generator based on stability analysis and end-region heat analysis. J. Electr. Eng. Technol. 2018, 13, 1317–1325. [Google Scholar]
- Zeng, C.; Huang, S.; Yang, Y.M. Analysis of electromagnetic forces on involute part of end winding in a 1550 MW nuclear generator. In Proceedings of the 2017 IEEE 2nd IEEE Advanced Information Technology, Electronic and Automation Control Conference (IAEAC), Chongqing, China, 25–26 March 2017; pp. 1–4. [Google Scholar]
- Wang, L.; Li, Y.; Li, J. Diagnosis of inter-turn short circuit of synchronous generator rotor winding based on volterra kernel identification. Energies 2018, 11, 2524. [Google Scholar] [CrossRef]
- Xie, Q.; Zhang, Y.; Yu, Y.; Si, G.; Yang, N.; Luo, L. A novel method to magnetic flux linkage optimization of direct-driven surface-mounted permanent magnet synchronous generator based on nonlinear dynamic analysis. Energies 2016, 9, 557. [Google Scholar] [CrossRef]
- Li, Z.Q.; He, F.J.; Chao, H.; FU, Y.L. Numerical analysis of steady state stability limit of salientsynchronous generator in leading power factor operation test. Electr. Mach. Control 2011, 15, 89–95. [Google Scholar] [CrossRef]
- Shi, J.Y.; Shi, Y.S.; Zhao, X.M.; Qu, S.L.; Guo, Y.H.; Zhang, L. The new method of determining the capability of leading phase of generator and realizing the on-line monitoring. Proc. CSEE 2006, 26, 139–143. [Google Scholar] [CrossRef]
- Cui, Y.; Tao, Q.; Chen, D.; Sheng, H.; Fan, Y. Calculation and analysis of leading phase operation of generator based on PSASP. In Proceedings of the 2016 35th Chinese Control Conference, Chengdu, China, 27–29 July 2016; pp. 9974–9978. [Google Scholar]
- Li, K.; Wang, Y.; Gu, W.; Zhao, B. Modeling of generator leading phase ability based on ant colony optimization and support vector machine. In Proceedings of the 2017 IEEE Conference on Energy Internet and Energy System Integration, Beijing, China, 26–28 November 2017; pp. 1–5. [Google Scholar]
- Smith, I.R.; Snider, L.A. Prediction of transient performance of isolated saturated synchronous generator. Proc. Inst. Elect. Eng. 1972, 119, 1309–1318. [Google Scholar] [CrossRef]
- Wang, C.; Wang, H.; Xiang, C.; Xu, G. Generator leading phase ability model based on RBF neural network. Trans. China Electron. Soc. 2012, 27, 124–129. [Google Scholar] [CrossRef]
- Wang, C.; Wang, H.; Xu, G. Modeling of generator leading phase ability based on back propagation neural network. Power Syst. Technol. 2011, 35, 136–140. [Google Scholar] [CrossRef]
- Cui, Y.B.; Ling, Z.X.; Sheng, H.X.; Tao, Q.; Fan, Y.P. Simulation research on generator leading phase operation based on measured parameter model. Electr. Eng. 2017, 42, 4–13. [Google Scholar]
- Liu, G.; Song, W.; Song, X. Research on coordination of low excitation limit, loss of excitation protection and out-of-step protection. Power Syst. Prot. Control 2014, 42, 107–112. [Google Scholar]
- Yan, W.; Chen, J.; Shen, Q. Discussion on large non-salient pole generator phase-advancement operation. Autom. Elect. Power Syst. 2007, 31, 94–97. [Google Scholar]
- IEEE Guide for Synchronous Generator Modeling Practices in Stability Analyses; IEEE Standard 1110-1991; IEEE: New York, NY, USA, 1991.
- Tang, R.; Xu, G.; Tian, L.; Zhao, D.; Xu, Y. Calculation of end region magnetic field and circulation losses for turbo-generators using a coupled field and circuit equations method. IEEE Trans. Magn. 1990, 26, 497–500. [Google Scholar] [CrossRef]
- Chen, S.T.; Ding, D.Z.; Fan, Z.H.; Chen, R.S. Nonlinear analysis of microwave limiter using field-circuit coupling algorithm based on time-domain volume-surface integral method. IEEE Microw. Wirel. Compon. Lett. 2017, 27, 864–866. [Google Scholar] [CrossRef]
- Han, R.D.; Wang, T.Z.; Wang, Q.; Li, X.J. Research on circuit model of shunts based on field-circuit coupling method. In Proceedings of the 2016 IEEE International Conference on Computational Electromagnetics (ICCEM), Guangzhou, China, 23–25 February 2016; pp. 95–97. [Google Scholar]
- State Grid Corporation of China Control Centre; China Electric Power Research Institute; North China Electric Power Research Institute. Guide on Leading Power Factor Operation Test of Synchronous Generator: Q/GDW746-2012; Electric Power Press: Beijing, China, 2012. [Google Scholar]
Figure 1.
Block diagram of proposed research.

Figure 2.
Generator 2D transient field dissection diagram.

Figure 3.
Equivalent model of field-circuit coupling.

Figure 4.
Power system dynamic simulation laboratory.

Figure 5.
Leading phase operation simulation system model for the QFQS-200-2 synchronous generator.

Figure 6.
Electrical parameter variation curve of the no-load generator: (a) Stator voltage; (b) Stator current; (c) Terminal voltage harmonic distribution; (d) Electromagnetic torque.
Figure 6.
Electrical parameter variation curve of the no-load generator: (a) Stator voltage; (b) Stator current; (c) Terminal voltage harmonic distribution; (d) Electromagnetic torque.

Figure 7.
Magnetic flux density distribution of the no-load generator.

Figure 8.
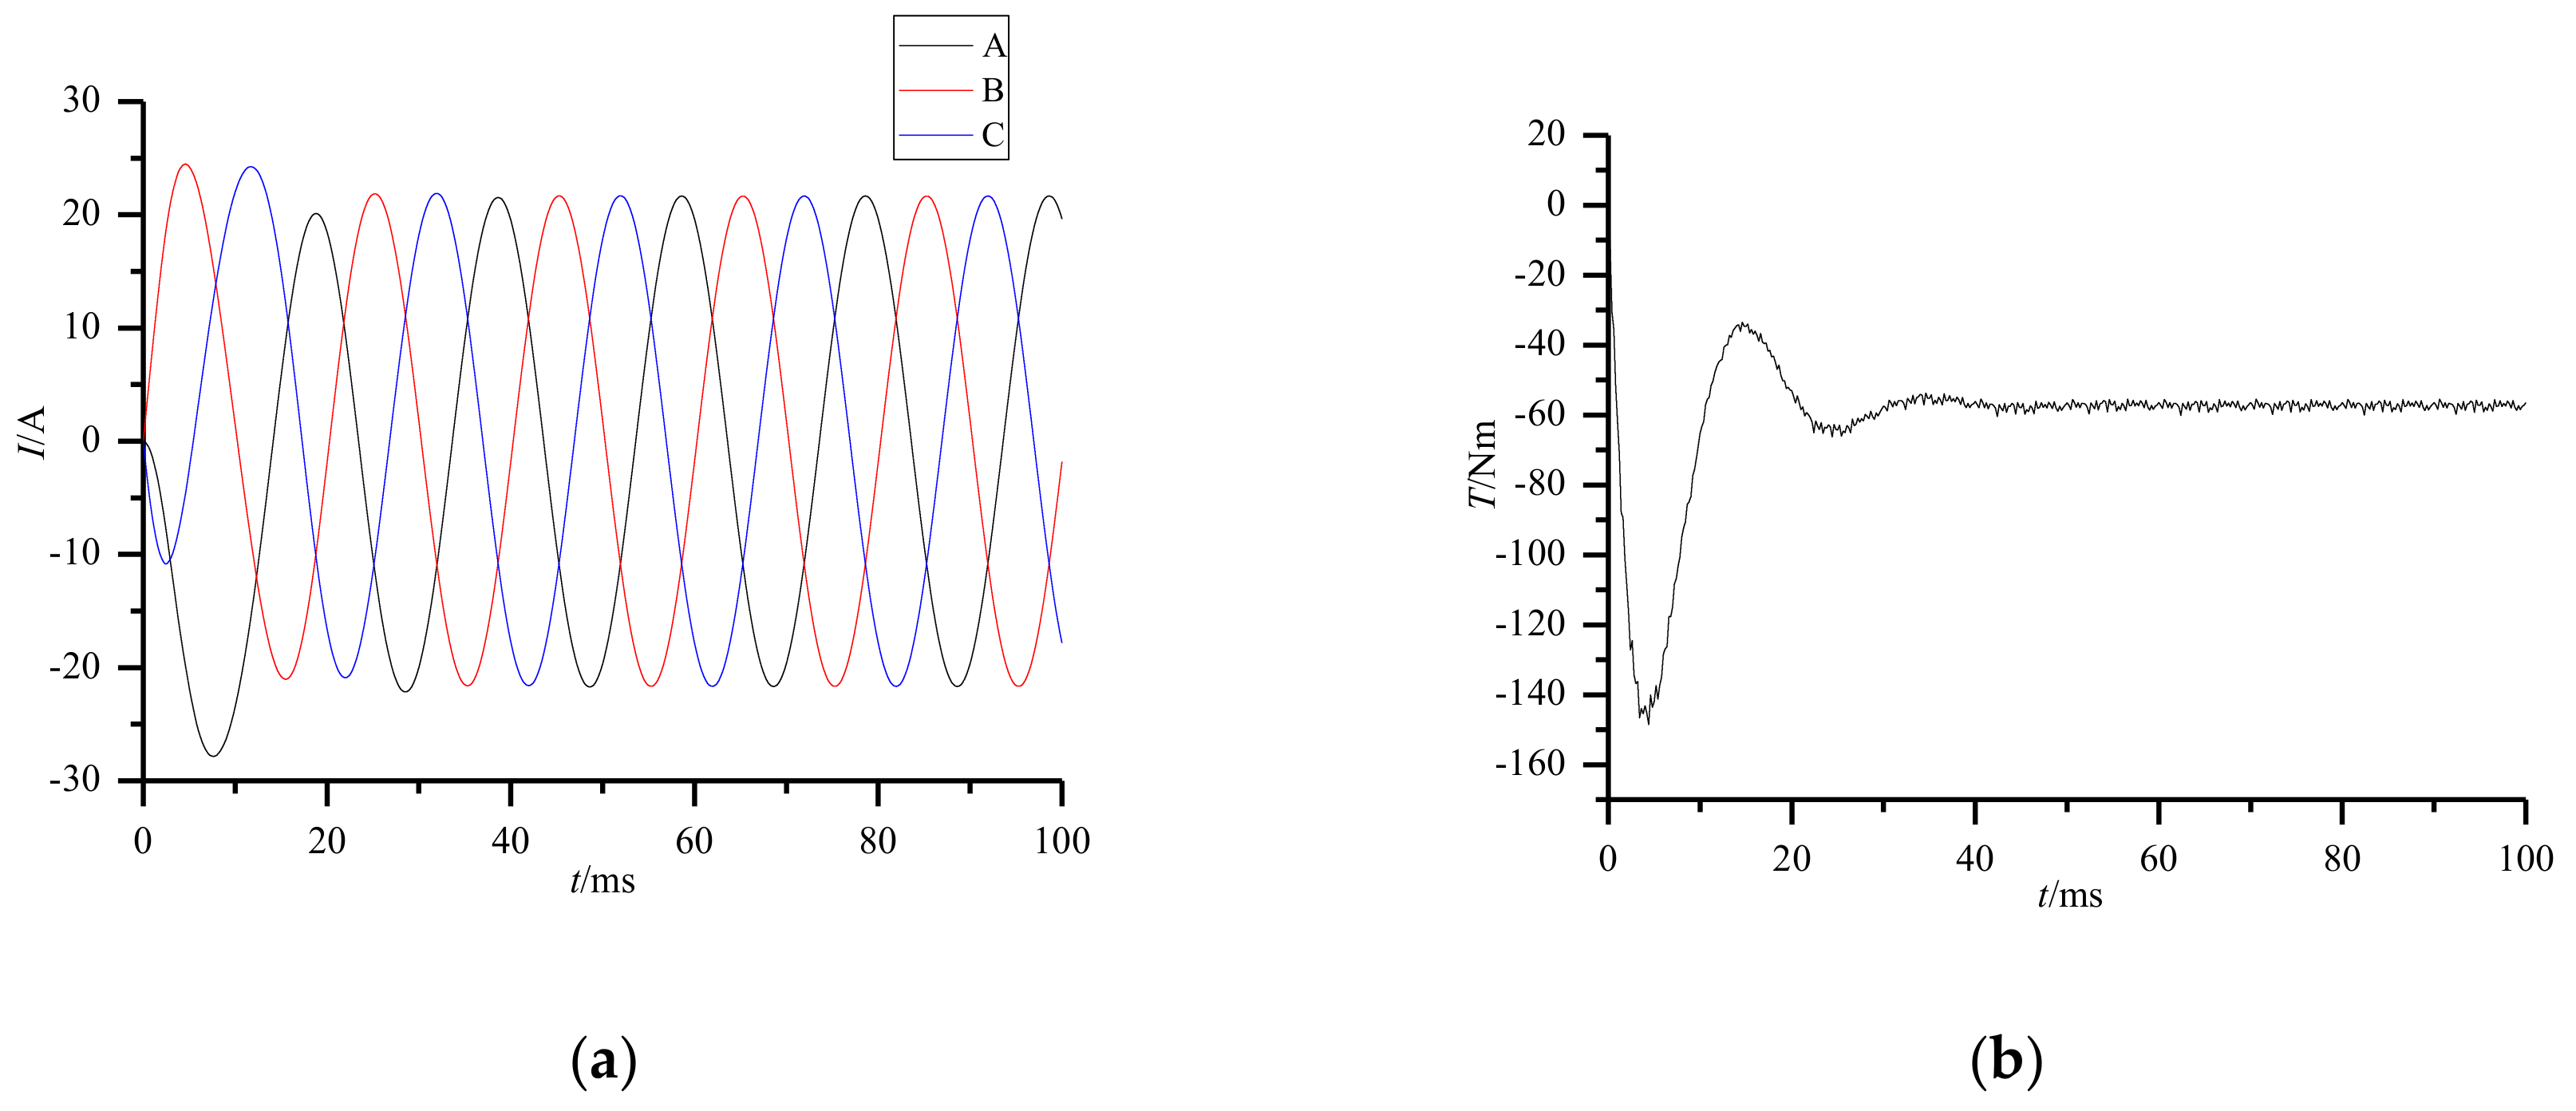
Electrical parameter variation curve of the generator is rated: (a) Stator current; (b) Electromagnetic torque.
Figure 8.
Electrical parameter variation curve of the generator is rated: (a) Stator current; (b) Electromagnetic torque.

Figure 9.
Magnetic flux density distribution of the generator is rated.

Figure 10.
Electrical-parameter variation curves: (a) Excitation current; (b) Terminal voltage; (c) Stator winding current; (d) Active power; (e) Reactive power; (f) Power angle.
Figure 10.
Electrical-parameter variation curves: (a) Excitation current; (b) Terminal voltage; (c) Stator winding current; (d) Active power; (e) Reactive power; (f) Power angle.

Figure 11.
Distribution of magnetic-field lines of the generator.

Figure 12.
Magnetic-density distribution map of the generator.

Figure 13.
Electrical-parameter variation curves: (a) Excitation current; (b) Terminal voltage; (c) Stator winding current; (d) Active power; (e) Reactive power; (f) Power angle.
Figure 13.
Electrical-parameter variation curves: (a) Excitation current; (b) Terminal voltage; (c) Stator winding current; (d) Active power; (e) Reactive power; (f) Power angle.

Figure 14.
Distribution of magnetic-field lines of the generator.

Figure 15.
Magnetic-density distribution map of the generator.


Table 1.
Generator parameters.
| Motor Parameter | Data | Motor Parameter | Data |
|---|---|---|---|
| Rated voltage | 380 V | Rated current | 22.8 A |
| Rated speed | 1000 r/min | Rated power | 12 kW |
| Rated frequency | 50 Hz | Capacity | 15 kVA |
| Pole number | 6 | Main size ratio | 1.57 |
| Pole-arc coefficient | 0.85 | Stator core outer diameter | 650 mm |
| Core length | 302 mm | Stator core inner diameter | 368 mm |
| Electromagnetism load | 67.5 A/cm | Polar distance | 192.68 mm |
| Total slot number | 45 | Length of pole arc | 163.78 mm |
| Minimum air gap | 1 mm | Maximum air gap | 1.5 mm |
| Winding pitch ratio | 7/7.5 | Number of parallel branches | 3 |
| Winding pitch | 7 | Number of series turns per phase | 40 |
| Winding short-distance coefficient | 0.9945 | Number of conductors per slot | 16 |
| Winding distribution coefficient | 0.9619 | Number of series conductors per phase | 80 |
| Winding coefficient | 0.9566 | Per phase magnetic flux per pole | 2.71 × 10⁻² Wb |
Table 2.
Data for no-load characteristic test and simulation results.
| Contrast Parameters | Test Data | Simulation Results |
|---|---|---|
| Rated voltage (V) | 380.0 | 350.25 |
| Excitation current (A) | 1.96 | 1.96 |
| Average air-gap flux density (T) | 0.55 | 0.53 |
Table 3.
Data for rated running test and simulation results.
| Contrast Parameters | Test Data | Simulation Results |
|---|---|---|
| Rated voltage (V) | 380.0 | 360.6 |
| Excitation current (A) | 2.36 | 2.36 |
| Average air-gap flux density (T) | 0.74 | 0.69 |
Table 4.
Maximum magnetic density at different positions under two conditions of entering phase (T).
Table 4.
Maximum magnetic density at different positions under two conditions of entering phase (T).
| Power Factor | Air Gap Near The Rotor | Air Gap | Air Gap Near The Stator |
|---|---|---|---|
| 0.949 | 0.74 | 0.61 | 0.94 |
| −0.984 | 0.87 | 0.78 | 1.04 |
| 0.951 | 0.71 | 0.63 | 0.98 |
| −0.834 | 0.94 | 0.86 | 1.2 |
© 2019 by the authors. Licensee MDPI, Basel, Switzerland. This article is an open access article distributed under the terms and conditions of the Creative Commons Attribution (CC BY) license (http://creativecommons.org/licenses/by/4.0/).
Share and Cite
MDPI and ACS Style
Lv, Y.; Du, Y.; Liu, Q.; Hou, S.; Zhang, J. Study and Stability Analysis of Leading Phase Operation of a Large Synchronous Generator. Energies 2019, 12, 1047. https://doi.org/10.3390/en12061047
AMA Style
Lv Y, Du Y, Liu Q, Hou S, Zhang J. Study and Stability Analysis of Leading Phase Operation of a Large Synchronous Generator. Energies. 2019; 12(6):1047. https://doi.org/10.3390/en12061047
Chicago/Turabian StyleLv, Yanling, Yizhi Du, Qi Liu, Shiqiang Hou, and Jie Zhang. 2019. "Study and Stability Analysis of Leading Phase Operation of a Large Synchronous Generator" Energies 12, no. 6: 1047. https://doi.org/10.3390/en12061047
Note that from the first issue of 2016, this journal uses article numbers instead of page numbers. See further details here.