3D-Basin Modeling of the Changling Depression, NE China: Exploring Petroleum Evolution in Deep Tight Sandstone Reservoirs


1
Faculty of Geographical Science, Beijing Normal University, Beijing 100875, China
2
Shandong Provincial Key Laboratory of Depositional Mineralization and Sedimentary Minerals, Qingdao 266590, China
*
Author to whom correspondence should be addressed.
Energies 2019, 12(6), 1043; https://doi.org/10.3390/en12061043
Submission received: 20 February 2019
/
Revised: 10 March 2019
/
Accepted: 14 March 2019
/
Published: 18 March 2019
(This article belongs to the Special Issue Reservoir Simulation and Prediction of Gas, Oil and Coal Mine)
Abstract
:The Changling Depression is the largest and most resource-abundant reservoir in the South Songliao Basin, NE China. The petroleum evolution rules in the Lower Cretaceous deep tight sandstone reservoir are unclear. In this study, 3D basin modeling is performed to analyze the large-scale petroleum stereoscopic migration and accumulation history. The Changling Depression has a complex fault system and multiple tectonic movements. The model is calibrated by the present formation temperatures and observed maturity (vitrinite reflectance). We consider (1) three main erosion episodes during the burial history, one during the Early Cretaceous and two during the Late Cretaceous; (2) the regional heat flow distribution throughout geological history, which was calibrated by abundant measurement data; and (3) a tight sandstone porosity model, which is calibrated by experimental petrophysical parameters. The maturity levels of the Lower Cretaceous source rocks are reconstructed and showed good gas-generation potential. The highest maturity regions are in the southwestern sag and northern sag. The peak hydrocarbon generation period contributed little to the reservoir because of a lack of seal rocks. Homogenization temperature analysis of inclusions indicated two sets of critical moments of gas accumulation. The hydrocarbon filling in the Haerjin and Shuangtuozi structures occurred between 80 Ma and 66 Ma, while the Dalaoyefu and Fulongquan structures experienced long-term hydrocarbon accumulation from 100 Ma to 67 Ma. The homogenization temperatures of the fluid inclusions may indicate a certain stage of reservoir formation and, in combination with the hydrocarbon-accumulation simulation, can distinguish leakage and recharging events.
1. Introduction
The Changling fault depression is the largest petroliferous block in the southern Songliao Basin (Figure 1), which covers a total area of 1.3 × 10⁴ km2 [1]. Hydrocarbon accumulation has mostly occurred in Cretaceous strata at a burial depth of 2000~4000 m. Upper Cretaceous hydrocarbon deposits were discovered and explored years ago and the petroleum evolution processes have been discussed [2,3,4]. However, Lower Cretaceous reservoirs did not receive sufficient attention because of their deep burial depth until unconventional reservoirs and tight gas became the research hotspots [5,6,7,8,9,10,11]. The Denglouku Formation (K1d) is a typical tight sandstone reservoir. According to petrophysical analysis, the porosity of K1d is between 0.3% and 10.4% and the average porosity is 5.4%, while the permeability is between 0.01 mD and 0.5 mD. Overall, K1d is characterized by fine-grained, low compositional maturities sandstone with poor petrophysical properties [8,12].
The large-scale research of hydrocarbon generation, migration and accumulation has significance for studying the evolution of a tight gas reservoir. Former research focused on the Upper Cretaceous discovered the self-generation and self-storage oil accumulation rule [3,14]. Few works have focused on the Lower Cretaceous hydrocarbon systems. With burial depth over 3000 m, only deep drill wells could discover the Lower Cretaceous layers [8]. Moreover, massive compact sandstone has made defining Lower Cretaceous deep tight gas reservoirs difficult. The vitrinite reflectance (VR) of the Lower Cretaceous source rocks reaches 1.3 %Ro, which indicates high maturity gas generation phase [15].
Basin modelling is an effective method to recover the geological evolution history including burial, thermal, maturity, petroleum saturation etc. [16,17]. A 1D model is based on the single well [18,19,20,21,22,23] and a 2D model is based on the section line [24,25,26]. 1D and 2D basin modelling are convenient and rapid approaches to study the petroleum generation processes. Dong et al. used BasinMod 1D to simulate the Upper Cretaceous source rock maturation and address the potential accumulation area in the Changling Depression using the BasinFlow subsystem of the BasinMod software [3]. However, 1D and 2D modelling could not show the stereoscopic migration and accumulation history as 3D basin modelling do [27,28,29].
Specifically, a 3D basin model can (1) accurately establish the strata structure of the basin and describe the important petroleum system elements (PSE), including the source rock, migration paths, reservoirs and seals; (2) consider the distribution of erosion thickness and recover the reliable heat flow history through calibration with a series of measured data; and (3) research the petroleum system as a 3D process, meaning that both vertical and horizontal hydrocarbon migration, entrapment and leakage are visually represented in the model [30].
In this study, we constructed a 3D model to address quantitatively basin-scale understanding of the Lower Cretaceous hydrocarbon evolution. This model was a dynamic expression of the sedimentary structure and geological evolution [31]. Moreover, this model could reveal the organic maturation and petroleum-generation rules throughout various geological periods [28,32,33,34]. After studying scholars’ research on 3D basin modeling, we believe that the model accuracy can be improved by comprehensive calibration methods [31,35,36]. We investigated the hydrocarbon charging events on the basis of a fluid inclusion study. The fluid inclusion homogenization temperature in conjunction with burial and thermal history can determine the petroleum charge history [37,38,39]. By using the 3D basin modelling approach, we tried to research the unconventional hydrocarbon migration and accumulation rules in a tight sandstone reservoir. Therefore, we expected to observe the formation rules of tight gas reservoirs in the Changling Depression.
2. Geological Evolution
The Changling fault depression is located in the southern Songliao Basin, Northeast China. This depression lies in the central fault depression zone of Songliao Basin to the south of Nen River and Songhua River (Figure 1). Its overall distribution is in the NNE direction. This area can be divided into five sub-structural units: a western slope zone, eastern slope zone, central depression, northern fault sag, and southern fault sag [12,40]. The geological evolution of the Changling fault depression has been elaborated in previous studies [41,42]. Figure 2 depicts the generalized lithostratigraphy and the primary tectonic events of the Changling Depression. The structural evolution history of the Changling Depression can be divided into four stages as detailed below.
- Basement thermal uplift stage: the paleo-continent split up at the end of the Triassic and began to disassemble inside the continent during the Jurassic. During this geological period, the Eurasian Plate drifted southeastward while the Pacific Plate began to expand and resulted in plate subduction. This sequence triggered mantle upwelling, and the upper mantle and crust extended to form the rift. Mantle materials erupted through the fissure and formed the widespread pyroclastic reservoir [43,44].
- Rifting stage: the previously accumulated heat energy suddenly released and created a crack in the crust. Then, the faulted period began and the Songliao Basin gained the embryonic form of a graben or half-graben morphology. In the meantime, volcanic eruptions, magmatic intrusions and regional metamorphic events occurred through deep fractures. The Upper Jurassic Huoshiling Formation (J3h) and the Lower Cretaceous Shahezi Formation (K1sh) and Yingcheng Formation (K1y) exhibited sedimentary systems such as alluvial fans, flooding plains, pluvial deltas, and fan deltas (Figure 2). A series of NNE faults formed during the deposition of the J3h stratum and caused massive volcanic eruption with andesite and basalt extrusions. During the deposition of K1sh, construction of the Changling depression was controlled by boundary faults. A set of dark mudstone with coal seams formed the lacustrine source rocks of the K1y and K1sh strata. The rising rift, intense fault activity and rapid tectonic subsidence resulted in the deepening and expansion of the basin. The isolated basins began to connect during the transgressive period. The main stratum deposited was K1d, and the sedimentary environment was similar to that during the early rifting stage [45,46,47].
- Depression stage: the basin entered a depression stage when the crust achieved differential settlement. Volcanic activity dissipated and the depression achieved a uniform sedimentary setting. Widespread lakes appeared in the depression alongside a range of depositional systems. A full combination of spatial-deposition systems developed from the land to the lacustrine area, including alluvial fans, flooding plains, shallow lacustrine deltas, and deep water turbidite. The strata included the Quantou Formation (K1q), Qingshankou Formation (K2qn), Yaojia Formation (K2y) and Nenjiang Formation (K2n). During this stage, the paleo heat flow frequently changed because of fault activity [41].
- Tectonic inversion stage: during the last phase of the basin evolution, the Japan Sea expanded and the basin continued to exhibit extrusion. Tectonic inversion occurred when the strata were lifted and folded. The remaining lacustrine area shrank but the overall shape of the depression remained similar. The strata included the Upper Cretaceous Sifangtai Formation (K2s) and Mingshui Formation (K2m), with the depositional systems including shallow lacustrine, alluvial fan and flooding plain facies. After the Cretaceous, the lakes almost disappeared and the strata uplifted and descended in slow motion. Alluvial and diluvial deposits have been discovered in this sequence [13,41,42].
3. Construction of the Basin Model
There are two sets of petroleum systems in the Changling Depression and we named them upper group and lower group (Figure 2). The upper group includes K1q, K2qn, K2y and K2n which act as both source rock and reservoir rock [3] and produces oil and condensate gas [2,4]. The lower group consists of J3h, K1sh, K1y and K1d which follows the regular pattern: gas migrated vertically upward and was stored in the K1d reservoir. In this study, we focus on the lower set of the petroleum system. Until now, four Lower Cretaceous tight sandstone gas fields are discovered and we selected four representative deep wells to indicate the locations: The Changling 1 gas field (Well CS1), which is located in the central depression; the Shuangtuozi gas field (Well TS6), which lies in the southern fault sag; and the Dalaoyefu gas field (Well LS1) and Fulongquan gas field (Well F10), which are both situated in the eastern slope zone (Figure 1b). Over 200 wells have been drilled in the study area, and we have selected approximately 50 representative wells for investigation and discussion in this paper.
The model was created with the PetroMod v.2015.1® software (Schlumberger, Oslo, Norway). The major processes were strata deposition, compaction, erosion, source rock maturation, hydrocarbon generation, expulsion, migration and accumulation. The basic basin-modeling rules and analytical equations that were used in the simulation processes are detailed in the introduction to basin modeling [30]. Among the variety of petroleum-migration algorithms, we chose the hybrid model, which can solve Darcy flow equations in low-permeability areas and apply a flow-path analysis in high-permeability areas [30,50]. The more detailed and precise the parameters that we imported into the model, the closer to reality the results would become. So we decided to import as much basic data as possible within the limits of the model. This model was set to be 700 grids in width and 1000 grids in length. The actual size of the model was 135 km in width and 195 km in length. The grid cell size was thus approximately 193 × 195 m (Figure 3).
3.1. Input Data
The structure model was established based on upper horizon structure maps of each formation which were provided in previous research [51]. After digitizing and importing the depth maps to PetroMod software, we used the layer-division results from well-logging data and drilled cores for 133 individual wells to refine the layer model. We selected several through-well surveys in the model to check the conformity of the model with the well tops. After investigating the stratigraphic chronology, we found that scholars provided different classification schemes [3,4,52]. We analyzed their different opinions, combined with zircon dating results [53,54], and ultimately defined the ages of each layer by using Ma et al.’s study [52] (Figure 2).
3.1.1. Lithology and Petroleum System Elements
Studies have been performed on the stratigraphic characteristics of the Changling Depression deep rift strata by means of sequence stratigraphy, logging geology, sedimentology and seismic stratigraphy [42,45]. The definition of the lithological properties of the Early Cretaceous reservoir was based on Jiang’s research [55]. The J3h can be divided into three lithological types, including a combination of a large section of andesite, carbon-mudstone strata, conglomerate and clastic rocks. The K1sh comprises thin sand with interbedded mud and coal seams. The K1y comprises three sections: acidic volcanic rocks, clastic sediments, and mafic-intermediate volcanic rocks. The K1d, which is the studied reservoir rock, contains a set of sandstone and sandy conglomerates. The Lower K1q is the seal-rock layer and consists of thick shale, and the Upper K1q comprises conglomerate and sandstone (Figure 3). The facies settings for the model are shown in Table 1.
3.1.2. Source Rock Properties
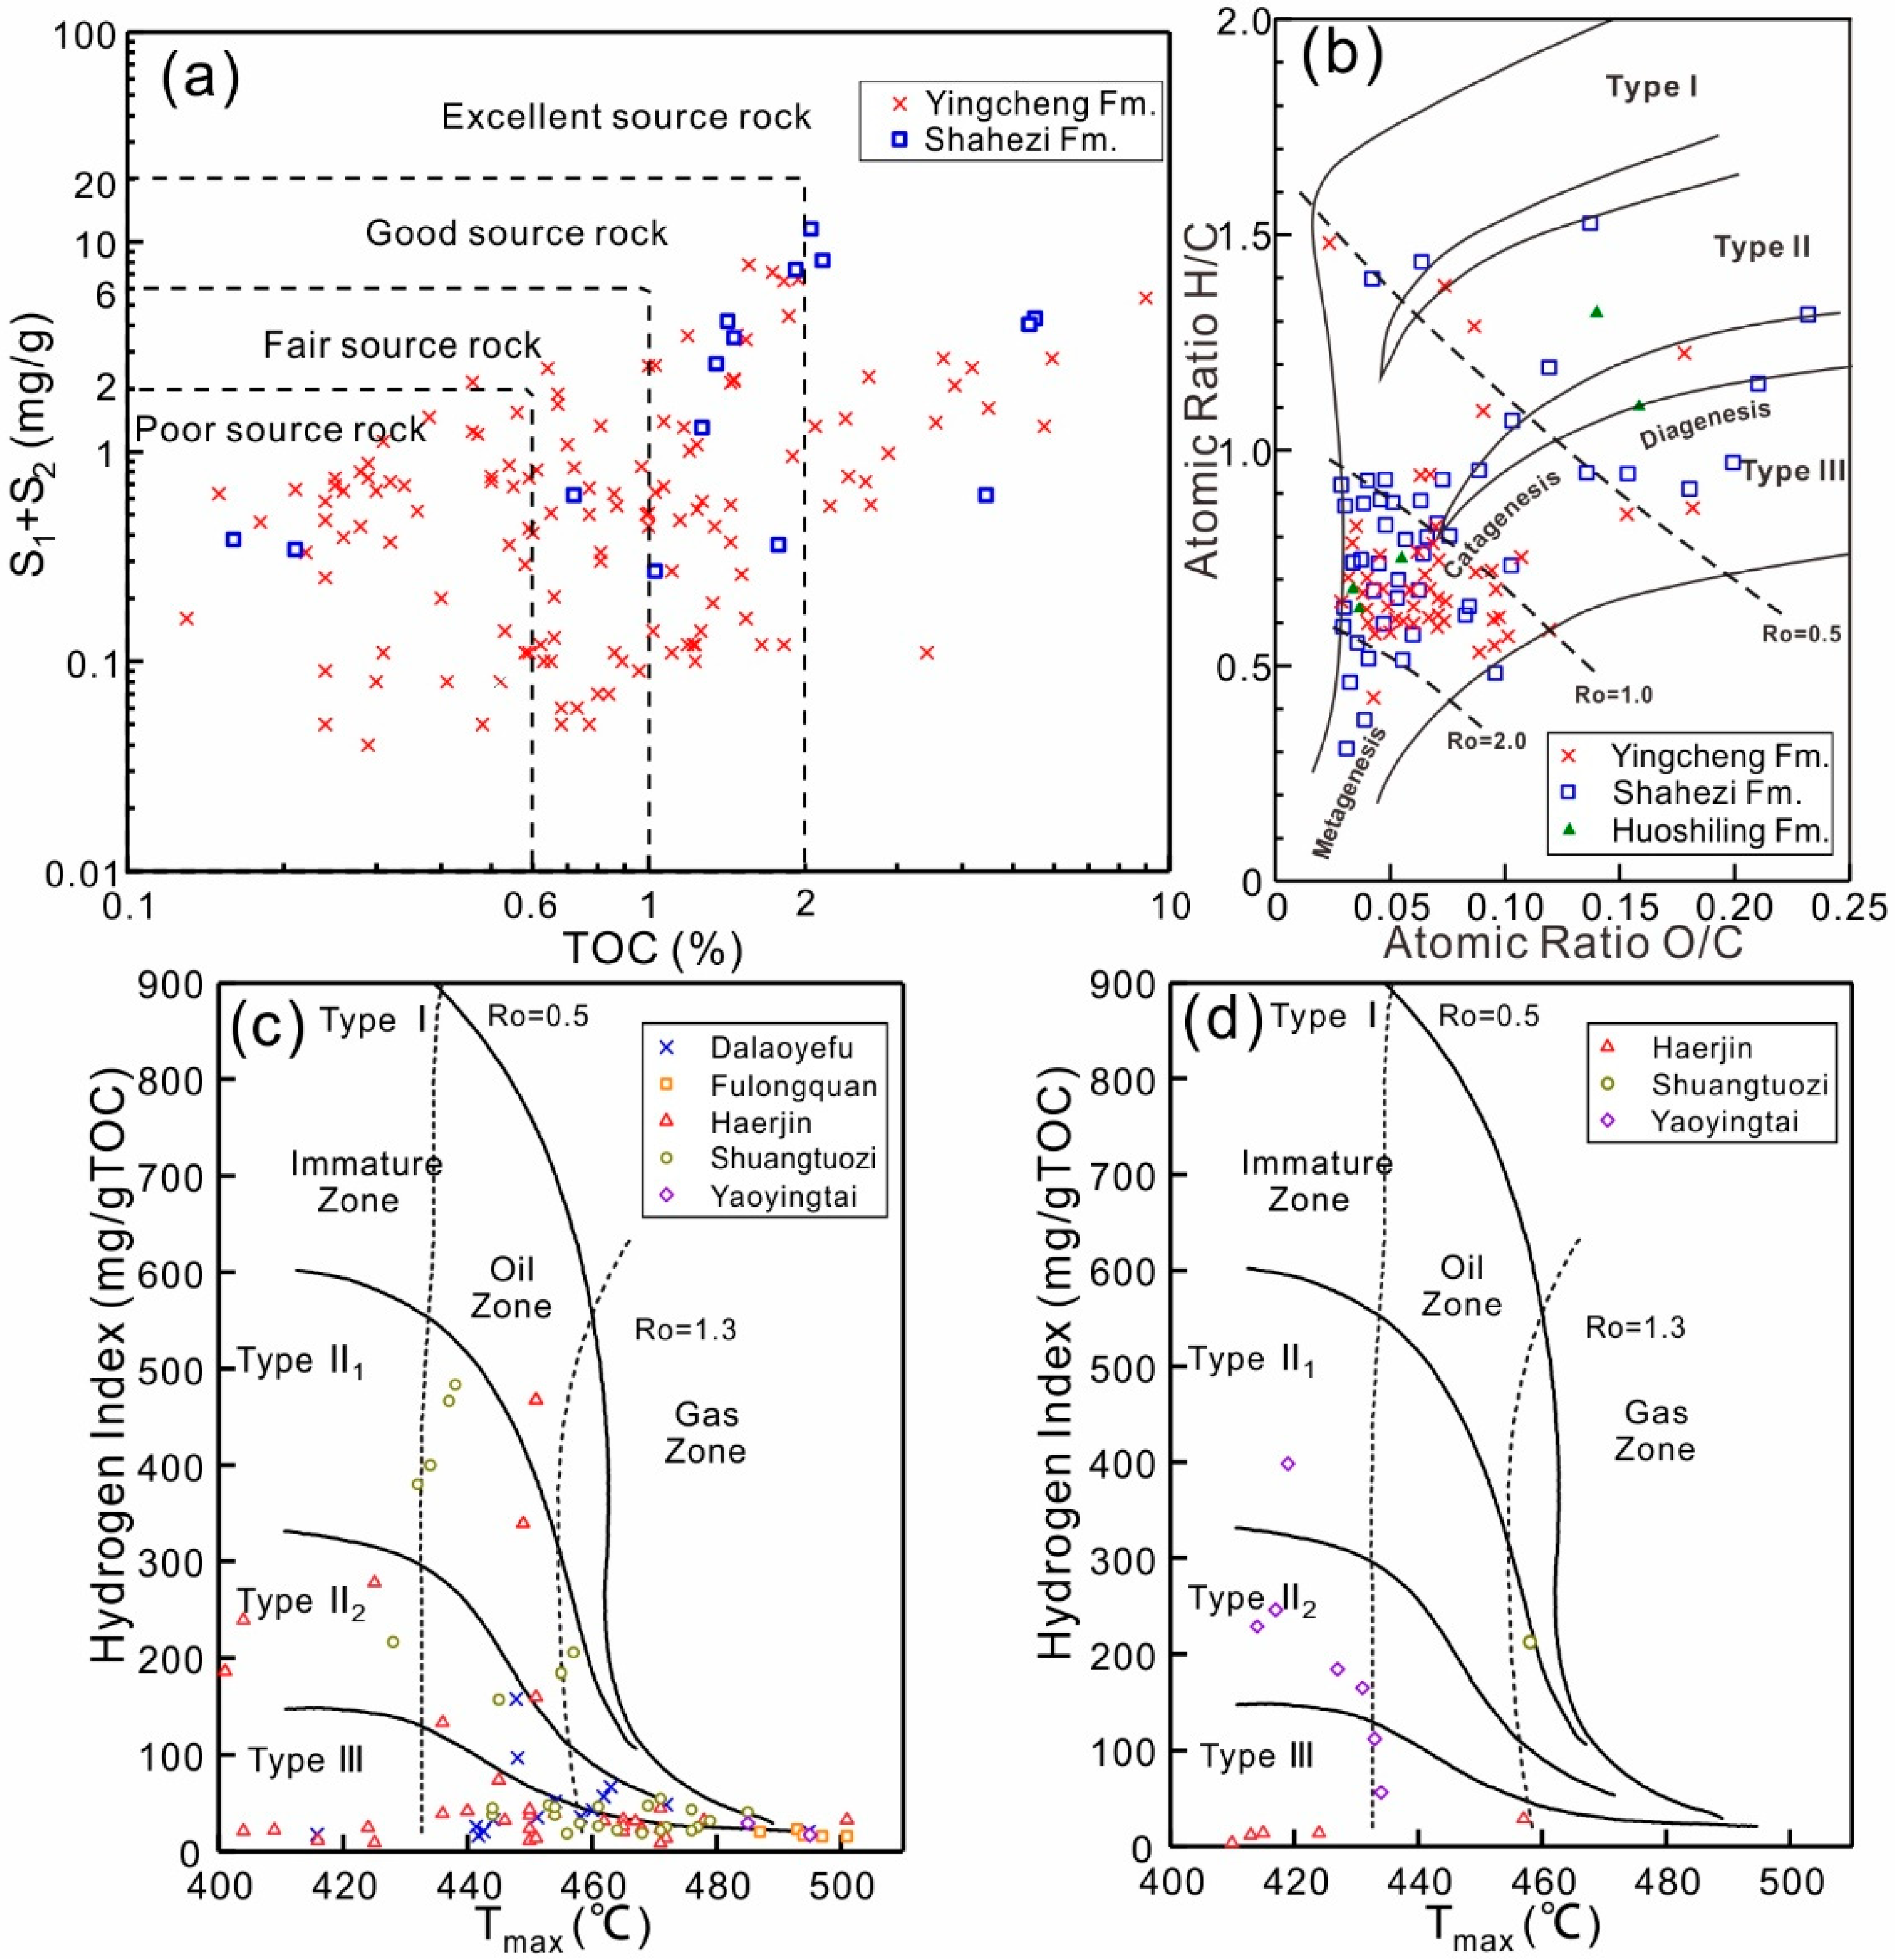
To determine the source rock properties from the input model, we processed 178 Rock-Eval pyrolysis analyses from 19 wells in the Changling Depression. All these measured data were acquired from the PetroChina Jilin Oilfield Administration Bureau (PCJOAB). The lack of measured data in the J3h meant that the source rock evaluation was based on seismic inversion and well-logging analysis [56], alongside selected geochemistry tests [57,58]. In the Rock-Eval pyrolysis, S1 (free hydrocarbon components), S2 (hydrocarbons generated by the pyrolysis) and S3 (carbon dioxide content in the pyrolysis) are measured in milligrams of hydrocarbon per gram of rock [59,60]. In Figure 4a, K1sh had a total organic carbon content (TOC) that mostly surpassed 1% and an average S1 + S2 of 3.3 mg/g. Abundant samples from K1y varied from 0.03% to 9.01%, with a mean value of 1.1%. We determined K1sh to be a good to excellent source rock. The S1 + S2 value of K1y varied from 0.02 mg/g to 11.5 mg/g, with a mean value of 0.97 mg/g. Defining the organic-matter abundance in the source rock of K1y was difficult because the sample distribution was too dispersed from poor to excellent areas.
The van Krevelen diagram is often used to determine the kerogen types and genetic potential by comparing the atomic-ratio parameters [61,62]. As shown in Figure 4b, most of the points were concentrated in the lower-left area of the chart, while the VR of the samples was over 1.0 %Ro. The diagram could not distinguish among the kerogen types while the points grew close under metagenesis conditions. On the other hand, several points were dispersed around the lower maturation area, and most of the points were in the type II and III areas. In this chart, we could not accurately distinguish the source rock types from different formations.
We established a graph of the hydrogen index (HI) versus the pyrolysis peak temperature (Tmax) of different source rock layers to distinguish the source rock type of each layer [63]. In Figure 4c, the scatter map shows that the source rock samples from K1y were dispersed and followed the type II and III source rock distribution curve. When distinguishing between different areas, source rock samples from the Fulongquan and Yaoyingtai regions followed the trend of type III source rock and exhibited high maturity. Samples from the Dalaoyefu, Haerjin and Shuangtuozi regions mainly fit the trend of type III source rock. In Figure 4d, samples from K1sh in the Yaoyingtai region followed the trend of type II2, while those from the Haerjin region fell within the type III source rock area. Samples from K1sh appeared to have low maturity.
We optimized the decoupled source rock definition to precisely define the source rocks’ properties. We created thickness maps, TOC maps, and HI maps to refine the model. We collected dark-shale thickness data from the drill cores and analyzed the well-logging curves to form the isopach maps referring to former research [15,64,65]. Then, we created source rock isopach maps of K1y, K1sh and J3h (Figure 5). The TOC maps and HI maps were created by using the average measured data from wells, alongside the well-logging analysis prediction results and data from prior studies [56,65,66]. The figures show that hydrocarbons were mainly distributed in the southern fault sag and northern fault sag, displaying the largest thickness in these regions. The K1sh had the most abundant source rock, with a mean TOC value of 1.38%, while the maximum TOC reached 4.35%. The dark mudstones in the K1y and K1sh, which formed in a lacustrine environment, were the main source rocks of the study area [67].
3.1.3. Kinetic Models
The generation rates, components and timing of hydrocarbons are controlled by the kinetic properties of the kerogen [68]. In the study area, the Early Cretaceous source rocks had entered the overly mature stage, and the transformation ratio (TR) of the samples was close to 100%. Thus, we did not perform a pyrolysis experiment on the Early Cretaceous source rocks; kinetics research was reasonable only for the Late Cretaceous source rocks. We constructed two set of kinetic models that fit the Changling deep source rock layers by referring to previous studies and following the basic rules.
After analyzing the hydrocarbon-component data, we discovered that the source rock properties and the hydrocarbon-expulsion rules were a good fit for the Burnham TIII kinetic model [69]. The pyrolysis experiments on the northern Songliao Basin oil shale provided a suite of kerogen kinetics data [70], which we used as a kerogen oil-production kinetic model. After examining the gas-source correlation studies, we found that the gas was mainly converted from oil cracking and kerogen pyrolysis in the Changling Depression [15,71]. Thus, we also considered secondary cracking. Previous studies contributed to the creation of a gas-generation kinetic model, as shown in Figure 6a [70,72,73,74]. The kinetic model of a coal seam in K1sh (Figure 6b) was established from a model that was based on samples, which included Mesozoic and younger coal that formed from plants [75], combined with reports on coal-seam pyrolysis experiments in the Songliao Basin [76].
3.1.4. Fault Properties
Multiple faults with varying and complex scales and characteristics are distributed in the Cretaceous strata in the Changling Depression. The major faults mostly formed during the chasmic period of magmatic activity, so tensional faults are clearly dominant in the Changling Depression [77]. As shown in Figure 7a, 23 representative and large faults were selected as study subjects to examine the processing capacity of the model [78]. The fault intersections on each horizon were modified to create the model fault (Figure 7b). The fault strikes were mostly in the NE and NW directions, and the faults formed during the deposition of the J3h until the deposition of K1d. We imported the interpreted fault lines (intersections on each surface) into the model and created model faults. The border of the Changling Sag mostly consisted of boundary fractures, and we assumed that the basin sides were closed.
3.1.5. Erosion Events
Erosion events and the denudation thickness are important parameters in the recovery of burial and thermal histories. After reviewing the literature, we used the acoustic time difference and vitrinite-reflectance method to relate the main uplift and erosion of the basin to three main regional events:
- Tectonic inversion occurred at the end of K1y deposition (128.8~124 Ma). The basin was regionally uplifted and experienced differing degrees of erosion. The average erosion thickness was 417.5 m [46].
- During the end of K2n deposition (74.6~73 Ma), the strata uplifted because of intense extrusion stress and underwent continuous denudation to a thickness of approximately 205 m.
- During the late Mingshui period (66.2~23.03 Ma), the Changling Depression underwent basin shrinkage, tectonic inversion and regional uplift [66]. The average denudation thickness was 342.5 m. The main uplift and erosion center is in the Fulongquan region around Well F10.
Table 2 lists the denudation thicknesses of 8 wells, which were calculated from the sedimentation rate [41] to control the horizontal distribution of erosion. Apatite fission track analysis (AFTA) indicated four episodes in the denudation history [79]. Furthermore, a Monte Carlo random simulation of the AFTA data revealed four turning points of the thermal evolution at 65 Ma, 43.5 Ma, 28 Ma and 15 Ma. This research suggested that the denudation period occurred at the end of the deposition of the Mingshui Formation [79].
3.1.6. Boundary Conditions
The paleo water depth (PWD) curve (Figure 2) was modified based on previous studies [49,80]. The water-level changes were revealed by obtaining the distribution characteristics of sediments, sedimentary structures, paleontological sets and ecology, authigenic minerals and wave-base surfaces [49].
The sediment–water interface temperature (SWIT) is the upper-boundary condition of heat transfer in a sedimentary basin [81]. The PetroMod software contains a module to calculate the SWIT throughout geological time. It calculates the variations in average surface paleo temperatures from the sediment–water interface depth versus local latitude and considers PWD changes [82].
The heat flow (HF) history of the Songliao Basin revealed the paleo-basement and surface HF values from 19 different ages [83]. The HF reached a peak value of 99 mW/m2 from 120 Ma to 100 Ma. The HF evolution curve represents the total HF trend of the Songliao Basin (Figure 8). According to paleo-temperature studies, the geothermal gradient during the Early Cretaceous was 50~70 °C/km [84]. The geothermal gradient was 42.6~48 °C/km during the Late Cretaceous, with a HF of 95~107 mW/m2. From the Paleogene to the present, the geothermal gradient stabilized at 37 °C/km with a HF of 69 mW/m2 [85].
3.1.7. Petrophysical Settings
After studying previous research on basin modeling, we found that the reservoir was defined as the default sandstone when following the common workflows [24,28,55]. We attempted to define the properties of the sandstone within the scope of the Changling Depression and distinguish among the different formations. If we study the conventional reservoirs, the lithological properties would make a slight difference to the accumulation results. However, we had to consider the porosity and permeability parameters when modeling tight gas reservoirs. If the porosity was below the cutoff value, the sandstone would lose its ability to store hydrocarbons. The K1d tight sandstone reservoir provided the accumulation conditions for hydrocarbons, but the physical properties of the reservoir should be defined manually. Additionally, the porosity of the deeper layers may influence the migration path significantly.
Therefore, Athy’s Law (Equation (1)) was used to calibrate the porosity model of K1d, K1y and K1sh. Athy’s Law manifests as a porosity versus depth curve. This law is a practical trend that assumes hydrostatic pressures and deposition with the same lithology [86]:
where refers to the porosity at depth z; is the minimum porosity in the deposition; is the initial porosity of the rock before deposition; and k is Athy’s factor, a constant that depends on the rock type and physical properties.
The initial porosity was estimated from pore-recovery research. The sorting features and grain sizes of rocks indicate the general interval of the original porosity. We used the average rock-density test values and the minimum porosity data in Table 3 to shape the initial curve. Next, we calibrated Athy’s porosity versus depth curve by using 851 points of measured porosity data from 40 wells in the Changling Depression (Figure 9).
We also established a correlation between the porosity and permeability, Equation (2) is the formula for K1d (Figure 10).
where K is the permeability, log(mD); is the porosity, %. .
4. Results
4.1. Calibration of the Model
We established a reference HF trend by comparing the entire basin trend and depression dispersal data (discussed in Section 3.1.6). We may call the reference trend the “plausible HF model” because the trend may be close to the actual conditions, but the actual HF value should fit the formation temperature and maturity of each well [87,88,89]. The HF values were homogeneously distributed in the initial HF distribution maps. The HF calibration was based on measured data from 55 wells that covered the main hydrocarbon-bearing structures. The temperature curve that we obtained from the simulation represents only the current HF. The HF trend from 157 Ma to 0 Ma was mainly calibrated by the VR data. The HF trends for individual wells could be precisely restored from the VR and temperature-test data.
In Figure 11a,b, the green curve indicates the temperature and VR of well TS6 as calculated by the input data. We conducted reliable reconstruction of the HF history by using the Easy%Ro algorithm [89,90]. The red crosses are the measured well data and the black curves represent the results of the best-fit simulation. The orange line indicates the HF trend that was simulated based on the original input trend. The black line is the suggested trend, which fits the measured data well, as shown in Figure 11c. In the simulation of well TS6, the original HF decreased by 12.18 mW/m2 to fit the measured data. The blue line represents the smoothed HF trend for drawing the HF map, which slightly deviated from the best fit trend. The smooth process is necessary for creating a practical contour map by decreasing the HF difference between wells. A random simulation was conducted to fit the test data and show the corrected HF value. After interpolation and smoothing, the calibrated HF value distribution maps were created (Figure 12).
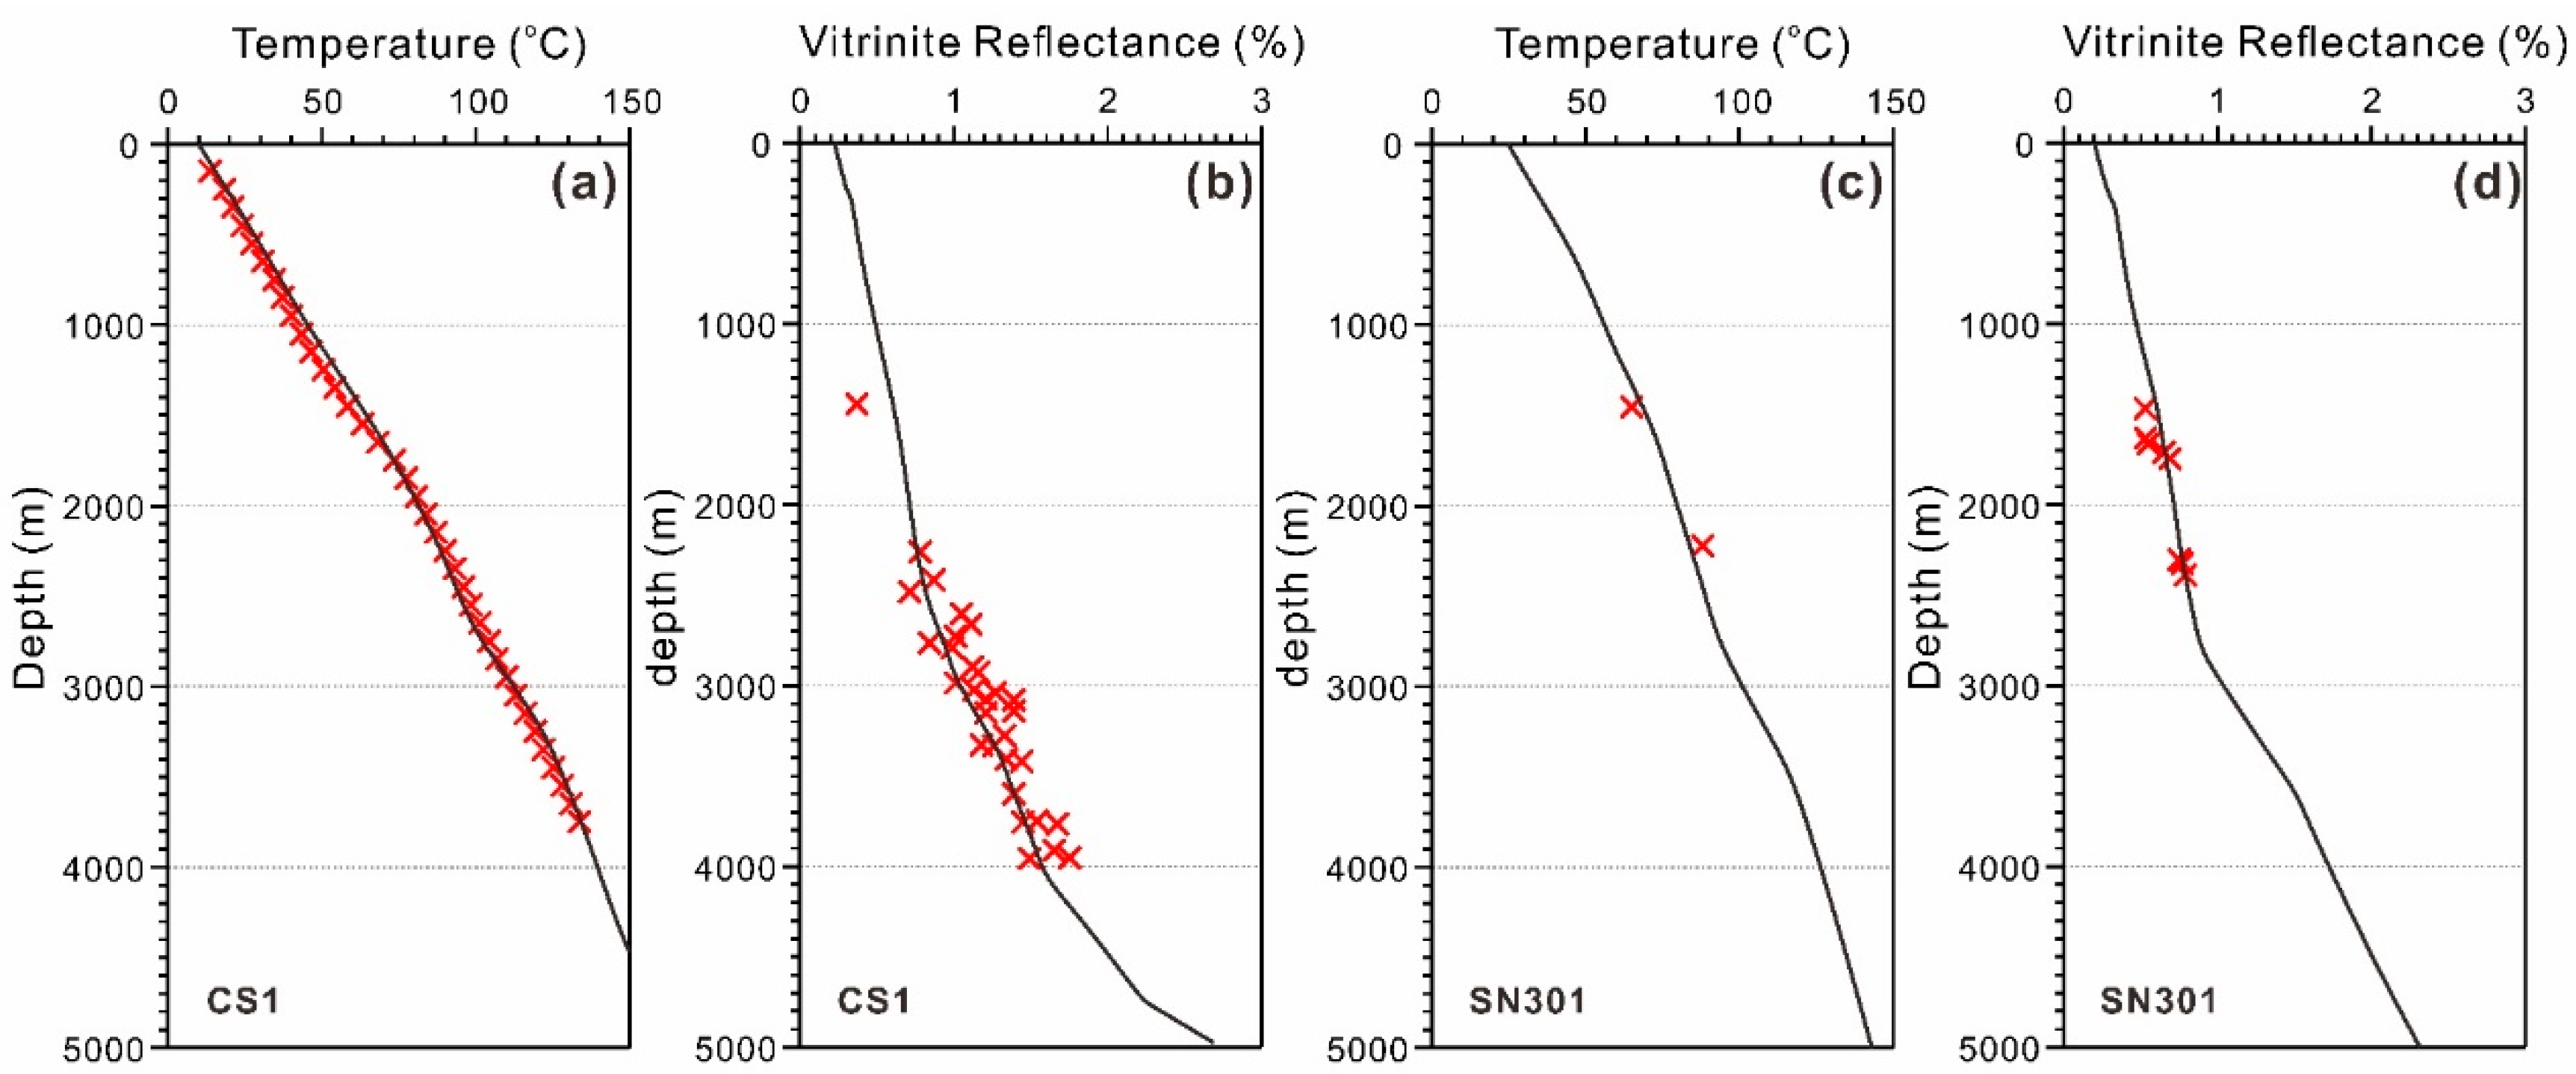
After defining the HF based on different scales, namely, horizontal divergence and temporal variations, we ran the entire 3D model simulation. We extracted several individual wells from the results to check the accuracy of the model. The simulated temperature and VR fit the measured data well, as shown in Figure 13.
4.2. Source Rock Maturation, Petroleum Generation and Expulsion
We set a pseudo well from the southern fault sag, where the three series of potential source rocks are distributed in depth. Because of the rapid burial speed, organic matter transformed into hydrocarbons shortly after the maturation exceeded the threshold of petroleum generation (Ro = 0.5%) [61]. The petroleum generation in the J3h began at 142 Ma, that in K1sh began at 132 Ma, and that in K1y began at 125 Ma. The source rocks entered the oil window shortly after the deposition of each layer, demonstrating rapid sedimentation, and the burial depth exceeded 2000 m before the formations finished deposition (Figure 14a). On the other hand, the high paleo-formation temperature gradient also contributed to the swift maturation. An obvious mitigation phase occurred, during which the TR and VR increased from 129 Ma to 112 Ma, corresponding to the first denudation of the entire region at the end of the deposition of K1y. At 128 Ma, the Huoshiling source rock reached a TR value of 85% and VR value of 2.5% (Figure 14b), which means that the organic matter in the J3h transformed into gas before the trap had formed. The increase in generated mass was low after 128 Ma, and hydrocarbon activity tended to stop gradually. Thus, the hydrocarbon expulsion from the J3h likely contributed little to the gas accumulation in the Changling Depression. As shown in Figure 14c, the generated mass of K1sh experienced two increasing peak stages from 136 Ma to 128 Ma and from 112 Ma to 100 Ma. The TR of the first stage reached 25% and the VR reached 0.9%. The lower seam generated gas, while the mudstone generated oil; however, the early hydrocarbon-expulsion event did not have proper preservation conditions. The TR of the K1y and K1sh rapidly increased from 112 Ma to 100 Ma, as did the generated mass’ growth rate (Figure 14b,c). The K1d reservoir and K1q seal rock were deposited during this period, and the conditions were suitable for the accumulation of hydrocarbons.
Two main sources were present: the southwestern sag and the northern sag (Figure 15a–c). The maturity of the northern sag is currently higher than that of the southwestern sag. All three source rocks had entered the oil window, and the maturity in the sag reached 2.0 %Ro. Alongside the dark-mudstone distribution areas (Figure 5), the degree of thermal evolution had reached a high level. Hydrocarbons formed shortly after the strata were deposited; however, the reservoir and seal rocks had not yet formed, and hydrocarbons may have escaped. Any gas that was generated before 100 Ma was not preserved and the rapid increase period may have contributed little to the final accumulation. The slow growth of generated mass after 100 Ma may have been related to the current oil and gas resources in the basin (Figure 14d–f). The magnitude of hydrocarbon generation from the K1y and K1sh source rocks was significantly larger than that from the J3h. The gas production from K1sh was larger because of the deposition of a coal seam.
4.3. Hydrocabon Accumulation in the Main Reservoir: Denglouku Formation
The modeled oil- and gas-migration paths and accumulation in the four main gas fields, namely, Haerjin, Shuangtuozi, Dalaoyefu and Fulongquan, are shown below (Figure 16). The green lines are the migration flow paths of the oil, and the red lines indicate the gas-migration paths. The migration rules of the entire basin flowed from the depression to the margin because of differences in the fluid potential. The hydrocarbon streams vertically migrated to K1d through opening faults and then horizontally migrated to structural highs.
The petroleum-migration rules revealed four main migration-accumulation units, as shown in Figure 17: a central uplift zone, a southern fault sag zone, a western slope zone, and a northeastern slope zone. The central uplift zone included a southeastern slope zone. The Haerjin structure is located in the central uplift zone, and the other three gas fields are distributed in the southeastern slope zone. We found few migration paths that could have formed the Haerjin gas field. The faults acted as a channel for vertical hydrocarbon migration and a sealing border to prevent the lateral leakage of gas. The source rocks that contributed to the gas zone that is marked by well CS1 should be located in the K1y and K1sh of the southern sag. The eastern portion of the K1sh source rock may have also generated hydrocarbons and moved to the Haerjin structure (Figure 5b,e,h). The Dalaoyefu and Shuangtuozi structures are located above the eastern source rock, and hydrocarbons that formed in this area migrated to nearby traps. The source rocks reached high maturity; the VR was approximately 2.0%, reaching the gas-generation peak (Figure 15). Additionally, hydrocarbons in surrounding areas would have amassed in structural highs. The Fulongquan structure is located near the margin of the Changling Depression, and the underlying source rock has the potential for abundant gas generation. The thickness of the source rocks was approximately 400 m, and the HI and TOC values were suitable for abundant gas generation, although this area is not large (Figure 5). The different tectonic belts had diverse characteristics in terms of hydrocarbon-charging rules. We will discuss these main gas-bearing structures in Section 5 below.
Oil and gas migrated through the enormous regional faults in the southern fault sag zone. Leakage from the source rock was a significant problem and acted as a restraining factor for gas accumulation. Several sets of fault traps could have been present, but the preservation conditions were unstable because of frequent tectonic activity (Figure 17). Hydrocarbons moved horizontally to the NW in K1d in the western slope zone. Hydrocarbons that formed in the source rock in the central depression moved to the western slope and may have accumulated in the border of the basin and fault traps. The generated mass was large, but the reservoir layer was nearly flat in that area and could not adequately hold gas. The model was set as a closed-border basin because the Changling Depression is surrounded by border faults, which cut through all the Cretaceous layers. Thus, hydrocarbons that migrated to the edge of the depression would be blocked by these faults. Enormous oil and gas accumulation occurred in the NE slope zone, where the migration rules were similar to those in the western slope zone. A structural high was present in the NE slope zone, and hydrocarbon generation in the northern source rock filled up the trap in this location.
5. Discussion
5.1. Definition of Key Hydrocarbon-Accumulation Moments
Fluid inclusions, or microscopic vesicles of liquid and gas, are trapped in growing crystals. Little addition of irrelevant matter or reduction of the original substances occurs after the formation of a fluid inclusion. Hydrocarbon and liquid inclusions can be trapped concurrently during hydrocarbon migration [91]. Therefore, these inclusions offer relatively accurate information regarding the temperature of mineral growth at the time of the fluid migration and entrapment, which has been widely used in petroleum geology [1,67,92,93,94].
Prior studies have measured the homogenization temperatures of fluid inclusions from 19 reservoir samples from 10 wells in K1d in the Changling Depression [12,95]. The frequency histogram of the homogenization temperatures of inclusions shows different distributions among the four gas-bearing structures, as discussed in Section 4.3 (Figure 18A-b, B-b, C-b and D-b). The trapping temperatures of different structures varied. The different burial depths and temperature gradients may have created differences in the inclusions’ homogenization temperatures, as did the unique filling timing. We examined individual wells near the highest point of each petroliferous trap and extracted their 1D models. When we projected the dominant iso-temperature lines and strata horizons, these features intersected at several points. The crossing point in K1d, the main reservoir layer, marks when and where hydrocarbons moved through or in the sandstone. Therefore, we could reveal the critical period of the charging event, which is an important component of reconstructing petroleum system elements.
5.1.1. Haerjin Structure: Well CS1
According to Figure 18A-b, the homogenization temperatures of the fluid inclusions were mainly distributed from 110 °C to 140 °C. In Figure 18A-a, we plotted iso-temperature lines at 110 °C and 140 °C, and the iso-temperature lines and K1d stratum are encircled in the red region, indicating the accumulation period and depth. Two stars mark the beginning and end of the main reservoir-formation stage from 80 Ma to 66 Ma, corresponding to the Middle Nengjiang Formation to Early Mingshui Formation deposition. Additionally, we could verify the result in Figure 18A-c. The red line represents the formation temperature, while the blue line represents the petroleum-saturation change in K1d. The petroleum saturation was calculated from the migration and accumulation simulations. The red area was limited by certain extreme temperature values and matched the width of the blue area, which was defined by the petroleum-saturation increase period. Thus, the moment of the petroleum-charging event conformed to the time that aqueous inclusions were captured. Long-term hydrocarbon accumulation occurred in the Haerjin structure from 80 Ma to 66 Ma. An original charging event also occurred from 100 Ma to 88 Ma, when the hydrocarbon saturation rapidly rose but then subsequently dropped because the trap had not yet formed (Figure 18A-c).
5.1.2. Shuangtuozi Structure: Well TS1
Two temperature peaks occurred in the homogenization temperature-distribution diagram from 80 °C to 100 °C and from 110 °C to 140 °C (Figure 18B-b). Figure 18B-a shows the two hydrocarbon-charging periods. The first charging event occurred between 106 Ma and 101 Ma, which is marked in the left-hand triangle in Figure 18B-c. The petroleum saturation rose at almost the same period until 100 Ma, when the saturation dropped to 0% over the following 6 Ma, which marks petroleum leakage. After 78 Ma, the petroleum saturation rose significantly, corresponding to the temperature range. The hydrocarbon charged over the following 10 Ma and dropped during the uplifting and erosion period. In fact, the petroleum saturation was relatively low in the Shuangtuozi structure, and the present-day hydrocarbon aggregation was mainly derived from the lateral filling from 23 Ma to 0 Ma.
5.1.3. Dalaoyefu Structure: Well L14
The samples from the Dalaoyefu structure recorded a dominant homogenization temperature from 90 °C to 120 °C (Figure 18C-b). A long-term hydrocarbon-charging event occurred from 101 Ma to 67 Ma (Figure 18C-a). The K1d is not particularly thick but did record high petroleum saturation because of continuous gas filling and lower leakage during the structural-inversion period. The maximum saturation was approximately 90% at 66 Ma (Figure 18C-c). The petroleum-charging period lasted from 112 Ma to 66 Ma according to the saturation change, and rapid growth began at 100 Ma, which matched the temperature interval.
5.1.4. Fulongquan Structure: Well F3
The model covered a portion of the Fulongquan structure, and the homogenization-temperature analysis results were mainly distributed from 70 °C to 110 °C (Figure 18D-b). The depth of K1d in the Fulongquan structure is approximately 1000 m, but the HF in this area was relatively higher (Figure 12). The charging period in K1d lasted from 107 Ma to 67 Ma (Figure 18D-a). The evolution of the petroleum saturation continuously changed from 112 Ma to 66 Ma (Figure 18D-c). First, the saturation increased from 112 Ma to 84 Ma during hydrocarbon filling. Then, the saturation decreased from 84 Ma to 74 Ma because of leakage and then rose again between 74 Ma and 66 Ma. During the long-term denudation from 66 Ma to 23 Ma, the petroleum saturation continuously dropped until the start of Paleogene deposition. At present, the saturation has slightly increased but is relatively lower than that of the Dalaoyefu structure.
5.2. Migration and Accumulation Rules in the Changling Depression
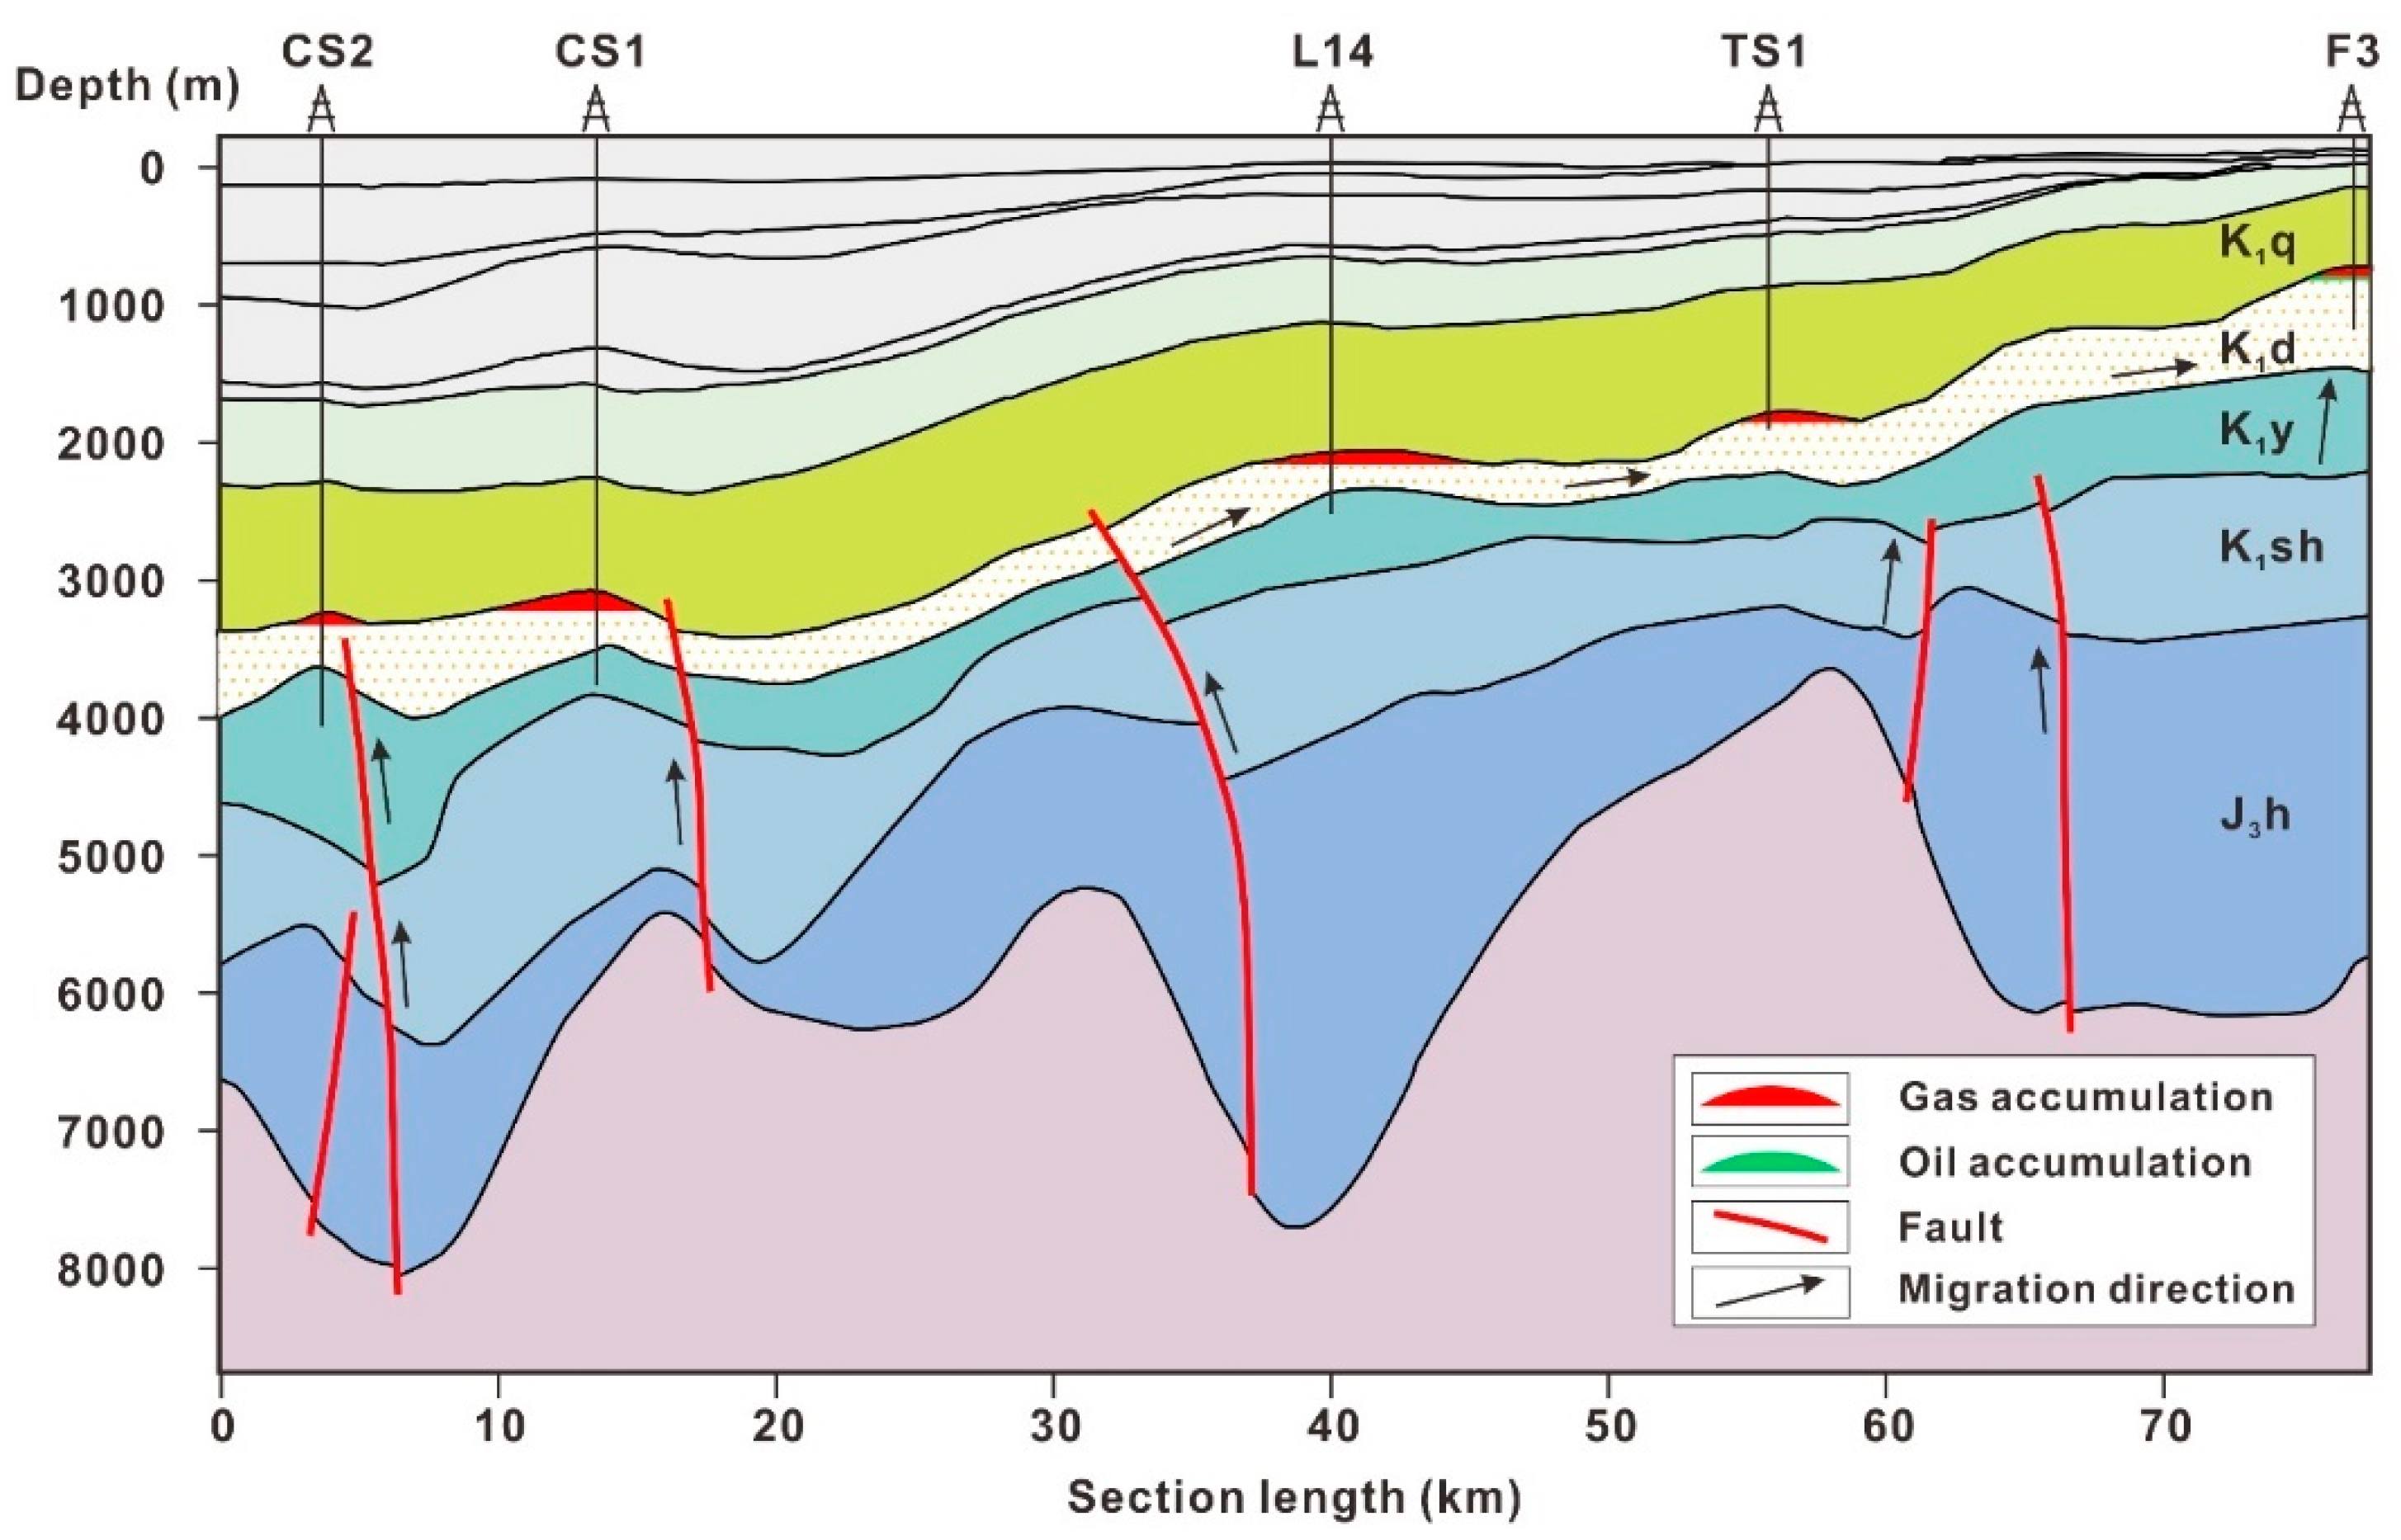
We extracted a 2D section model by using a section line in the Changling Depression (Figure 17) to summarize the overall rules of the migration and accumulation of hydrocarbons in tight sandstone in the Changling Depression (Figure 19). In the Haerjin and Dalaoyefu structures, humic-type pyrolysis gas that formed from source rock in the K1y and K1sh migrated through deep faults and accumulated in the K1d reservoir. The gas accumulation in Well CS1, Well CS2 and Well L14 mainly followed the vertical-migration rule. The gas pools in the Shuangtuozi and Fulongquan structures originated from hydrocarbons that formed in K1y and migrated horizontally in K1d. Gas accumulation in the slope areas, including Well TS1 and Well F3, primarily abided by the horizontal-migration rule.
6. Conclusions
The gas accumulation zones in the Changling Depression obtained using the 3D basin modelling approach matched the discovered gas fields. We could pay more attention to the potential petroleum accumulation areas in further exploration. The hydrocarbon-generation center is in the southwestern sag and the northern sag of the Changling Depression, and K1sh and K1y are the major source rocks, which have high gas-generation intensity, but the peak petroleum-generation period (112–100 Ma) was earlier than the formation of the trap. The storage configuration is the critical condition of the hydrocarbon accumulation.
Homogenization-temperature analysis of fluid inclusions indicated two sets of critical moments of hydrocarbon accumulation. The Dalaoyefu and Fulongquan structures experienced long-term hydrocarbon accumulation from 100 Ma to 67 Ma. The Haerjin and Shuangtuozi structures followed the lateral reservoir-formation stage, and hydrocarbon filling occurred between 80 Ma and 66 Ma. The Shuangtuozi structure had two phases of accumulation, but the first period did not contribute to the present gas accumulation.
A combination of inclusion analysis and hydrocarbon-accumulation simulations indicated different stages of reservoir formation, gas leakage and gas-pool reformation. The major gas-bearing structures initially formed during the deposition of the Early K1q (110 Ma) and then underwent varying degrees of leakage. By the middle of the deposition of the Nenjiang Formation (80 Ma), the structures had developed into the primary gas-accumulation reservoir. Long-term uplifting and regional erosion during the later deposition of the Nenjiang and Mingshui formations caused petroleum losses. Gas accumulation steadily increased after denudation (23 Ma) and formed sets of secondary gas reservoirs. The remaining kerogen in the K1y and K1sh supported the gas intensity during the Neogene.
The Changling Depression could be divided into four migration and accumulation units, and the distribution of the source rocks controlled the accumulation locations of hydrocarbons. Faults acted as major channels for hydrocarbon migration, and hydrocarbons could migrate horizontally into the reservoirs over short distances.
Author Contributions
Conceptualization by J.Z., J.G., model construction by J.G., source rock analysis by Y.L., data processing by Z.S.; J.G. and J.Z. contributes to the writing of the manuscript.
Funding
This paper was supported by the Major National R&D Projects of China (No.2016ZX05027-001-006) and Fundamental Research Funds for the Central Universities (No. 2015KJJCB11).
Conflicts of Interest
The authors declare no conflict of interest.
References
- Yang, G.; Zhao, Z.Y.; Shao, M.L. Formation of carbon dioxide and hydrocarbon gas reservoirs in the Changling fault depression, Songliao Basin. Pet. Explor. Dev. 2011, 38, 52–58. [Google Scholar]
- Dong, T.; He, S.; Yin, S.Y.; Wang, D.X.; Hou, Y.G.; Guo, J.G. Geochemical characterization of source rocks and crude oils in the Upper Cretaceous Qingshankou Formation, Changling Sag, southern Songliao Basin. Mar. Pet. Geol. 2015, 64, 173–188. [Google Scholar] [CrossRef]
- Dong, T.; He, S.; Wang, D.X.; Hou, Y.G. Hydrocarbon migration and accumulation in the Upper Cretaceous Qingshankou Formation, Changling Sag, southern Songliao Basin: Insights from integrated analyses of fluid inclusion, oil source correlation and basin modelling. J. Asian Earth Sci. 2014, 90, 77–87. [Google Scholar] [CrossRef]
- Xu, J.J.; Liu, Z.J.; Bechtel, A.; Meng, Q.T.; Sun, P.C.; Jia, J.L.; Cheng, L.J.; Song, Y. Basin evolution and oil shale deposition during Upper Cretaceous in the Songliao Basin (NE China): Implications from sequence stratigraphy and geochemistry. Int. J. Coal Geol. 2015, 149, 9–23. [Google Scholar] [CrossRef]
- Gao, F.L.; Song, Y.; Li, Z.; Xiong, F.Y.; Chen, L.; Zhang, Y.H.; Liang, Z.K.; Zhang, X.X.; Chen, Z.Y.; Joachim, M. Lithofacies and reservoir characteristics of the Lower Cretaceous continental Shahezi Shale in the Changling Fault Depression of Songliao Basin, NE China. Mar. Pet. Geol. 2018, 98, 401–421. [Google Scholar] [CrossRef]
- Li, H.; Lu, J.L.; Li, R.L.; Wang, B.H.; Xu, W.; Zuo, Z.X.; Wang, M.; Liu, Y.Z. Generation Paleoenvironment and Its Controlling Factors of Lower Cretaceous Lacustrine Hydrocarbon Source Rocks in Changling Depression, South Songliao Basin. Earth Sci. 2017, 42, 1774–1786. (In Chinese) [Google Scholar]
- Yuan, J.; Wang, W.; Zhu, J.F.; Chen, X.X.; Zhao, H.H. Research on provenance and sedimentary facies of Yingcheng Formation in Lower Cretaceous in Longfengshan Subsag, Changling Fault Depression, Songliao Basin. Nat. Gas Geosci. 2017, 28, 93–105. (In Chinese) [Google Scholar]
- Zhang, P.H.; Lee, Y.I.; Zhang, J.L. Diagenesis of tight-gas sandstones in the Lower Cretaceous Denglouku Formation, Songliao Basin, NE China: Implications for reservoir quality. J. Pet. Geol. 2015, 38, 99–114. [Google Scholar] [CrossRef]
- Li, Y.; Chang, X.C.; Yin, W.; Sun, T.T.; Song, T.T. Quantitative impact of diagenesis on reservoir quality of the Triassic Chang 6 tight oil sandstones, Zhenjing area, Ordos Basin, China. Mar. Pet. Geol. 2017, 86, 1014–1028. [Google Scholar] [CrossRef]
- Shi, B.B.; Chang, X.C.; Yin, W.; Li, Y.; Mao, L.X. Quantitative evaluation model for tight sandstone reservoirs based on statistical methods—A case study of the Triassic Chang 8 tight sandstones, Zhenjing area, Ordos Basin, China. J. Pet. Sci. Eng. 2019, 173, 601–616. [Google Scholar] [CrossRef]
- Li, Y.; Chang, X.C.; Yin, W.; Wang, G.W.; Zhang, J.L.; Shi, B.B.; Zhang, J.H.; Mao, L.X. Quantitative identification of diagenetic facies and controls on reservoir quality for tight sandstones: A case study of the Triassic Chang 9 oil layer, Zhenjing area, Ordos Basin. Mar. Pet. Geol. 2019, 102, 680–694. [Google Scholar] [CrossRef]
- Liu, M.J.; Liu, Z.; Wu, Y.W.; Zhu, W.Q.; Wang, P. Differences in formation process of tight sandstone gas reservoirs in different substructures in Changling Fault Depression, Songliao Basin, NE China. Pet. Explor. Dev. 2017, 44, 257–264. [Google Scholar] [CrossRef]
- Chen, J.; Zhang, Q.L.; Wang, L.S.; Xie, G.A.; Xu, S.Y.; Bi, S.P.; Ge, R.F. Tectonic transformation of Changling Fault Depression in the Southern Songliao Basin and its significance of hydrocarbon accumulation. Acta Geol. Sin. 2008, 82, 1027–1035. (In Chinese) [Google Scholar]
- Zhu, Y.H.; Wang, J. Resource potential in the deep of the Shiwu Fault Depression and the Changling Sag, the Songliao Basin. Pet. Geol. Exp. 2003, 25, 149–152. (In Chinese) [Google Scholar]
- Zhu, J.H. Research on the Source Rock Evaluation and Gas Dynamic Reservoir Forming Rule in Changling Fault Depression. Ph.D. Thesis, Chengdu University of Technology, Chengdu, China, 2015. [Google Scholar]
- Welte, D.H.; Yalcin, M.N. Basin Modeling—A New Comprehensive Method in Petroleum Geology. Org. Geochem. 1988, 13, 141–151. [Google Scholar] [CrossRef]
- Welte, D.H.; Yukler, M.A. Petroleum Origin and Accumulation in Basin Evolution—A Quantitative Model. AAPG Bull. 1981, 65, 1387–1396. [Google Scholar]
- Hadad, Y.T.; Hakimi, M.H.; Abdullah, W.H.; Makeen, Y.M. Basin modeling of the Late Miocene Zeit source rock in the Sudanese portion of Red Sea Basin: Implication for hydrocarbon generation and expulsion history. Mar. Pet. Geol. 2017, 84, 311–322. [Google Scholar] [CrossRef]
- Radkovets, N.; Kosakowski, P.; Rauball, J.; Zakrzewski, A. Burial and Thermal History Modelling of the Ediacaran Succession in Western and Sw Ukraine and Moldova. J. Pet. Geol. 2018, 41, 85–106. [Google Scholar] [CrossRef]
- Hlaiem, A.; Biju-Duval, B.; Vially, R.; Laatar, E.; M’Rabet, A. Burial and thermal history modelling of the Gafsa-Metlaoui intracontinental Basin (southern Tunisia): Implications for petroleum exploration. J. Pet. Geol. 1997, 20, 403–425. [Google Scholar] [CrossRef]
- Premarathne, U.; Suzuki, N.; Ratnayake, N.; Kularathne, C. Burial and Thermal History Modelling of the Mannar Basin, Offshore Sri Lanka. J. Pet. Geol. 2016, 39, 193–213. [Google Scholar] [CrossRef]
- Galushkin, Y.; Eloghbi, S.; Sak, M. Burial and Thermal History Modelling of the Murzuq and Ghadames Basins (Libya) Using the Galo Computer Programme. J. Pet. Geol. 2014, 37, 71–93. [Google Scholar] [CrossRef]
- Chang, X.C.; Wang, T.G.; Li, Q.M.; Ou, G.X. Charging of Ordovician Reservoirs in the Halahatang Depression (Tarim Basin, Nw China) Determined by Oil Geochemistry. J. Pet. Geol. 2013, 36, 383–398. [Google Scholar]
- Baniasad, A.; Rabbani, A.; Sachse, V.F.; Littke, R.; Moallemi, S.A.; Soleimany, B. 2D basin modeling study of the Binak Trough, northwestern Persian Gulf, Iran. Mar. Pet. Geol. 2016, 77, 882–897. [Google Scholar] [CrossRef]
- Brandes, C.; Astorga, A.; Littke, R.; Winsemann, J. Basin modelling of the Limon Back-arc Basin (Costa Rica): Burial history and temperature evolution of an island arc-related basin-system. Basin Res. 2008, 20, 119–142. [Google Scholar] [CrossRef]
- Lv, D.W.; Chen, J.T.; Li, Z.X.; Zheng, G.Q.; Song, C.Y.; Liu, H.Y.; Meng, Y.R.; Wang, D.D. Controlling Factors, Accumulation Model and Target Zone Prediction of the Coal-bed Methane in the Huanghebei Coalfield, North China. Resour. Geol. 2014, 64, 332–345. [Google Scholar] [CrossRef] [Green Version]
- Bruns, B.; Littke, R.; Gasparik, M.; van Wees, J.D.; Nelskamp, S. Thermal evolution and shale gas potential estimation of the Wealden and Posidonia Shale in NW-Germany and the Netherlands: A 3D basin modelling study. Basin Res. 2016, 28, 2–33. [Google Scholar] [CrossRef]
- Mohsenian, E.; Fathi-Mobarakabad, A.; Sachsenhofer, R.F.; Asadi-Eskandar, A. 3d Basin Modelling in the Central Persian Gulf, Offshore Iran. J. Pet. Geol. 2014, 37, 55–70. [Google Scholar] [CrossRef]
- Pang, Y.M.; Zhang, X.H.; Guo, X.W.; Xiao, G.L.; Han, Z.Z. Basin modeling in the initial stage of exploration: A case study from the North Subbasin of the South Yellow Sea Basin. Acta Oceanol. Sin. 2017, 36, 65–78. [Google Scholar] [CrossRef]
- Hantschel, T.; Kauerauf, A.I. Fundamentals of Basin and Petroleum Systems Modeling; Springer: Berlin/Heidelberg, Germany, 2009. [Google Scholar]
- Sachse, V.F.; Anka, Z.; Littke, R.; Rodriguez, J.F.; Horsfield, B.; di Primio, R. Burial, Temperature and Maturation History of the Austral and Western Malvinas Basins, Southern Argentina, Based on 3d Basin Modelling. J. Pet. Geol. 2016, 39, 169–191. [Google Scholar] [CrossRef]
- Arfai, J.; Lutz, R. 3D basin and petroleum system modelling of the NW German North Sea (Entenschnabel). In Petroleum Geology of Nw Europe: 50 Years of Learning—Proceedings of the 8th Petroleum Geology Conference; Bowman, M., Levell, B., Eds.; Geological Society: London, UK, 2018; pp. 67–86. [Google Scholar]
- Olaru, R.; Krezsek, C.; Rainer, T.M.; Ungureanu, C.; Turi, V.; Ionescu, G.; Tari, G. 3D Basin Modelling of Oligocene-Miocene Maikop Source Rocks Offshore Romania and in the Western Black SEA. J. Pet. Geol. 2018, 41, 351–365. [Google Scholar] [CrossRef]
- Butt, A.J.; Gould, K. 3D source-rock modelling in frontier basins: A case study from the Zambezi Delta Depression. Pet. Geosci. 2018, 24, 277–286. [Google Scholar] [CrossRef]
- Zhang, J.L.; Guo, J.Q.; Liu, J.S.; Shen, W.L.; Li, N.; Xu, G.C. 3D-Basin Modelling of the Lishui Sag: Research of Hydrocarbon Potential, Petroleum Generation and Migration. Energies 2019, 12, 650. [Google Scholar] [CrossRef]
- Schneider, F.; Wolf, S.; Faille, I.; Pot, D. A 3D basin model for hydrocarbon potential evaluation: Application to Congo offshore. Oil Gas Sci. Technol. 2000, 55, 3–13. [Google Scholar] [CrossRef]
- McLimans, R.K. The application of fluid inclusions to migration of oil and diagenesis in petroleum reservoirs. Appl. Geochem. 1987, 2, 585–603. [Google Scholar] [CrossRef]
- Parnell, J. Potential of palaeofluid analysis for understanding oil charge history. Geofluids 2010, 10, 73–82. [Google Scholar]
- Bhullar, A.G.; Karlsen, D.A.; Backer-Owe, K.; Seland, R.T.; Le Tran, K. Dating reservoir filling—A case history from the North Sea. Mar. Pet. Geol. 1999, 16, 581–603. [Google Scholar] [CrossRef]
- Wang, P.J.; Chen, C.Y.; Zhang, Y.; Gao, Y.F.; Qu, X.J.; Yi, J. Characteristics of volcanic reservoirs and distribution rules of effective reservoirs in the Changling fault depression, Songliao Basin. Nat. Gas Ind. B 2015, 2, 440–448. [Google Scholar] [CrossRef] [Green Version]
- Wang, J.Q.; Yang, G.; Xue, L.F.; Zhang, J.W.; Bai, Y.; Li, W.B. Tectonic evolution of the Changling fault basin and its relationship to oil and gas accumulation. Min. Sci. Technol. (China) 2011, 21, 427–432. [Google Scholar] [CrossRef]
- Feng, Z.Q.; Jia, C.Z.; Xie, X.N.; Zhang, S.; Feng, Z.H.; Cross, T.A. Tectonostratigraphic units and stratigraphic sequences of the nonmarine Songliao basin, northeast China. Basin Res. 2010, 22, 79–95. [Google Scholar]
- Wei, H.H.; Liu, J.L.; Meng, Q.R. Structural and sedimentary evolution of the southern Songliao Basin, northeast China, and implications for hydrocarbon prospectivity. Am. Assoc. Pet. Geol. Bull. 2010, 94, 533–566. [Google Scholar] [CrossRef]
- Chang, X.C.; Wang, Y.; Shi, B.B.; Xu, Y.D. Charging of Carboniferous volcanic reservoirs in the eastern Chepaizi uplift, Junggar Basin (NW China) constrained by oil geochemistry and fluid inclusion. AAPG Bull. 2018. [Google Scholar] [CrossRef]
- Jiang, H.J. Research on Stratigraphic Characteristics of Deep Formation in Changling Fault Depression. Master’s Thesis, Northeast Petroleum University, Daqing, China, 2011. [Google Scholar]
- Wang, P.J.; Mattern, F.; Didenko, N.A.; Zhu, D.F.; Singer, B.; Sun, X.M. Tectonics and cycle system of the Cretaceous Songliao Basin: An inverted active continental margin basin. Earth-Sci. Rev. 2016, 159, 82–102. [Google Scholar] [CrossRef] [Green Version]
- Wang, P.J.; Xie, X.A.; Mattem, F.; Ren, Y.G.; Zhu, D.F.; Sun, X.M. The Cretaceous Songliao basin: Volcanogenic succession, sedimentary sequence and tectonic evolution, NE China. Acta Geol. Sin.-Eng. Ed. 2007, 81, 1002–1011. [Google Scholar]
- Lin, C.S.; Li, S.T.; Zhang, Q.M.; Zhang, Y.M. Lithospheric stretching, subsidence and thermal history modeling: Application to Yinggehai, Qiongdongnan and Songliao Basins in East China. J. China Univ. Geosci. 1997, 8, 83–89. [Google Scholar]
- Zhang, S.Q.; Ren, Y.G. The study of base level changes of the Songliao Basin in Mesozoic. J. Chang. Univ. (Earth Sci. Ed.) 2003, 25, 1–5. (In Chinese) [Google Scholar]
- Hantschel, T.; Kauerauf, A.I.; Wygrala, B. Finite element analysis and ray tracing modeling of petroleum migration. Mar. Pet. Geol. 2000, 17, 815–820. [Google Scholar] [CrossRef]
- Ge, R.F.; Zhang, Q.L.; Xu, S.Y.; Wang, L.S.; Xie, G.A.; Chen, J.; Wang, X.Y. Structure evolution and its kinetic setting of Changling fault depression in Songliao basin. J. Geol. 2009, 33, 346–358. (In Chinese) [Google Scholar]
- Ma, C.C.; Wang, J.Q.; Sun, J.; Zhang, J.W. Tectonic evolution and oil-gas reservoir forming period of Changling fault depression. Glob. Geol. 2013, 32, 305–316. (In Chinese) [Google Scholar]
- Yuan, W.; Xu, X.H.; Lu, J.L.; Yang, Z.Y.; Wang, B.H.; Zhu, J.F. Zircon SHRIMP dating and Hf isotope compositions of Late Mesozoic volcanic rocks from Changling fault depression, Songliao Basin, and their geological implications. Geol. Bull. China 2014, 33, 1473–1481. (In Chinese) [Google Scholar]
- Wu, Q.; Pu, R.H.; Han, M.Q.; Cao, H.H.; Li, Q. Zircon LA-ICP-MS U-Pb dating for the volcanic rocks in Changling Depression, and its geological implication. J. Miner. Pet. 2010, 30, 111–119. (In Chinese) [Google Scholar]
- Duran, E.R.; di Primio, R.; Anka, Z.; Stoddart, D.; Horsfield, B. 3D-basin modelling of the Hammerfest Basin (southwestern Barents Sea): A quantitative assessment of petroleum generation, migration and leakage. Mar. Pet. Geol. 2013, 45, 281–303. [Google Scholar] [CrossRef]
- Huang, W.B. The evaluation of deep source rocks and prediction of favorable areas in the mid-west fault depression, Songliao Southern Basin. Ph.D. Thesis, Northeast Petroleum University, Daqing, China, 2010. [Google Scholar]
- Kong, P.F.; Zhang, M. Geochemical research in Huoshiling Formation of source rocks in Dongling fault Depression of Changling area. J. Yangtze Univ. (Nat. Sci. Ed.) 2012, 9, 33–37. (In Chinese) [Google Scholar]
- Zhou, Z.M.; Wang, B.H.; Zhu, T.X.; Song, Z.X. Source rock features and exploration potential of Huoshiling Formation, Changling Fault Depression. Pet. Geol. Exp. 2011, 33, 613–616. (In Chinese) [Google Scholar]
- Lafargue, E.; Marquis, F.; Pillot, D. Rock-Eval 6 applications in hydrocarbon exploration, production, and soil contamination studies. Oil Gas Sci. Technol. 1998, 53, 421–437. [Google Scholar] [CrossRef]
- Behar, F.; Beaumont, V.; Penteado, H.L.D. Rock-Eval 6 technology: Performances and developments. Oil Gas Sci. Technol. Rev. IFP 2001, 56, 111–134. [Google Scholar] [CrossRef]
- Tissot, B.P.; Welte, D.H. Petroleum Formation and Occurrence; Springer: Berlin, Germany, 1978. [Google Scholar]
- Baskin, D.K. Atomic H/C ratio of kerogen as an estimate of thermal maturity and organic matter conversion. AAPG Bull. 1997, 81, 1437–1450. [Google Scholar]
- Espitalie, J. Use of Tmax as a maturation index for different types of organic matter: Comparison with vitrinite reflectance. In Thermal Modelling in Sedimentary Basins; Institut français du pétrole, Centre national de la recherche scientifique: Paris, France, 1986; pp. 475–496. [Google Scholar]
- Wang, Z.; Zhu, W.; Chen, C.; Fu, X. Basement Lithology and Distribution of Lishui-Jiaojiang Cenozoic Sag in East China Sea. J. Tongji Univ. Nat. Sci. 2014, 42, 636–644. [Google Scholar]
- Sun, D. The Prediction of Source Rocks Distribution and the Research of Hydrocarbon Generation Potential of Changling Fault Depression. Master’s Thesis, Northeast Petroleum University, Daqing, China, 2014. [Google Scholar]
- Wang, J.Q. The Research on Oil-Gas Reservoir Model and Distribution in the Changling Fault Depression. Master’s Thesis, Jilin University, Changchun, China, 2009. [Google Scholar]
- Tang, H.; Zhao, X.; Shao, M.; Sun, X.; Zhang, Y.; Cryton, P. Reservoir origin and characterization of gas pools in intrusive rocks of the Yingcheng Formation, Songliao Basin, NE China. Mar. Pet. Geol. 2017, 84, 148–159. [Google Scholar] [CrossRef]
- Lewan, M.D.; Ruble, T.E. Comparison of petroleum generation kinetics by isothermal hydrous and nonisothermal open-system pyrolysis. Org. Geochem. 2002, 33, 1457–1475. [Google Scholar] [CrossRef]
- Burnham, A.K. A Simple Kinetic Model of Petroleum Formation and Cracking; Lawrence Livermore National Laboratory: Livermore, CA, USA, 1989.
- Xue, H.Q.; Li, S.Y.; Wang, H.Y.; Zheng, D.W.; Fang, C.H. Pyrolysis kinetics of oil shale from Northern Songliao Basin in China. Oil Shale 2010, 27, 5–16. [Google Scholar]
- Zan, L.; Zhang, Z.H.; Huang, J.P.; He, X.; Feng, R.J.; Wu, Y.Y.; Fei, J.J.; Li, W.H. Geochemical characteristics of natural fas and its origin in Changling Fault Depression of Songliao Basin, Northeastern China. Nat. Gas Geosci. 2010, 21, 331–337. (In Chinese) [Google Scholar]
- Cao, H.R.; Zou, Y.R.; Lei, Y.; Xi, D.P.; Wan, X.Q.; Peng, P.A. Shale oil assessment for the Songliao Basin, Northeastern China, using oil generation–sorption method. Energy Fuels 2017, 31, 4826–4842. [Google Scholar] [CrossRef]
- Xie, L.J.; Sun, Y.G.; Jiang, A.Z.; Wang, F.Y.; Chen, J.P. Experimental study on the gas generation processes of lacustrine and marine shales in North China: Source implications for shale gas. Mar. Pet. Geol. 2015, 67, 204–216. [Google Scholar] [CrossRef]
- Wang, M.; Lu, S.F.; Xue, H.T. Kinetic simulation of hydrocarbon generation from lacustrine type I kerogen from the Songliao Basin: Model comparison and geological application. Mar. Pet. Geol. 2011, 28, 1714–1726. [Google Scholar]
- Pepper, A.S.; Corvi, P.J. Simple kinetic models of petroleum formation. Part III: Modelling an open system. Mar. Pet. Geol. 1995, 12, 417–452. [Google Scholar] [CrossRef]
- Wang, M.; Dong, Q.; Lu, S.F.; Tian, S.S.; Chen, G.H.; Sun, Y.F. Pyrolysis products characteristics and kinetic analysis of coal from Shahezi Formation of Songliao Basin under the TG-MS experiment. J. China Coal Soc. 2012, 37, 1150–1155. (In Chinese) [Google Scholar]
- Li, M.; Zhao, Y.M.; Liu, X.; Zhang, Y.M.; Wang, Y.S. Distribution of petroleum enriched areas, Changling Sag, southern Songliao Basin. Pet. Explor. Dev. 2009, 36, 413–418. [Google Scholar]
- Chen, J. Tectonic Transformation of Changling Fault Depression and Significance of Hydrocarbon Accumulation in Southern Songliao Basin. Master’s Thesis, Nanjing University, Nanjing, China, 2010. [Google Scholar]
- Xiang, C.F.; Feng, Z.Q.; Pang, X.Q.; Wu, H.Y.; Li, J.H. Late stage thermal history of the Songliao Basinband its tectonic implications: Evidence from apatite fission track (AFT) analyses. Sci. China Ser. D-Earth Sci. 2007, 50, 1479–1487. [Google Scholar] [CrossRef]
- Wang, C.S.; Feng, Z.Q.; Zhang, L.M.; Huang, Y.J.; Cao, K.; Wang, P.J.; Zhao, B. Cretaceous paleogeography and paleoclimate and the setting of SKI borehole sites in Songliao Basin, northeast China. Palaeogeogr. Palaeoclimatol. Palaeoecol. 2013, 385, 17–30. [Google Scholar] [CrossRef]
- Yalçin, M.N.; Littke, R.; Sachsenhofer, R.F. Thermal History of Sedimentary Basins. In Petroleum and Basin Evolution; Welte, D.H., Horsfield, B., Baker, D.R., Eds.; Springer: Berlin/Heidelberg, Germany; New York, NY, USA, 1997; pp. 71–161. [Google Scholar]
- Wygrala, B.P. Integrated Study of an Oil Field in the Southern Po Basin, Northern Italy. Ph.D. Thesis, University of Cologne, Cologne, Germany, 1989. [Google Scholar]
- Li, Z.A. Evolutionary features of mantle heat flux in Songliao Basin. Geotecton. Metallog. 1995, 19, 104–112. (In Chinese) [Google Scholar]
- He, S.; Tao, Y.C.; Jiang, P. Study on geothermal history in swell area of Southeast Songliao Basin by using several paleogeothermometers. Earth Sci.-J. China Univ. Geosci. 1995, 20, 328–334. (In Chinese) [Google Scholar]
- Ren, Z.L.; Xiao, D.M.; CHI, Y.L. Restoration of the palaeogeotherm in Songliao Basin. Pet. Geol. Oilfield Dev. Daqing 2001, 20, 13–14, 55. (In Chinese) [Google Scholar]
- Athy, L.F. Density, porosity, and compaction of sedimentary rocks. Bull. Am. Assoc. Pet. Geol. 1930, 1, 1–24. [Google Scholar]
- Larter, S. Chemical-Models of Vitrinite Reflectance Evolution. Geol. Rundsch. 1989, 78, 349–359. [Google Scholar] [CrossRef]
- Lerche, I.; Yarzab, R.F.; Kendall, C.G.S.C. Determination of Paleoheat Flux from Vitrinite Reflectance Data. AAPG Bull. 1984, 68, 1704–1717. [Google Scholar]
- Sweeney, J.J.; Burnham, A.K. Evaluation of a Simple-Model of Vitrinite Reflectance Based on Chemical-Kinetics. AAPG Bull. 1990, 74, 1559–1570. [Google Scholar]
- Burnham, A.K.; Sweeney, J.J. A chemical kinetic model of vitrinite maturation and reflectance. Geochim. Cosmochim. Acta 1989, 53, 2649–2657. [Google Scholar] [CrossRef]
- Guo, X.W.; Liu, K.Y.; He, S.; Song, G.Q.; Wang, Y.S.; Hao, X.F.; Wang, B.J. Petroleum generation and charge history of the northern Dongying Depression, Bohai Bay Basin, China: Insight from integrated fluid inclusion analysis and basin modelling. Mar. Pet. Geol. 2012, 32, 21–35. [Google Scholar] [CrossRef]
- Oxtoby, N.H. Comments on: Assessing the maturity of oil trapped in fluid inclusions using molecular geochemistry data and visually-determined fluorescence colours. Appl. Geochem. 2002, 17, 1371–1374. [Google Scholar] [CrossRef]
- Stasiuk, L.D.; Snowdon, L.R. Fluorescence micro-spectrometry of synthetic and natural hydrocarbon fluid inclusions: Crude oil chemistry, density and application to petroleum migration. Appl. Geochem. 1997, 12, 229–241. [Google Scholar] [CrossRef]
- Zhang, J.L.; Chang, X.C.; Liu, B.J.; Mao, F.M. Fluid history analysis and formation mechanism of the Yancheng petroleum reservoir. Acta Geol. Sin. 2002, 76. (In Chinese) [Google Scholar]
- Meng, F.Y. Accumulation conditions and models of natural gas in Denglouku Formation, Changling Rift. Ph.D. Thesis, China University of Petroleum, Beijing, China, 2009. [Google Scholar]
Figure 1.
Location and geographic setting of the study area. (a) General location map, with the borders and tectonic divisions of the Songliao Basin and Changling Depression modified after Chen et al. [13]. (b) Major structures and well locations in the Changling Depression.
Figure 1.
Location and geographic setting of the study area. (a) General location map, with the borders and tectonic divisions of the Songliao Basin and Changling Depression modified after Chen et al. [13]. (b) Major structures and well locations in the Changling Depression.

Figure 2.
Lithostratigraphy of the Changling Depression (adapted from Wang et al. and Lin et al. [47,48]. The paleo water depth curve was modified after Zhang and Ren [49] (PSE = petroleum system elements, SR = source rock, RR = reservoir rock, PWD = paleo water depth).
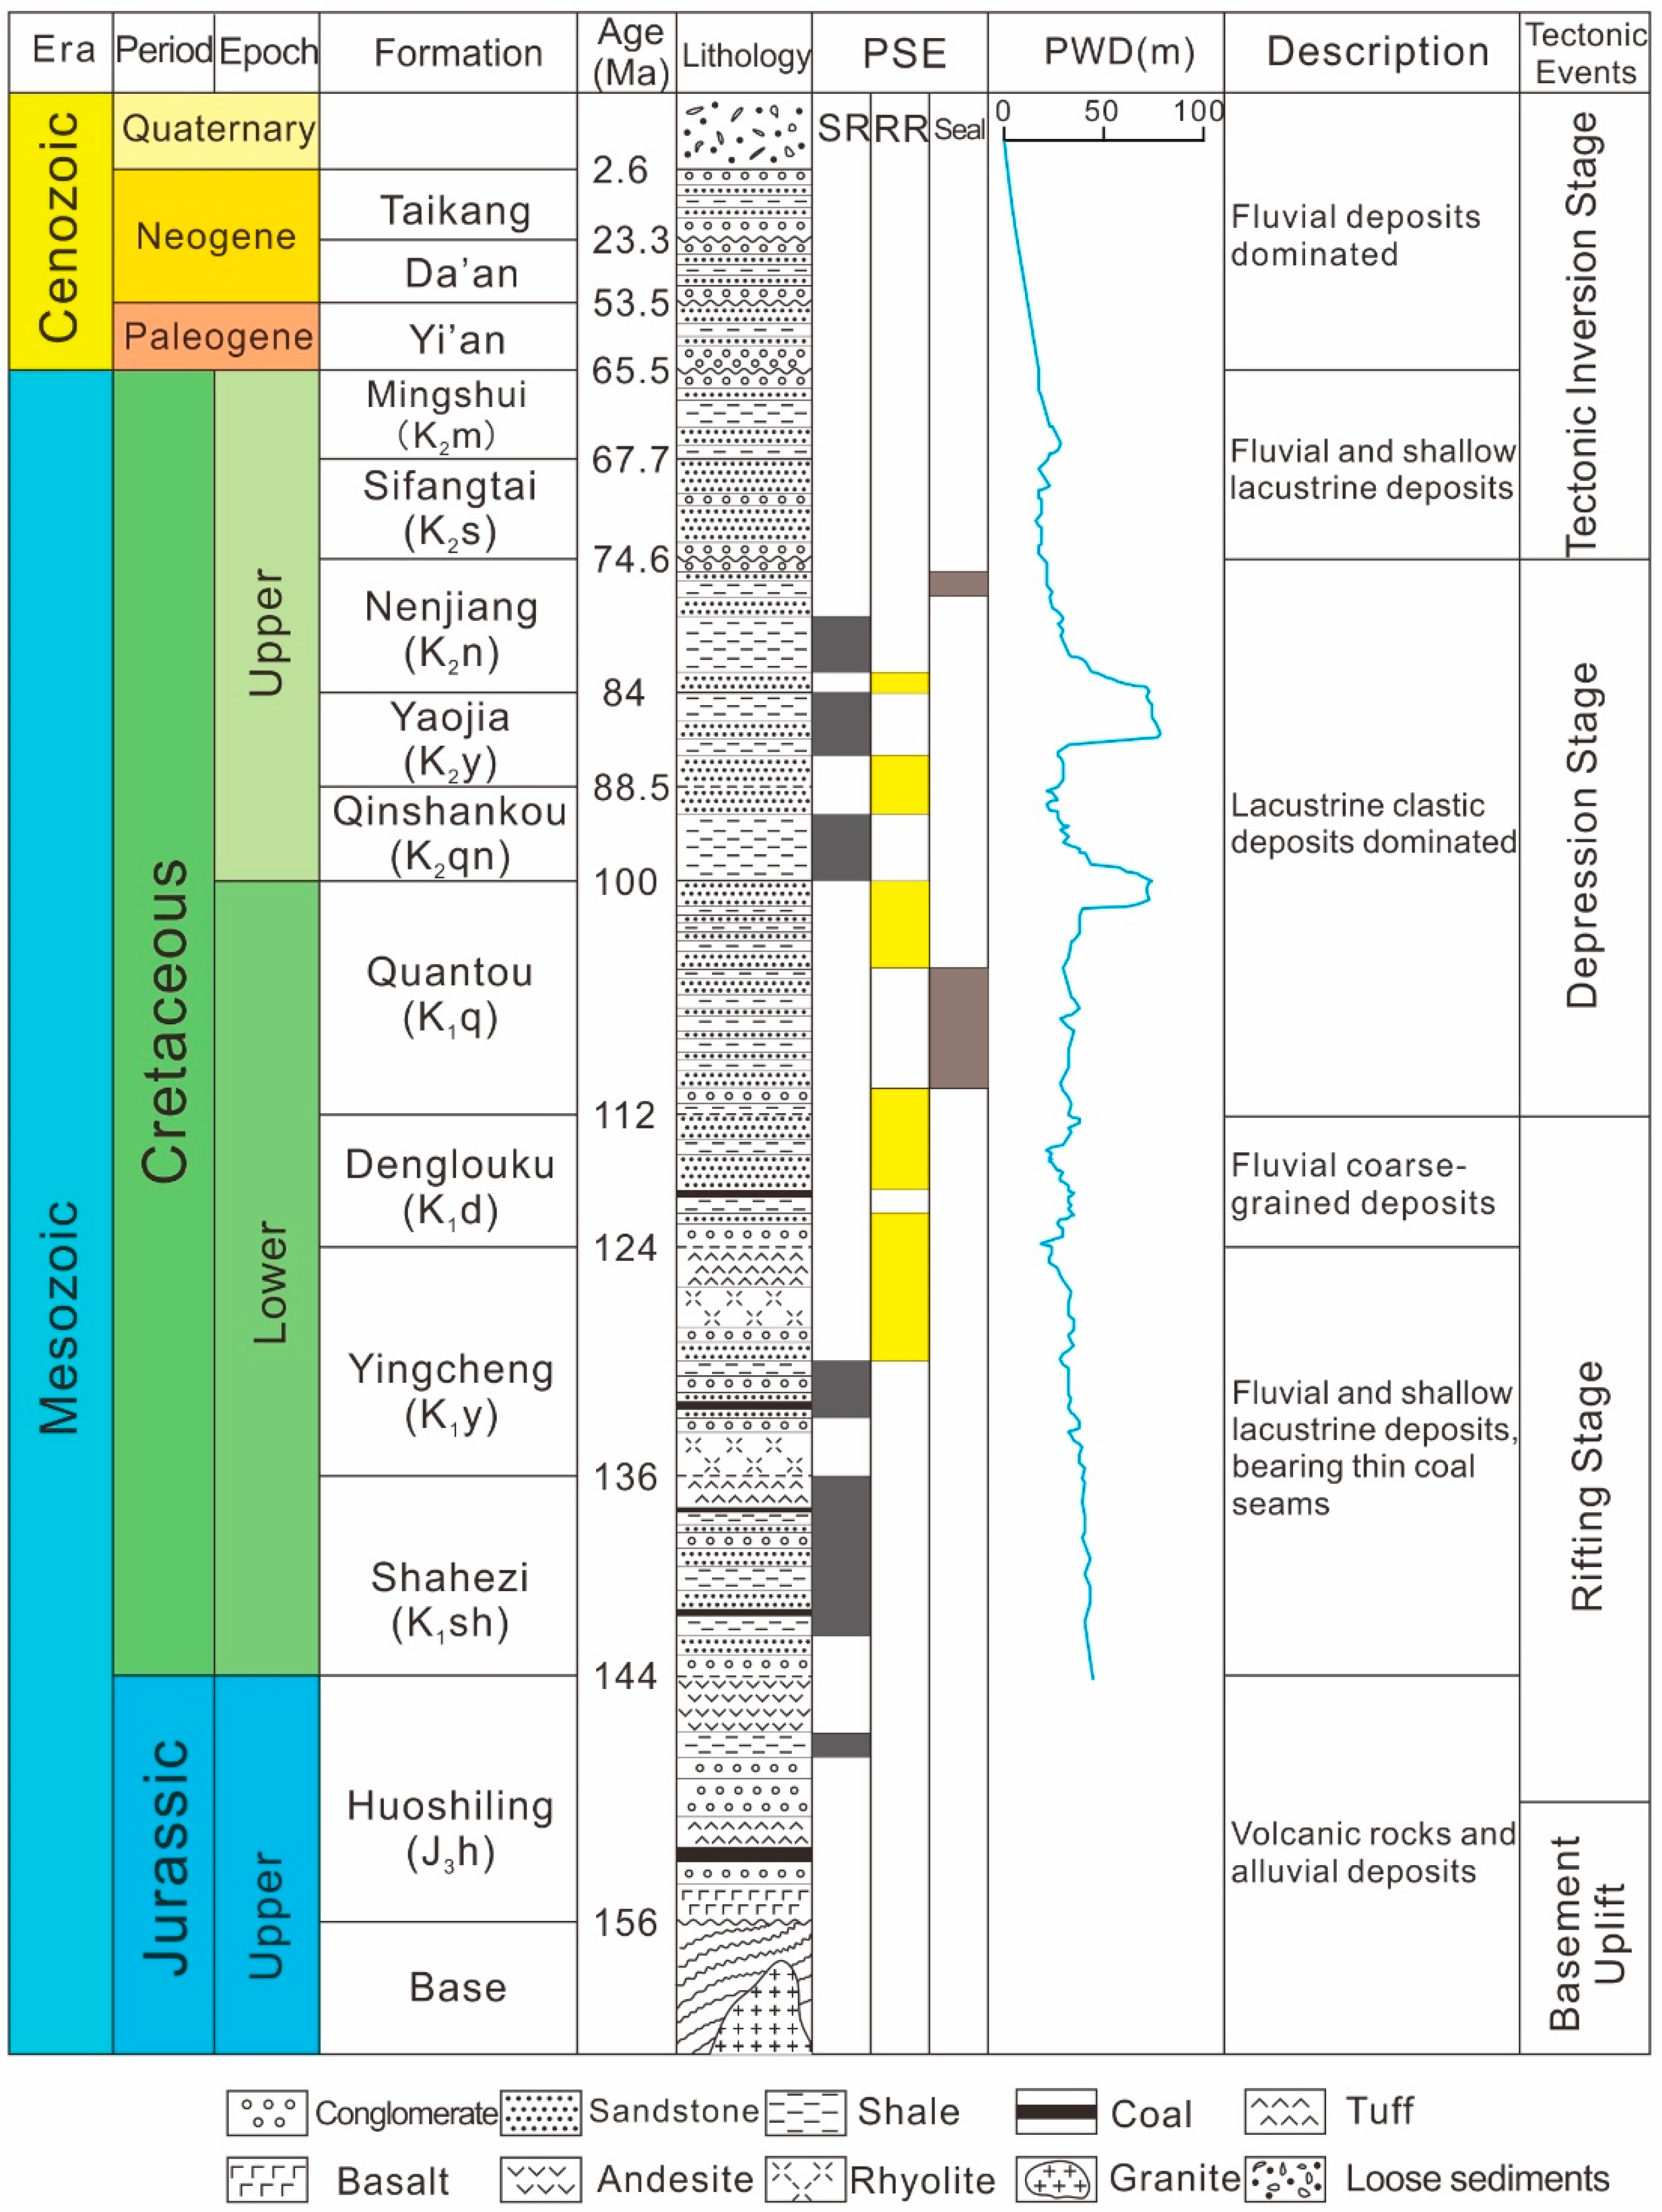
Figure 3.
3D model view and present-day dimensions of the Changling Depression. The table describes the general stratigraphy, alongside the PSE and the lithology types that were assigned for the model. Fm. = formation, OR = overburden rock, UR = underburden rock. “Igneous rock mixture” represents a mix of rhyolite, tuff and granite.

Figure 4.
Source rock evaluation plots of the main source rocks in the deep Changling Depression. (a) Variation in Rock–Eval S1 + S2 with the total organic carbon content (TOC). (b) Kerogen type and maturation definition with a van Krevelen diagram. (c) Hydrogen index (HI) with pyrolysis peak temperature (Tmax) for samples from K1y. (d) HI with Tmax for samples from K1sh.

Figure 5.
Maps of source rock properties. (a) Source rock isopach map of K1y. (b) Source rock isopach map of K1sh. (c) Source rock isopach map of J3h. (d) TOC contour map of K1y. (e) Source rock isopach map of K1sh. (f) Source rock isopach map of J3h. (g) HI contour maps of K1y. (h) HI contour maps of K1sh. (i) HI contour maps of J3h. (modified after literatures [15,56,64,65,66]).

Figure 6.
Kinetic models of the source rocks of the Changling Depression in this study. (a) Kinetic model of the shale based on the Burnham TIII model [69]; (b) kinetic model of the coal seam based on the Pepper and Corvi TIIIH(DE) model [75].
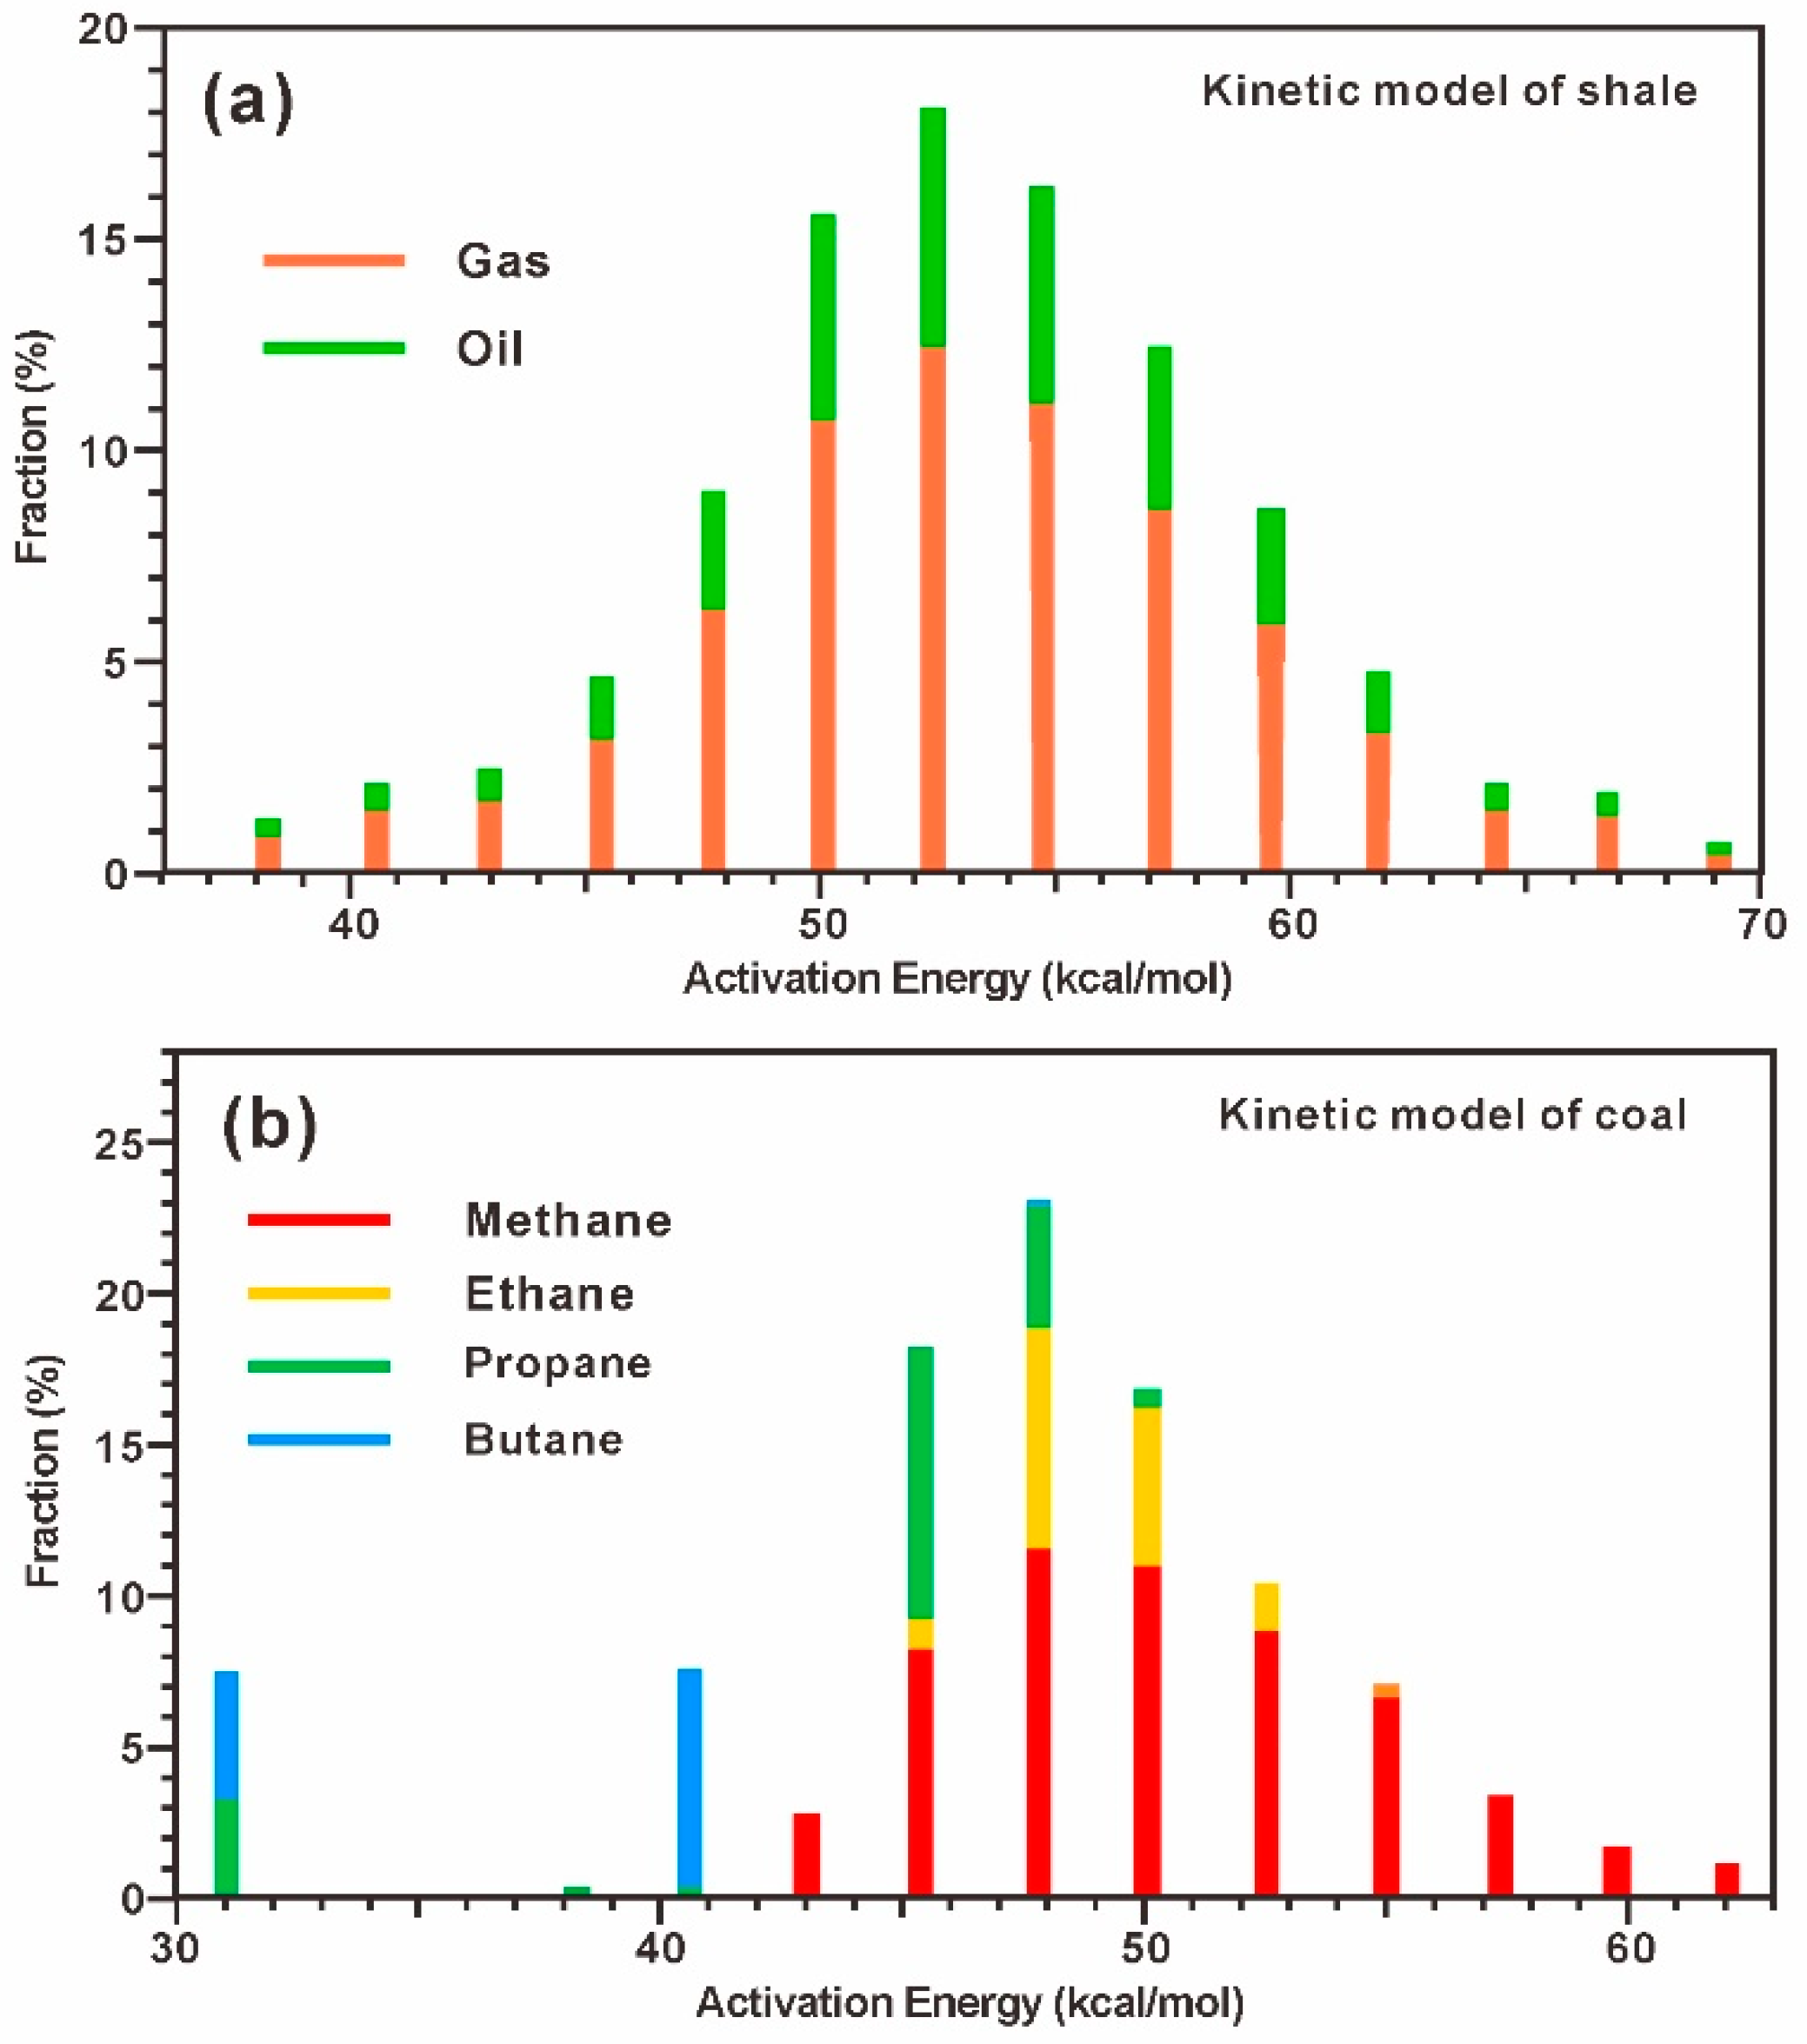
Figure 7.
Fault distribution in the Changling Depression. (a) Fault intersections on each layer surface. (b) Distribution of the gridded faults of the Changling Depression in the model.
Figure 7.
Fault distribution in the Changling Depression. (a) Fault intersections on each layer surface. (b) Distribution of the gridded faults of the Changling Depression in the model.

Figure 8.
General heat flow (HF) history that was calculated from the surface HF and basement HF of the Songliao Basin based on the research of Li, 1995 [83].
Figure 8.
General heat flow (HF) history that was calculated from the surface HF and basement HF of the Songliao Basin based on the research of Li, 1995 [83].
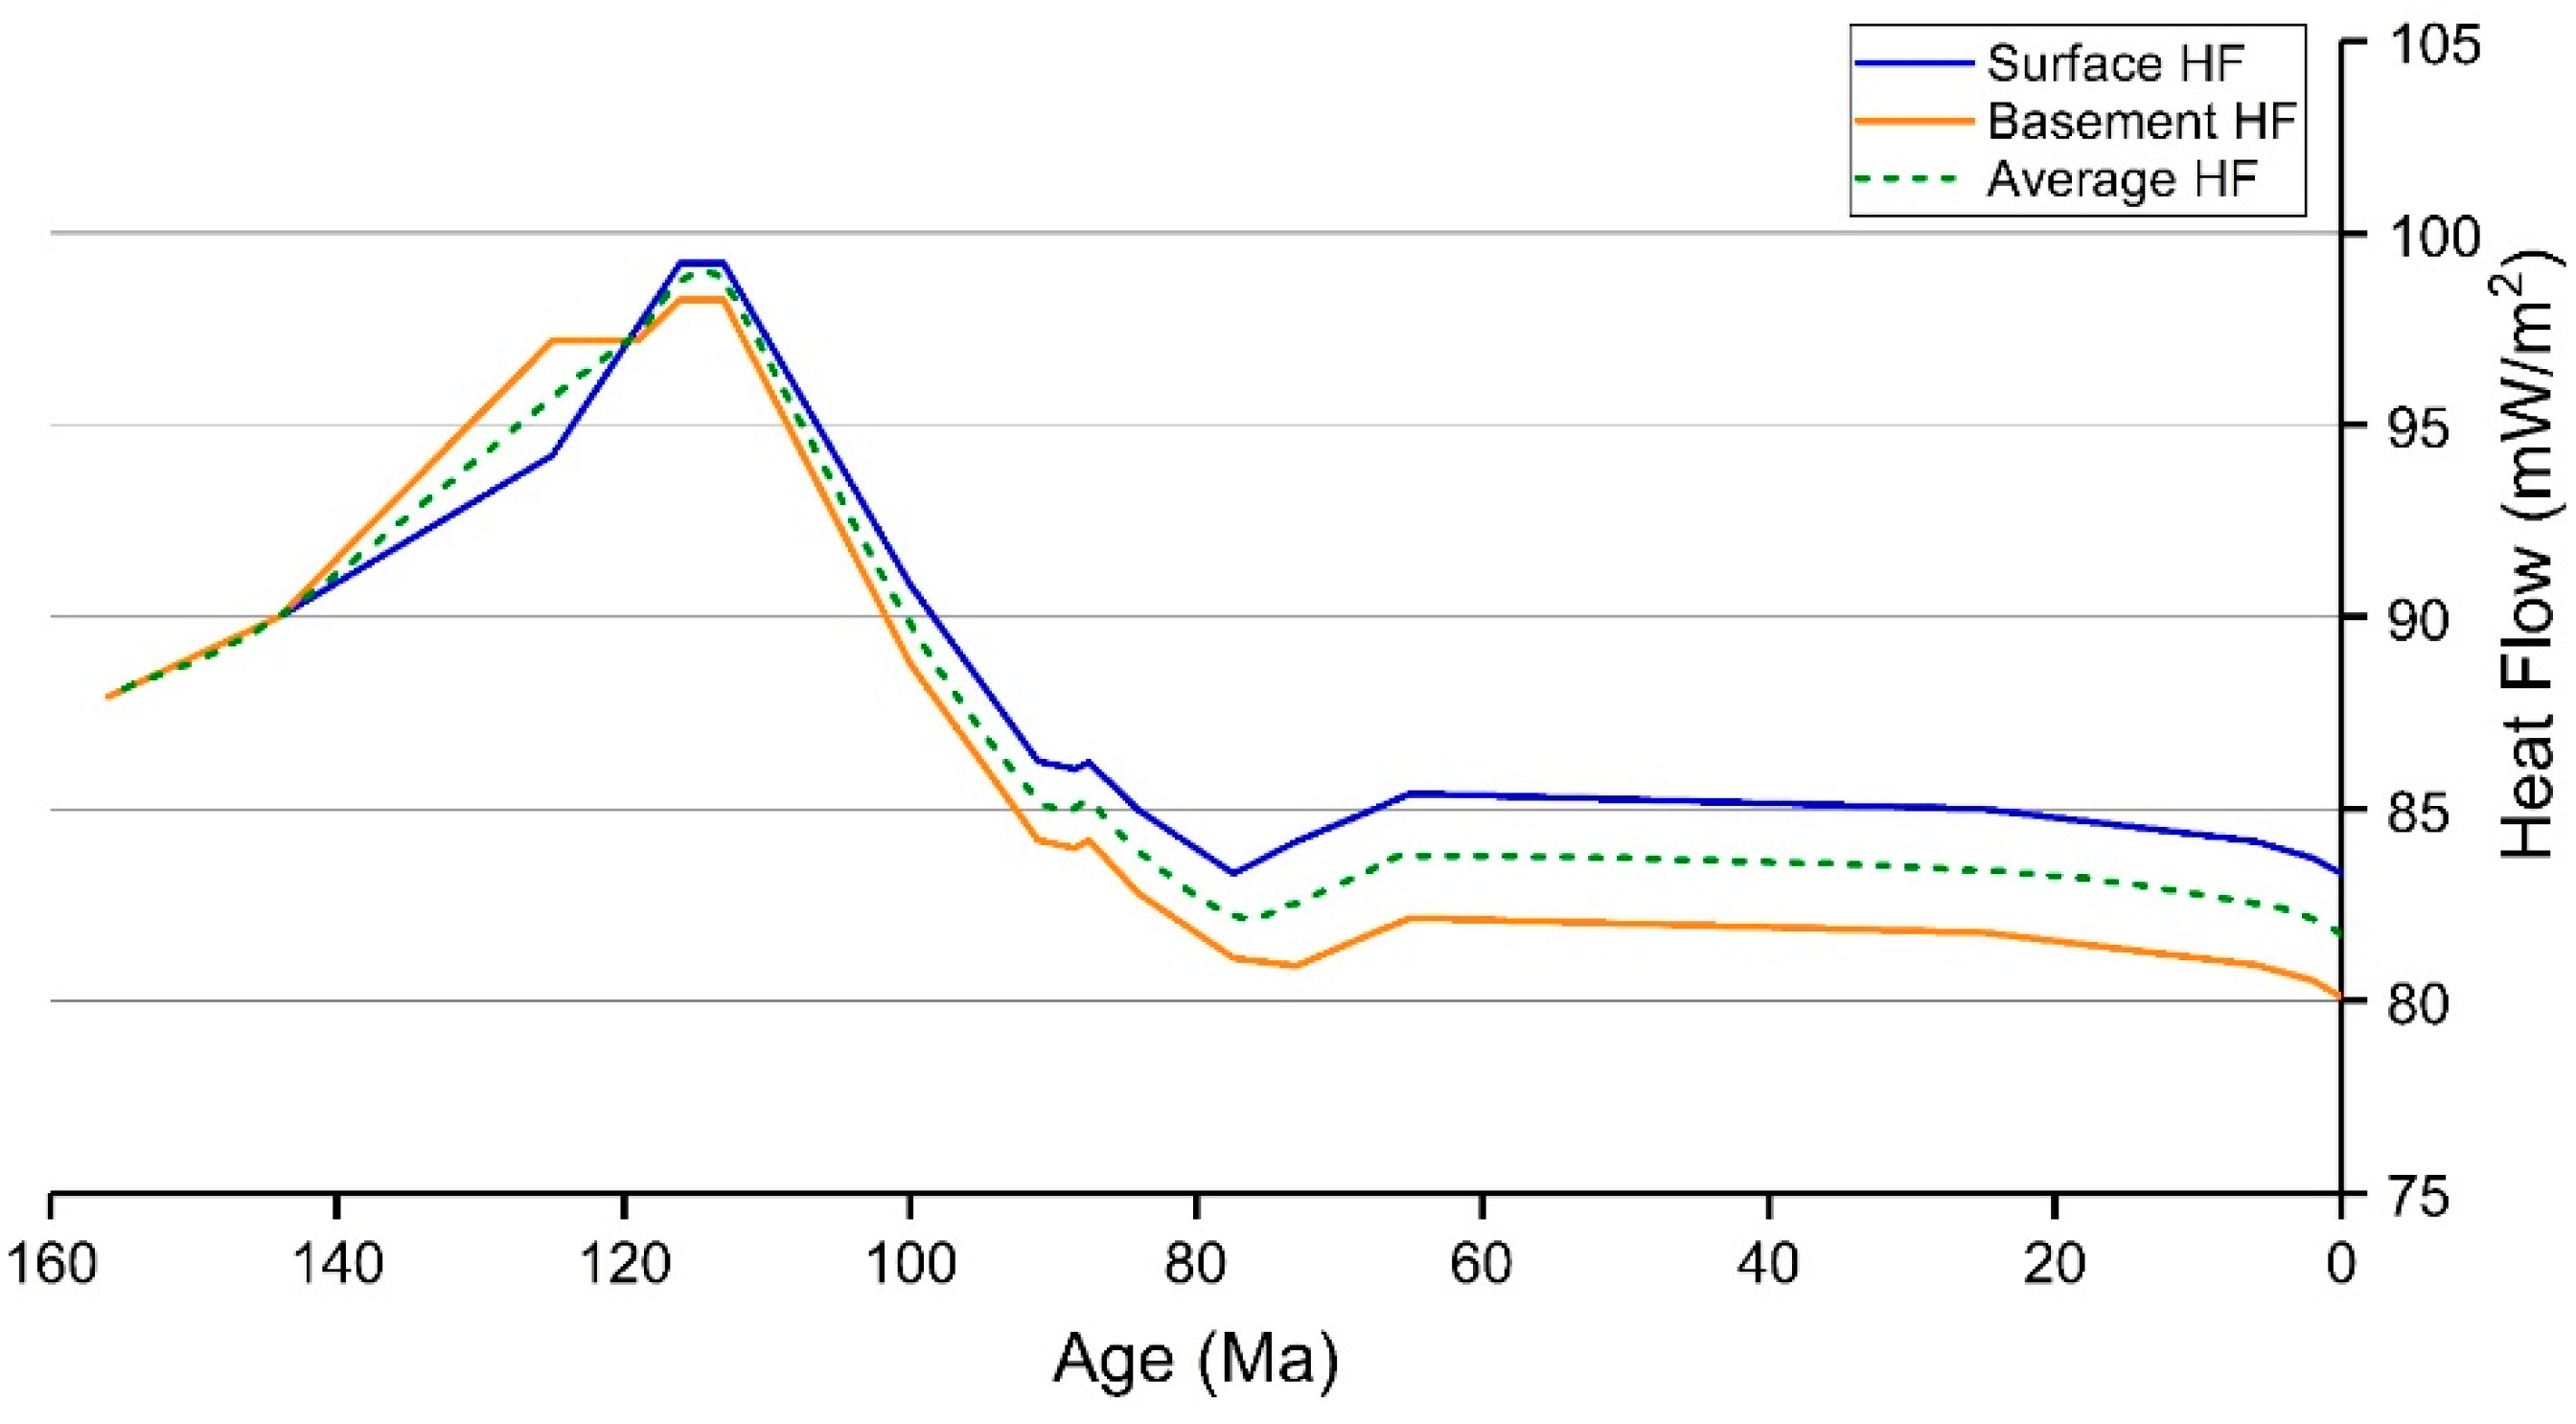
Figure 9.
Porosity versus depth curve (red curve) as calibrated by measured data (black dots). (a) Porosity calibration curve of K1d. (b) Calibration curve of K1y. (c) Calibration curve of K1sh.
Figure 9.
Porosity versus depth curve (red curve) as calibrated by measured data (black dots). (a) Porosity calibration curve of K1d. (b) Calibration curve of K1y. (c) Calibration curve of K1sh.

Figure 10.
Correlation between the porosity and permeability in K1d reservoir.
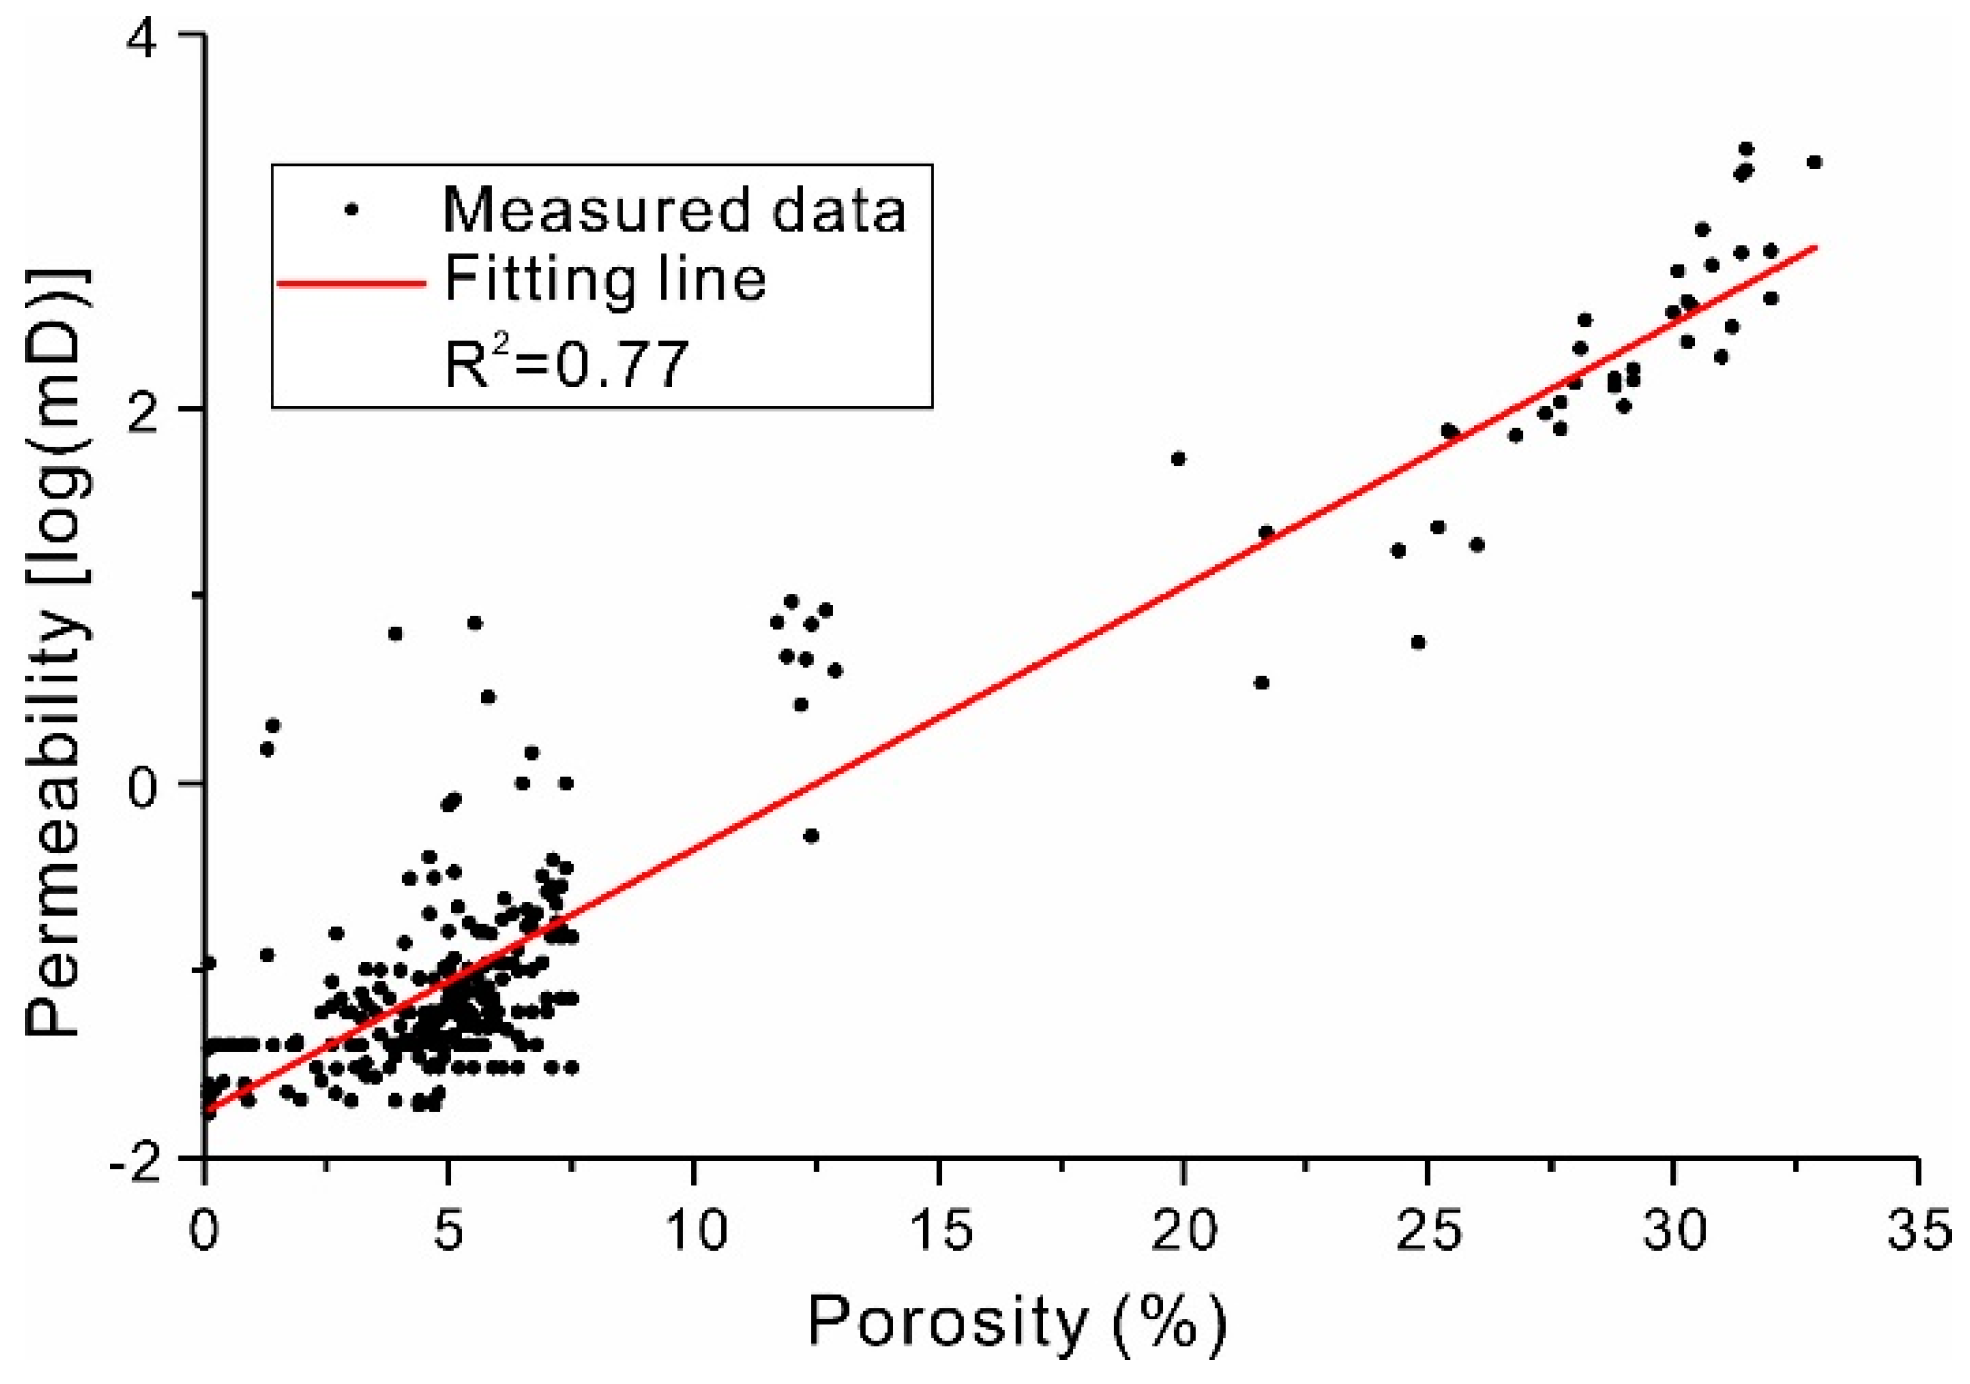
Figure 11.
Results of HF calibration (Well TS6). (a) Single well temperature simulation result using original HF (green curve) and the best-fit HF (black curve), calibrated by bore-hole temperatures (red crosses). (b) Single-well vitrinite reflectance (VR) simulation result using original HF and best-fit HF, calibrated by measured Ro (red crosses). (c) Optimized HF among the original HF, best-fit trend and calibrated trend after implementing the map-smoothing method.

Figure 12.
Heat-flow distribution definition. (a) Calibrated HF distribution map for the present day (0 Ma). (b) Calibrated HF distribution map for 112 Ma, after K1d deposition.
Figure 12.
Heat-flow distribution definition. (a) Calibrated HF distribution map for the present day (0 Ma). (b) Calibrated HF distribution map for 112 Ma, after K1d deposition.
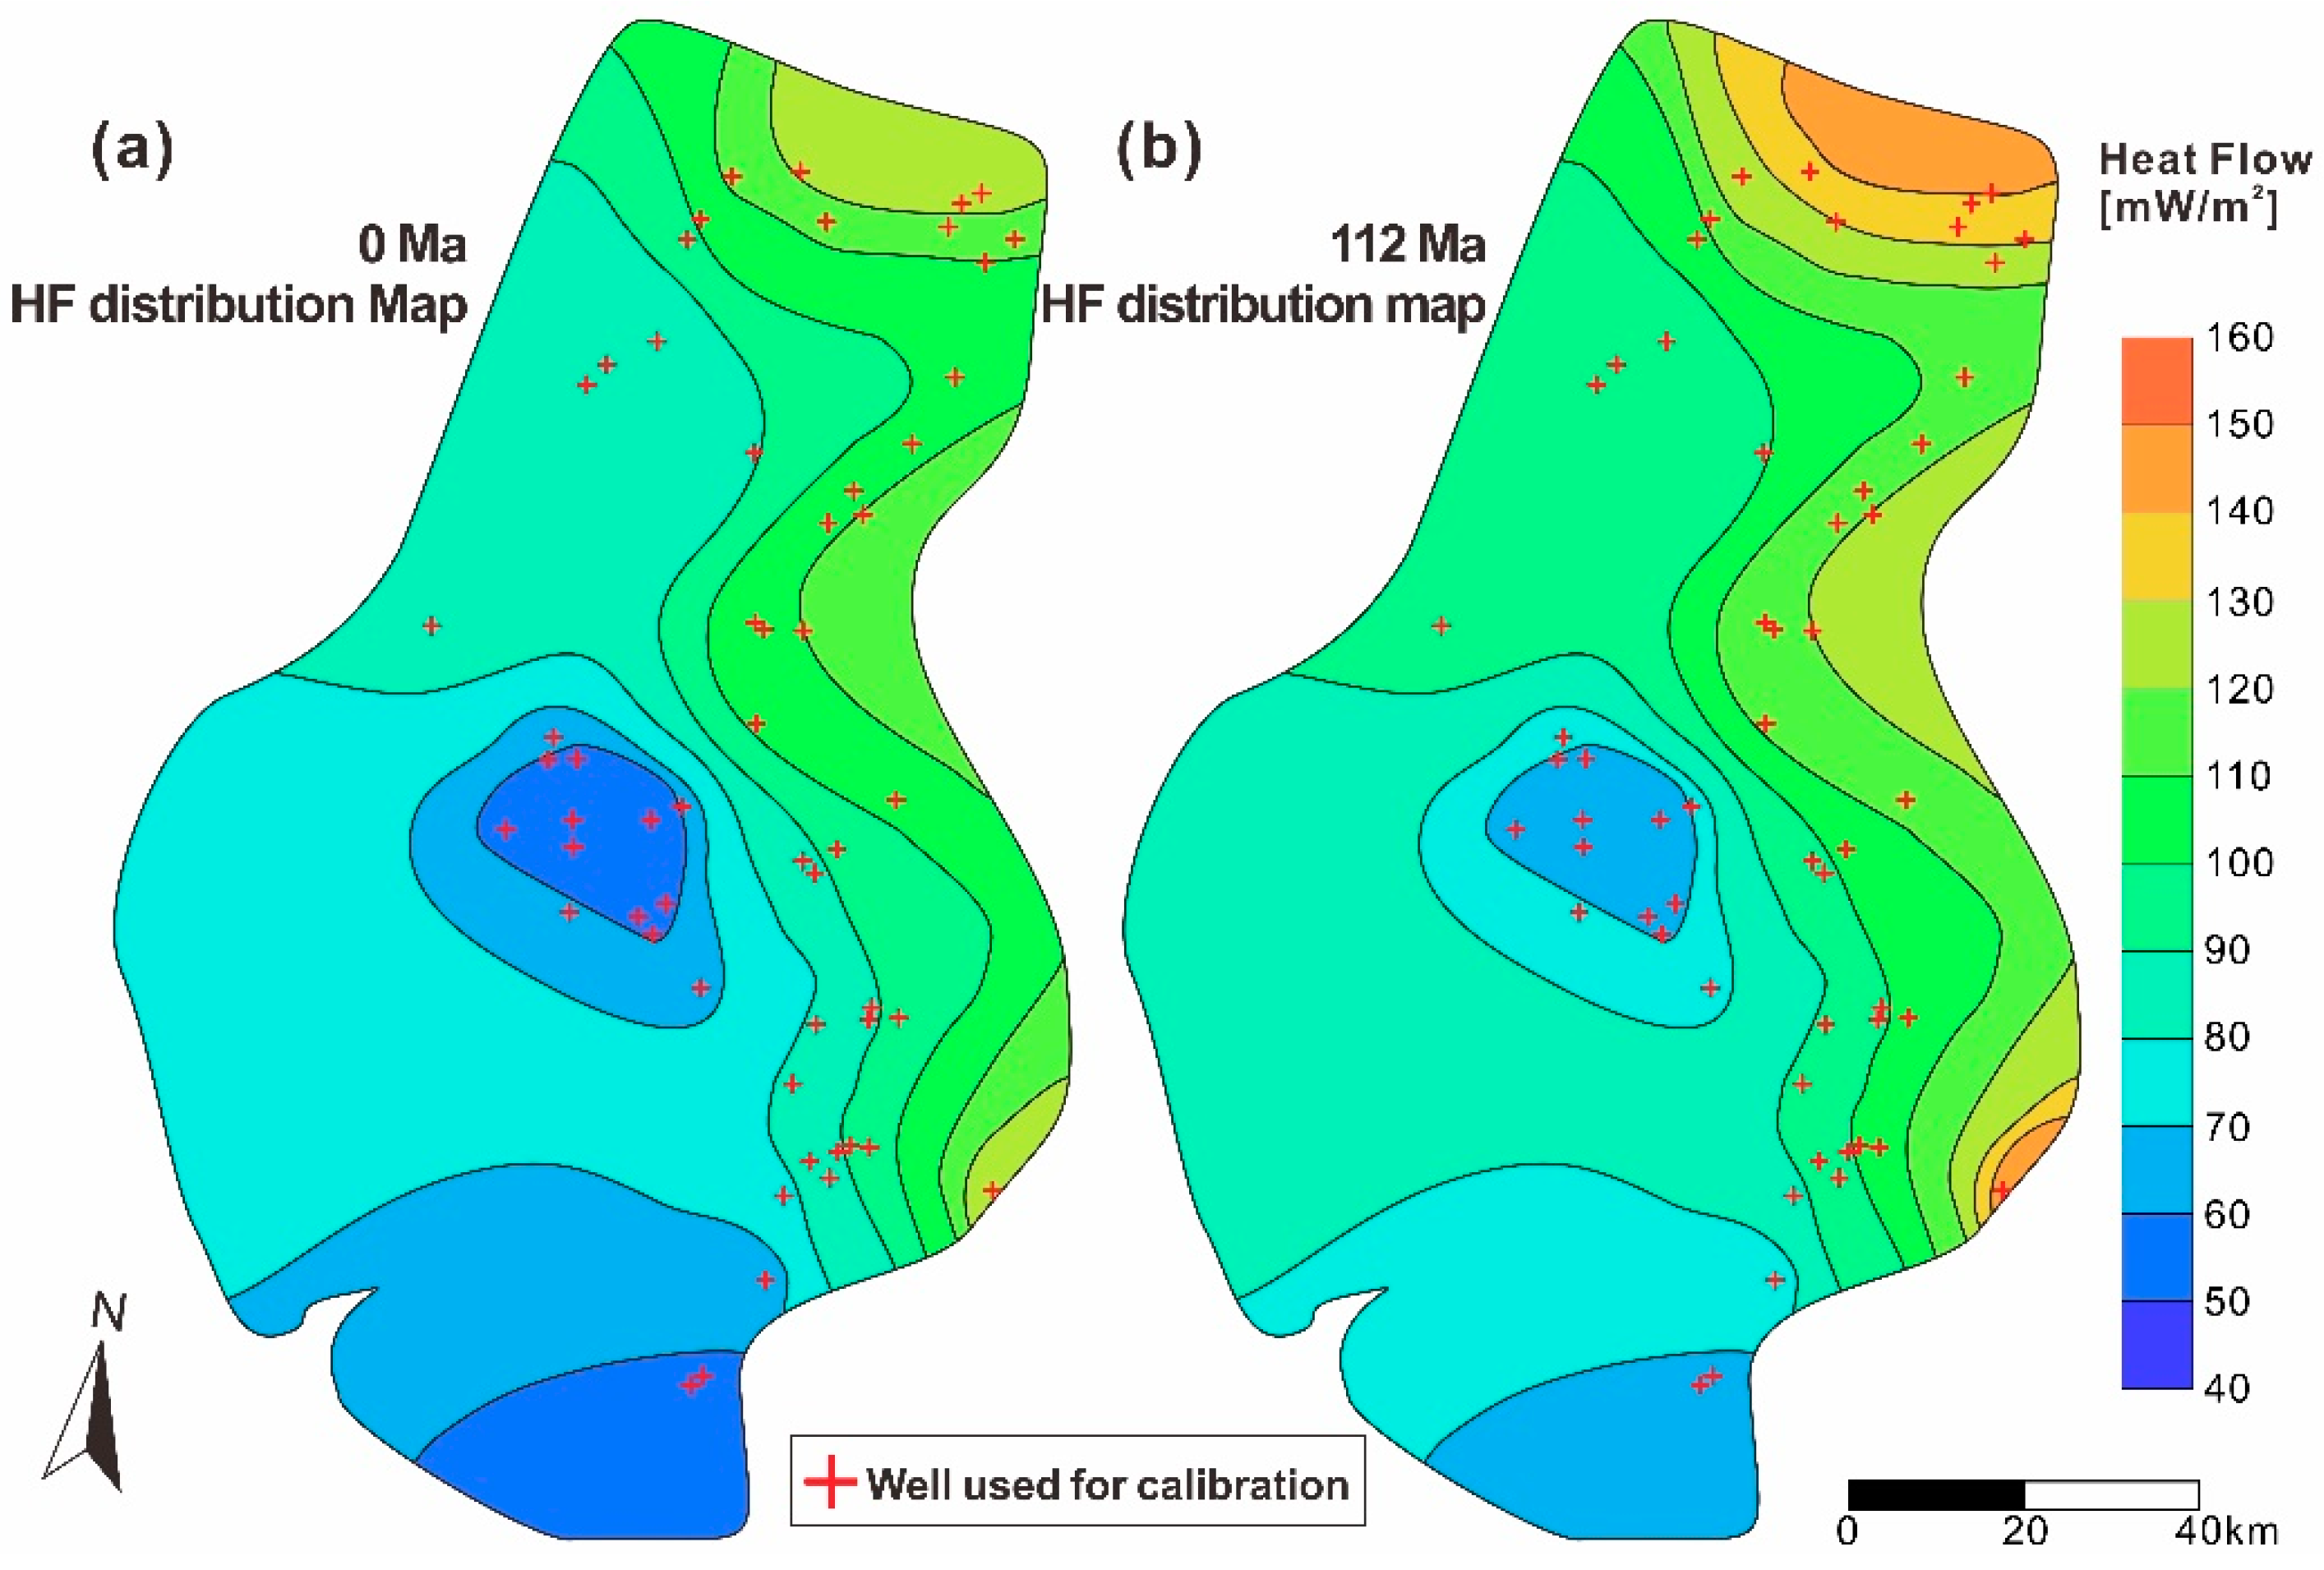
Figure 13.
Validation of the simulation results. The temperature and vitrinite-reflectance measurement data (red cross) and simulation results of wells CS1 (a,b) and SN301 (c,d) showed good fit.
Figure 13.
Validation of the simulation results. The temperature and vitrinite-reflectance measurement data (red cross) and simulation results of wells CS1 (a,b) and SN301 (c,d) showed good fit.

Figure 14.
Burial history, maturity evolution and hydrocarbon-generation mass of the main source rocks in the Changling Depression. (a) Burial history of the three main source rocks: Yingcheng (red), Shahezi (blue) and Huoshiling (green) Formations. (b) Evolution of the VR and TR throughout geological time (pseudo well location: X: 21568.264 km, Y: 4927.123 km). (c) Amount (in mass) of hydrocarbons that were generated from the three main source rocks over time (from the entire study area).
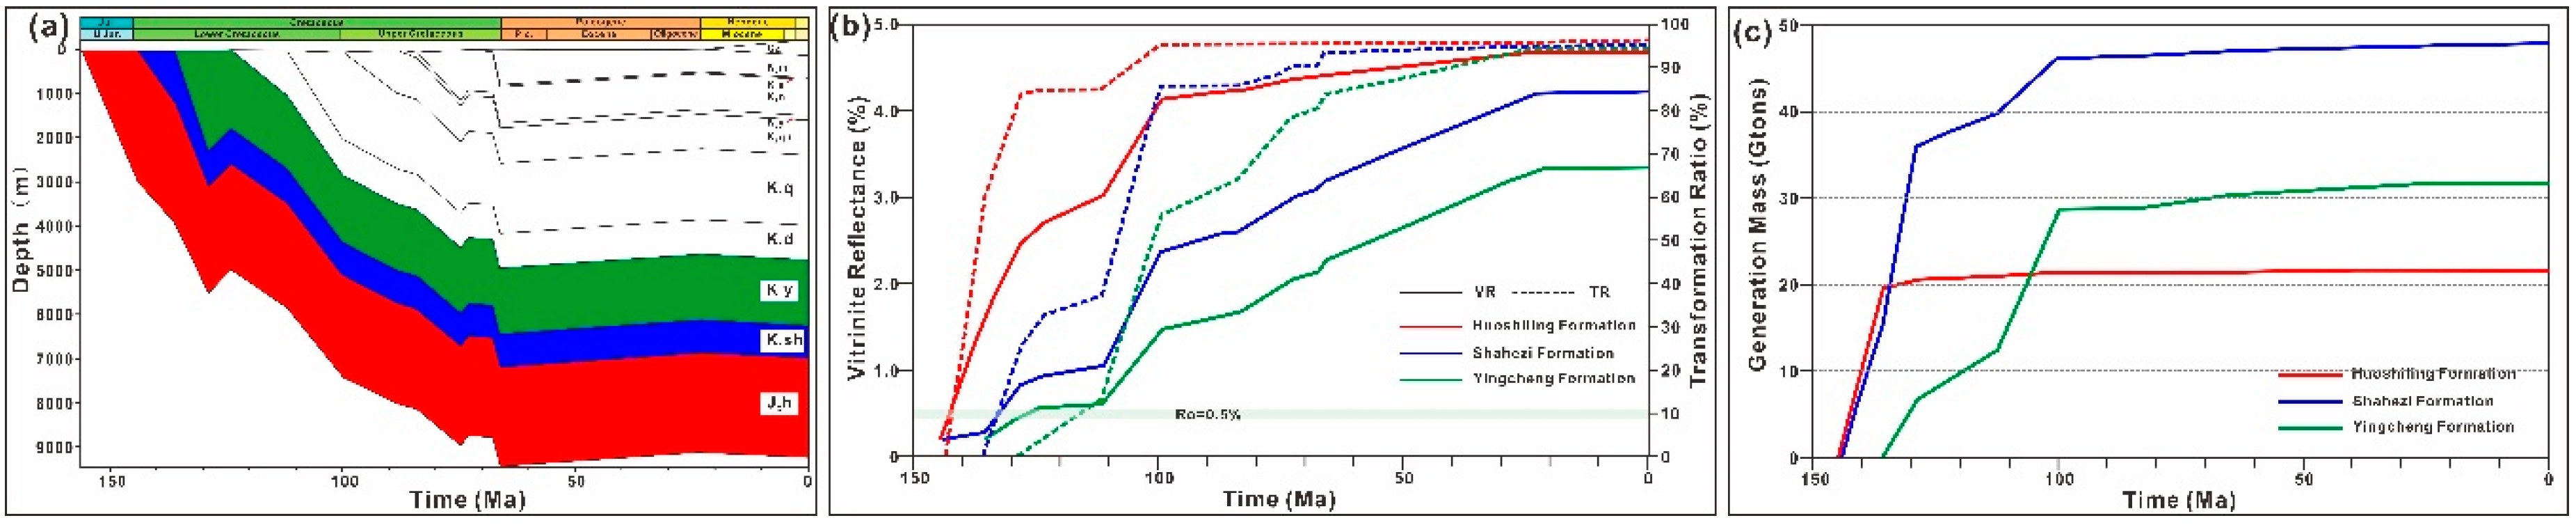
Figure 15.
Maturity distribution and hydrocarbon generation from the main source rocks in the Changling Depression. (a) Present day maturity maps for K1y. (b) Present day maturity maps for K1sh. (c) Present day maturity maps for J3h. (d) Generation mass of gas (red curve) and oil (green line) from K1y. (e) Generation mass from K1sh. (f) Generation mass from J3h.

Figure 16.
Current hydrocarbon-migration paths and accumulation zones in K1d.

Figure 17.
Migration and accumulation units of the Changling Depression: 1. central uplift zone, 2. southern fault sag zone, 3. western slope zone, 4. northeastern slope zone.
Figure 17.
Migration and accumulation units of the Changling Depression: 1. central uplift zone, 2. southern fault sag zone, 3. western slope zone, 4. northeastern slope zone.
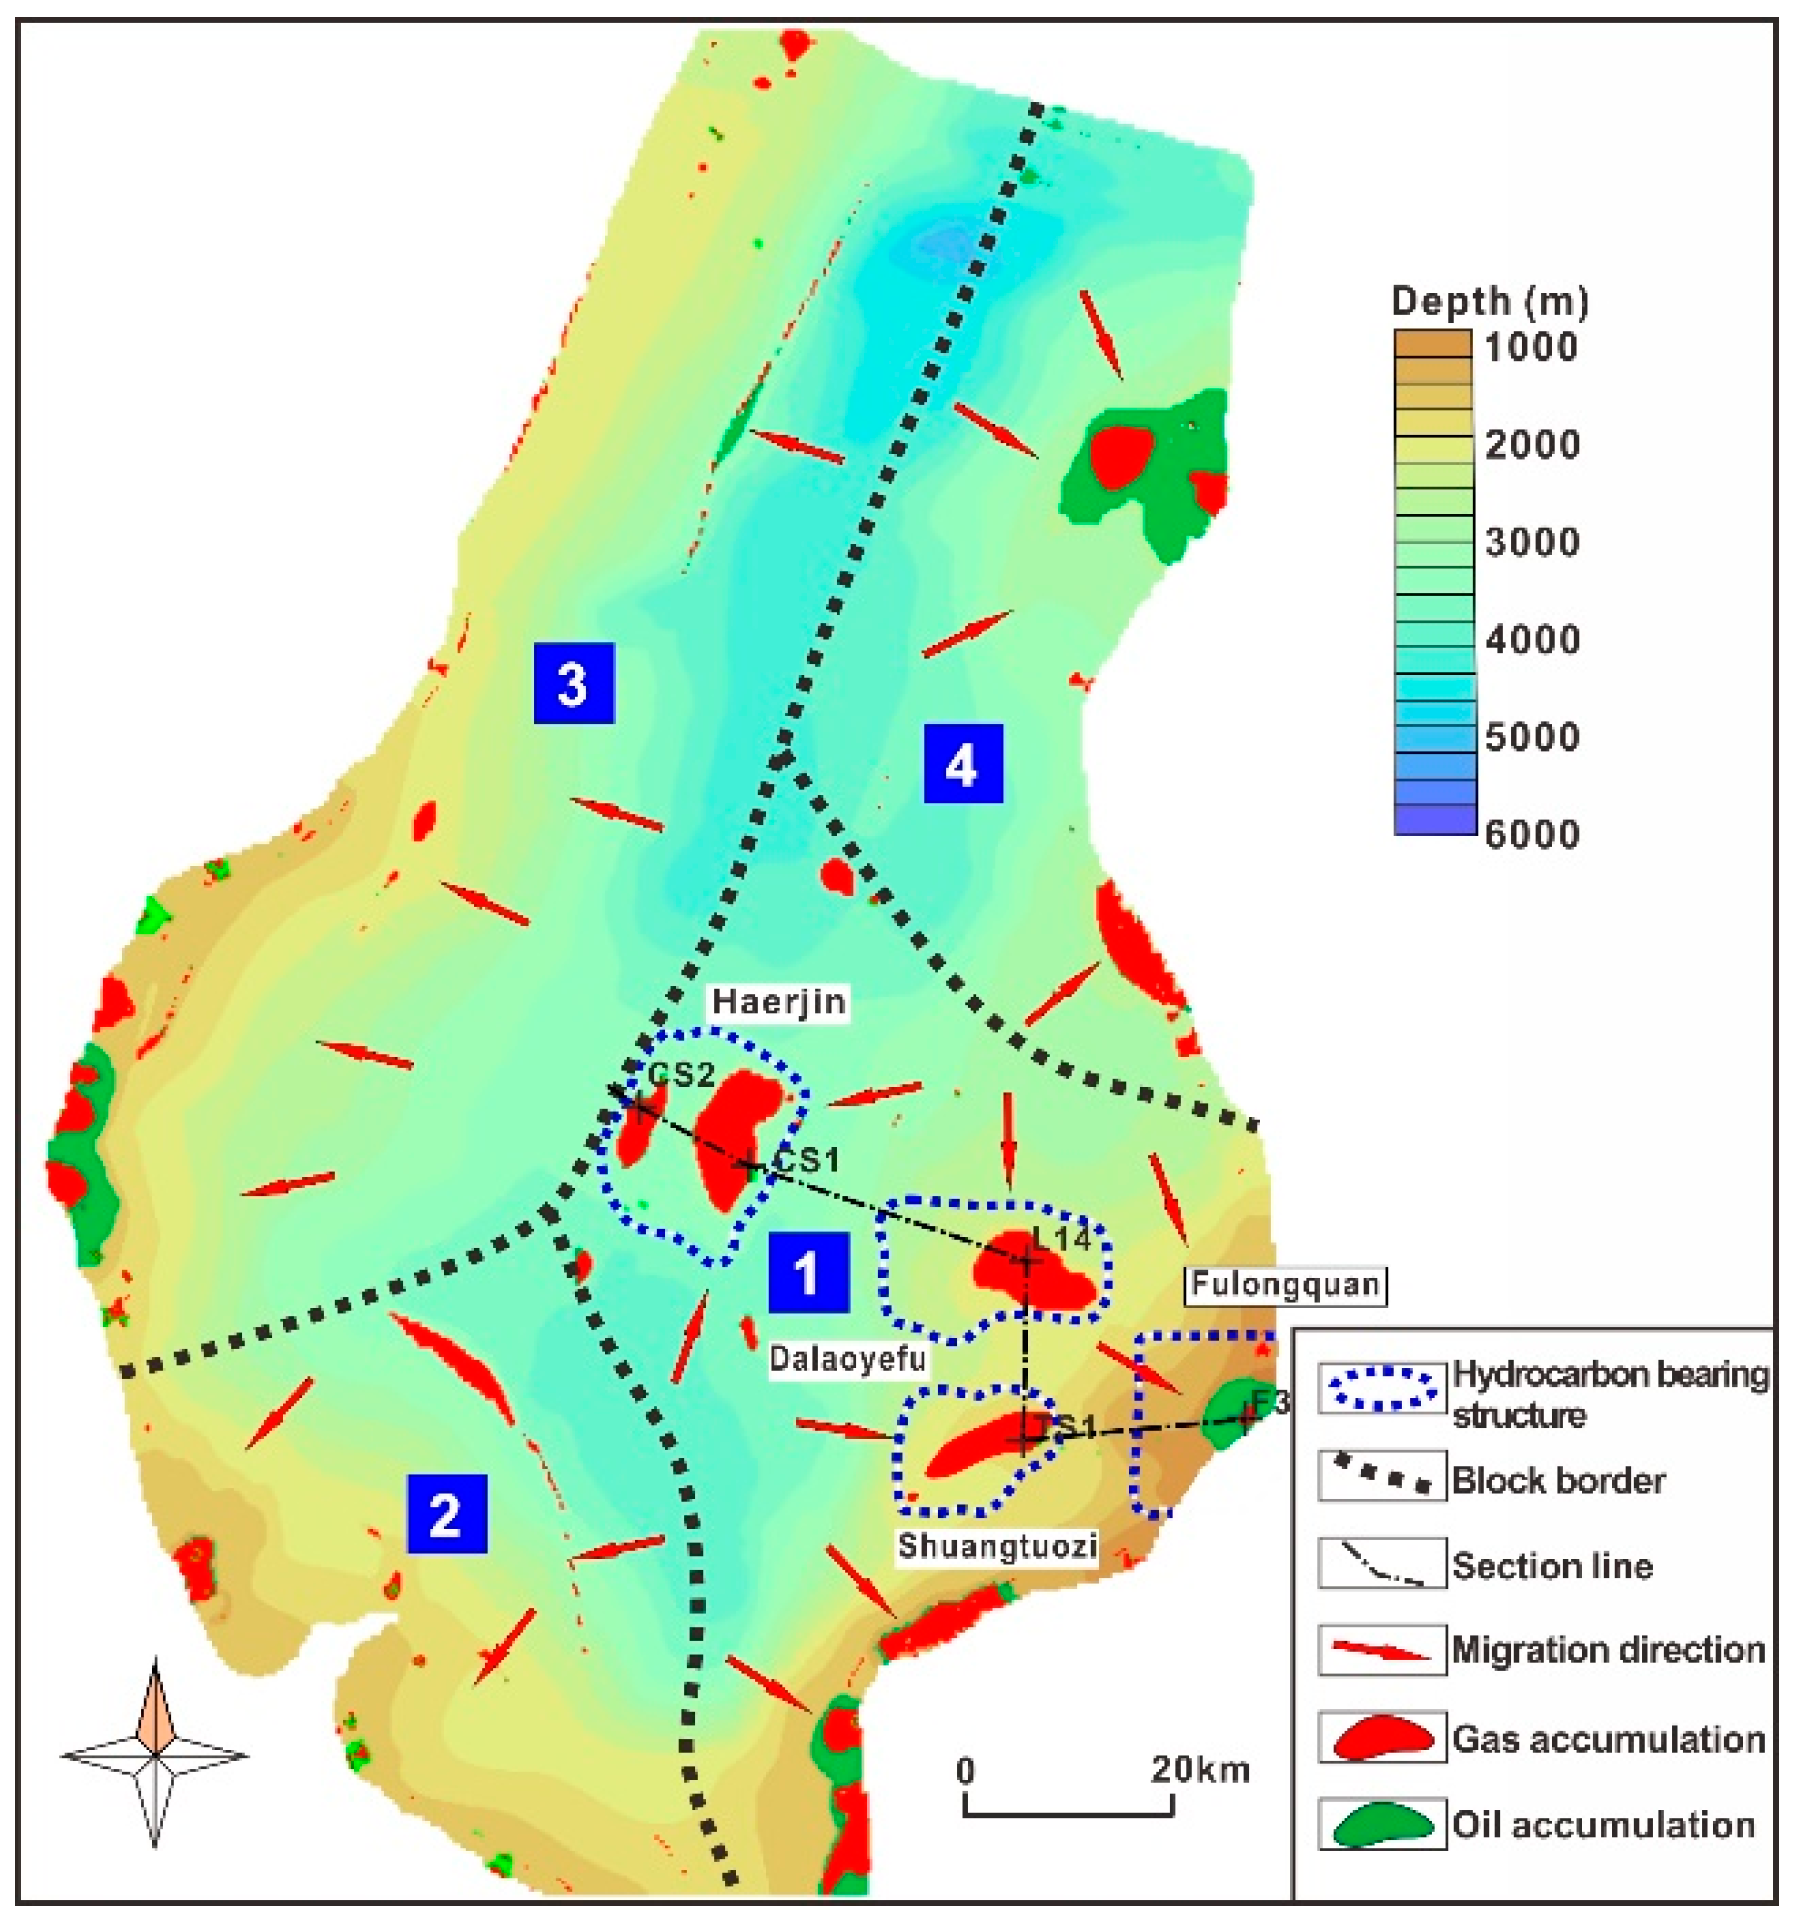
Figure 18.
Petroleum-charging moment analysis for four key wells that represent the gas fields: Well CS1 (A), Well TS1 (B), Well L4 (C) and Well F3 (D). (a) Hydrocarbon-charging period according to the homogenization temperatures of fluid inclusions and the burial history curve. (b) Histogram of the homogenization temperatures of the fluid inclusions from Meng, 2009 [95]. (c) Petroleum saturation and formation-temperature trend of K1d, which were used to distinguish the charging event.
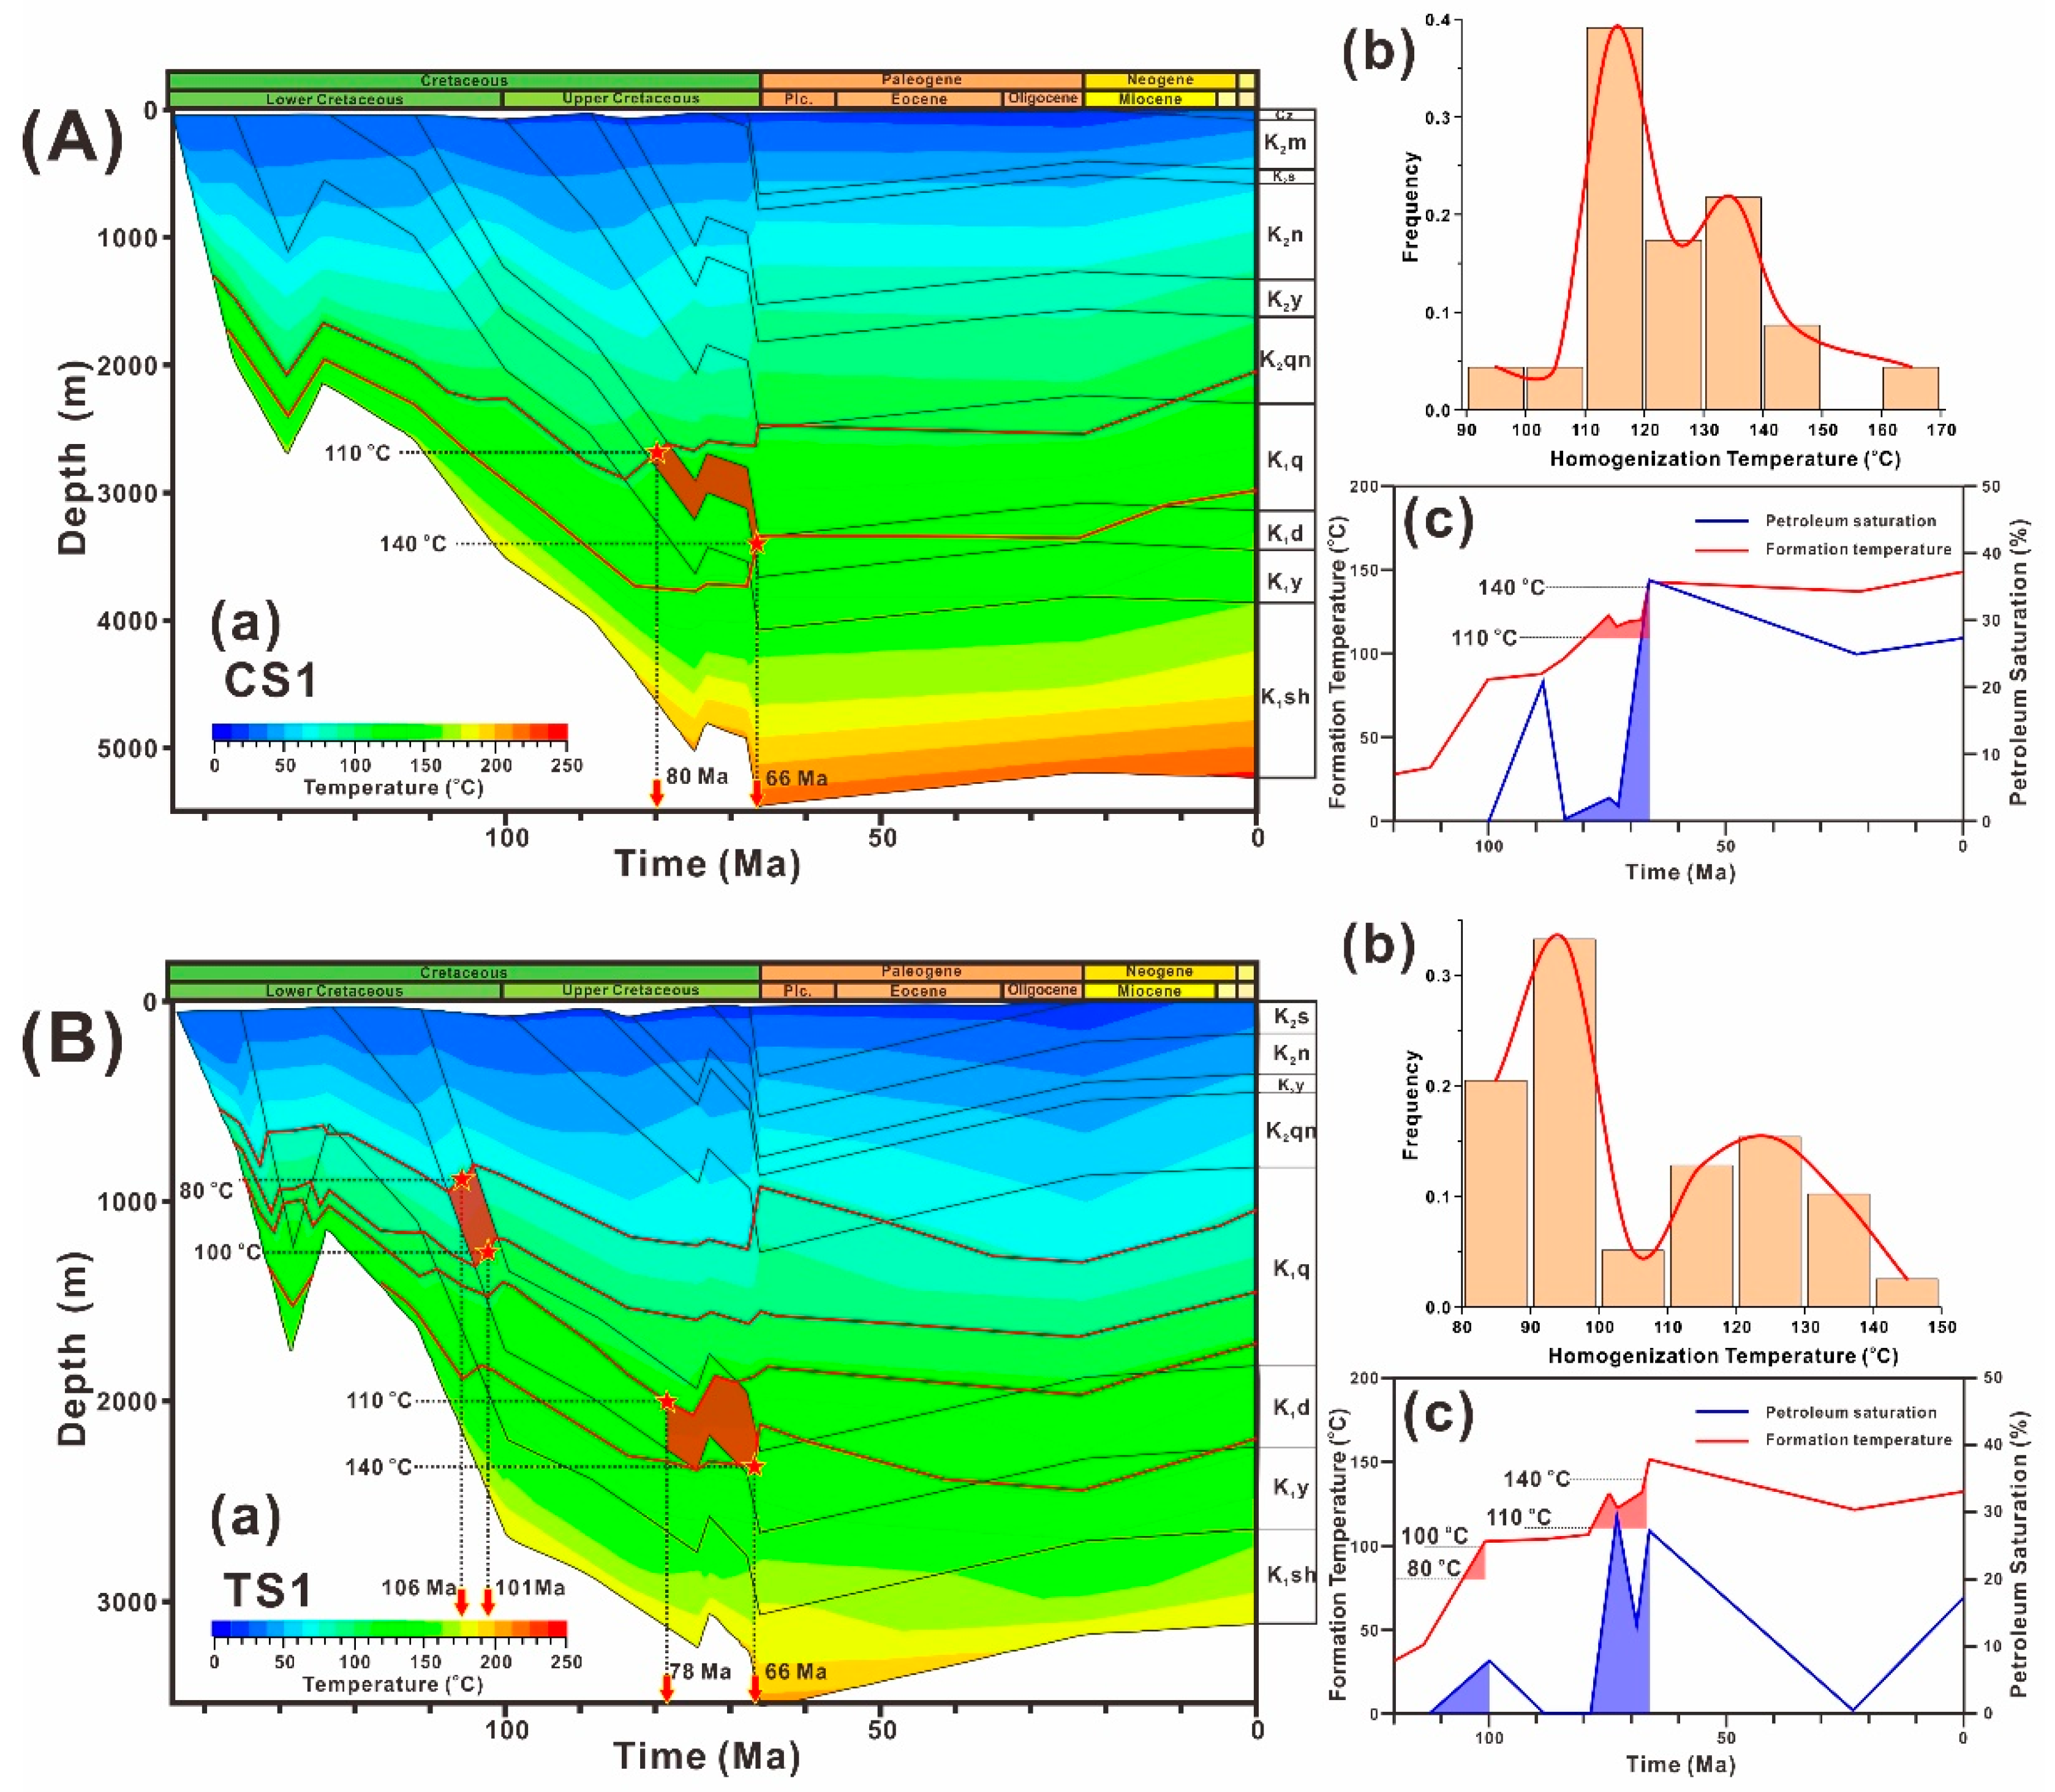

Figure 19.
The cross section through wells, which shows the generalized hydrocarbon migration and accumulation model in K1d in the Changling Depression (section location shown in Figure 17).
Figure 19.
The cross section through wells, which shows the generalized hydrocarbon migration and accumulation model in K1d in the Changling Depression (section location shown in Figure 17).

Table 1.
Facies settings for PetroMod® software, including ages, formations, PSE, lithology settings with thermal parameters and mechanical properties. The Athy’s factors are discussed in Section 3.1.7.
Table 1.
Facies settings for PetroMod® software, including ages, formations, PSE, lithology settings with thermal parameters and mechanical properties. The Athy’s factors are discussed in Section 3.1.7.
| Age | Formation | PSE | Lithology | Thermal Conductivity (W/m/K) | Radiogenic Heat | Heat Capacity (kcal/kg/K) | Mechanical properties | Athy’s Factor | |||||
|---|---|---|---|---|---|---|---|---|---|---|---|---|---|
| (Ma) | At 20 °C | At 100 °C | Uranium (ppm) | Thorium (ppm) | Potassium (%) | At 20 °C | At 100 °C | Density (kg/m3) | Initial Porosity (%) | k | |||
| 23.03–0 | Cenozoic | OR | Siltstone | 2.05 | 1.99 | 2.00 | 5.00 | 1.00 | 0.22 | 0.25 | 2720 | 55 | 0.51 |
| 66.2–23.03 | Erosion | ||||||||||||
| 67.7–66.2 | Mingshui Fm. | OR | Siltstone | 2.05 | 1.99 | 2.00 | 5.00 | 1.00 | 0.22 | 0.25 | 2720 | 55 | 0.51 |
| 73–67.7 | Sifangtai Fm. | OR | Sandstone | 3.35 | 2.95 | 1.50 | 5.10 | 3.60 | 0.21 | 0.24 | 2760 | 40 | 0.32 |
| 74.6–73 | Erosion | ||||||||||||
| 84–74.6 | Nenjiang Fm. | OR | Siltstone | 2.01 | 1.96 | 2.00 | 5.00 | 1.00 | 0.21 | 0.26 | 2710 | 43 | 1.06 |
| 88.5–84 | Yaojia Fm. | OR | Sandstone | 3.35 | 2.95 | 1.50 | 5.10 | 3.60 | 0.21 | 0.24 | 2760 | 40 | 0.66 |
| 100–88.5 | Qingshankou Fm. | OR | Sandstone | 3.95 | 3.38 | 1.30 | 3.50 | 1.30 | 0.20 | 0.24 | 2720 | 35 | 0.65 |
| 112–100 | Quantou Fm. | RR | Sandstone | 3.95 | 3.38 | 1.30 | 3.50 | 1.30 | 0.20 | 0.24 | 2720 | 38 | 0.99 |
| Seal | Shale | 1.64 | 1.69 | 3.70 | 12.00 | 2.70 | 0.21 | 0.24 | 2700 | 70 | 0.83 | ||
| 124–112 | Denglouku Fm. | RR | Sandstone | 3.95 | 3.38 | 1.30 | 3.50 | 1.30 | 0.20 | 0.24 | 2593 | 39 | 0.96 |
| 128.8–124 | Erosion | ||||||||||||
| 136–128.8 | Yingcheng Fm. | SR | Shale | 1.64 | 1.69 | 3.70 | 12.00 | 2.70 | 0.21 | 0.24 | 2700 | 70 | 0.83 |
| RR | Sandstone | 3.95 | 3.38 | 1.30 | 3.50 | 1.30 | 0.20 | 0.24 | 2537 | 41 | 0.88 | ||
| - | Igneous rock mixture | 2.61 | 2.40 | 3.12 | 6.76 | 3.68 | 0.20 | 0.23 | 2637 | 50 | 0.29 | ||
| 144–136 | Shahezi Fm. | SR | Siltstone | 2.00 | 1.96 | 2.50 | 6.50 | 2.00 | 0.22 | 0.26 | 2600 | 40 | 0.82 |
| SR | Coal | 1.60 | 1.66 | 2.00 | 3.00 | 0.70 | 0.26 | 0.30 | 1600 | 68 | 0.4 | ||
| 156–144 | Huoshiling Fm. | SR | Siltstone | 2.01 | 1.96 | 2.00 | 5.00 | 1.00 | 0.23 | 0.26 | 2710 | 55 | 0.51 |
| UR | Conglomerate | 2.30 | 2.18 | 1.50 | 4.00 | 2.00 | 0.20 | 0.23 | 2700 | 30 | 0.3 | ||
Table 2.
Erosion thicknesses of individual wells in the Changling Depression (unit: m).
| Time | CS1 | CS107 | LS1 | TS5 | CS8 | CS12 | TS6 | F10 |
|---|---|---|---|---|---|---|---|---|
| End of Yingcheng Fm. | 420 | 390 | 450 | 425 | 373 | 348 | 460 | 410 |
| End of Nenjiang Fm. | 200 | 210 | 205 | 185 | 185 | 249 | 205 | / |
| End of Mingshui Fm. | 230 | 250 | 370 | 285 | 250 | 330 | 370 | 520 |
Table 3.
Parameters that were used in Athy’s law to calibrate the porosity versus depth curve.
| Formation | Initial Porosity (%) | Rock Density (kg/m3) | Min porosity (%) | Factor k (1/km) |
|---|---|---|---|---|
| Denglouku | 39 | 2593 | 0.3 | 0.96 |
| Yingcheng | 41 | 2537 | 0.3 | 0.88 |
| Shahezi | 40 | 2600 | 0.3 | 0.82 |
© 2019 by the authors. Licensee MDPI, Basel, Switzerland. This article is an open access article distributed under the terms and conditions of the Creative Commons Attribution (CC BY) license (http://creativecommons.org/licenses/by/4.0/).
Share and Cite
MDPI and ACS Style
Zhang, J.; Guo, J.; Li, Y.; Sun, Z. 3D-Basin Modeling of the Changling Depression, NE China: Exploring Petroleum Evolution in Deep Tight Sandstone Reservoirs. Energies 2019, 12, 1043. https://doi.org/10.3390/en12061043
AMA Style
Zhang J, Guo J, Li Y, Sun Z. 3D-Basin Modeling of the Changling Depression, NE China: Exploring Petroleum Evolution in Deep Tight Sandstone Reservoirs. Energies. 2019; 12(6):1043. https://doi.org/10.3390/en12061043
Chicago/Turabian StyleZhang, Jinliang, Jiaqi Guo, Yang Li, and Zhongqiang Sun. 2019. "3D-Basin Modeling of the Changling Depression, NE China: Exploring Petroleum Evolution in Deep Tight Sandstone Reservoirs" Energies 12, no. 6: 1043. https://doi.org/10.3390/en12061043
Note that from the first issue of 2016, this journal uses article numbers instead of page numbers. See further details here.