Article

Environmental Impact Assessment of Transportation Infrastructure in the Life Cycle: Case Study of a Fast Track Transportation Project in China

1
School of Civil Engineering, Chang’an University, Xi’an 710061, China
2
School of Economics and Management, Chang’an University, Xi’an 710061, China
3
Quantity Surveying, Federal University of Technology, Akure PMB 704, Nigeria
4
Department of Building and Real Estate, The Hong Kong Polytechnic University, 181 Chatham Rd. South, Hung Hom, Kowloon, Hong Kong
5
School of Civil Engineering and Built Environment, Queensland University of Technology (QUT), Gardens Point, Brisbane Q4001, Australia
*
Author to whom correspondence should be addressed.
Energies 2019, 12(6), 1015; https://doi.org/10.3390/en12061015
Submission received: 18 January 2019 / Revised: 11 March 2019 / Accepted: 12 March 2019 / Published: 15 March 2019

Abstract

:
The transportation sector generates enormous amount of environmental emission. This study aims to assess the environmental impact of the environmental emissions in a transportation infrastructure project life cycle. Using the fast track transportation project in China as a case study, the materials used and the energy consumed over the life cycle were converted into environmental emissions. The life cycle of fast track transportation project was divided into three phases including construction, maintenance and repair, and demolition phases. Both qualitative and quantitative method were applied to explore the environmental impact of transportation project. The life cycle assessment (LCA) method was used for the development environmental impact assessment (EIA) model to analyze the contribution of each process in the transportation project life cycle. The empirical results show that the construction phase has the highest environmental impact (62.7%) in the fast track transportation project life cycle, followed by the demolition (35.8%) and maintenance phases (1.7%). Among the materials used in the fast track transportation project, steel has the highest proportion of environmental impact in the construction phase (55.5%). This indicates the enormous environmental impact of the construction phase in fast track transportation project life cycle results from the use of steel material. This study contributes to reducing environmental emissions by revealing the greatest phase of environmental impact and material-source of environmental impact over the life cycle in a transportation infrastructure project.

1. Introduction

Investment in transportation infrastructure has increased drastically in many countries in recent years. For instance, the Indian government has embarked on an ambitious transportation infrastructure development program, and consequently, the total length of India’s national highway network nearly doubled between 2000 and 2015 [1]. In China, investment in transportation infrastructure is a long-term development strategy of the government and the transportation infrastructure is continuously expanding [2]. At the end of 2017, the total mileage of China’s highways was 4,773,500 km and the railway mileage was 127,000 km. At the same time, the number of highway bridges reached 805,300 and the total length of high-speed railway bridges exceeded 10,000 km [3].
However, extensive statistics and studies have demonstrated that the transportation sector is one of the main sources of environmental emissions [4,5]. The Fifth Assessment Report (AR5) of the Intergovernmental Panel on Climate Change (IPCC) revealed that 11% of environmental emissions comes from the transportation sector [6]. In 2015, the transportation sector accounted for 28% of the total environmental emissions in Malaysia [7], while 27% in the United States [8] and 15.6% in China [9]. The rapid expansion of the transportation infrastructure has accelerated the environmental emissions in China. Between 2012 and 2022, the environmental emissions in China is expected to increase at an average rate of 17.46% annually [10].
Due to the enormous environmental emissions resulting from the activities in the transportation sector, some attempts have been made to reduce the problem, such as developing railways, improving traffic management, promoting intelligent transportation systems, and strengthening parking management [11]. However, these measures have not yielded the desired effects [11]. Elsewhere, other measures at stemming environmental emissions in the transportation sector focused only on the construction phase in the transportation infrastructure [12,13,14]. These include the establishment of transportation infrastructure network design problem in the construction phase for carbon emissions reduction [13] and developing a holistic approach for estimating carbon emissions in the construction phase of transportation infrastructure [14].
However, there are only few attempts to evaluate the environmental emissions over the life cycle of large-scale transportation infrastructure [15]. Especially, there is lack of life cycle assessment model for evaluating the environmental emissions and the consequent impact on transportation infrastructure [16]. To appropriately mitigate environmental impacts from transportation infrastructure, it is necessary for decision makers to consider the life-cycle energy use and emissions [17]. Therefore, there is a need for the life cycle assessment of the environmental emissions in transportation infrastructure to help understanding how to reduce long-term environmental emissions and promote the development of environmental friendly transportation infrastructure.
In order to response this problem, the present study aims improving the knowledge on the field of transportation infrastructure life cycle assessment by developing an environmental impact assessment (EIA) model for transportation infrastructure over the life cycle. Using the fast track transportation project in China as a case study, the development of EIA model provides an environmental impact assessment process that can be applied to environmental emissions analysis in transportation infrastructure projects. The proposed model will be able to convert the materials and energy resources into environmental emissions data over the life cycle of the transportation infrastructure project. The suggestions for the mitigation of environmental emissions from transportation infrastructure projects are provided. This study contributes to addressing the problem of enormous environmental emissions in the transportation sector and filling the gap in literature which has so far not adequately addressed the life cycle impact of environmental emissions in transportation infrastructure.

2. Literature Review

2.1. Environmental Impact Assessment (EIA) of Transportation Infrastructure

The transportation sector has a very strong potential for environmental emissions reduction and sustainable urban development [18,19,20]. Ren et al. [18] found that changes in urban transportation structure have a large impact on urban environmental emissions. Sustainable transportation will support more effectively low carbon development strategies to promote sustainable urban development [19]. Since the 1990s, there has been increasing research focusing on the EIA of transportation infrastructure projects, especially in Europe and the USA. For example, Hammervold et al. [21] compared EIA of three bridges over the life cycle in Norway, and found that the global warming, abiotic depletion, and acidification are the most important environmental issues affecting environmental degradation. In addition, O’Born [22] conducted a comparative EIA between the wooden bridge and the concrete bridge, and revealed that the environmental emissions of the wooden bridge were significantly lower than those of concrete bridges.
Furthermore, other studies focused on the carbon emissions of transportation infrastructure such as bridges, roads, and railways [23,24,25,26,27]. For example, Liu et al. [26] used 20 asphalt and 18 concrete road projects to evaluate the carbon emission over the life cycle. In order to reduce carbon emissions during road construction, Wang et al. [27] compared the total emissions in different types of transportation projects such as roadbeds, roads, bridges, and tunnels. The study found that the carbon emissions from bridges and tunnel structures are higher than those of roadbeds and pavements. Furthermore, Sun et al. [28] established a carbon footprint model, which fused environmental impact and economic costs together for the calculation of the life cycle carbon footprint of Wuhan Nanhu Bridge. The model calculates the carbon footprint of different sources such as energy and resource consumption, materials, transportation, buildings, and facilities. Therefore, it is a reference model for the management of environmental impact of bridges.
Meanwhile, the existing research focuses on carbon emissions in the construction of transportation infrastructure. Thus, there is lack of research on environmental emissions over the life cycle of transportation infrastructure projects [29]. To ensure that the problem of environmental emissions in the transportation sector is adequately addressed, there is a need for more research on the environmental emissions in transportation infrastructure projects [30].

2.2. Application of LCA Method in Environmental Impact Assessment

Commonly, LCA is also a versatile method for quantifying the effect of resource and process selection decisions. This method has been used for the environmental impacts assessment in different kinds of roads and bridges projects [31]. For example, Itoya et al. [32] developed a project-centric tool based on a robust LCA approach to assess carbon emissions and emissions reductions in highway projects. Dos Santos et al. [33] developed a standardized framework for the LCA in road pavements, which enables the road pavement LCA to be adapted to various tools and follow the international standards. Peñaloza et al. [34] used a small highway bridge in Sweden as a test model to assess the effects of concrete carbonation and bio-carbon storage through the dynamic LCA assessment of road bridges. Their study revealed that the climate impact of the bridge is influenced by both phenomena, and the gap between the impacts from both designs increases if the phenomena are accounted for. In addition, Manzo and Salling [35] and Manzo et al. [36] combined LCA approach with standard transport cost-benefit analysis as a tool for transportation infrastructure environmental assessment, which makes it possible to include the life cycle impacts on human health, ecosystem and natural resource depletion in the project assessment.
In addition to LCA, some mixed methods have been used for evaluating environmental emissions. For instance, Xie et al. [37]’s genetic algorithm can optimize minimum environmental impacts in bridge project over the life cycle. The Coston et al. [38]’s EIA quantification method, which is based on the ecosystem approach, can be employed to address societal demands to link socio-economic and ecological processes (e.g., population dynamics). Ali et al. [39]’s study used an energy-based calculation program to evaluate the environmental impacts of different waste disposal scenarios. The program was based on an input-output table of energy values and environmental emissions.
However, while the above mixed methods provided a sound approach for LCA [40], they are difficult to adapt for the EIA of transportation infrastructure projects over the life cycle. This is because the genetic algorithm and the energy-based calculation program do not consider the background system database such as production of materials, machinery or electricity to calculate environmental emissions of transportation infrastructure projects from the conception to the end of use.
In this study, the LCA method for the EIA in transportation infrastructure was applied. A proposed EIA model that comprises the extraction of raw materials, recycling process of production, transportation, use and post-abatement recycling processes and how these processes impact on the natural environment were developed. Additionally, the model covered the three phases of the life cycle of fast track transportation project, namely the construction phase, maintenance and repair phase, and demolition phase.

2.3. Gaps in Knowledge

Currently, the EIA of transportation infrastructure focuses more on the calculation of the carbon emissions in roads, railways, and bridges, especially in the construction phase. Although there are no uniform standards for the evaluation of carbon emissions, the most commonly used are the total amount of carbon emissions and carbon emissions per functional length [16]. At the same time, due to the different types and functional requirements of transportation infrastructure, the coverage of the overall project or functional length always varies. Therefore, it is difficult to use the total amount of carbon emissions or the carbon emissions of unit functional length of transportation infrastructure as the standard evaluation index. This study used the environmental emissions per unit functional area of transportation infrastructure as evaluation index. The functional unit is defined as 1 m2 effective transportation infrastructure area. The index stands for the environmental emissions of the transportation infrastructure life cycle per unit area. This kind of evaluation index can be used for EIA of different kinds of transportation infrastructure including the fast track project Therefore, the results obtained are more generalizable.

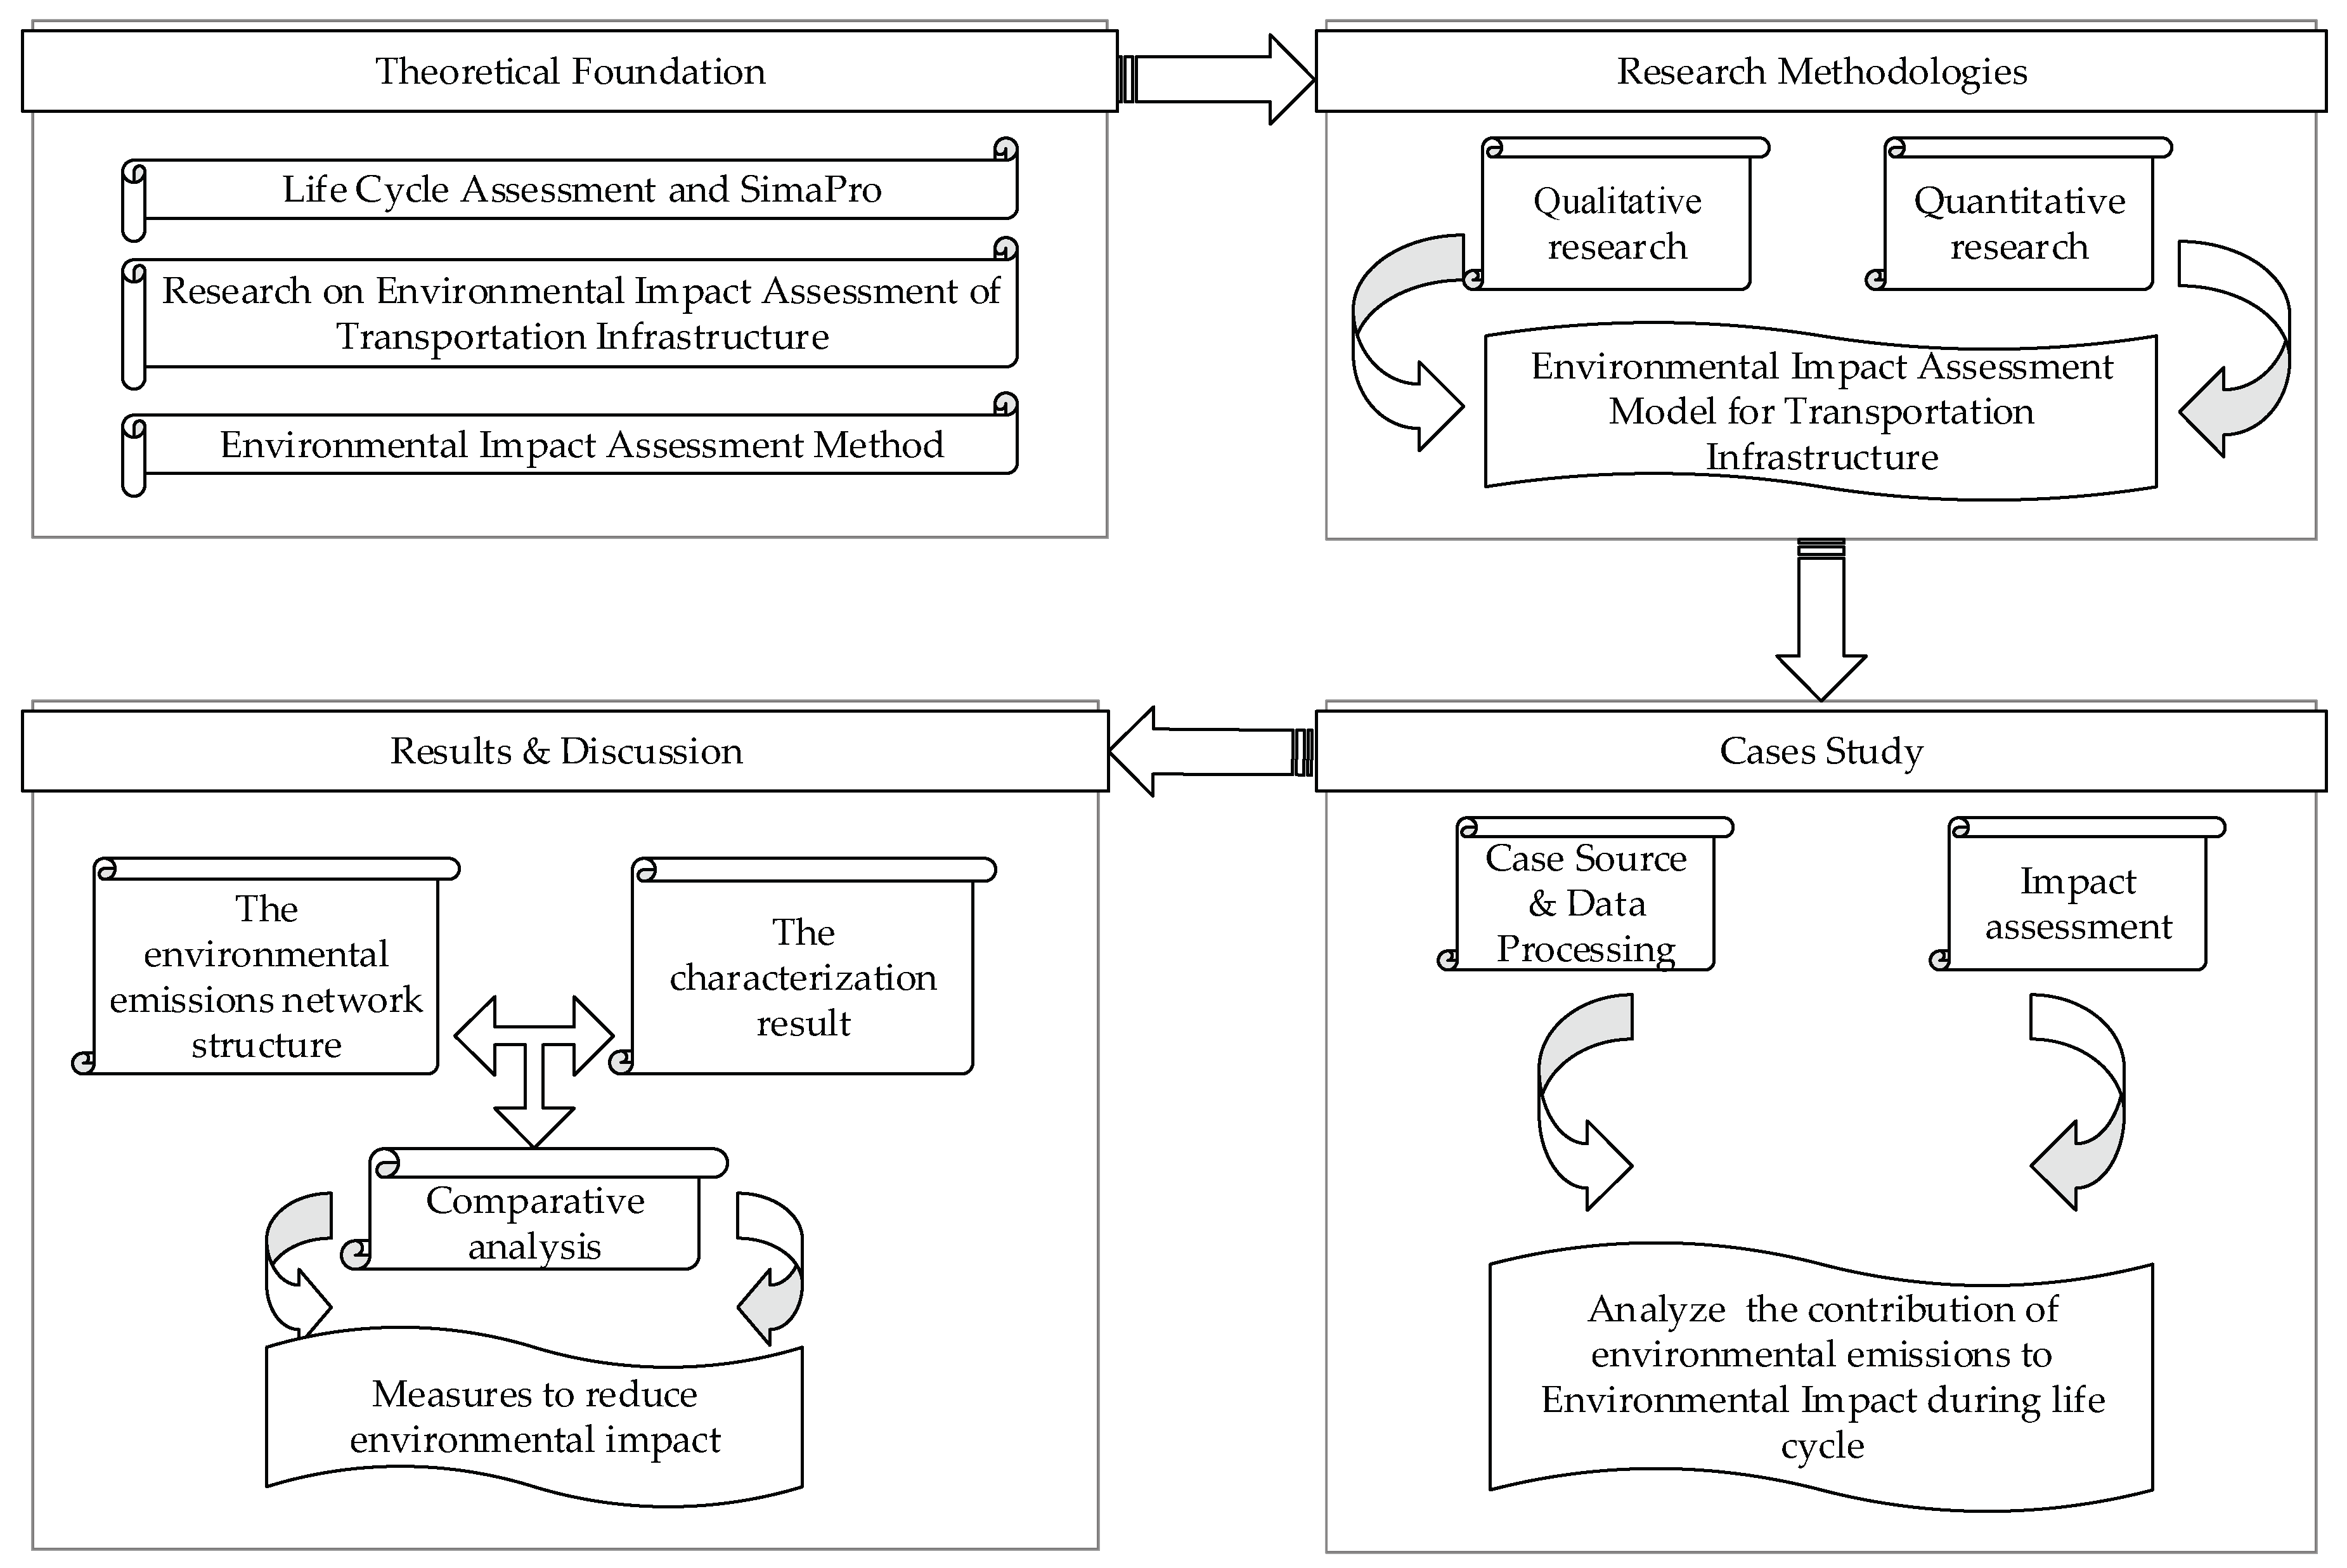
3. Research Methodology

In this study, the SimaPro software (SimaPro 8.3, Institute of Environmental Sciences (CML), Leiden University, Leiden, Netherlands) was used for the data analysis. And the LCA method was used for the development EIA model to analyze the contribution of each process in the transportation project life cycle. This study employed a mixed research approach, which is depicted in Figure 1. It combined both qualitative and quantitative methods.
In terms of qualitative analysis, the case study of a fast track transportation project in China was carried out to obtain the materials and energy-use data. With the acceleration of the urbanization process in China, the number of urban population and cars are increasing constantly, which leads to a series of transportation problems (e.g., serious traffic congestion and increased travel time) and environmental problems (e.g., carbon pollution). The fast track transportation project which enables faster transportation plays a vital role in alleviating the problem of urban transportation congestion. The fast track transportation project selected in this study consists of an elevated bridge with two-way six lanes and a ground auxiliary road with two-way eight lanes. Additionally, this project has a four-linked trunk overpass with five pairs of upper and lower bridge ramp. The total length of the fast track is 4307 m and the standard red line is 60 m. This project provides transportation link among the aviation port, development zone, and old city in Zhengzhou City, Henan Province. The materials used for the fast track transportation project are shown in Table 1.
Regarding the quantitative method, the LCA was used for the EIA of fast track transportation project. To carry out the LCA, data about the background system such as production of materials, machinery, and electricity were obtained from the Ecoinvent, which is the largest environmental impact database. In the database, the production process of transportation infrastructure can be adjusted and standardized, and raw materials can be compared to the impact of the environment. The SimaPro was used for the data analysis. It is a professional software for LCA used for EIA of transportation infrastructure projects [41]. Since the development of the software in 1990, its database of materials and processes have been continuously updated, while the array of LCA cases over the years has provided more extensive data [42]. With the collected data, the emissions from the fast track transportation project can be quantified and derived, including the output of various pollutants and the emission of various greenhouse gases. This can be used to generate environmental index for various environmental impacts. In addition to generating the index, the network structure maps were used to characterize environmental loads [43]. Furthermore, input data can be clearly shown by branches of network structure maps so that the impact of energy and materials on the environment can be easily evaluated.
After collecting the data, it was organized according to the unit functional area. Three stages of data analysis were conducted to calculate the transportation measurement and energy consumptions, which provided the necessary energy data for input data in the development EIA model (Figure 2). In the first step, in the construction phase, the amount of materials used was directly fed into the proposed EIA model and the transportation measurement was calculated by Equation (1):
Transportation   measurement ( t km / m 2 ) = The   total   weight   of   the   material ( t / m 2 ) × Material   transport   distance ( km )
In the second step, in the maintenance and repair phase, energy consumption was calculated by Equation (2). The energy consumption of each maintenance is calculated at 0.0237 t/m2 standard coal, and 1 ton of standard coal is converted at 3000 kW∙h:
Energy   consumption ( kW h / m 2 ) = Sin gle   maintenance   coal   consumption ( t / m 2 ) × 3000 ( kW h / t ) × Useful   life ( a ) ÷ Maintenance   cycle ( a )
In the third step, in the demolition phase, energy consumption was calculated by Equation (3). During the demolition phase, 0.0028 tons of standard coal are consumed for the dismantling of the functional area of the transportation infrastructure pavement:
Energy   consumption ( kW h / m 2 ) = Coal   consumption   for   pavement   demolition ( t / m 2 ) × 3000 ( kW h / t )

4. Data analysis

4.1. Input Data

The energy consumption of the fast track transportation project in the construction, maintenance and repair, and demolition phases was calculated using Equations 1–3, which was used as the energy input data. The material input data are shown in Table 1. Combined energy input data with material input data, the input data for the EIA model are shown in Table 2.

4.2. Results

In this section, the network structure diagram is used to represent the contribution of each process and the column chart clearly shows the relative proportion of the contribution of the three phases to the various impact categories. The results show the contribution of the various processes of the transportation project to the environmental impact.

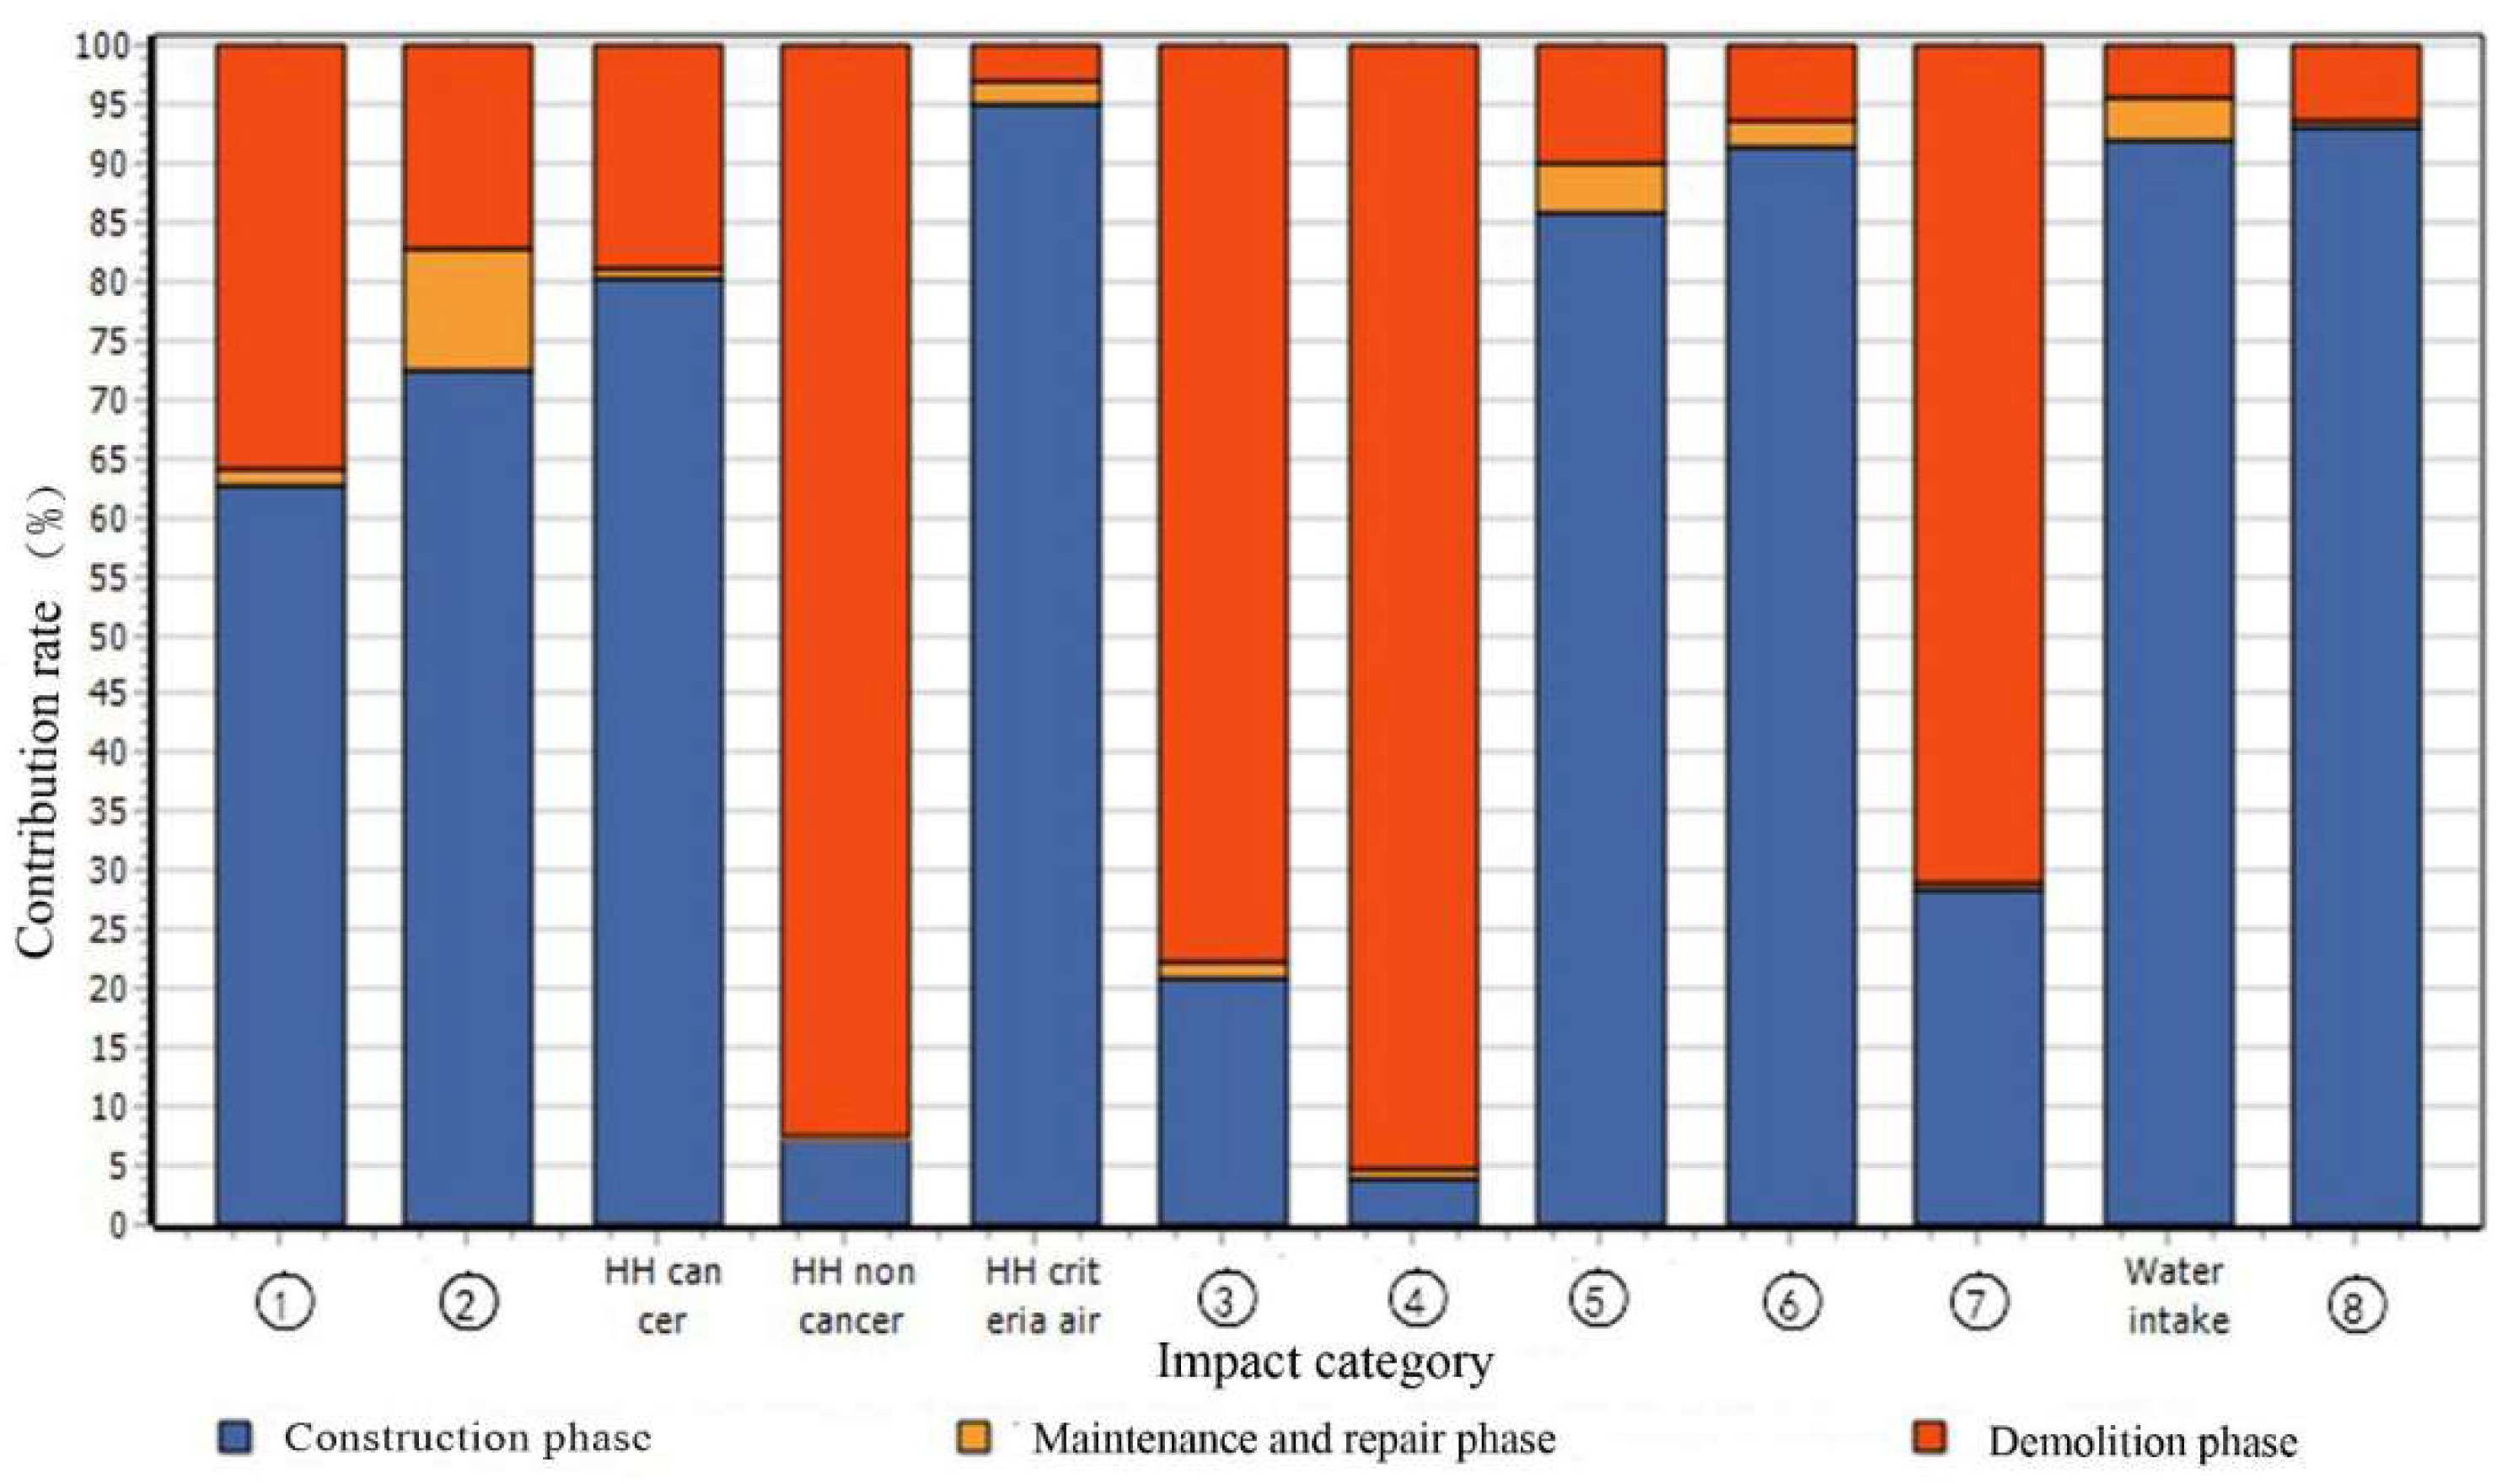
4.2.1. EIA in the Life Cycle

Figure 3 shows the results of the analysis of the EIA model for fast track transportation project. The different colors of column chart represents the different phases of the fast track life cycle: the blue refers to the construction phase, yellow represents the maintenance and repair phase, and jacinth refers to the demolition phase. The abscissa indicates the environmental impact categories, and the ordinate indicates the contribution rate of the three phases for each environmental impact category.
As shown in Figure 3, in the eight impact categories, the blue is dominant than other colors. It means that the environmental impact of environmental emissions in the construction phase are greater than those in other phases. Among the three colors, yellow had the smallest contribution. It indicates that the environmental emissions in the maintenance and repair phase during the fast track life cycle had the least contribution to environmental impact.
Figure 3 visually depicted the comparison of the contribution of environmental emissions in each phase of the life cycle of the fast track transportation project to the category of environmental impact. More detailed data analysis on the contribution of environmental emissions to the environmental impact of the fast track transportation project in each life cycle phase is shown in Table 3.
As shown in Table 3, there are eight categories of environmental impact on the fast track transportation project, including Global warming, Acidification, Eutrophication, Ecotoxicity, Smog, Natural resource depletion, Habitat alteration, and Ozone depletion. In the construction phase, it can be seen that the greatest environmental impact of the fast track transportation project is on Global warming, Acidification, Smog, Natural resource depletion, and Ozone depletion, with the life cycle environmental emissions contribution ranging between 61% and 94%. In the maintenance and repair phase, the environmental emissions have a relatively small contribution on the eight environmental categories, the highest being the 10% impact on Acidification. Lastly, in the demolition phase, the largest environmental impact of fast track transportation project is on Eutrophication, Ecotoxicity, and Habitat alteration, with the life cycle environmental emissions contribution ranging between 71% and 96%.
Overall, as shown in Figure 4, it can be seen that environmental emissions in construction phase contribute 62.7% of the environmental impact throughout the entire lifecycle of the fast track transportation project, while the maintenance and repair and demolition phases account for 1.7% and 35.8%, respectively. Therefore, the environmental emission in the construction phase constitute the largest environmental impact, and distantly followed by the environmental emissions in the demolition and maintenance and repair phases.

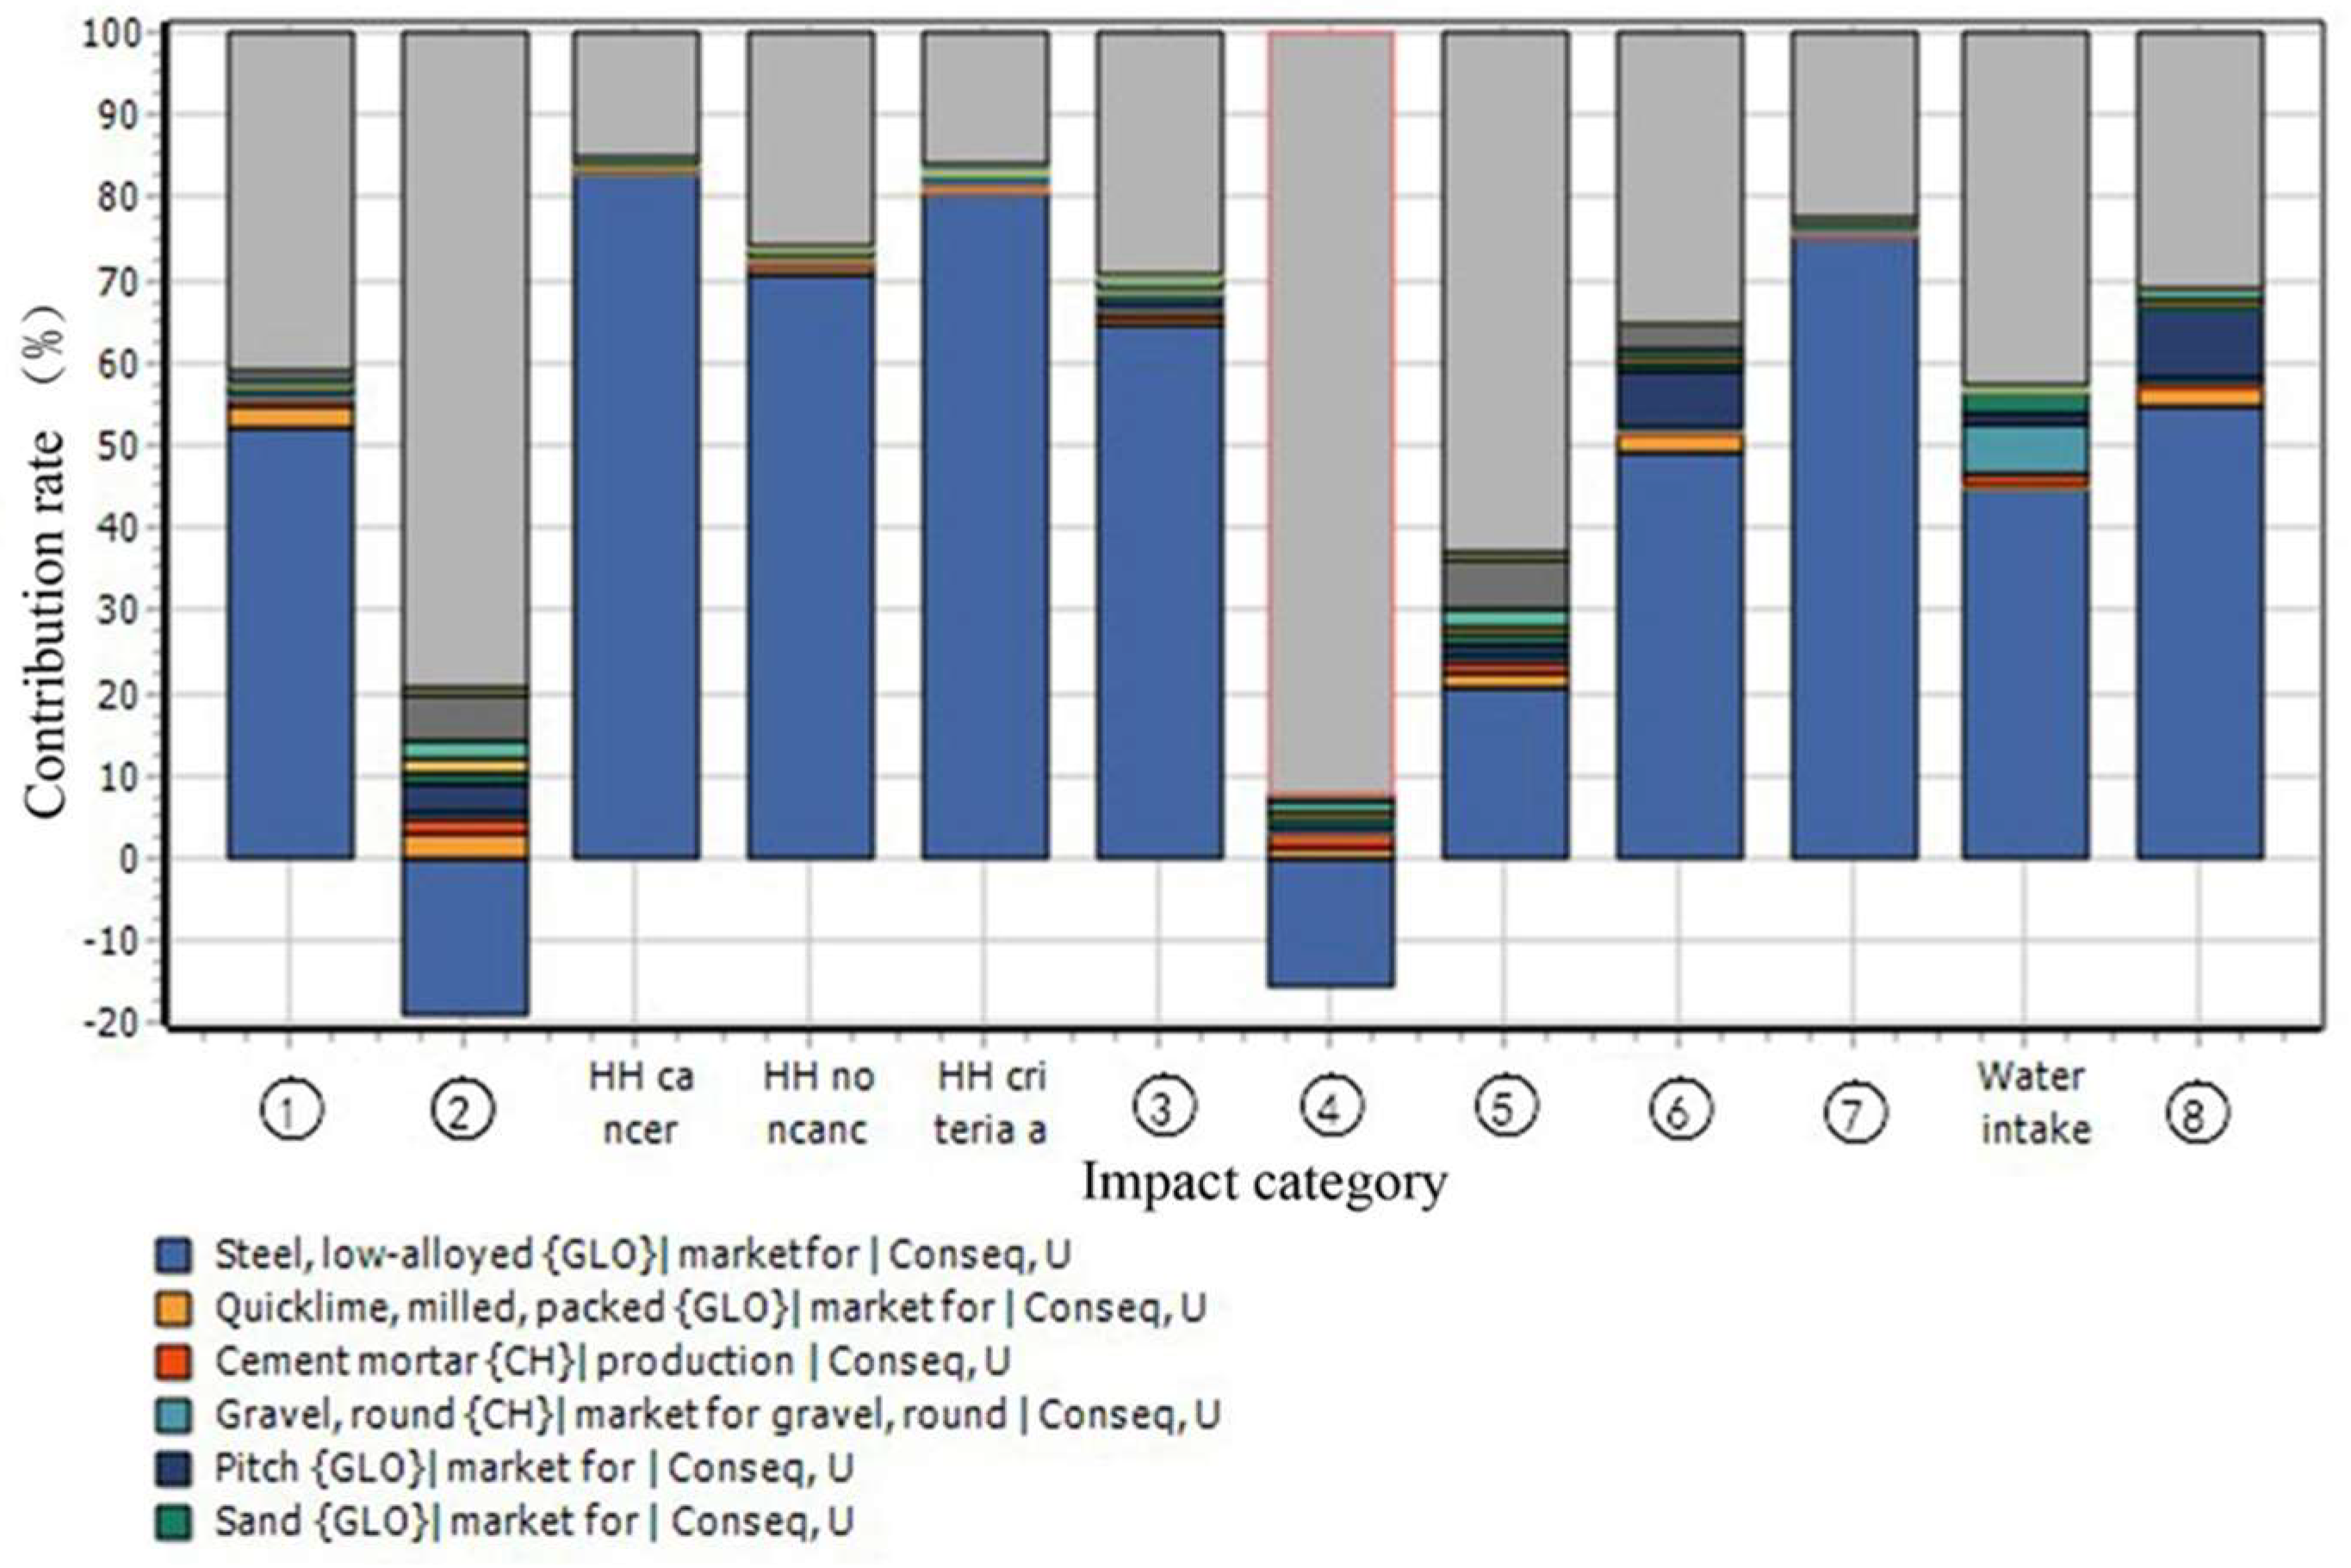
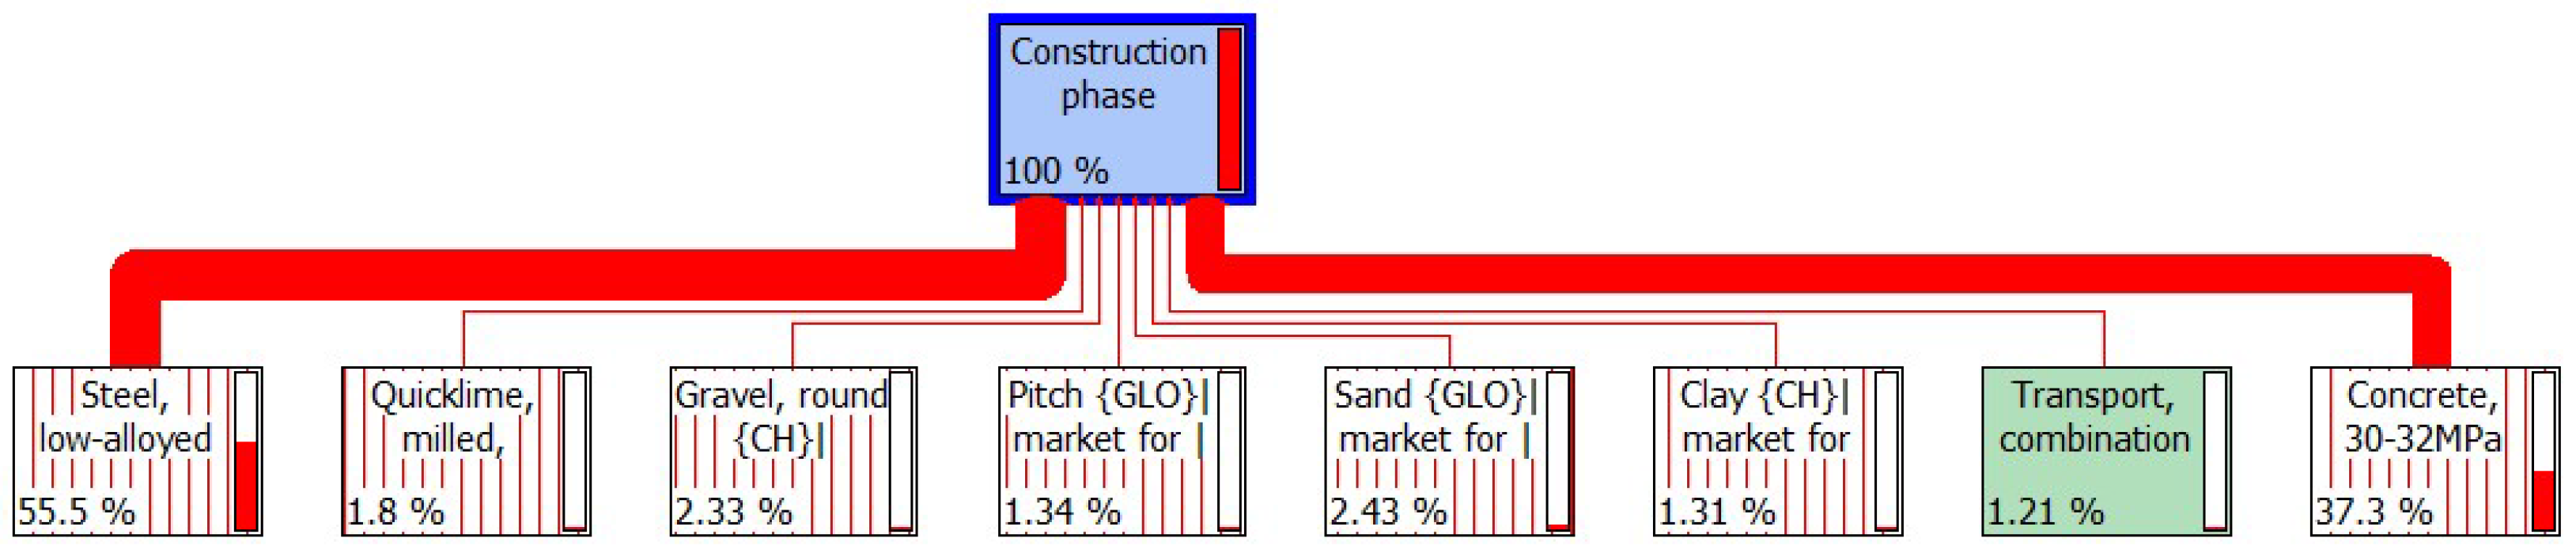
4.2.2. EIA in Construction Phase

As the environmental emissions in the construction phase constituted the largest environmental impact in the fast track transportation project life cycle, further analysis (see Figure 5) was carried out to reveal the proportion of each major material identified in Table 1 that impacts the environment in the construction phase. This is useful to identify the materials that are harmful to the environment in the fast track transportation project.
In Figure 5, gray represents concrete and blue represents steel. Obviously, gray and blue occupied the largest proportion of contributions. This means that during the construction phase, steel and concrete caused the greatest environmental emissions.
Furthermore, in the construction phase of the fast track transportation project life cycle, the contribution of different materials’ environmental emissions to different categories of environmental impact is presented in Table 4. It shows that the steel material contributed to 52.20% of environmental emissions to global warming, 64.80% to eutrophication, 49.20% to natural resource depletion, 75.40% to habitat alteration, and 54.60% to ozone layer depletion. The concrete material contributed to 79.20% of environmental emissions to acidification, 92.10% to ecotoxicity, and 62.90% to Smog. The diagrammatic representation of materials’ environmental emissions to the entire environmental impact is further illustrated in Figure 6. The thickness of the red line indicates the degree of contribution of different materials’ environmental emissions to the entire environmental impact. With the thickest line, the environmental emissions from steel had the greatest environmental impact.

5. Discussion

This study employed the fast track transportation project to develop an EIA model for transportation infrastructure over the life cycle. The current study found that the construction phase in fast track transportation project contributed to the highest environmental emissions at 62.7%. One possible explanation is that the construction phase encompasses many processes such as material production, transportation, and on-site project construction. Consequently, the energy consumption of fast track transportation project is concentrated in this phase. This finding was consistent with previous studies which revealed that the construction phase contributes to the most environmental impact of the three phases of the transportation infrastructure lifecycle [44,45].
Additionally, this study found that the demolition and maintenance and repair phases accounted for 35.8% and 1.7% of the environmental emissions over the life cycle of fast track. The environmental emissions in both phases were lower than that in the construction phase. Furthermore, the studies of Penades et al. [46] and Tang et al. [47] have shown that the environmental emissions in the demolition phase in road and highway projects are higher than in the maintenance and repair phase. Therefore, this study aligns with both studies. In reality, the reasons why the environmental emission at the demolition phase is greater than the maintenance and repair phase is the former encompasses the crushing roads, transportation of waste materials and the improper disposal of the waste generated that causes eutrophication, ecotoxicity, and habitat alteration [48].
Reuse represents the highest level in construction products recovery. However, when this is not possible, recycling is a better approach to re-introduce the materials into the cycle and thereby protect the environment [49,50]. Di Maria et al. [51] have found that recycling after selective demolition can reduce 59% of environmental impacts in the demolition phase. The decrease in environmental impacts is mostly due to the avoided landfilling of demolition waste and the recovery of materials from selective demolition. Therefore, in the demolition phase, recycling is a solution to the environmental impact.
The environmental impact of different materials in the construction phase of the fast track life cycle revealed that steel had the greatest environmental impact (55.5% of emissions), followed by concrete (37.3% of emissions). It means that steel is the most harmful to the environment, followed by concrete. In corroboration, Gudukeya and Mbohwa [52] have found that in the production of 1kg of various building materials, steel emits the largest amount of carbon dioxide, carbon monoxide, sulfur oxides and nitrogen oxides, causing harsh environmental impacts. Similarly, other studies that the environmental impact of steel per unit weight is the largest of all construction materials [53,54,55]. Therefore, the use of steel needs to be minimized to ensure minimal environmental impact in the construction phase of transportation infrastructure project.
Many suggestions have been made to reduce the harmful environmental impact of steel in transportation infrastructure life cycle. According to the study of Su [56], there is a need for green and non-polluting production of steel. To achieve this requires a high-efficiency equipment and the use of improved production technology in the delivery of transportation infrastructure life cycle to reduce resource consumption in the production process [57]. Additionally, the environmental impact of steel can be lessened by adjusting the mix ratio of the raw materials used for steel making.
Since environmental emissions during the construction phase have little impact on ecotoxicity (3.98% of emissions), the impact of concrete environmental emissions on ecotoxicity in this phase was ignored in the current study. Babbitt and Lindner [58] have found that the ecotoxicity category was most susceptible to change, causing the low impact of concrete on ecotoxicity, while other impact categories had more robust results. However, the contribution of concrete to acidification (79.2% of emissions) and Smog (62.9% of emissions) cannot be ignored. High-level contribution of acidification and smog can wreak havoc on ecosystems and further damage human health [59]. Therefore, it is necessary to optimize the production process of concrete and improve the efficiency of energy use in its construction process to reduce its environmental hazards. For example, a novel process including a high water to cement ratio mix, a precondition drying, and a static carbonation curing can be used to accelerate hydration, shorten production time and enhance carbon dioxide uptake of concrete [60].
Finally, as shown in Manzo et al. [36]’s research, uncertainty analysis should be considered in the LCA process. In this study, a large number of substances and raw materials are considered in the LCA process base on the Ecoinvent database. Therefore, the LCA results are more detailed and less affected by the uncertainty introduced in the environmental impact assessment. Meanwhile, the contribution analysis is used in understanding the uncertainty of the LCA results. When there are important assumptions in the process with the greatest contribution, the LCA results will be greatly affected by uncertainty. From Figure 4, the process that maximizes the contribution is the construction phase (62.7%), while there are no important assumptions within this phase. Thence, the results of this study are less affected by uncertainty and the LCA results are reliable.

6. Conclusions

Enormous environmental emissions are generated in the transportation sector. This study has developed an environmental impact assessment model for transportation infrastructure over the life cycle. A case study of a fast track transportation project in China was carried out to obtain and analyze both qualitative and quantitative data. The data obtained were analyzed using the SimaPro software and the following conclusions are made.
Firstly, the construction phase contributed to the largest environmental impact over the life cycle of the fast track transportation project. In line with the body of knowledge, this phase contributed the largest environmental impact over the life cycle of transportation infrastructure project. Of the materials used in the fast track transportation project, the steel had the highest impact on the environment in the construction phase. Therefore, the environmental impact of steel was greatest in the construction phase of transportation infrastructure project. Optimizing steel production processes is suggested to reduce the environmental impact in the construction phase of transportation infrastructure. Alternatively, the proportion of steel usage in transportation infrastructure should be lessened. Energy efficient concrete can be used instead.
Secondly, the demolition phase has the greatest environmental impact on eutrophication, habitat alteration, and ecotoxicity. Therefore, the recycling of wastes generated in the demolition phase in the transportation infrastructure life cycle is suggested. This will minimize the amount of wastes exposed to the environment. Additionally, recycling wastes can be reused thereby reducing the overall amount of materials used in the delivery of transportation infrastructure.
This study used the fast track transportation project in China to develop an EIA model for transportation infrastructure over the life cycle. Theoretically, the development of EIA model serves as a guideline for the EIA of environmental emissions in other contexts. The research methods in this paper can be applied to other types of transportation infrastructure and applied to multiple case studies. Meanwhile, the study is limited to the singularity of the case, thus the results of the environmental emissions may not be generalizable. In the future, comparative study of the EIA of the environmental emissions in different kinds of transportation infrastructure projects is suggested.

Author Contributions

Conceptualization, H.L.; Data curation, H.L.; Formal analysis, H.L.; Investigation, Q.D.; Methodology, H.L. and J.Z.; Project administration, H.L.; Resources, J.Z.; Software, Q.D.; Supervision, J.Z.; Validation, A.O.O. and S.L.; Writing—original draft, Q.D.; Writing—review & editing, A.O.O. and S.L.

Funding

This research is supported by the National Natural Science Foundation of China (No. 71301013); Humanity and Social Science Program Foundation of the Ministry of Education of China (No. 17YJA790091); List of Key Science and Technology Projects in China’s Transportation Industry in 2018-International Science and Technology Cooperation Project (2018-01639); Shaanxi Province Social Science Fund (No. 2017S004, No. 2016ZB017, No. 2016Z047 and No. 2014HQ10); Shaanxi Province Social Sciences Major Theoretical and Practical Research Fund (No.2017Z028); Xi’an Social Science Fund (No. 18J139); Xi’an Science Technology Bureau Fund (No.CXY1512(2)); Xi’an Construction Science and Technology Planning Projects (No. SJW201705); Xi’an Science Technology Bureau Fund (No.201805070RK1SF4(6)); Shaanxi Universities Second Batch of Youth Outstanding Talents Support Projects((2018)111); Shaanxi Province Higher Education Teaching Reform Project (17BZ017); Education Funding of Master of Engineering Management in China(No. 2017-ZX-004); Shaanxi Province Civil Engineering “first-class professional” project (No. 300103292801 and No. 300103292804); Special Fund for Graduate Student Education Reform of Central College, Chang’an University (No.300111002005, No. 300103187091,No. 310623176201, No.310623176702, No.310628176702 and No.310628161406); Fundamental Research for Education Reform of Central College, Chang’an University (No. 300104292304, No. 300104292305, No. 300104292308, No. 300103292806, No. 300104282301, No. 300104282318, No. 300104282323, No. 310623172904, No. 310623171003 and No. 310623171633); Fundamental Research for Funds for the Central Universities (Humanities and Social Sciences), Chang’an University (No. 300102239616); Fundamental Research for Funds for the Central Universities, Chang’an University (No. 300102238201).

Acknowledgments

The authors would like to acknowledge the financial support of Chang’an University. We are also grateful to all the editors and reviewers for their invaluable comments.

Conflicts of Interest

The authors declare no conflict of interest.

References

  1. Chakrabarti, S. Can highway development promote employment growth in India? Transp. Policy 2018, 69, 1–9. [Google Scholar] [CrossRef]
  2. Li, X.; Fan, Y.L.; Wu, L. CO2 emissions and expansion of railway, road, airline and in-land waterway networks over the 1985–2013 period in China: A time series analysis. Transp. Res. Part D Transp. Environ. 2017, 57, 130–140. [Google Scholar] [CrossRef]
  3. Transport Industry Development Statistics Bulletin from Ministry of Transport of the People’s Republic of China. Available online: http://zizhan.mot.gov.cn/zfxxgk/bnssj/zhghs/201803/t20180329_3005087.html (accessed on 2 June 2018).
  4. Cellura, M.; Cusenza, M.A.; Longo, S. Energy-related GHG emissions balances: IPCC versus LCA. Sci. Total Environ. 2018, 628, 1328–1339. [Google Scholar] [CrossRef] [PubMed]
  5. VanderZaag, A.C. On the systematic underestimation of methane conversion factors in IPCC guidance. Waste Manag. 2018, 75, 499–502. [Google Scholar] [CrossRef]
  6. Climate Change 2014: Mitigation of Climate Change. Available online: http://www.ipcc.ch/report/ar5/wg3/ (accessed on 26 June 2018).
  7. Mustapa, S.I.; Bekhet, H.A. Analysis of CO2 emissions reduction in the Malaysian transportation sector: An optimisation approach. Energy Policy 2016, 89, 171–183. [Google Scholar] [CrossRef]
  8. Monghasemi, S.; Abdallah, M.; Tawfik, A.; Clevenger, C. Time-Environmental Impacts Tradeoff Analysis for Businesses Commuters; ASCE—American Society of Civil Engineers: Reston, VA, USA, 2018; pp. 628–638.
  9. Yin, X.; Chen, W.; Eom, J.; Clarke, L.E.; Kim, S.H.; Patel, P.L.; Yu, S.; Kyle, G.P. China’s transportation energy consumption and CO2 emissions from a global perspective. Energy Policy 2015, 82, 233–248. [Google Scholar] [CrossRef]
  10. Ahmed, K.; Ahmed, S. A predictive analysis of CO2 emissions, environmental policy stringency, and economic growth in China. Environ. Sci. Pollut. Res. 2018, 25, 16091–16100. [Google Scholar] [CrossRef]
  11. Meng, X.; Han, J. Roads, economy, population density, and CO2: A city-scaled causality analysis. Resour. Conserv. Recycl. 2018, 128, 508–515. [Google Scholar] [CrossRef]
  12. Guo, Z.; Hu, D.; Zhang, Z.; Zhang, P.; Zhang, X. Material metabolism and lifecycle GHG emissions of urban road system (URS). J. Clean. Prod. 2017, 165, 243–253. [Google Scholar] [CrossRef]
  13. Lin, B.L.; Liu, C.; Wang, H.J.; Lin, R.X. Modeling the railway network design problem: A novel approach to considering carbon emissions reduction. Transp. Res. Part D Transp. Environ. 2017, 56, 95–109. [Google Scholar] [CrossRef]
  14. Dimoula, V.; Kehagia, F.; Tsakalidis, A. A Holistic Approach for Estimating Carbon Emissions of Road and Rail Transport Systems. Aerosol Air Qual. Res. 2016, 16, 61–68. [Google Scholar] [CrossRef]
  15. Peng, B.; Cai, C.; Hu, R. Energy consumption and carbon emission evaluation of expressway asphalt pavement. J. Chang’An Univ. Nat. Sci. Ed. 2016, 36, 8–15. [Google Scholar]
  16. Liu, K.; Bai, Y.; Wang, C.; Zhang, X.; Zhang, C. Study on the Comprehensive Carbon-emission Assessment of Infrastructure Projects. Environ. Sci. Technol. 2017, 40, 185–190. [Google Scholar]
  17. Chester, M.V.; Horvath, A. Environmental assessment of passenger transportation should include infrastructure and supply chains. Environ. Res. Lett. 2009, 4, 024008. [Google Scholar] [CrossRef] [Green Version]
  18. Ren, J.; Gao, L.; Feng, Y. Discussion on the traffic carbon emission structure and development strategy of low carbon transportation in Tianjin. Environ. Pollut. Control 2015, 37, 96–99. [Google Scholar]
  19. Thaveewatanaseth, K.; Limjirakan, S. Key factors of low carbon development strategy for sustainable transport. IOP Conf. Ser. Earth Environ. Sci. 2018, 117, 012003. [Google Scholar] [CrossRef] [Green Version]
  20. Shen, B.; Lepech, M.D. Probabilistic Design of Environmentally Sustainable Reinforced-Concrete Transportation Infrastructure Incorporating Maintenance Optimization. J. Infrastruct. Syst. 2017, 23, 10. [Google Scholar] [CrossRef]
  21. Hammervold, J.; Reenaas, M.; Brattebo, H. Environmental Life Cycle Assessment of Bridges. J. Bridge Eng. 2013, 18, 153–161. [Google Scholar] [CrossRef]
  22. O’Born, R. Life cycle assessment of large scale timber bridges: A case study from the world’s longest timber bridge design in Norway. Transp. Res. Part D Transp. Environ. 2018, 59, 301–312. [Google Scholar] [CrossRef]
  23. Babaee, S.; Loughlin, D.H. Exploring the role of natural gas power plants with carbon capture and storage as a bridge to a low-carbon future. Clean Technol. Environ. Policy 2018, 20, 379–391. [Google Scholar] [CrossRef]
  24. Li, D.; Wang, Y.Q.; Liu, Y.Y.; Feng, S.; Wang, D.W. Estimating Life-Cycle CO2 Emissions from Freeway Greening Engineering; ASCE—American Society of Civil Engineers: Reston, VA, USA, 2018; pp. 796–805.
  25. Sohn, H.; Seong, T.-R.; Kim, I.-G. Special issue on “ICT Bridge Technology for Life-span Extension and Carbon Emission Mitigation” Preface. Smart Struct. Syst. 2016, 17, I. [Google Scholar]
  26. Liu, Y.; Wang, Y.; Li, D. Estimation and uncertainty analysis on carbon dioxide emissions from construction phase of real highway projects in China. J. Clean. Prod. 2017, 144, 337–346. [Google Scholar] [CrossRef]
  27. Wang, X.; Duan, Z.; Wu, L.; Yang, D. Estimation of carbon dioxide emission in highway construction: A case study in southwest region of China. J. Clean. Prod. 2015, 103, 705–714. [Google Scholar] [CrossRef]
  28. Sun, X.Y.; Dong, W.W.; Wang, H.L.; Wang, J. Multi-Level Fuzzy Comprehensive Evaluation of Bridge Carbon Intensity Based on Life-Cycle Carbon Emission Model. Adv. Mater. Res. 2012, 374–377, 1685–1689. [Google Scholar] [CrossRef]
  29. Shi, F.; Huang, T.; Tanikawa, H.; Han, J.; Hashimoto, S.; Moriguchi, Y. Toward a Low Carbon-Dematerialization Society Measuring the Materials Demand and CO2 Emissions of Building and Transport Infrastructure Construction in China. J. Ind. Ecol. 2012, 16, 493–505. [Google Scholar] [CrossRef]
  30. Zhao, K.; Xu, X.; Yang, G.; Wu, S.; Jiang, F. Impacts of highway construction and operation on carbon footprint in China: A case study of Jiangsu Province. Environ. Prog. Sustain. Energy 2016, 35, 1468–1475. [Google Scholar] [CrossRef]
  31. Ahmad, S.; Wong, K.Y.; Tseng, M.L.; Wong, W.P. Sustainable product design and development: A review of tools, applications and research prospects. Resour. Conserv. Recycl. 2018, 132, 49–61. [Google Scholar] [CrossRef]
  32. Itoya, E.; El-Hamalawi, A.; Ison, S.G.; Frost, M.W.; Hazell, K. Development and Implementation of a Lifecycle Carbon Tool for Highway Maintenance. J. Transp. Eng. 2015, 141, 04014092. [Google Scholar] [CrossRef]
  33. Dos Santos, J.M.O.; Thyagarajan, S.; Keijzer, E.; Flores, R.F.; Flintsch, G. Comparison of Life-Cycle Assessment Tools for Road Pavement Infrastructure. Transp. Res. Rec. 2017, 2646, 28–38. [Google Scholar] [CrossRef] [Green Version]
  34. Peñaloza, D.; Erlandsson, M.; Pousette, A. Climate impacts from road bridges: Effects of introducing concrete carbonation and biogenic carbon storage in wood. Struct. Infrastruct. Eng. 2018, 14, 56–67. [Google Scholar] [CrossRef]
  35. Manzo, S.; Salling, K.B. Integrating life-cycle assessment into transport cost-benefit analysis. In Transport Research Arena Tra2016; Rafalski, L., Zofka, A., Eds.; Elsevier Science BV: Amsterdam, The Netherlands, 2016; Volume 14, pp. 273–282. [Google Scholar]
  36. Manzo, S.; Dong, Y.; Miraglia, S.; Salling, K.B. How the inclusion of life cycle impacts affects transport cost-benefit analysis. Eur. J. Transp. Infrastruct. Res. 2018, 18, 372–388. [Google Scholar]
  37. Xie, H.B.; Wu, W.J.; Wang, Y.F. Life-time reliability based optimization of bridge maintenance strategy considering LCA and LCC. J. Clean. Prod. 2018, 176, 36–45. [Google Scholar] [CrossRef]
  38. Coston-Guarini, J.; Guarini, J.M.; Hinz, S.; Wilson, J.; Chauvaud, L. A roadmap for a quantitative ecosystem-based environmental impact assessment. ICES J. Mar. Sci. 2016, 74, 2012–2023. [Google Scholar] [CrossRef]
  39. Ali, M.; Marvuglia, A.; Geng, Y.; Chaudhry, N.; Khokhar, S. Emergy based carbon footprinting of household solid waste management scenarios in Pakistan. Resour. Conserv. Recycl. 2018, 131, 283–296. [Google Scholar] [CrossRef]
  40. Batouli, M.; Bienvenu, M.; Mostafavi, A. Putting sustainability theory into roadway design practice: Implementation of LCA and LCCA analysis for pavement type selection in real world decision making. Transp. Res. Part D Transp. Environ. 2017, 52, 289–302. [Google Scholar] [CrossRef]
  41. Bachawati, M.E.; Manneh, R.; Belarbi, R.; Dandres, T.; Nassab, C.; Zakhem, H.E. Cradle-to-gate Life Cycle Assessment of traditional gravel ballasted, white reflective, and vegetative roofs: A Lebanese case study. J. Clean. Prod. 2016, 137, 833–842. [Google Scholar] [CrossRef]
  42. Starostka-Patyk, M. New Products Design Decision Making Support by SimaPro Software on the Base of Defective Products Management. Procedia Comput. Sci. 2015, 65, 1066–1074. [Google Scholar] [CrossRef] [Green Version]
  43. Tam, W.Y.V.; Le, K.N.; Tran, C.N.N.; Wang, J.Y. A review on contemporary computational programs for Building’s life-cycle energy consumption and greenhouse-gas emissions assessment: An empirical study in Australia. J. Clean. Prod. 2018, 172, 4220–4230. [Google Scholar] [CrossRef]
  44. Luijten, C.J.L.M.; Gijt, J.G.D.; Said, M.; Bouwheer, C.H.J. From LCA to LCC in Infrastructure Reducing CO2 Emissions in Infrastructure; LCC: Delft, The Netherlands, 2016. [Google Scholar]
  45. Morales-Mendoza, L.F.; Azzaro-Pantel, C. Bridging LCA data gaps by use of process simulation for energy generation. Clean Technol. Environ. Policy 2017, 19, 1535–1546. [Google Scholar] [CrossRef]
  46. Penades-Pla, V.; Marti, J.V.; Garcia-Segura, T.; Yepes, V. Life-Cycle Assessment: A Comparison between Two Optimal Post-Tensioned Concrete Box-Girder Road Bridges. Sustainability 2017, 9, 1864. [Google Scholar] [CrossRef]
  47. Tang, H.; Kuai, H.; Huang, X. Energy consumption model for highway maintenance based on life cycle assessment. J. Southeast Univ. Nat. Sci. Ed. 2016, 46, 629–634. [Google Scholar]
  48. Streimikiene, D.; Balezentis, T.; Balezentiene, L. Comparative assessment of road transport technologies. Renew. Sustain. Energy Rev. 2013, 20, 611–618. [Google Scholar] [CrossRef]
  49. Barsan, L.; Barsan, A. Some Aspects Concerning the Design for Recycling and Waste Minimisation; World Scientific and Engineering Acad and Soc: Athens, Greece, 2009; pp. 274–277. [Google Scholar]
  50. Li, H.; Deng, Q.X.; Zhang, J.X.; Xia, B.; Skitmore, M. Assessing the life cycle CO2 emissions of reinforced concrete structures: Four cases from China. J. Clean. Prod. 2019, 210, 1496–1506. [Google Scholar] [CrossRef]
  51. Di Maria, A.; Eyckmans, J.; Van Acker, K. Downcycling versus recycling of construction and demolition waste: Combining LCA and LCC to support sustainable policy making. Waste Manag. 2018, 75, 3–21. [Google Scholar] [CrossRef] [PubMed]
  52. Gudukeya, L.; Mbohwa, C. Life cycle assessment of steel balls. In Proceedings of the 2015 International Conference on Industrial Engineering and Operation Management (IEOM), Dubai, UAE, 3–5 March 2015; p. 8. [Google Scholar]
  53. Ye, H.; Ren, Q.; Hu, X.; Lin, T.; Shi, L.; Zhang, G.; Li, X. Modeling energy-related CO2 emissions from office buildings using general regression neural network. Resour. Conserv. Recycl. 2018, 129, 168–174. [Google Scholar] [CrossRef]
  54. Kumanayake, R.; Luo, H.B.; Paulusz, N. Assessment of material related embodied carbon of an office building in Sri Lanka. Energy Build. 2018, 166, 250–257. [Google Scholar] [CrossRef]
  55. Anthonissen, J.; Troyen, D.V.; Braet, J.; Bergh, W.V.D. Using carbon dioxide emissions as a criterion to award road construction projects: A pilot case in Flanders. J. Clean. Prod. 2015, 102, 96–102. [Google Scholar] [CrossRef]
  56. Su, F. Green Development Mode of the Suburban Steel Plant. J. Eng. Stud. 2017, 9, 85–98. [Google Scholar]
  57. Krantz, J.; Lu, W.; Johansson, T.; Olofsson, T. Analysis of alternative road construction staging approaches to reduce carbon dioxide emissions. J. Clean. Prod. 2017, 143, 980–988. [Google Scholar] [CrossRef]
  58. Babbitt, C.W.; Lindner, A.S. A life cycle comparison of disposal and beneficial use of coal combustion products in Florida: Part 2: Imapact assessment of disposal and beneficial use options. Int. J. Life Cycle Assess. 2008, 13, 555–563. [Google Scholar] [CrossRef]
  59. Buekers, J.; Deutsch, F.; Veldeman, N.; Janssen, S.; Panis, L.I. Fine atmospheric particles from agricultural practices in Flanders: From emissions to health effects and limit values. Outlook Agric. 2014, 43, 39–44. [Google Scholar] [CrossRef]
  60. Morshed, A.; Shao, Y.X. Optimized process window for fresh concrete carbonation curing. Can. J. Civ. Eng. 2014, 41, 986–994. [Google Scholar] [CrossRef]
Figure 1. Framework of the research methodology.
Energies 12 01015 g001
Figure 2. The development EIA model.
Energies 12 01015 g002
Figure 3. The characterization result of fast track transportation project in life cycle. Note: HH cancer, HH noncancer, HH criteria air pollutants, and Water intake are redundant Environmental impact categories which are currently used less frequently. This study does not take those four categories into account. The meanings of the ①~⑧ are: ① Global warming, ② Acidification, ③ Eutrophication, ④ Ecotoxicity, ⑤ Smog, ⑥ Natural resource depletion, ⑦ Habitat alteration, ⑧ Ozone depletion.
Energies 12 01015 g003
Figure 4. The network structure of environmental emissions for fast track transportation project in the life cycle. Note: Construction phase—accounts for 62.7% of the total environmental impact on the environment. Maintenance and repair phase—accounts for 1.7% of the environmental impact over the entire life cycle. Demolition phase—accounts for 35.8% of the environmental impact over the total life cycle.
Energies 12 01015 g004
Figure 5. The characterization result of fast track transportation project in construction phase. Note: HH cancer, HH noncancer, HH criteria air pollutants, and Water intake are redundant Environmental impact categories which are currently used less frequently. This study does not take those four categories into account. The meanings of the ①~⑧ are: ① Global warming, ② Acidification, ③ Eutrophication, ④ Ecotoxicity, ⑤ Smog, ⑥ Natural resource depletion, ⑦ Habitat alteration, ⑧ Ozone depletion.
Energies 12 01015 g005
Figure 6. The environmental emissions network structure of fast track transportation project in construction phase. Note: Steel—the production of steel contributed to 55.5% of the environmental impact in the construction phase, Quicklime—the production of quicklime contributed to 1.8% of the environmental impact in the construction phase, Gravel—the production of gravel contributed to 2.33% of the environmental impact in the construction phase, Pitch—the production of pitch contributed to 1.34% of the environmental impact in the construction phase, Sand—the production of sand contributed to 2.43% of the environmental impact in the construction phase, Clay—the production of clay contributed to 1.31% of the environmental impact in the construction phase, Transport—the transportation of materials contributed to 1.21% of the environmental impact in the construction phase, Concrete—the production of concrete contributed to 37.3% of the environmental impact in the construction phase, Other materials and processes contributing to less than 1% of the environmental impact are not shown in this figure.
Energies 12 01015 g006
Table 1. The materials used in the fast track transportation project per unit area.
MaterialsAmount
Steel (kg/m2)261.02
Concrete (m3/m2)1.89
Quicklime (kg/m2)32.72
Cement mortar (kg/m2)72.68
Gravel (kg/m2)714.70
Pitch (kg/m2)11.21
Sand (kg/m2)340.82
Fly ash (kg/m2)0.30
Clay brick (kg/m2)29.55
Clay (kg/m2)678.24
Table 2. The input data of EIA model.
Construction PhaseMaterials/AssembliesAmountUnit
Steel261.02kg
Concrete1.89m3
Quicklime32.72kg
Cement mortar72.68kg
Gravel714.70kg
Pitch11.21kg
Sand340.82kg
Fly ash0.30kg
Clay brick29.55kg
Clay678.24kg
ProcessesAmountUnit
Transport, combination truck, average fuel mix199.33tkm
Diesel, burned in agricultural machinery13.11MJ
Maintenance and repair phaseThe energy consumptionAmountUnit
Electricity, low voltage71.1kWh
Demolition phaseThe energy consumptionAmountUnit
Electricity, low voltage8.4kWh
Waste specificationAmountUnit
Construction waste6644.21kg
Disposal scenarioPercentage
Municipal solid waste (waste scenario) (Treatment of municipal solid waste, landfill)100%
Table 3. The contribution of environmental emissions to environmental impact of fast track transportation project in each life cycle phase (%).
Impact CategoryConstruction PhaseMaintenance and Repair PhaseDemolition Phase
① Global warming61.821.4836.70
② Acidification72.5010.2017.30
③ Eutrophication21.001.2077.80
④ Ecotoxicity3.980.6295.40
⑤ Smog85.804.0610.10
⑥ Natural resource depletion91.402.266.30
⑦ Habitat alteration28.300.6571.10
⑧ Ozone depletion93.200.326.51
Table 4. The contribution of environmental emissions to various environmental impact categories in construction phase (%).
Impact CategorySteelConcreteQuicklimeCement MortarPitchSandClay BrickClay
① Global warming52.2040.802.65--0.27--
② Acidification−19.0079.202.831.803.401.301.762.26
③ Eutrophication64.8029.500.611.061.430.360.591.04
④ Ecotoxicity−15.7092.101.341.530.890.460.721.48
⑤ Smog20.8062.901.601.301.271.061.161.89
⑥ Natural resource depletion49.2035.202.14-6.90.541.100.98
⑦ Habitat alteration75.4022.400.25--0.300.300.68
⑧ Ozone depletion54.6030.902.510.318.370.600.731.06
Note: The “-” sign indicates that this contribution is about 0. Because of the small contribution of gravel and fly ash to various environmental categories, it is not shown here.

