Article

Enhancing Hydrogen Production from Chlorella sp. Biomass by Pre-Hydrolysis with Simultaneous Saccharification and Fermentation (PSSF)

1
Department of Biotechnology, Faculty of Technology, Khon Kaen University, Khon Kaen 40002, Thailand
2
Research Group for Development of Microbial Hydrogen Production Process from Biomass, Khon Kaen University, Khon Kaen 40002, Thailand
3
Key Laboratory of Low-grade Energy Utilization Technologies and Systems, Chongqing University, Ministry of Education, Chongqing 400044, China
4
Institute of Engineering Thermophysics, School of Energy and Power Engineering, Chongqing University, Chongqing 400044, China
*
Author to whom correspondence should be addressed.
Energies 2019, 12(5), 908; https://doi.org/10.3390/en12050908
Submission received: 14 December 2018 / Revised: 26 February 2019 / Accepted: 6 March 2019 / Published: 8 March 2019
(This article belongs to the Section A5: Hydrogen Energy)

Abstract

:
Simultaneous saccharification and fermentation (SSF) and pre-hydrolysis with SSF (PSSF) were used to produce hydrogen from the biomass of Chlorella sp. SSF was conducted using an enzyme mixture consisting of 80 filter paper unit (FPU) g-biomass−1 of cellulase, 92 U g-biomass−1 of amylase, and 120 U g-biomass−1 of glucoamylase at 35 °C for 108 h. This yielded 170 mL-H2 g-volatile-solids−1 (VS), with a productivity of 1.6 mL-H2 g-VS−1 h−1. Pre-hydrolyzing the biomass at 50 °C for 12 h resulted in the production of 1.8 g/L of reducing sugars, leading to a hydrogen yield (HY) of 172 mL-H2 g-VS−1. Using PSSF, the fermentation time was shortened by 36 h in which a productivity of 2.4 mL-H2 g-VS−1 h−1 was attained. To the best of our knowledge, the present study is the first report on the use of SSF and PSSF for hydrogen production from microalgal biomass, and the HY obtained in the study is by far the highest yield reported. Our results indicate that PSSF is a promising process for hydrogen production from microalgal biomass.

1. Introduction

Hydrogen is one of the promising energy carriers for modern society [1,2]. Its use has gained increasing attention in the past decades, owing to its high specific energy (142 MJ kg−1) [3,4] and its environmental friendliness, i.e., the combustion of hydrogen gives only water as a by-product [5,6]. To date, the industrial production of hydrogen is by chemical conversion of fossil fuels, i.e., natural gas, coal, and oil [7], through processes like hydrocarbon reforming, desulfurization, pyrolysis, plasma reforming, aqueous phase reforming, and ammonia reforming [8]. However, depleting fossil fuel reserves, coupled with increasing environmental concerns due to fossil fuels consumption, have led to vigorous investigation on hydrogen production via biological routes. Among the biological hydrogen production processes, dark fermentation is considered a promising technology. Dark fermentation gives a high hydrogen production rate, can utilize diverse feedstock including wasted materials, and does not require light [9,10], which in principle is more economical and more sustainable compared with other processes [11].
Over recent decades, microalgal biomass has been regarded as a highly potential feedstock for hydrogen production, owing to its high growth rate and high carbohydrate and protein contents [12]. Moreover, microalgal biomass is superior to other feedstock, e.g., food crops and lignocellulosic biomass, because it has no competition with food crops for arable land, it is not typically used in food production [13], and it has less or no lignin content [14], which enables a more facile saccharification than lignocellulosic biomass [15]. The lack of lignin allows microalgal biomass to be used directly without pretreatment, which could dramatically reduce the cost and time for substrate preparation [16]. A clear example of this advantage can be seen through a comparison between studies of Wieczorek et al. [17] and Cheng et al. [18]. In the work of Wieczorek et al., no pretreatment of Chlorella vulgaris biomass was performed. The biomass was only hydrolyzed enzymatically before use in a fermentation, which resulted in a hydrogen yield (HY) of 135 mL-H2 g-VS−1. On the other hand, Cheng et al. conducted several steps of water hyacinth preparation, i.e., microwave-assisted dilute acid pretreatment (1% H2SO4), enzymatic hydrolysis, and detoxification of the pretreated substrate. Fermentation of the prepared water hyacinth gave a similar HY to that reported in the study of Wieczorek et al. (134.9 mL-H2 g-VS−1). Another advantage of using microalgal biomass is that carbon dioxide (CO2) can be used as the carbon source for the cultivation. This can help reduce the CO2 in the atmosphere [19]. Based on an empirical formula of microalgal biomass, C8.1H15.1O3.8N [20], assuming acetic acid is a sole by-product and a volatile solids (VS) content of 92% (w/w) [21], a stoichiometric yield assuming a complete conversion of the biomass into hydrogen under dark fermentation is around 620 mL g-biomass−1 (670 mL g-VS−1). Compared with a hydrogen yield (HY) of 11 to 135 mL g-VS−1 reported in literature [17,22], it is clear that the HY should be enhanced so that the use of microalgal biomass is more viable.
To increase the HY, pretreatment of the biomass prior to fermentation is widely conducted. Pretreatment can be the use of physical agents, e.g., heat [23], chemical agents (i.e., acids or alkalis [24,25]), biological agents (such as enzymes [17]), or the combination thereof. The use of enzymes is considered more sustainable than the use of chemicals, because it can be performed under milder conditions and no pH neutralization is required for the subsequent fermentation [26]. However, conducting pretreatment or saccharification prior to fermentation in a so-called separate hydrolysis and fermentation (SHF) process is known to have high operational costs and longer processing times (saccharification and fermentation are conducted in separate vessels) [12]. In order to partially solve these problems, a process known as simultaneous saccharification and fermentation (SSF) is implemented. In the SSF process, enzymes and hydrogen producers are added to a bioreactor at the same time to allow saccharification and fermentation to occur simultaneously. This approach was used previously by Quéméneur et al. [27] to produce hydrogen from wheat straw. In the study, an enzyme mixture produced by an engineered Trichoderma strain was added directly to a fermentation system containing heat-treated mesophilic anaerobically-digested sludge composing mainly of Clostridia as hydrogen producers (this process was called a one-stage system in the original paper). With the use of only one bioreactor, capital and operational costs for the SSF process are lower, compared to those of the SHF process. In addition, the time required for the SSF process is shorter, leading to a higher productivity [28]. SSF has been widely investigated for ethanol production from various biomass, including Napier grass [29], cornstalks [30], and cogongrass [31]. However, no reports have been found for its use on microalgal biomass for hydrogen production.
In the present study, a biomass of Chlorella sp. was used as the feedstock as it was reported to have a high growth rate [32] and an ability to tolerate high CO2 (carbon source) and high temperature levels [33]. The process of SSF was investigated for its applicability for hydrogen production from Chlorella sp. biomass. Moreover, the SSF process was further improved by incorporating a pre-hydrolysis step to SSF. This sequential process was called pre-hydrolysis with SSF (PSSF) in the present study. The key results from the SSF and PSSF experiment were compared with those reported in literature to reveal the potential of these processes for hydrogen production. In addition, the applicability of PSSF as an alternative process for hydrogen production from microalgal biomass is subsequently discussed.

2. Materials and Methods

2.1. Microalgae and Inoculum

A dry biomass of Chlorella sp. was produced by Fuqing King Dnarmsa Spirulina Co. Ltd., Fujian, China. The microalgae was grown on coal flue gas [21]. The biomass contained protein, carbohydrate, lipid, and ash at levels of 52.3%, 29.2%, 8.7%, and 5.1% (w/w), respectively. The inoculum for hydrogen production was anaerobic granules collected from an anaerobic digester at Khon Kaen Brewery Co., Ltd., Khon Kaen, Thailand. It was stored at 4 °C until use. The granules were heat treated in a hot air oven at 105 °C for 4 h to inhibit methane-producing microorganisms before being acclimatized in Chlorella sp. biomass suspensions. The acclimatization was conducted by incubating the inoculum in a basic anaerobic (BA) medium [34] containing 10 g L−1 of Chlorella sp. biomass at 35±2 °C. It was transferred to a fresh acclimatization medium four times (every 3 days) before use.

2.2. Effect of Initial Biomass Concentration on Hydrogen Production under SSF

Previous reports demonstrated that increasing the microalgal biomass concentration led to an increased viscosity of the suspension [35]. This could possibly affect the performance of the fermentation. Therefore, this study investigated the effect of microalgal biomass concentrations, ranging from 10 to 50 g L−1 (on a dry basis), on hydrogen production via SSF. Suspensions of Chlorella sp. biomass were transferred into 600 mL serum bottles with a working volume of 350 mL. An enzyme mixture consisting of pre-optimized titers of cellulase, alpha-amylase, and glucoamylase at 80 filter paper unit (FPU) g-biomass−1, 92 U g-biomass−1, and 120 U g-biomass−1, respectively, was added to the bottles. After that, the anaerobic granules were added to the bottle at a substrate (microalgal biomass) to inoculum (S/I) ratio of 4.8 g-volatile-solids (VS) g-VS−1. The enzymes used in the present study were commercially available, namely Cellic® CTec2 (cellulase), Termamyl® SC (alpha-amylase), and Dextrozyme® GA (glucoamylase). All the enzymes were purchased from Novozyme, Denmark. The pre-optimization of enzyme titers was conducted using response surface methodology with a central composite design (unpublished data). After adjusting the pH of the mixture to 6.6 by the addition of 5 M NaOH and mixing well, the bottles were tightly capped with rubber stoppers and aluminum caps. The headspace was flushed with nitrogen gas for 10 min to create anaerobic conditions. The bottles were incubated in a shaking incubator (WIS-10R, Korea) at 35 °C with a rotation speed of 150 rpm. Biogas production was measured regularly using a wetted glass syringe [36]. Gas samples were collected using a gas-tight syringe. The hydrogen content was determined using gas chromatography (GC). The fermentations were allowed to proceed until the cumulative hydrogen productions reached plateaus and no further production was observed. The hydrogen production was then recorded and used for a HY calculation. An appropriate biomass concentration was selected based on the HY.

2.3. Pre-Hydrolysis with Simultaneous Saccharification and Fermentation (PSSF) of Chlorella sp. Biomass

To determine the effect of pre-hydrolysis on hydrogen production, the pH values of the suspensions of Chlorella sp. biomass at an optimum concentration were adjusted to 5.0 using 5 M HCl, then the biomass was hydrolyzed using the enzyme mixture at 50 °C for 12 h. After that, the temperature of the suspensions was lowered to 35 ± 2 °C. Subsequently, the suspensions were inoculated with the anaerobic granules at a S/I ratio of 4.8 g-VS g-VS−1. Then, the pH was adjusted to 6.6 by the addition of 5 M NaOH. The fermentation was carried out until gas was no longer produced (approximately 72 h). Gas samples were taken at regular intervals. All experiments were carried out in triplicate. Average values with their standard deviations are reported.

2.4. Analytical Methods

The composition of Chlorella sp. biomass was determined using standard methods [37] at the Food Research and Testing Laboratory, Faculty of Science, Chulalongkorn University, Thailand. The biomass elemental composition was analyzed using a CHNS-O Analyzer (Flash EA 1112, Thermo Quest, Italy) at the Scientific Equipment Center, Prince of Songkla University, Thailand. Cellulase activity was assayed using a standard method [38]. Alpha-amylase activity was assayed using a soluble starch solution (0.1% (w/v) in sodium phosphate buffer) as the substrate. One unit of alpha-amylase was defined as the amount of enzyme that released 1 mg of reducing sugar (maltose equivalent) per min at 50 °C. Glucoamylase activity was assayed using a 1% (w/v) soluble starch solution as the substrate following the method of Bryjak [39]. One unit of glucoamylase was defined as the amount of enzyme that released 1 mg of glucose per minute under the assay conditions.
The hydrogen content in the biogas was analyzed using GC (Shimadzu GC-2014, Japan) equipped with a thermal conductivity detector (TCD) and a 2 m stainless steel column packed with Shin carbon (50/80 mesh). The operating conditions were set following the study of Sitthikitpanya et al. [40]. The volume of hydrogen produced (mL) was calculated using an equation proposed by Zheng and Yu [41]. The HY (mL g-VS−1) was calculated by dividing the cumulative volume of hydrogen by the initial VS concentration. The values of the kinetic parameters for hydrogen production were estimated by fitting data sets with the modified Gompertz equation (Equation (1)) using the Solver function of Microsoft Office 2016:
H ( t ) = H max exp { exp [ [ HPR · e · ( λ t ) / H max ] + 1 ] }
where H(t) is the HY at time t (mL g-VS−1), Hmax is the maximum HY (mL g-VS−1), HPR is the maximum hydrogen production rate (mL g-VS−1 h−1), λ is the lag time (h), and e is Euler’s number, i.e., 2.71828 [42].
Volatile fatty acid (VFA) concentrations were determined following the method of Nualsri et al. [43]. Reducing sugar concentrations were determined using the dinitrosalicylic acid (DNS) method [44], with glucose as the standard.

3. Results and Discussion

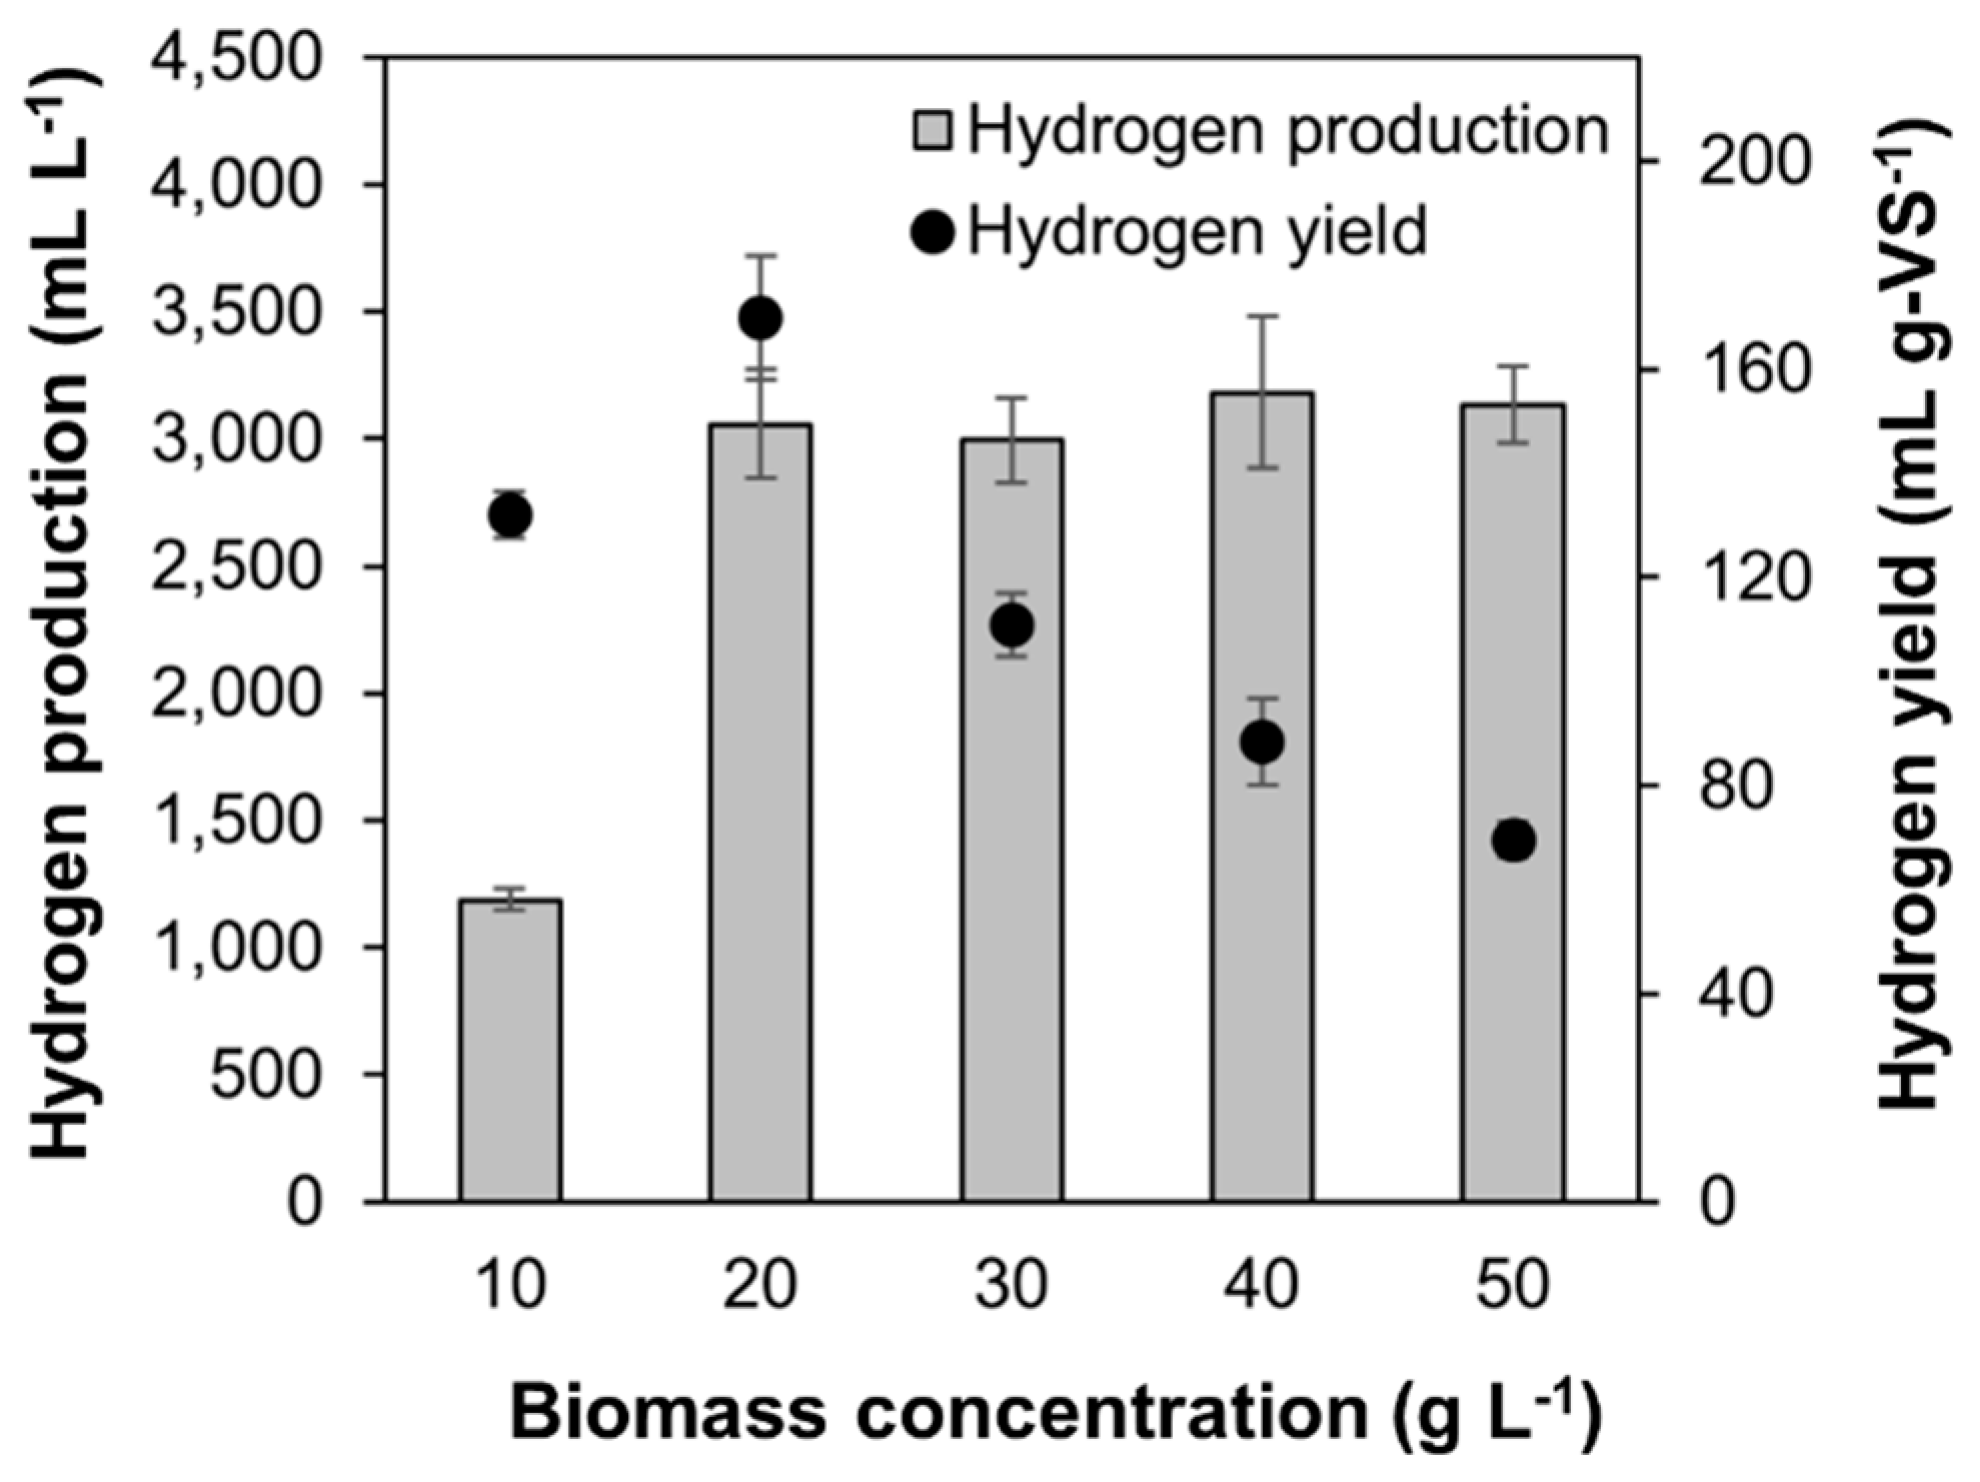
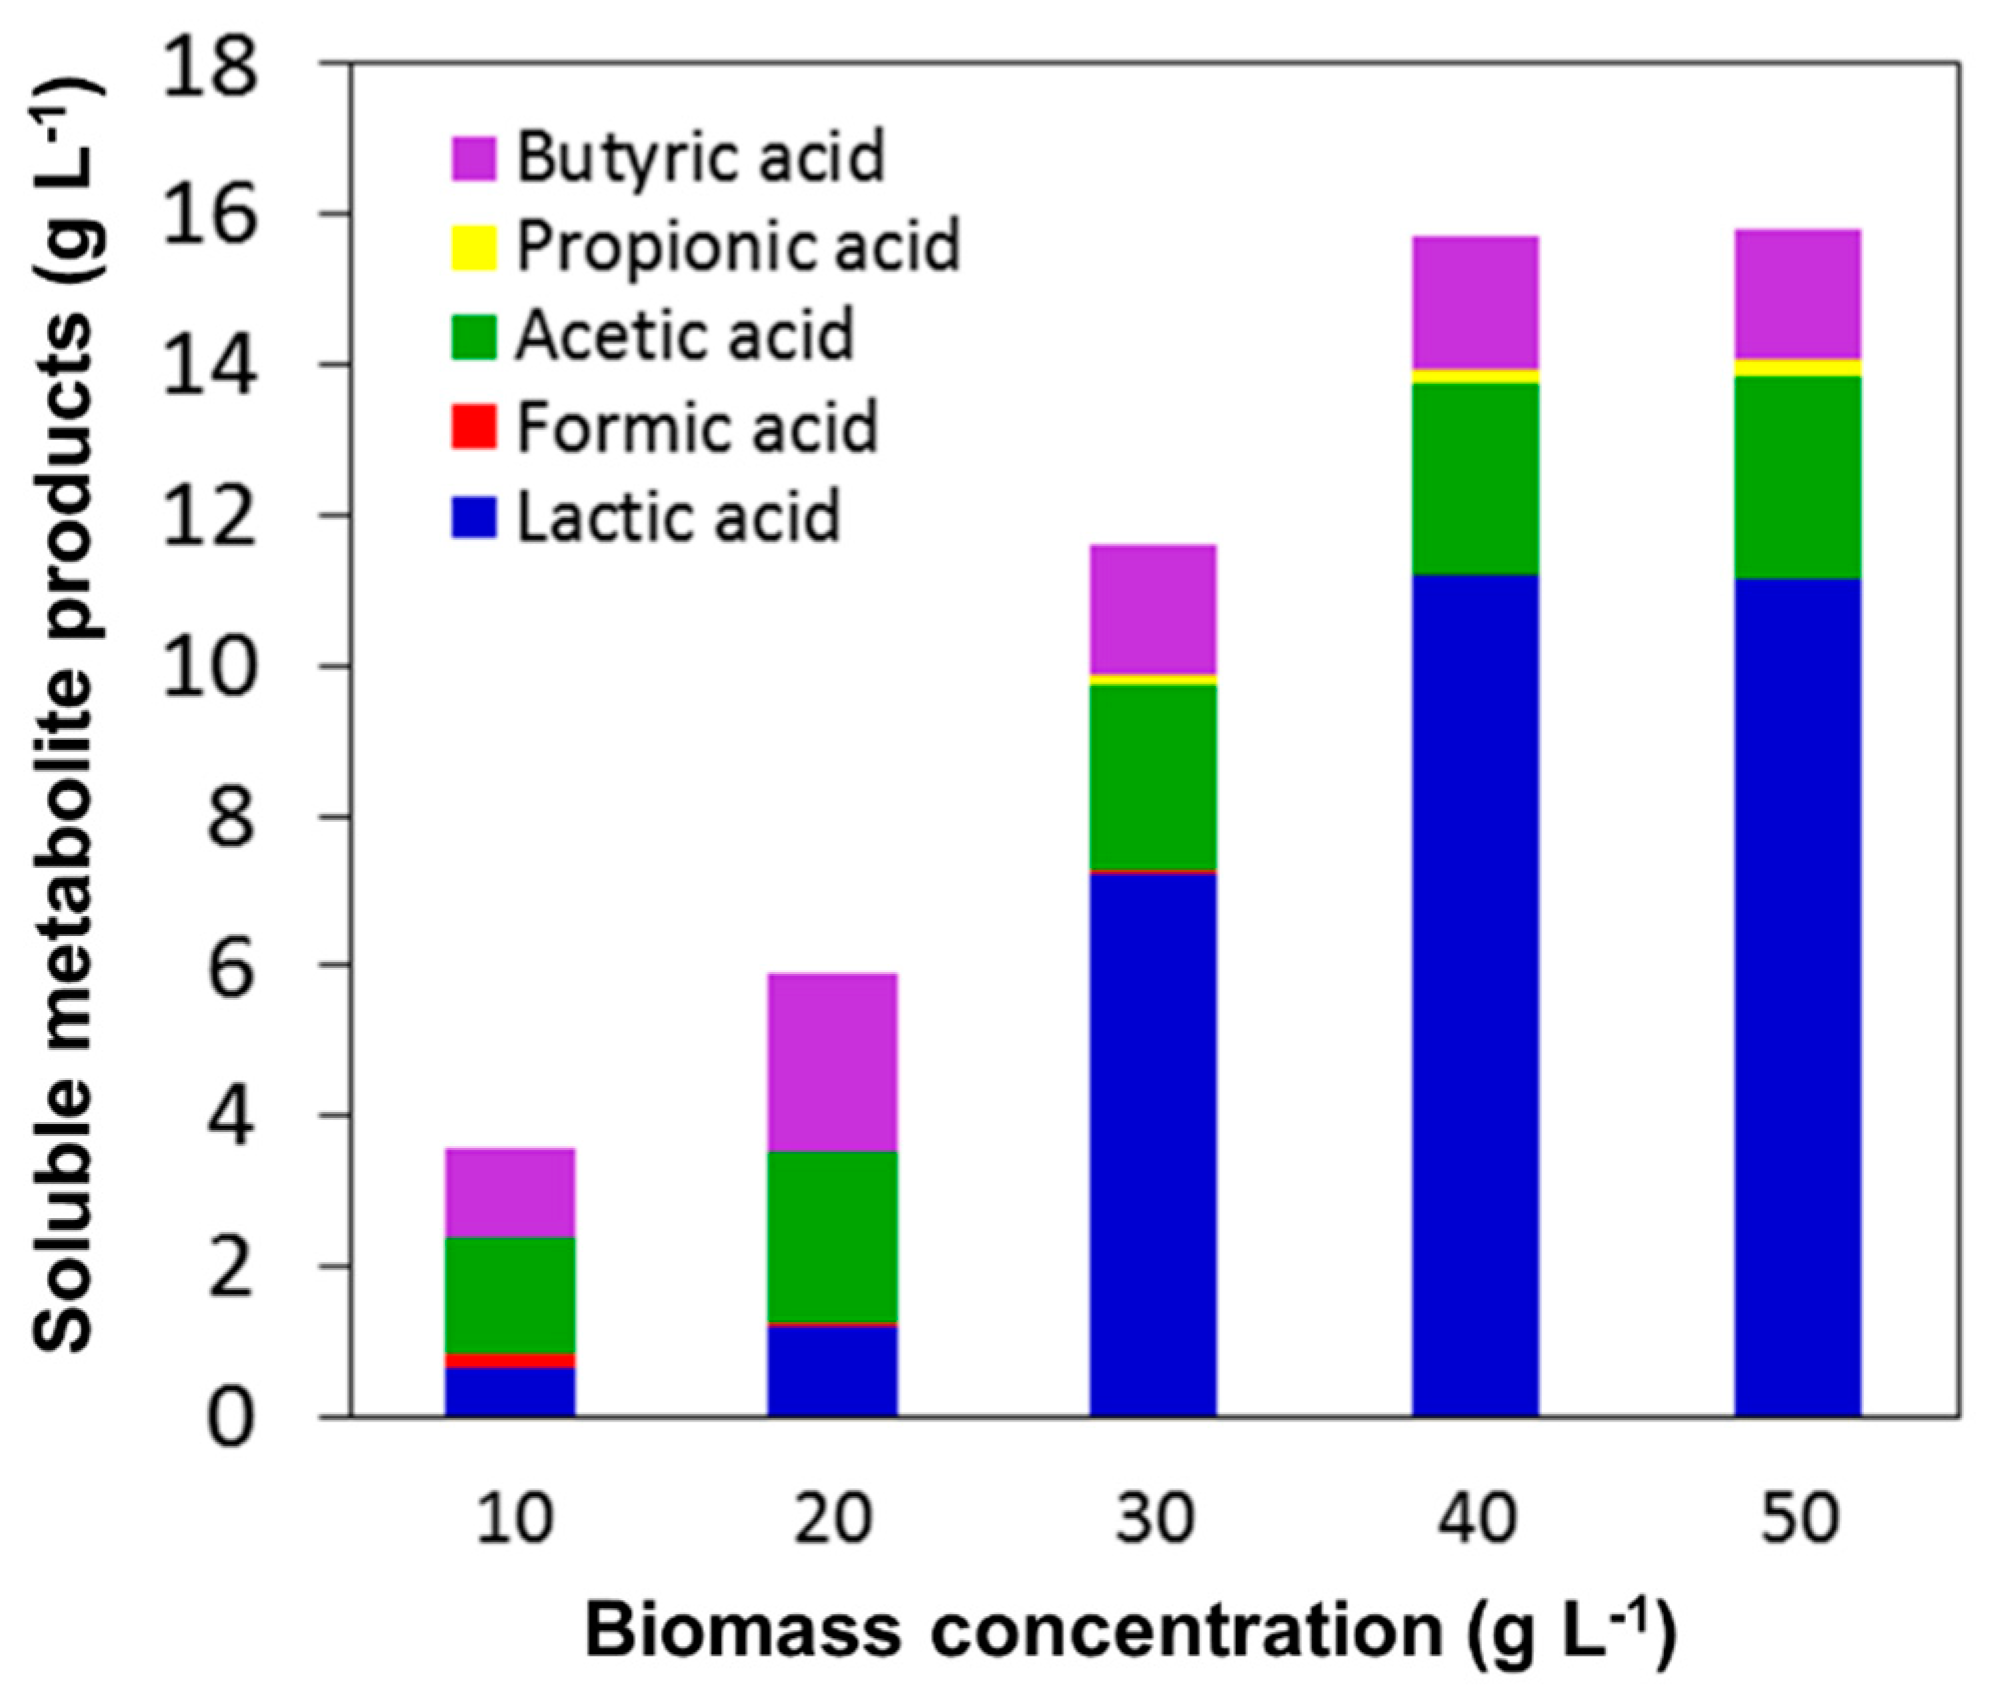
3.1. Effect of Initial Biomass Concentration on Hydrogen Production under SSF

Figure 1 shows that the production of hydrogen increased significantly from 1188 ± 40 mL L−1 (132 ± 4 mL g-VS−1) to 3055 ± 214 mL L−1 (170 ± 12 mL g-VS−1) when the biomass concentration was increased from 10 to 20 g L−1. Further increasing the biomass concentration to 50 g L−1 did not result in a significant improvement in hydrogen production, as it fluctuated within a narrow range of 2992 ± 168 to 3180 ± 88 mL L−1. Alternatively, the HY increased when the biomass concentration was increased from 10 to 20 g L−1 and decreased when it was further increased, eventually reaching 70 ± 3 mL g-VS−1 at 50 g L−1. The low production of hydrogen at 10 g L−1 of biomass was considered as attributing to the low availability of the substrate, while the reduction in the HY at 30–50 g L−1 of biomass might have been due to the increased viscosity of the suspension, as well as the substrate (reducing sugars resulting from the hydrolysis of biomass) and product (organic acids) inhibitions. Initially, it was expected that using higher substrate concentrations would lead to a higher fermentable sugar production and consequently a higher hydrogen production. However, it was reported that the apparent viscosity of microalgal suspension changed as a function of biomass concentration [45], and this is likely to be strain dependent. For example, suspensions of C. vulgaris started to show non-Newtonian behavior at concentrations above 60 g L−1 [46], while the suspensions of C. pyrenoidosa showed non-Newtonian behavior at concentrations above 150 g L−1 [45]. This phenomenon was also observed for other strains of microalgae, e.g., suspensions of Nanochloropsis salina in a range of 9.74–24.01% total solids [47] and Scenedesmus obliquus in a range of 0–150 g L−1 [48]. The increased viscosity could result in insufficient mixing and heat transfer, the reduction in water availability, and the irreversible binding of enzymes to the substrate [49]. These adversely affected bacterial growth and, consequently, hydrogen production [50]. Furthermore, a high substrate concentration could result in the greater production of reducing sugars, which could act as inhibitors for hydrogen production as previously observed in a study of Wang and Wan [51]. The higher production of short chain organic acids could also be possible at higher substrate concentrations. This could result in a drop of pH to a level that is not suitable for hydrogen production [52]. In the present study, it was found that the final pH of the fermentation broths tended to decrease when higher biomass concentrations were used (data not shown), which correlated with the production of organic acids shown in Figure 2. The final pH values of the fermentation broths were in a range of 3.7–4.5, which were much lower than the initial value of 6.6. This could be another reason for the low HY observed at higher biomass concentrations. It is noteworthy that the effect of biomass concentration on the performance of a fermentation varies depending on the types of substrates, microorganisms used, and fermentation conditions [53]. For instance, relatively low biomass concentrations were reported to be suitable for thermophilic hydrogen production, while a much higher concentration was optimum for mesophilic fermentation. Wieczorek, Kucuker, and Kuchta [17] reported that 11 g-biomass L−1 was suitable for thermophilic hydrogen production from the biomass of C. vulgaris. Roy et al. [54] showed that hydrogen production was maximum when 14 g L−1 of C. sorokiniana, previously pretreated with 20% HCl (v/v), was fermented by a thermophilic mixed culture collected from a distillery anaerobic digester. On the other hand, Yun et al. [55] reported that 76 g-biomass L−1 of C. vulgaris biomass was optimum for mesophilic (35 °C) fermentation using sludge from a wastewater treatment plant.
Using the modified Gompertz model (see Section 2.4.), the values for the kinetic parameters for hydrogen production, i.e., Hmax, HPR, and λ, were estimated. Table 1 shows that HPR and lag time were affected by the increasing biomass concentrations. Significantly lower HPRs were observed at 40 and 50 g L−1 of the biomass, while the lag time was lengthened at concentrations above 10 g L−1. As discussed earlier, high substrate concentrations led to higher viscosities and limited mass transfer, which adversely affected bacterial growth and, consequently, hydrogen production [50]. Based on the results shown in Figure 1 and Table 1, the optimum biomass concentration was 20 g L−1.
The concentrations of soluble metabolite products (SMPs) increased with increasing biomass concentrations, with acetic, butyric, and lactic acids as the major components in all experiments (Figure 2). It is common that acetic and butyric acids are the primary VFAs detected in hydrogenic effluent as these are by-products of hydrogen synthesis [56]. Propionic acid can be produced by Clostridium sp. through a hydrogen-consuming reaction [57]. Formic acid is an intermediate product of hydrogen synthesis [58], while lactic acid can be produced by Clostridia through a hydrogen-neutral pathway or by lactic acid bacteria (LAB) contaminating the system [59]. It is notable that the concentration of lactic acid increased to very high levels when the biomass concentration was increased to 30–50 g L−1 (7.23 ± 0.48–11.14 ± 0.93 g L−1). This was speculated to be due to the presence of LAB in the fermentation system and was confirmed by a side experiment. The microalgal biomass (1 g), anaerobic granules (1 g), and 1 mL of the enzyme mixture were mixed with 9 mL of normal saline solution. After 10-fold serial dilutions, 1 mL of the samples were grown on De Man, Rogosa, Sharpe (MRS) agar containing 1% (w/v) CaCO3 at 35 °C for 3–4 days in an anaerobic jar. A visual inspection of the agar plates clearly showed that both the biomass and granules contained LAB. However, no LAB was detected in the mixed enzymes. The findings were consistent with our previous reports [60,61] that the anaerobic granules collected from the anaerobic digester at Khon Kaen Brewery Co., Ltd., Khon Kaen, Thailand contained Lactobacillus spp. The presence of LAB was considered adverse as, aside from their competitive consumption of substrate, lactic acid can lower the pH of a fermentation broth, leading to unfavorable conditions for hydrogen synthesis [62].

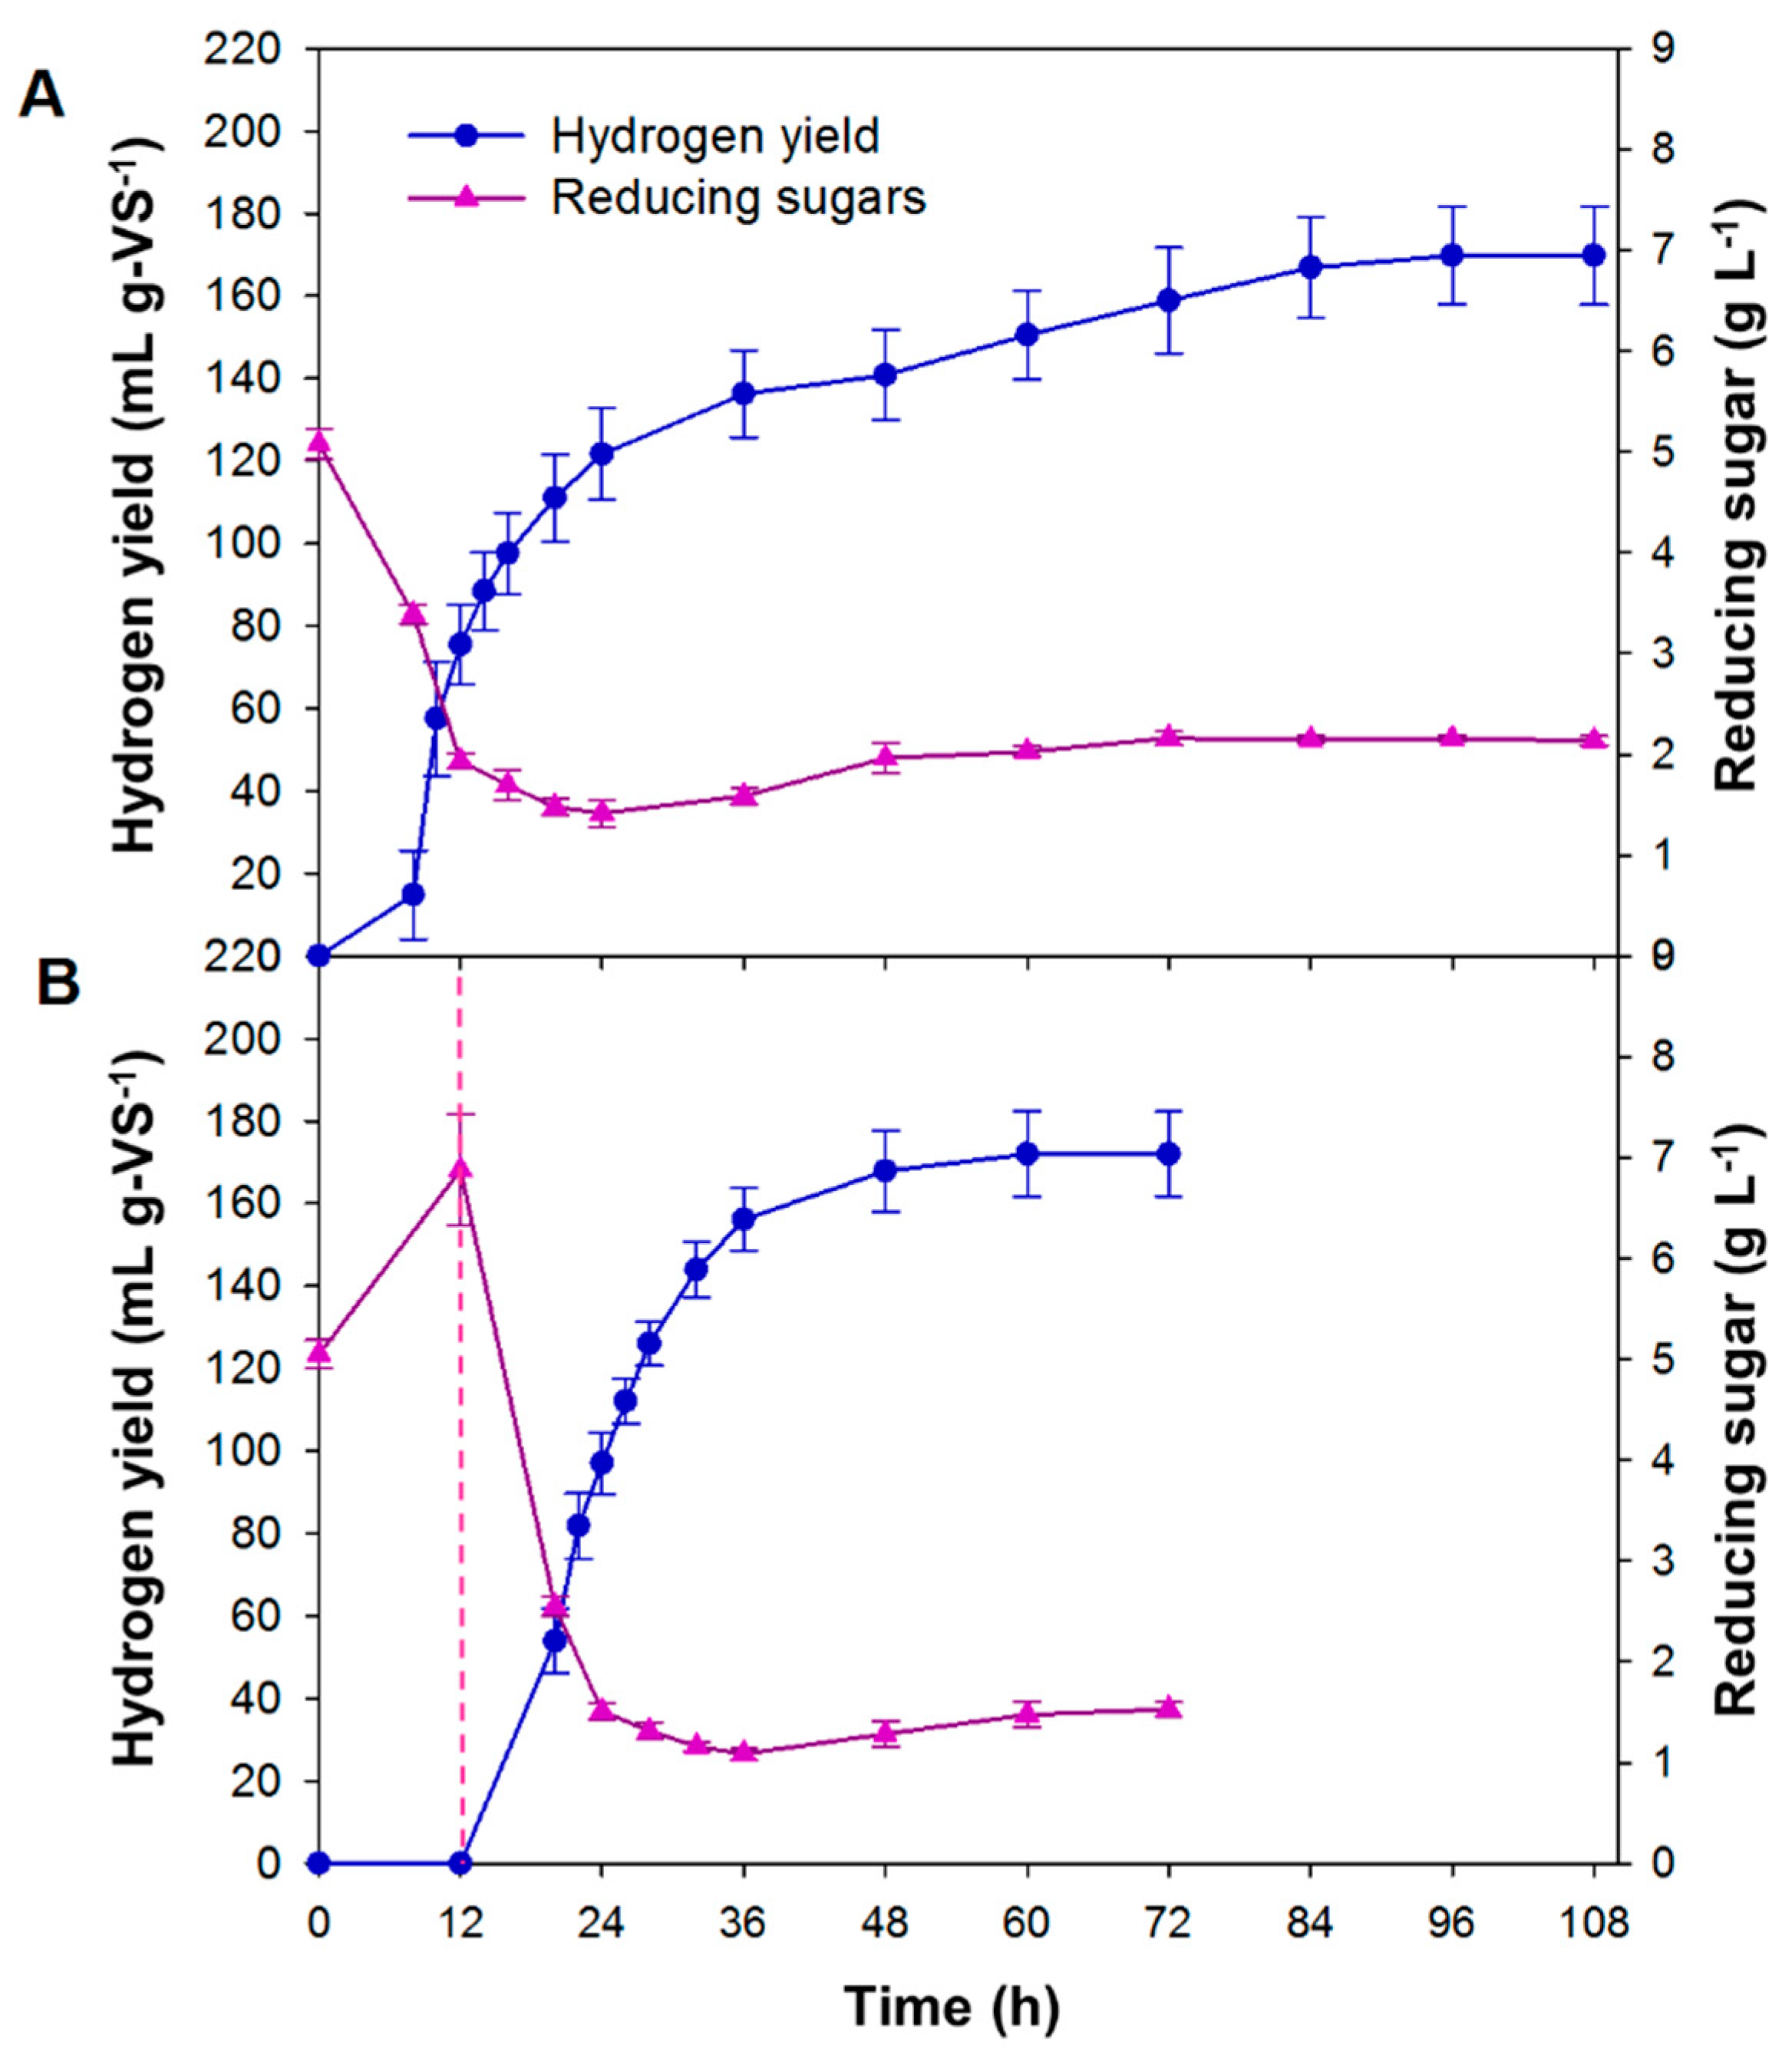
3.2. SSF and PSSF of Chlorella sp. Biomass for Hydrogen Production

Figure 3A shows the changes in the reducing sugar concentration and hydrogen production during the course of SSF using a biomass concentration of 20 g L−1. The concentration of reducing sugars decreased rapidly during the first 24 h, from 5.1 ± 0.2 g L−1 to 1.4 ± 0.1 g L−1, corresponding to a rapid production of hydrogen to 122 ± 11 mL g-VS−1. After that, the reducing sugar concentration increased slightly to 2.0 ± 0.2 g L−1 at 48 h and stayed relatively constant afterward. Nevertheless, the hydrogen production continued to increase, eventually reaching 170 ± 12 mL g-VS−1 (3055 mL L−1) at 108 h. The overall hydrogen productivity was 1.6 mL g-VS−1 h−1. The presence of active enzymes in the system was considered the main reason for the increased hydrogen production during the 48–108 h period, where the concentration of reducing sugars was constant. It should be noted that the reducing sugar concentration reported in the present study was glucose equivalent.
A pre-hydrolysis of the Chlorella sp. biomass was conducted prior to SSF with an aim to improve the production of hydrogen. Previous research reported that the PSSF process showed promising potential for ethanol production from artichoke, spruce chips, and sugarcane bagasse [63,64,65]. In the present study, PSSF gave a similar HY (172 mL g-VS−1) to SSF but the productivity was significantly higher (2.4 mL g-VS−1 h−1). Figure 3B shows that pre-hydrolysis resulted in the production of 1.8 g L−1 of reducing sugars, which was 1.4 times those that were present at the beginning of the SSF experiment. After inoculation, the reducing sugars were rapidly consumed to produce hydrogen. The rate of hydrogen production during this period (12–36 h) was 6.5 mL g-VS−1 h−1. The vigorous production of hydrogen continued until 36 h. Then, the production rate decreased, as reflected by the gradual increase in the hydrogen yield after 36 h. On the other hand, the concentration of reducing sugars started to increase slightly at 36 h. This signified that the utilization of reducing sugars for hydrogen synthesis was low after 36 h and the process should be terminated to maximize productivity. A reason for the slight increase in reducing sugars after 36 h might be that the accumulation of SMPs in the fermentation broth reached a level that was inhibitory to cells. As a consequence, the production of hydrogen was limited, leading to a lower rate of reducing sugar consumption, compared with the rate of sugar production by the enzymes present in the system. It should be noted that the concentration of reducing sugars shown in Figure 3A,B are the net concentrations, which were the concentration of sugars remaining after the production by enzymatic hydrolysis and microbial consumption. The relatively constant concentration therefore indicates the same rates of sugar production and consumption, while the increase in the concentration indicates that the sugar consumption rate is lower than the sugar production rate.
The results obtained in the PSSF experiments clearly revealed that this process has a better hydrogen productivity than SSF. The fermentation time was reduced by 36 h (from 108 to 72 h), which benefits the economics of the process. The concentration of SMPs in the hydrogenic effluents under SSF and PSSF were similar at 5.96 g L−1 and 5.58 g L−1, respectively. The major components were acetic and butyric acids, which accounted for over 70% of the total VFAs (Table 2). This indicates that the fermentation under both SSF and PSSF was an acetate-butyrate type.
Table 3 shows the results of the hydrogen production from the Chlorella sp. biomass obtained in this study, along with those reported in the literature using the SHF process. It is clear that the processes used in the present study (SSF and PSSF) gave far higher HY compared to those reported earlier. Using SHF, the HY was in the range of 42–125 mL g-biomass−1 [17,24,66,67], obviously lower than that obtained in the present study under SSF (153 mL g-biomass−1) and PSSF (154.8 mL g-biomass−1). This was considered as due to the fact that the active enzymes present in the system continued to hydrolyze the biomass during SSF, producing additional reducing sugars for hydrogen production. The presence of active enzymes and the production of additional reducing sugars during the course of fermentation are the main differences between the present study and the previous studies using a conventional SHF process for hydrogen production. In addition, the use of enzymes in the present study did not generate microbial inhibitors as would be the case in a process using chemical pretreatment, and, since SSF avoids substrate (sugar) inhibition [65], the production of hydrogen proceeded with either no or less inhibition. It was also noticeable that the HY of this study was higher than the 135 mL g-VS−1 reported by Wieczorek et al. [17], where Onozuka R-10 (cellulase from Trichoderma viride) and Macerozyme R-10 (pectinase from Rhizopus sp.) were used. This could have been due to the difference in the types of enzymes, inoculum, composition of microalgal biomass, and the operating conditions during the fermentation [68]. It is noteworthy that the carbohydrate content of the biomass used in this study was 29.2%, which was around twice that of the biomass used in the study of Wieczorek et al. [17] (13.4%). Based on the HY and hydrogen productivity shown in Table 3, it can be concluded that the SSF and PSSF processes are more effective than the SHF process in producing hydrogen from Chlorella sp. biomass. Further comparison between SSF and PSSF revealed that the latter is even more effective as it increased hydrogen productivity by 50% from 1.6 to 2.4 mL g-VS−1 h−1. It is noteworthy that, to the best of our knowledge, the use of the PSSF process for hydrogen production from Chlorella sp. biomass has never been reported in the literature. Therefore, the investigation of the PSSF process in the present study can provide extended knowledge on process development for enhancing hydrogen production from microalgal biomass.

3.3. Applicability of PSSF for Hydrogen Production from Chlorella sp. Biomass

Analysis of the elemental composition of the biomass revealed that it contained 47.2% carbon, 6.5% hydrogen, 0.6% sulfur, 30.2% oxygen, and 8.4% nitrogen. Based on this, the elemental formula of the biomass was C6.55H10.83O3.15N. Assuming acetic acid was the sole by-product of hydrogen fermentation, 747 mL-H2 g-dry-mass−1 could theoretically be obtained (Equation (2)):
100   C 6.55 H 10.83 O 3.15 N + 557   H 2 O 218   CH 3 COOH + 513   H 2 + 218   CO 2 + 100   NH 3
In the present study, 154.8 mL-H2 g-dry-mass−1 (172 mL-H2 g-VS−1) was attained under PSSF, which is only around 21% of the theoretical value. However, the theoretical maximum assumes that all the components in the biomass can be converted to hydrogen, which is unlikely. Considering that carbohydrate is the most readily assimilable nutrient for hydrogen production [70], while proteins and lipids contribute negligibly to its production [71], the calculation of theoretical HY should be based on the carbohydrate content of the substrate. With 29.2% carbohydrate, equivalent to 324.1 mg g-biomass−1, 182 mL g-biomass−1 of hydrogen would be obtained through the reaction shown in Equation (3), assuming acetic acid was the sole by-product:
0.0018 C 6 H 12 O 6 + 0.0036 H 2 O 0.0036 CH 3 COOH + 0.0036 CO 2 + 0.0072 H 2
In this respect, the HY of 154.8 mL-H2 g-biomass−1 was approximately 85% of the theoretical value. This suggests that most of the carbohydrate in the biomass was converted to hydrogen in this PSSF process, and that it is a promising method for hydrogen production from Chlorella sp. biomass. However, it is worth noting that the enzymes used in the present study could also contain reducing sugars, which could partly attribute to the hydrogen produced in the process. To further increase the applicability of PSSF for hydrogen production, based on results shown in Figure 3B, it was considered that the process can be conducted in a fed-batch manner, with pulse or continuous feedings, in order to reduce the possible effects of a high solids concentration [72] on the hydrogen producer, and for the cells to be able to consume the nutrients available in the system more efficiently. Mixing the microalgal biomass with carbon-rich feedstock, e.g., cassava pulp, and using it as a co-substrate can also be advantageous for the fermentation. These concepts are under investigation in our laboratory.

4. Conclusions

In the present study, simultaneous saccharification and fermentation (SSF) and pre-hydrolysis with SSF (PSSF) processes were used to produce hydrogen from the biomass of Chlorella sp. SSF of 20 g L−1 of biomass with the use of cellulase, alpha-amylase, and glucoamylase gave a hydrogen yield (HY) of 153 mL g-biomass−1 (170 mL g-VS−1), with a productivity of 1.6 mL g-VS−1 h−1. When a pre-hydrolysis step was conducted preceding a conventional SSF process, a similar HY (154.8 mL g-biomass−1, equivalent to 172 mL-H2 g-VS−1) was attained. Nevertheless, hydrogen productivity dramatically improved in the PSSF process. Additionally, the HY of 154.8 mL g-biomass−1 obtained through the PSSF process is by far the highest HY from microalgal biomass reported in literature. This suggests that PSSF has a strong potential for producing hydrogen from Chlorella sp. biomass.

Author Contributions

A.R. and A.S. conceived and designed the experiments; T.T.G. performed the experiments; A.S., S.L., and T.T.G. analyzed the data; T.T.G. prepared the original draft; T.T.G, S.L., Q.L., A.R., and A.S. have read, corrected, and approved the manuscript.

Funding

This work was financially supported by the Khon Kaen University (KKU) scholarship for ASEAN and GMS Countries’ Personnel of Academic Year 2015, the Faculty of Technology Scholarship of Academic Year 2015, and the Department of Biotechnology (Scholarship No. 3/2015); the Thailand Research Fund Senior Research Scholar (RTA5980004); and the Post-Doctoral Program from the Research Affairs and Graduate School, Khon Kaen University, Thailand (Grant No. 58115).

Acknowledgments

The authors would like to acknowledge the Research Group for the Development of Microbial Hydrogen Production Processes from Biomass, Khon Kaen University, Thailand, for the provision of equipment and materials used in this work.

Conflicts of Interest

The authors declare no conflict of interest.

References

  1. Fayaz, H.; Saidur, R.; Razali, N.; Anuar, F.S.; Saleman, A.R.; Islam, M.R. An overview of hydrogen as a vehicle fuel. Renew. Sustain. Energy Rev. 2012, 16, 5511–5528. [Google Scholar] [CrossRef]
  2. Salvi, B.L.; Subramanian, K.A. Sustainable development of road transportation sector using hydrogen energy system. Renew. Sustain. Energy Rev. 2015, 51, 1132–1155. [Google Scholar] [CrossRef]
  3. Nagarajan, D.; Lee, D.J.; Kondo, A.; Chang, J.S. Recent insights into biohydrogen production by microalgae—From biophotolysis to dark fermentation. Bioresour. Technol. 2017, 227, 373–387. [Google Scholar] [CrossRef] [PubMed]
  4. Kumar, G.; Zhen, G.; Sivagurunathan, P.; Bakonyi, P.; Nemestóthy, N.; Bélafi-Bakó, K.; Kobayashi, T.; Xu, K.-Q. Biogenic H2 production from mixed microalgae biomass: Impact of pH control and methanogenic inhibitor (BESA) addition. Biofuel Res. J. 2016, 3, 470–474. [Google Scholar] [CrossRef]
  5. Moreira, F.S.; Machado, R.G.; Romão, B.B.; Batista, F.R.X.; Ferreira, J.S.; Cardoso, V.L. Improvement of hydrogen production by biological route using repeated batch cycles. Process Biochem. 2017, 58, 60–68. [Google Scholar] [CrossRef]
  6. Qiu, C.; Shi, P.; Xiao, S.; Sun, L. Effects of pH and substrate concentrations on dark fermentative biohydrogen production from xylose by extreme thermophilic mixed culture. World J. Microbiol. Biotechnol. 2017, 33, 1–7. [Google Scholar] [CrossRef] [PubMed]
  7. Voloshin, R.A.; Rodionova, M.V.; Zharmukhamedov, S.K.; Nejat Veziroglu, T.; Allakhverdiev, S.I. Review: Biofuel production from plant and algal biomass. Int. J. Hydrogen Energy 2016, 41, 17257–17273. [Google Scholar] [CrossRef]
  8. Holladay, J.D.; Hu, J.; King, D.L.; Wang, Y. An overview of hydrogen production technologies. Catal. Today 2009, 139, 244–260. [Google Scholar] [CrossRef]
  9. Rittmann, S.; Herwig, C. A comprehensive and quantitative review of dark fermentative biohydrogen production. Microb. Cell Fact. 2012, 11, 115. [Google Scholar] [CrossRef] [Green Version]
  10. Stephen, A.J.; Archer, S.A.; Orozco, R.L.; Macaskie, L.E. Advances and bottlenecks in microbial hydrogen production. Microb. Biotechnol. 2017, 10, 1120–1127. [Google Scholar] [CrossRef] [Green Version]
  11. Balachandar, G.; Khanna, N.; Das, D. Biohydrogen production from organic wastes by dark fermentation. In Biohydrogen; Pandey, A., Chang, J.-S., Hallenbeck, P., Larroche, C., Eds.; Elsevier: Amsterdam, The Netherlands, 2013; pp. 103–144. ISBN 9780444595553. [Google Scholar]
  12. El-Dalatony, M.; Salama, E.-S.; Kurade, M.; Hassan, S.; Oh, S.-E.; Kim, S.; Jeon, B.-H. Utilization of microalgal biofractions for bioethanol, higher alcohols, and biodiesel production: A review. Energies 2017, 10, 2110. [Google Scholar] [CrossRef]
  13. Medipally, S.R.; Yusoff, F.M.; Banerjee, S.; Shariff, M. Microalgae as sustainable renewable energy feedstock for biofuel production. BioMed Res. Int. 2015, 2015, 519513. [Google Scholar] [CrossRef] [PubMed]
  14. Yeong, T.K.; Jiao, K.; Zeng, X.; Lin, L.; Pan, S.; Danquah, M.K. Microalgae for biobutanol production—Technology evaluation and value proposition. Algal Res. 2018, 31, 367–376. [Google Scholar] [CrossRef]
  15. Sambusiti, C.; Bellucci, M.; Zabaniotou, A.; Beneduce, L.; Monlau, F. Algae as promising feedstocks for fermentative biohydrogen production according to a biorefinery approach: A comprehensive review. Renew. Sustain. Energy Rev. 2015, 44, 20–36. [Google Scholar] [CrossRef]
  16. Argun, H.; Gokfi, P.; Karapinar, I. Biohydrogen production potential of different biomass sources. In Biohydrogen Production: Sustainability of Current Technology and Future Perspective; Singh, A., Rathore, D., Eds.; Springer: New Delhi, India, 2016; pp. 11–48. ISBN 978-81-322-3575-0. [Google Scholar]
  17. Wieczorek, N.; Kucuker, M.A.; Kuchta, K. Fermentative hydrogen and methane production from microalgal biomass (Chlorella vulgaris) in a two-stage combined process. Appl. Energy 2014, 132, 108–117. [Google Scholar] [CrossRef]
  18. Cheng, J.; Lin, R.; Song, W.; Xia, A.; Zhou, J.; Cen, K. Enhancement of fermentative hydrogen production from hydrolyzed water hyacinth with activated carbon detoxification and bacteria domestication. Int. J. Hydrogen Energy 2015, 40, 2545–2551. [Google Scholar] [CrossRef]
  19. Dickinson, S.; Mientus, M.; Frey, D.; Amini-Hajibashi, A.; Ozturk, S.; Shaikh, F.; Sengupta, D.; El-Halwagi, M.M. A review of biodiesel production from microalgae. Clean Technol. Environ. Policy 2017, 19, 637–668. [Google Scholar] [CrossRef]
  20. Heaven, S.; Milledge, J.; Zhang, Y. Comments on “Anaerobic digestion of microalgae as a necessary step to make microalgal biodiesel sustainable”. Biotechnol. Adv. 2011, 29, 164–167. [Google Scholar] [CrossRef]
  21. Phanduang, O.; Lunprom, S.; Salakkam, A.; Reungsang, A. Anaerobic solid-state fermentation of bio-hydrogen from microalgal Chlorella sp. biomass. Int. J. Hydrogen Energy 2017, 42, 9650–9659. [Google Scholar] [CrossRef]
  22. Lakaniemi, A.-M.; Hulatt, C.J.; Thomas, D.N.; Tuovinen, O.H.; Puhakka, J.A. Biogenic hydrogen and methane production from Chlorella vulgaris and Dunaliella tertiolecta biomass. Biotechnol. Biofuels 2011, 4, 34. [Google Scholar] [CrossRef]
  23. Pagliaccia, P.; Gallipoli, A.; Gianico, A.; Montecchio, D.; Braguglia, C.M. Single stage anaerobic bioconversion of food waste in mono and co-digestion with olive husks: Impact of thermal pretreatment on hydrogen and methane production. Int. J. Hydrogen Energy 2016, 41, 905–915. [Google Scholar] [CrossRef] [Green Version]
  24. Choi, J.M.; Han, S.K.; Kim, J.T.; Lee, C.Y. Optimization of combined (acid + thermal) pretreatment for enhanced dark fermentative H2 production from Chlorella vulgaris using response surface methodology. Int. Biodeterior. Biodegrad. 2016, 108, 191–197. [Google Scholar] [CrossRef]
  25. Sivagurunathan, P.; Kumar, G.; Kobayashi, T.; Xu, K.; Kim, S.H. Effects of various dilute acid pretreatments on the biochemical hydrogen production potential of marine macroalgal biomass. Int. J. Hydrogen Energy 2017, 42, 27600–27606. [Google Scholar] [CrossRef]
  26. Jegannathan, K.R.; Nielsen, P.H. Environmental assessment of enzyme use in industrial production-a literature review. J. Clean. Prod. 2013, 42, 228–240. [Google Scholar] [CrossRef]
  27. Quéméneur, M.; Bittel, M.; Trably, E.; Dumas, C.; Fourage, L.; Ravot, G.; Steyer, J.-P.; Carrère, H. Effect of enzyme addition on fermentative hydrogen production from wheat straw. Int. J. Hydrogen Energy 2012, 37, 10639–10647. [Google Scholar] [CrossRef]
  28. de Barros, E.M.; Carvalho, V.M.; Rodrigues, T.H.S.; Rocha, M.V.P.; Gonçalves, L.R.B. Comparison of strategies for the simultaneous saccharification and fermentation of cashew apple bagasse using a thermotolerant Kluyveromyces marxianus to enhance cellulosic ethanol production. Chem. Eng. J. 2017, 307, 939–947. [Google Scholar] [CrossRef]
  29. Tsai, M.H.; Lee, W.C.; Kuan, W.C.; Sirisansaneeyakul, S.; Savarajara (Akaracharanya), A. Evaluation of different pretreatments of Napier grass for enzymatic saccharification and ethanol production. Energy Sci. Eng. 2018, 6, 683–692. [Google Scholar] [CrossRef]
  30. Chen, K.; Liu, D.; Chen, X.; Fan, Z. Kinetic analysis of Fe(II)-promoted ethanol preparation from cornstalks. BioResources 2018, 13, 4973–4985. [Google Scholar] [CrossRef]
  31. Lin, Y.S.; Lee, W.C. Simultaneous saccharification and fermentation of alkali-pretreated cogongrass for bioethanol production. BioResources 2011, 6, 2744–2756. [Google Scholar] [CrossRef]
  32. Fulke, A.B.; Mudliar, S.N.; Yadav, R.; Shekh, A.; Srinivasan, N.; Ramanan, R.; Krishnamurthi, K.; Devi, S.S.; Chakrabarti, T. Bio-mitigation of CO2, calcite formation and simultaneous biodiesel precursors production using Chlorella sp. Bioresour. Technol. 2010, 101, 8473–8476. [Google Scholar] [CrossRef] [PubMed]
  33. Chinnasamy, S.; Ramakrishnan, B.; Bhatnagar, A.; Das, K.; Chinnasamy, S.; Ramakrishnan, B.; Bhatnagar, A.; Das, K.C. Biomass production potential of a wastewater alga Chlorella vulgaris ARC 1 under elevated levels of CO2 and temperature. Int. J. Mol. Sci. 2009, 10, 518–532. [Google Scholar] [CrossRef] [PubMed]
  34. Fangkum, A.; Reungsang, A. Biohydrogen production from mixed xylose/arabinose at thermophilic temperature by anaerobic mixed cultures in elephant dung. Int. J. Hydrogen Energy 2011, 36, 13928–13938. [Google Scholar] [CrossRef]
  35. Zhang, H.; Liao, Q.; Fu, Q.; Chen, H.; Huang, Y.; Xia, A.; Zhu, X.; Reungsang, A.; Liu, Z.; Li, J. Rheological properties of microalgae slurry under subcritical conditions for hydrothermal hydrolysis systems. Algal Res. 2018, 33, 78–83. [Google Scholar] [CrossRef]
  36. Owen, W.F.; Stuckey, D.C.; Healy, J.B.; Young, L.Y.; McCarty, P.L. Bioassay for monitoring biochemical methane potential and anaerobic toxicity. Water Res. 1979, 13, 485–492. [Google Scholar] [CrossRef]
  37. Association of Official Analysis Chemists. Standard Methods for the Examination of Water and Wastewater, 19th ed.; American Public Health Association: Washington, DC, USA, 2012; ISBN 0935584544. [Google Scholar]
  38. Adney, B.; Baker, J. Measurement of Cellulase Activities Laboratory; National Renewable Energy Laboratory: Golden, CO, USA, 2008.
  39. Bryjak, J. Glucoamylase, α-amylase and β-amylase immobilisation on acrylic carriers. Biochem. Eng. J. 2003, 16, 347–355. [Google Scholar] [CrossRef]
  40. Sitthikitpanya, S.; Reungsang, A.; Prasertsan, P.; Khanal, S.K. Two-stage thermophilic bio-hydrogen and methane production from oil palm trunk hydrolysate using Thermoanaerobacterium thermosaccharolyticum KKU19. Int. J. Hydrogen Energy 2017, 42, 28222–28232. [Google Scholar] [CrossRef]
  41. Zheng, X.J.; Yu, H.Q. Inhibitory effects of butyrate on biological hydrogen production with mixed anaerobic cultures. J. Environ. Manag. 2005, 74, 65–70. [Google Scholar] [CrossRef]
  42. Khanal, S.K.; Chen, W.H.; Li, L.; Sung, S. Biological hydrogen production: Effects of pH and intermediate products. Int. J. Hydrogen Energy 2004, 29, 1123–1131. [Google Scholar] [CrossRef]
  43. Nualsri, C.; Kongjan, P.; Reungsang, A. Direct integration of CSTR-UASB reactors for two-stage hydrogen and methane production from sugarcane syrup. Int. J. Hydrogen Energy 2016, 41, 17884–17895. [Google Scholar] [CrossRef]
  44. Miller, G.L. Use of dinitrosalicylic acid reagent for determination of reducing sugar. Anal. Chem. 1959, 31, 426–428. [Google Scholar] [CrossRef]
  45. Wu, Z.; Shi, X. Rheological properties of Chlorella pyrenoidosa culture grown heterotrophically in a fermentor. J. Appl. Phycol. 2008, 20, 279–282. [Google Scholar] [CrossRef]
  46. Wileman, A.; Ozkan, A.; Berberoglu, H. Rheological properties of algae slurries for minimizing harvesting energy requirements in biofuel production. Bioresour. Technol. 2012, 104, 432–439. [Google Scholar] [CrossRef] [PubMed]
  47. Schneider, N.; Gerber, M. Correlation between viscosity, temperature and total solid content of algal biomass. Bioresour. Technol. 2014, 170, 293–302. [Google Scholar] [CrossRef] [PubMed]
  48. Adesanya, V.O.; Vadillo, D.C.; Mackley, M.R. The rheological characterization of algae suspensions for the production of biofuels. J. Rheol. 2012, 56, 925–939. [Google Scholar] [CrossRef]
  49. Srinorakutara, T.; Subkaree, Y.; Boonvitthya, N.; Kunhanon, T.; Bamrungchue, N. Effect of commercial cellulase enzymes on ethanol production from pretreated rice straw at high solid loading. J. Food Sci. Eng. 2015, 5, 67–75. [Google Scholar] [CrossRef]
  50. Park, C.; Lee, J.H.; Yang, X.; Yoo, H.Y.; Lee, J.H.; Lee, S.K.; Kim, S.W. Enhancement of hydrolysis of Chlorella vulgaris by hydrochloric acid. Bioprocess Biosyst. Eng. 2016, 39, 1015–1021. [Google Scholar] [CrossRef]
  51. Wang, J.; Wan, W. The effect of substrate concentration on biohydrogen production by using kinetic models. Sci. China Ser. B Chem. 2008, 51, 1110–1117. [Google Scholar] [CrossRef]
  52. Reungsang, A.; Sreela-or, C. Bio-hydrogen production from pineapple waste extract by anaerobic mixed cultures. Energies 2013, 6, 2175–2190. [Google Scholar] [CrossRef]
  53. Sangyoka, S.; Reungsang, A.; Lin, C.-Y. Optimization of biohydrogen production from sugarcane bagasse by mixed cultures using a statistical method. Sustain. Environ. Res. 2016, 26, 235–242. [Google Scholar] [CrossRef] [Green Version]
  54. Roy, S.; Kumar, K.; Ghosh, S.; Das, D. Thermophilic biohydrogen production using pre-treated algal biomass as substrate. Biomass Bioenergy 2014, 61, 157–166. [Google Scholar] [CrossRef]
  55. Yun, Y.M.; Jung, K.W.; Kim, D.H.; Oh, Y.K.; Shin, H.S. Microalgal biomass as a feedstock for bio-hydrogen production. Int. J. Hydrogen Energy 2012, 37, 15533–15539. [Google Scholar] [CrossRef]
  56. Ghimire, A.; Frunzo, L.; Pirozzi, F.; Trably, E.; Escudie, R.; Lens, P.N.L.; Esposito, G. A review on dark fermentative biohydrogen production from organic biomass: Process parameters and use of by-products. Appl. Energy 2015, 144, 73–95. [Google Scholar] [CrossRef]
  57. Cappai, G.; Gioannis, G.D.; Muntoni, A.; Polettini, A.; Pomi, R.; Spiga, D. Effect of inoculum to substrate ratio (ISR) on hydrogen production through dark fermentation of food waste. In Proceedings of the Fifteenth International Waste Management and Landfill Symposium, Cagliari, Italy, 5–9 October 2015. [Google Scholar]
  58. Hallenbeck, P.C. Fermentative hydrogen production: Principles, progress, and prognosis. Int. J. Hydrogen Energy 2009, 34, 7379–7389. [Google Scholar] [CrossRef]
  59. Sikora, A.; Błaszczyk, M.; Jurkowski, M.; Zielenkiewicz, U. Lactic acid bacteria in hydrogen-producing consortia: On purpose or by coincidence. In Lactic Acid Bacteria—R&D for Food, Health and Livestock Purposes; Kongo, M., Ed.; InTech: Rijeka, Croatia, 2013; ISBN 9789533070940. [Google Scholar]
  60. Nualsri, C.; Reungsang, A.; Plangklang, P. Biochemical hydrogen and methane potential of sugarcane syrup using a two-stage anaerobic fermentation process. Ind. Crops Prod. 2016, 82, 88–99. [Google Scholar] [CrossRef] [Green Version]
  61. Reungsang, A.; Sreela-Or, C.; Plangklang, P. Non-sterile bio-hydrogen fermentation from food waste in a continuous stirred tank reactor (CSTR): Performance and population analysis. Int. J. Hydrogen Energy 2013, 38, 15630–15637. [Google Scholar] [CrossRef]
  62. Cabrol, L.; Marone, A.; Tapia-Venegas, E.; Steyer, J.P.; Ruiz-Filippi, G.; Trably, E. Microbial ecology of fermentative hydrogen producing bioprocesses: Useful insights for driving the ecosystem function. FEMS Microbiol. Rev. 2017, 41, 158–181. [Google Scholar] [CrossRef] [PubMed]
  63. Cotana, F.; Cavalaglio, G.; Gelosia, M.; Coccia, V.; Petrozzi, A.; Ingles, D.; Pompili, E. A comparison between SHF and SSSF processes from cardoon for ethanol production. Ind. Crops Prod. 2015, 69, 424–432. [Google Scholar] [CrossRef]
  64. Hoyer, K.; Galbe, M.; Zacchi, G. The effect of prehydrolysis and improved mixing on high-solids batch simultaneous saccharification and fermentation of spruce to ethanol. Process Biochem. 2013, 48, 289–293. [Google Scholar] [CrossRef]
  65. de Souza, C.J.A.; Costa, D.A.; Rodrigues, M.Q.R.B.; dos Santos, A.F.; Lopes, M.R.; Abrantes, A.B.P.; dos Santos Costa, P.; Silveira, W.B.; Passos, F.M.L.; Fietto, L.G. The influence of presaccharification, fermentation temperature and yeast strain on ethanol production from sugarcane bagasse. Bioresour. Technol. 2012, 109, 63–69. [Google Scholar] [CrossRef]
  66. Yun, Y.-M.; Jung, K.-W.; Kim, D.-H.; Oh, Y.-K.; Cho, S.-K.; Shin, H.-S. Optimization of dark fermentative H2 production from microalgal biomass by combined (acid + ultrasonic) pretreatment. Bioresour. Technol. 2013, 141, 220–226. [Google Scholar] [CrossRef]
  67. Chen, C.Y.; Chang, H.Y.; Chang, J.S. Producing carbohydrate-rich microalgal biomass grown under mixotrophic conditions as feedstock for biohydrogen production. Int. J. Hydrogen Energy 2016, 41, 4413–4420. [Google Scholar] [CrossRef] [Green Version]
  68. Sharma, A.; Arya, S.K. Hydrogen from algal biomass: A review of production process. Biotechnol. Rep. 2017, 15, 63–69. [Google Scholar] [CrossRef] [PubMed]
  69. Müller, K.; Fleige, M.; Rachow, F.; Schmeißer, D. Sabatier based CO2-methanation of flue gas emitted by conventional power plants. Energy Procedia 2013, 40, 240–248. [Google Scholar] [CrossRef]
  70. Xia, A.; Cheng, J.; Song, W.; Su, H.; Ding, L.; Lin, R.; Lu, H.; Liu, J.; Zhou, J.; Cen, K. Fermentative hydrogen production using algal biomass as feedstock. Renew. Sustain. Energy Rev. 2015, 51, 209–230. [Google Scholar] [CrossRef]
  71. Alibardi, L.; Cossu, R. Effects of carbohydrate, protein and lipid content of organic waste on hydrogen production and fermentation products. Waste Manag. 2016, 47, 69–77. [Google Scholar] [CrossRef] [PubMed]
  72. Kristensen, J.B.; Felby, C.; Jørgensen, H. Yield-determining factors in high-solids enzymatic hydrolysis of lignocellulose. Biotechnol. Biofuels 2009, 2, 11. [Google Scholar] [CrossRef] [PubMed] [Green Version]
Figure 1. Hydrogen production from the biomass of Chlorella sp. at 10–50 g L−1 via SSF.
Energies 12 00908 g001
Figure 2. Soluble metabolite products in the acidic effluent after hydrogen production from the Chlorella sp. biomass by SSF.
Energies 12 00908 g002
Figure 3. Profiles of reducing sugars and bio-hydrogen during the course of SSF (A) and PSSF (B) at a Chlorella sp. biomass concentration of 20 g L−1. The dotted line in (B) indicates the pre-hydrolysis period.
Energies 12 00908 g003
Table 1. Kinetic parameters estimated using the modified Gompertz model for hydrogen production from Chlorella sp. biomass at various biomass concentrations.
Biomass Concentration
(g L−1)
Hmax
(mL g-VS−1)
HPR
(mL g-VS−1 h−1)
λ (h)
10132 ± 4 b11.1 ± 0.2 a 2.7 ± 0.3 e
20153 ± 11 a11.2 ± 0.2 a5.8 ± 0.5 d
30108 ± 6 c11.8 ± 0.0 a7.5 ± 0.3 c
4087 ± 8 d9.3 ± 1.4 b9.5 ± 0.6 b
5068 ± 3 e9.2 ± 0.3 b11.0 ± 0.2 a
Hmax is maximum hydrogen yield, HPR is maximum hydrogen production rate, and λ is lag time. Different letters in the same column denote the significant differences at p ≤ 0.05. The data are the means of triplicate experiments with standard deviations (SD) of the means. Different alphabets in the same column denote significant difference at 95% confidence level.
Table 2. Soluble metabolite products in the hydrogenic effluents of the SSF and PSSF experiments using a biomass concentration of 20 g L−1.
ProcessHBu (g L−1)HPr (g L−1)HAc (g L−1)HFo (g L−1)HLa (g L−1)Total VFAs (g L−1)
SSF2.4 ± 0.40.03 ± 0.002.3 ± 0.40.03 ± 0.021.2 ± 0.25.96 ± 1.02
PSSF1.9 ± 0.30.07 ± 0.012.4 ± 0.30.11 ± 0.071.1 ± 0.15.58 ± 0.78
HBu is butyric acid, HPr is propionic acid, HAc is acetic acid, HFo is formic acid, HLa is lactic acid, and Total VFAs is the sum of the HBu, HPr, HAc, HFo, and HLa concentrations.
Table 3. Hydrogen yield and productivity obtained using Chlorella biomass as a substrate.
Algae StrainFermentation ProcessPretreatmentHydrogen Yield (mL g-biomass−1)Energy Yield (kJ g-biomass−1)Hydrogen Productivity
(mL g-VS−1 h−1)
Reference
MethodConditions
C. vulgarisSHFAcid-ultrasonic0.79% (v/w) HCl, 49,600 kJ kg-DW−1, 36 min42.10.54n/a[66]
C. vulgarisSHFAcid-thermal1% HCl, 92 °C, 47 min47.10.60n/a[24]
C. vulgaris FSP-ESHFEnzymaticAccellerase 1500,
45 °C, 3 days
57.30.73n/a[67]
C. vulgarisSHFEnzymaticOnozuka R-10, Macerozyme R-10124.91.591.1[17]
Chlorella sp.SSFNo pretreatmentCellic CTec2, Termamyl SC, and Dextrozyme GA, 35 °C1531.941.6This study
PSSFPre-hydrolysisCellic CTec2, Termamyl SC, and Dextrozyme GA, 50 °C, 12 h154.81.972.4This study
SHF: separate hydrolysis and fermentation; SSF: simultaneous saccharification and fermentation; PSSF: pre-hydrolysis with simultaneous saccharification and fermentation; n/a: not available as fermentation time was not reported. Energy yield was calculated based on the energy density of hydrogen of 12.7 MJ m−3 [69].

