Article

Techno-Economic Analysis of a Cogeneration System for Post-Harvest Loss Reduction: A Case Study in Sub-Saharan Rural Community

1
Sir Joseph Swan Centre for Energy Research, Newcastle University, Newcastle NE1 7RU, UK
2
Department of Soils, Water and Agricultural Engineering, College of Agricultural & Marine Sciences, Sultan Qaboos University, Muscat 123, Oman
3
The Higher Institute of Industrial Technology Engila, Tripoli 00218, Libya
*
Author to whom correspondence should be addressed.
Energies 2019, 12(5), 872; https://doi.org/10.3390/en12050872
Submission received: 8 February 2019 / Revised: 27 February 2019 / Accepted: 1 March 2019 / Published: 6 March 2019
(This article belongs to the Section A: Sustainable Energy)

Abstract

:
Over 90% of global yam production is from West Africa where it provides food and income for above 300 million smallholders’ farmers. However, the major challenge of yam is 10–40% post-harvest losses due to the lack of appropriate storage facilities. This paper assesses a biogas-driven cogeneration system, which could supply electricity and cold storage for ‘yam bank’ within a rural community. Considering 200 households’ Nigerian village as a case study, crop residues are used as anaerobic digestion feedstock to produce biogas, which is subsequently used to power an internal combustion engine. Result shows that the system could store 3.6 tonnes of yam tubers each year and provide enough electricity for domestic and commercial activities. At the current electricity tariff of USD0.013·kWh−1 for rural areas, the system is unable to payback during its life span. The proposed USD0.42·kWh−1 by Nigerian Rural Electrification Agency seems good with less than 3 years discounted payback period but brings about extra burden on poor rural households. Based on the income from cold storage, electricity tariff of USD0.105·kWh−1 with an interest rate of 4% is suggested to be reasonable which results in 6.84 years discounted payback period especially considering non-monetary benefits of renewable energy system.

1. Introduction

West Africa accounts for over 90% of global yam production, which yields about 68.132 million tonnes each year as indicated in Table 1. It is the major staple food for over 300 million people and provides source of income for many smallholders’ farmers. Yam is second to cereal as the most important food in West Africa. However, a major challenge of yam production in the region is lack of proper storage facility. This usually results in 10–45% post-harvest loss (PHL) and “market glut” during harvesting periods as shown in Figure 1 [1]. Apart from threatening global food security, this wastage also reduces the market share of smallholders’ farmers and thereby put them in continuous poverty circle.
It is worth noting that bulk of global energy poorly resides in remote areas of Sub-Saharan African region (SSA) [4] where access to modern energy is still challenging [5,6]. Grid connections to most of these settings are either uneconomical or topographically impossible. Thus, it is quite desirable to deploy micro-grid renewable energy technologies for distributed energy systems in most of these villages [7]. These countries mostly lack financial capability to support the required feed-in-tariffs (FITs) policy for the massive deployments of renewable energy systems. An alternative approach may be synchronisation of electricity delivery with basic agricultural produce processing where income from such processing is able to be used to offset the burden of FITs [8,9]. Village or farm based energy demand would be satisfied with biomass powered technologies. This is because energy demand and biomass resources are already available which can be thermally or biologically converted through gasification or anaerobic digestion (AD). It offers a benefit by supplying energy and organic fertiliser especially when used as fuel for combined heat and power (CHP) systems [10,11]. This paper therefore accesses CHP in context of cold storage of yam produce and renewable energy tariff of Nigeria government. Hence, yam storage and renewable energy regulation will be separately illustrated in the following subsections.

1.1. Yam Storage

Yam storage symbolises “stored wealth” for the farmers, which can be sold anytime of the year. It is stored relatively longer than other tropical crops. Traditional storage involves leaving tubers unharvested until when needed. However, the main issues of these techniques are sprouting, respiration and transpiration, which lead to both qualitative and quantitative loss of yam tubers. In addition to these physiological related problems, external attacks such as mould growth, insects, nematodes and mammals infestations are also frequent challenges. Hence, different modern storage methods have been investigated [12,13]. Among them, the best solution is to combine fumigation and storage between 12 °C and 15 °C at a 70% relative humidity. Storage under these conditions reduces PHL to less than 3% as well as retains the nutritional qualities of yam even after 9 months [14].

1.2. Renewable Energy Regulation in Nigeria

Nigerian Electricity Regulatory Commission formulates regulations of fossil and renewable energy systems. The commission fixes and controls tariffs for generation, transmission and distribution companies [15]. For tariff payment, consumers are subdivided into industrials, commercial, residential and government agency. Residential consumers are further divided into four categories i.e., rural, sub-urban, urban and elite-urban consumers. The commission adopts what it called “burden sharing”. Affluent urban elites are required to pay more while rural dwellers only pay USD0.013·kWh−1. Special FITs are also paid in terms of renewable generated electricity. For instance, biomass generated electricity is purchased by the commission at USD0.123·kWh−1 [15]. However, systems below 1 MW are not captured in FITs systems whereas mini, micro and standalone systems often less than 100 kW are quite suitable for sparsely populated rural areas. Consequently, there is no incentive for private sector investment on renewable energy projects in rural area since implementations of FITs for big projects in urban areas also remain ineffective.
Currently less than 30% of rural area is connected to national grid while the connected consumers hardly have above 30 h of electricity per week. Comparably, self-generated diesel or gasoline powered generator is very common across the country. The cost of these self-generated electricity varies from USD0.45·kWh−1 to USD0.75·kWh−1 with such generation currently estimated between 8–14 GW. In 2016, commission through Nigerian Rural Electrification Agency (NREA) changed to what it called “demand-driven approach” based on consumers’ willingness to pay. In this approach, internal rate of return (IRR) is pegged at 15% to evaluate consumers’ tariff between USD0.24·kWh−1 and USD0.75kWh−1 depending on the plant size. Then the government will pay no FITs. However, some of these projects are assisted with some grants by the government. Hence, a rural community would sign a binding purchasing agreement with the private investors while government ensures that the interests of both parties are protected.
Based on the above backgrounds, this paper aims at comprehensively appraising technical and economic viability of a distributed combined cooling and power (CCP) system in context of a Nigerian agrarian community which could be regarded as a representative case in post-harvest storage of yam tubers. Since less research studies are reported on cogeneration for food storage, the results are quite insightful to explore the potentials of this technology in the similar rural areas. With this type of systems, it is revealed that both food and energy security can be simultaneously achieved since locally available biomass is utilized for energy generation, while part of the generated energy is used for crops storage. The produced digestate from the AD system is also useful as organic fertiliser. By adopting such approach both the environmental impact of the energy generation and agriculture are reduced. The framework of this study is as follows: Modelling of mass, energy and economic analysis are established in Section 2. Then results of heat balance, cooling load and economic evaluation are presented in Section 3 followed by conclusions in Section 4.

2. Modelling and Methodology

Materials used in this study involves secondary data from Nigerian National Bureau of Statistics, Nigerian Federal Ministry of Agriculture and relevant empirical studies. Quantifications of crop residues from rice, sorghum and soya beans are presented in Table 2. Farm sizes of smallholder’s farmers vary between 0.5–5 ha, and an average size of 2.5 ha per household is assumed for this simulation [16,17]. Besides, a common practice within the region is inter-planting of legumes with grains [18]. However, rice is not usually inter-planted while sorghum or maize is traditionally mix-cropped with soybeans. One hectare of the farmer’s land is assumed to be used for rice production while the remaining 1.5 hectare is mix-cropped with sorghums and soybeans. Then the cold storage unit is designed, which is composed of wood pine, corkboard and concrete as inner layer, insulator and outer layer.
The main work in this section is: (1) evaluation of the biogas generation potentials of cogenerated rice-sorghum-soybeans residues; (2) simulation of power and heat recovery performance (3) modelling of ammonia-water absorption chiller. The above results are then used as the inputs for economic analysis.

2.1. Case Study Area

The case study area is Agboko village in Benue State of north-central part of Nigeria, which is located on 7.0316° N and 8.403° E longitude and latitude. It is categorised as the settlement of less than 1000 households [19]. The inhabitants are predominantly farmers and the major crops are rice, sorghum, soya beans, yam and cassava. Currently four 10 HP diesel powered generators are used for agricultural processing such as cassava grinding and rice shredding. The village’s electricity demands are presented in Table 3.
To quantify the available crop residue, the related ratio has been widely used in the literature [20] which is also adopted in this study as expressed in Equation (1) [21].
S prod =     P R prod × S G R × S avl
where Sprod is residue production; PR is households’ crop production, SGR is residue grain ratio; Savl is percentage of the residue for energy recovery. To evaluate the value of PR, crop yield per hectare is obtained from Food and Agricultural Organisation’s database (FAOSTAT). As a result, a 26.90 kg·day−1 per farmer of residue is estimated to 5380 kg·day−1 for 200 households.

2.2. System Design

Design of the cogeneration system is indicated in Figure 2. Crop residues are first crushed and mixed with water. The feed is then conditioned to digestion temperature of 35 °C and supplied into digester. The produced biogas passes through ammonia scrubber where CO2 is removed and the resultant biogas is enriched. The biogas is subsequently used to power an internal combustion engine (ICE). Heat from cooling jacket of the engine is recovered to partially maintain AD process. The heat from the exhaust is also recovered to drive three more absorption chillers with the rated cooling power of 17 kW. Chilled water is used to maintain the temperature of cold storage. Figure 3 shows the store for yam storage, which is measured as 6 m × 5 m × 2 m with 1 m peak for the roofing. It is made up of wood pine, corkboard and concrete as inner layer, insulator and outer layer. The thickness is adopted as 12 mm, 70.5 mm and 101.6 mm for pine, corkwood and brick, respectively. Cold air is blown across the stored yam, which carries away heat of respiration and heat absorbed from the surroundings to maintain internal temperature at 15 °C. The average volume of yam tuber is 1.83 × 10⁻³ m3 [13]. Weight of yam tuber varies between 2.5 kg and 5.5 kg [12], and 3.0 kg is taken into account in this study. The designed structure can store about 3.6 tonnes of yam tubers.

2.3. Anaerobic Digester

2.3.1. System Modelling

Available daily crop residue is 5380 kg with the average moisture content and total solids of 14.23% and 85.77%, respectively. Crop residue to water ratio of 1:1.5 is adopted to obtain a 10% total solid in the digestion system since AD process performs well with total solid less than 15% [22]. Therefore, daily feedstock loading rate is 45,730 L·day−1 while 15 and 28 days hydraulic retention time are considered for thermophilic and mesophilic processes. The required reactor volume is 1143.2 m3 while actual volume is 1257.6 m3 with additional 10% remained for gas holding and missing volume. Then AD process is simulated under mesophilic (35 °C) and thermophilic (55 °C) conditions to determine the most suitable operation for the proposed system.
Heat balance for AD system is accessed based on the following requirements: (1) Heat required to warm substrate from atmospheric temperature of 25 °C to operating temperature of 35 °C/55 °C; (2) Heat loss by radiation, convection and conduction; (3) Reaction heat from biochemical activities of reactor’s microorganisms.
The required heat for substrate warming up could be expressed as Equation (2).
Q wm = ( M s × C p × T ) / 3600
where Ms is mass of substrate; ∆T is temperature difference between ambient and digestion temperature; Cp is specific heat capacity.
Heat loss by radiation is evaluated according to Equation (3).
Q R =   ε × σ × ( T d 4 T amb 4 ) × A d 1000
where ε is emissivity of the outer brick wall (0.92); ơ is Stefan-Boltzmann constant (5.670367 × 10⁻⁸ kg·S−3·K−4); Ad is area of the digester (m2); Td and Tamb are digestion and ambient temperatures (K), respectively.
AD encompasses some natural biochemical reactions. Some are endothermic while others are exothermic. Disintegration of protein is usually endothermic while fragmentation of lipid and carbohydrate molecules tend to be exothermic [23]. These are represented with change of enthalpy as illustrated in Equations (4)–(6). From these equations, biochemical heat can be evaluated from proximate composition of feedstock.
C 6 H 12 O 6     3 CO 2 + 3 CH 4                       H R 0 = 138.5   kJ · mol 1
C 3 H 7 NO 2 + 2 H 2 O   3 CO 2 + 3 CH 4 + 2 NH 3       H R 0 = + 198.5   kJ · mol 1
C 16 H 12 O 6 + 14 H 2 O 9 CO 2 + 22   CH 4       H R 0 = + 544.5   kJ · mol 1    
The digester is insulated with 0.2 meter polyurethane foam with a thermal conductivity of 0.026 W·m−1·K−1. Air gap between materials makes convection heat loss negligible while the conductive heat loss could be evaluated as Equation (7) [24].
Q ins = ( T D T air ) 1 A ( S ins k ins ) × 1000  
where Qins is heat lost through insulator; Td is digestion temperature; Sins is insulator’s thickness; kins is thermal conductivity of insulator and A is area of the digester.
Total heat required for the digestion system is evaluated as Equation (8).
Q total =   Q wm + Q R + Q ins

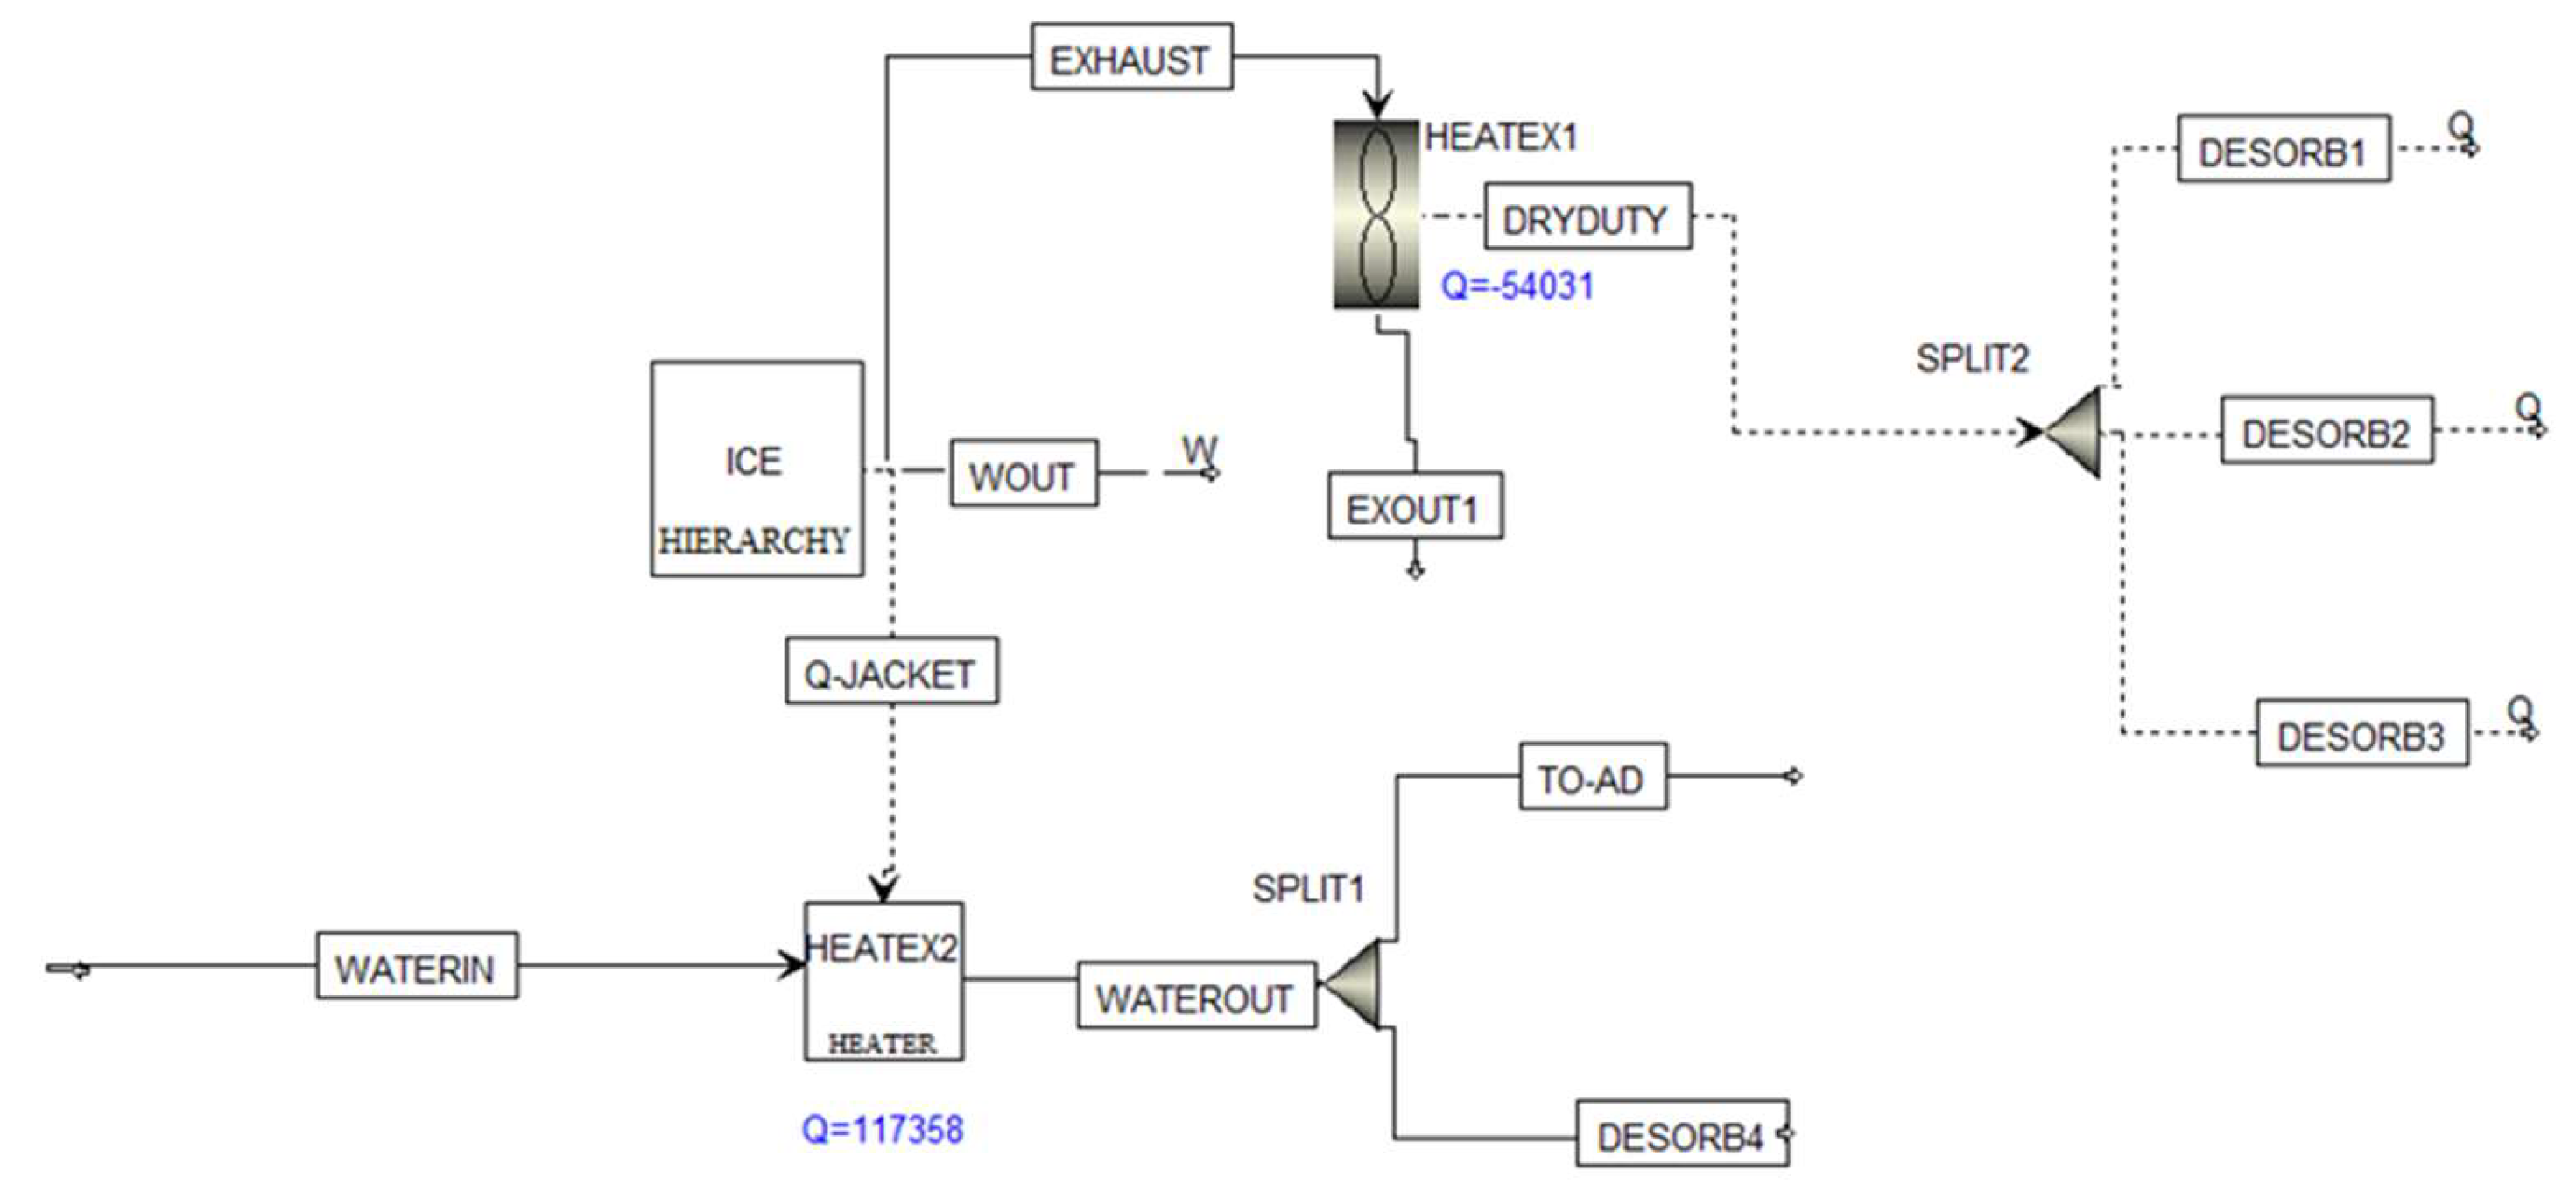
2.3.2. Process Simulation

Thermodynamic performance can be accessed by using an AP process simulator. Systems are broken down into unit operations, which are represented by AP blocks and inputs/outputs of the blocks. Different unit operations are connected with streams. Operating conditions must be supplied i.e., flow rates, compositions, temperature, pressure and appropriate fluid package [8]. Composition of the feed used for the simulation is shown in Table 4.
AD system is often governed by four complex processes i.e., hydrolysis, acidogenesis, acetogenesis and methanogenesis which work together to produce methane and CO2 as illustrated in Figure 4. Modelling of AD is based on International Water Association (IWA) AD model 1 [26]. Kinetic reactions are adapted and compositions are adjusted for its suitability to the present work. The aforementioned processes are divided into two reaction sets. Reaction set 1 represents hydrolysis stage which is symbolised with the stoichiometric reactor. The fractional conversion is fixed and it represents the degree of degradation of major biomass components: carbohydrates, protein and lipids. Reaction set 2 is composed of the last three stages of the above processes and modelled with rigorous continuous stir tank reactor (RCSTR). Non-Random Two-Liquid model (NRTL) is selected as the property method due to its suitability to compare and estimate the mole fractions and activity coefficients of individual compounds, while also enables liquid and gas phase in the biogas production. The AD process is validated as reported by our previous work [8].

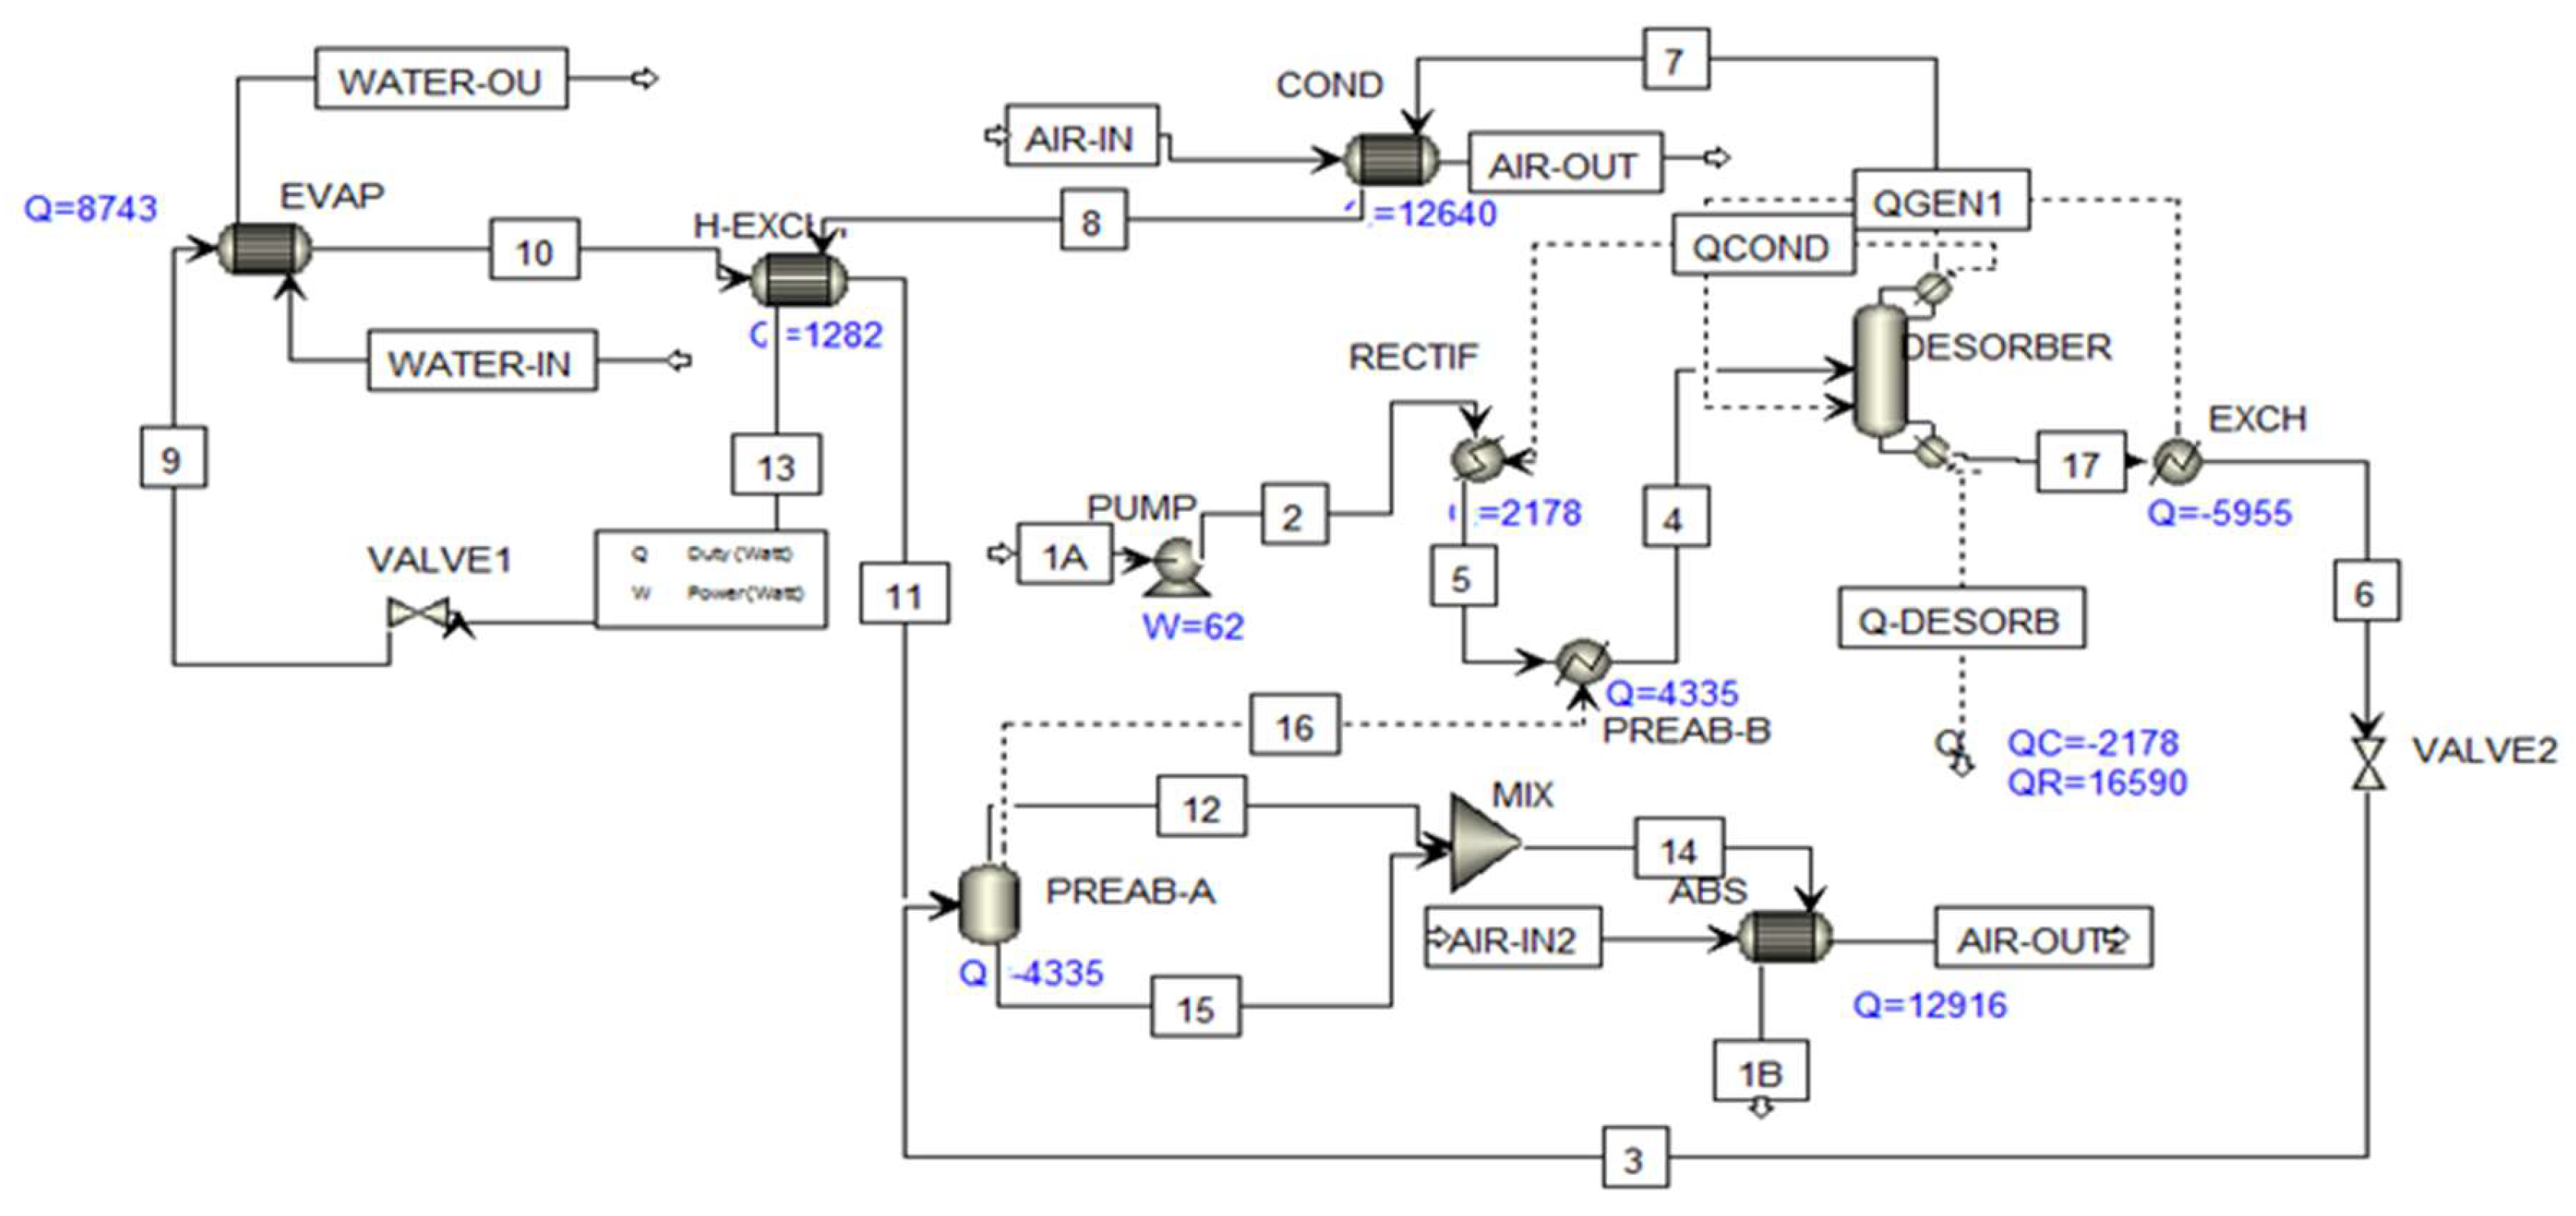
2.4. Simulation of Combined Cooling and Power Unit

CCP is composed of an ICE and two heat recovery sections. About 117 kW heat is recovered from the cooling water jacket of ICE with temperature up to 70 °C, which is subsequently used to maintain AD process. The second heat exchanger recovers 52.8 kW heat from engines exhaust. Exhaust heat exits at 120 °C, which is enough to avoid precipitation. The recovered heat from exhaust is split into three parts: 17.5 kW each of which is used to drive the desorbers i.e., DESORB 1, 2 and 3 of the 17.5 kW Robur absorption chiller as shown in Figure 5. Thus, three chillers could produce about 26.22 kW cooling power, which equals 206.71 MWh·yr−1. The prime mover modelled is a 72 kW internal combustion engine (Caterpillar Inc., UK). The engine is modelled with: (1) a compressor where combustion air flow rate, isentropic efficiency and compression ratio are the inputs; (2) a stoichiometric reactor with fuel flow rates, pressure and combustion reaction as specified; (3) an expander with isentropic efficiency and discharge pressure defined. Details of prime mover and absorption chiller are presented in Table 5. Moreover, detailed validation of the ICE could refer to our previous work [9].
Figure 6 indicates AP simulation of the 17.5 kW Rabur ammonia-water absorption chiller (AWAC). The detailed modelling and validation could refer to the reference [27]. AWAC consists of absorber, desorber, condenser, evaporator, rectifier and a pump. A refrigerant heat exchanger and a pre-absorber are used to enhance internal heat recovery. The cycle starts from stream 1 with the feed (component, flow rate, mass concentration), efficiency and discharge pressure specified for the pump. The stream exiting pump 2 is first used to cool refrigerant 7. This process knocks out more water molecules from the refrigerant and increases its purity. Heat rejected in the process serves as heat duty of the rectifier. Weak solution 3 and strong solution 11 first meet in PREAB where both pre-absorption and heat exchanging occur. The rejected heat is used to heat stream 5 before reaching the desorber. The air-cooled absorber is modelled as counter-current heat exchanger. Weak stream exiting absorber (1B) is expected to be liquid. Hence, zero vapour fraction, air flow rates and temperature are the designed parameters for the absorber. Similarly, condenser is modelled as heat exchanger with vapour fraction, cooling air temperature and flow rates as the inputs. Evaporator is also simulated as heat exchanger. The designed parameters are vapour fraction for stream 10, while hot streams’ inlet and outlet temperatures are specified as 7 °C and 12 °C, respectively. Desorber is modelled with the reactive column due to its suitability for absorption, stripping, extractive distillation and ordinary distillation.

2.4.1. Evaluation of Cooling Load

The required cooling load Qc,stor could be expressed as Equation (9).
Q c , stor = Q s + Q l + Q res
where Qs symbolises sensible cooling load, which is the heat required to cool yam tubers from ambient temperature to storage temperature; Ql denotes heat loss from cold room; Qres is the respiratory heat generated by yam tubers. Hence, the sensible cooling load is evaluated as Equation (10).
Q s = M w C p , w ( T a T s ) + M y C p , y ( T a T s )
where Mw and My are the mass of moisture and dry matter in the tuber; Cp,w and Cp,y are specific heat capacities of water and yam; Ta and Ts are ambient and storage temperature. Moisture content of yam tuber is 65% (wet basis) while its specific heat capacity is 2.152 kJ·kg−1·°C−1 [28].
At the storage temperature, yam is dormant and its sprouting is avoided but respiration continues because the yam tuber is a living tissue. Respiratory rate of yam cells is 3 mL CO2·kg−1·h−1. According to the reference [29], relationship between CO2 produced during respiration and heat released is calculated as Equation (11).
Q h = M CO 2 × 1.08485 × 10 2
where Mco2 is the mass of CO2 released.
Respiratory heat generation yam is calculated as Equation (12).
Q res = Q h 3.6  
Heat losses are conduction, convection and radiation. Cold storage is insulated with of corkboard, which is placed between inner pinewood and outer concrete blocks. Air gap between these materials is almost unavoidable. Heat loss by convection is regarded to be negligible. Total area in contact with air is 109 m2. Thermal conductivities of pinewood, corkboard and concrete are 0.151 W·m−1·K−1, 0.0433 W·m−1·K−1 and 0.762 W·m−1·K−1, respectively. Therefore, heat loss per square meter through the wall of cold storage can be defined as Equation (13) [30].
Q l = T s T a R T × 1 1000    
where RT is total heat resistance of materials, which could refer to Equation (14).
R T = 1 A ( S p K p + S cb K cb + S c K c )  
where Sp, Scb and Sc represent thickness of pinewood; corkboard and concrete; Kp, Kcb and Kc are their thermal conductivities.
Heat loss by radiation is calculated according to Equation (15).
Q R =   ε × ơ × ( T s 4 T a 4 ) × A 1000
where Ts denotes absolute temperature of hot body; Ta is absolute temperature of cold surroundings; A represents the area of cold store in contact with cold air.

2.4.2. Evaluation of the Cogeneration System

Electrical efficiency of CCP system µelc is defined as Equation (16).
μ elc = W M biogas × L H V biogas   × 100 %
where W is the output electricity; Mbiogas and LHVbiogas signify mass flowrate and low heat value of biogas.
The efficiency of CCP system µCCP-storage is evaluated as Equation (17).
3 μ CCP storage = W + ( Q evap × μ storage   ) M biogas × L H V biogas ×   100 %
where Qevap is the evaporator duty of the absorption chiller and μstorage is thermal efficiency of cold storage unit.
The efficiency of digestion system µdigestion could be evaluated as Equation (18).
μ digestion =   Q total   Q lost   Q total     × 100 %
where Qtotal is total heat supplied to digestion system while Qlost is the heat loss from digestion system through insulation and radiation.
The overall efficiency of the system µover could be calculated as Equation (19).
μ over = W +   Q total +   Q Gen M digestion   ×   L H V digester

2.5. Economic Evaluation

Costs of the proposed system are obtained from Nigeria’s National Electricity Regulation Commission [15]. Table 6 indicates the inputs used for economic analysis. Cost of cold storage is obtained from local manufacturers while that of the chilling unit is taken from online suppliers. Income from cold storage is evaluated using differences in the prices of yam during harvesting and off-season as obtained from the local market. The scenarios are considered as follows: (1) Electricity is sold at the above prices; (2) Yam is sold locally or exported. These are evaluated considering 7%, 9% and 20% interest rates, which are typical of lending rates from Nigerian bank of agriculture, bank of industry and commercial banks respectively. Lifespan of 20 years and 85% availability are assumed. Besides neither salvage value nor inflation rates is considered in the study. About 10% of the electricity generated is used onsite. Net present value (NPV), discounted payback period (DPP), and levelised cost of energy (LCOE) are adopted to assess the economic feasibility of the system. Cold storage is driven by the recovered waste heat, therefore additional incomes from sales of yam is treated as income from sales of heat with regard to LCOE calculation.
NPV is calculated as Equation (20).
N P V = n = 0 N F n ( 1 + d ) n
where Fn is net cash flow in year; n is analysis period; d is annual interest rate.
LCOE could be expressed as Equation (21).
L C O E = T L C C + n = 0 N Q n ( 1 + d ) n    
where TLCC is total life-cycle cost; Qn is lifespan energy savings or produced; d is annual interest rate while n is project lifespan.
Discounted cash inflow (DCI) could be evaluated as Equation (22).
D C I = R e a l   c a s h   i n f l o w ( 1 + d ) n  
DPP could be evaluated as Equation (23).
D P P = A DCI + B DCI C DCI
where A is the last period with negative cumulative DCI; B is the absolute value of cumulative DCI at the end of period A; C represents DCI during the period after period A.

3. Results and Discussions

Simulation results under both mesophilic and thermophilic conditions are presented in Table 7. Expectedly, under thermophilic condition it produces 14.6% more biogas (293.56 L·kgVS−1·day−1) than the system operated under mesophilic condition (256.16 L·kgVS−1·day−1). However, the percentage methane of mesophilic system is 64.8% while that of thermophilic is 58.2%. Thus specific methane production from the thermophilic process is only 3.26% higher than that from the mesophilic process. Considering the requirements for biogas cleaning and additional heat required for the thermophilic system, the mesophilic process is recommended. From the simulation results of the gas engine, about 511 MWh of electricity can be generated per annum by the system. However, only 459.9 MWh will be sold since 51.1 MWh is self-utilized. Moreover, the system is able to store 3.6 tons of yam tubers per year. This is enough to provide electricity for 200 households and for the commercial agricultural processes presented in Table 3.

3.1. Heat Balance of AD System

Heat balance related to microbial activities is presented in Table 8. That heat is inputted (+) or generated (−) indicates endothermic and exothermic processes, respectively. It is worth noting that the entire process is exothermically producing heat of about 16.26 kW. However, this biochemical enthalpy change remains unchanged under mesophilic and thermophilic processing conditions. This is because it is influenced by feedstock’s proximate composition and flowrate, which are kept constant in terms of both scenarios. Total heat requirements for processing conditions are indicated in Table 9. Results showed that total heat required by the mesophilic AD system is 47.38 kW which includes heat for the substrate warming up, biochemical heat of reaction, heat loss through insulation and heat loss by radiation. Heat required for the substrate warming up accounts for over 90% of the required heat. However, the impact of heat loss to the surroundings becomes significant as the digestion temperature increases. For instance, using thermophilic digestion temperature (55 °C) as against mesophilic 35 °C would have increased heat loss to the environment by 57.14%.

3.2. Cooling Load

As indicated in Table 10, the required cooling load is 35.50 kW. The highest cooling load requirement is the sensible cooling, which is required to cool the tubers from atmospheric temperature to the 15 °C storage temperature. To maintain this storage temperature, heat generation through respiration is carried away while the system’s heat loss should be compensated accordingly. The design of the system must compensate this cooling load. Exhaust heat is only able to power three 17.5 kW ammonium-water absorption chillers. From the AP simulation, each of the three chillers produced about 8.77 kW cooling power, which is not able to meet the total cooling load. Thus another 25 kW single stage ammonium-water absorption chillers is adopted to produce 9.27 kW cooling load, which is consider to be driven from hot water of ICE.

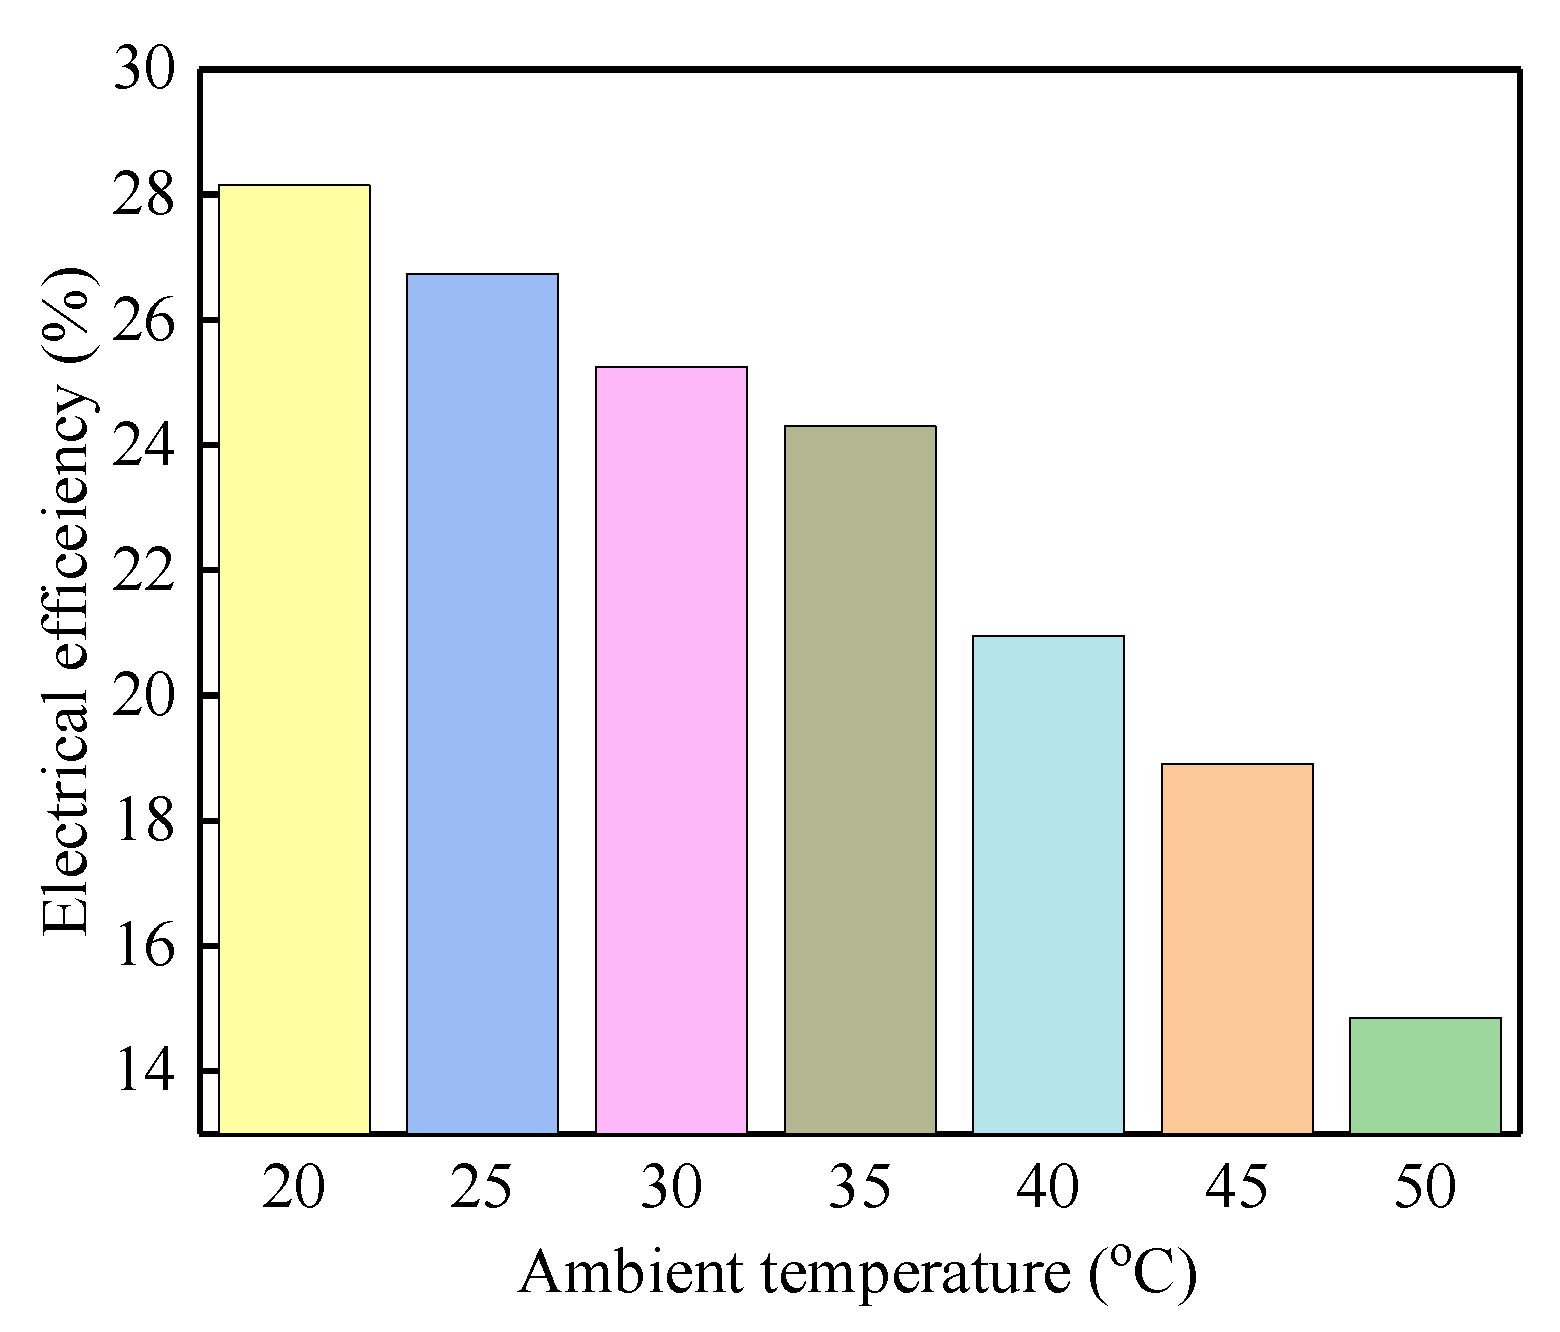
3.3. Efficiency of the System

Electrical efficiency of the proposed system is 26.73%. This efficiency is below the range of 28–39%, which is reported for many spark ignition ICE. The reason may be attributed to its low air-fuel ratio of 6.85 when compared to the value around 14.1 for many standard engines. Nevertheless, the engine is specifically designed to work with relatively impure low-grade fuels and it is expected that some of the features of the high-grade fossil fuel driven engines might have been compromised for the design driven by biogas. Electrical efficiency is shown in Figure 7 in terms of various ambient temperatures. Unlike other gas turbines, the increase of atmospheric temperature does not significantly affect the efficiency. One remarkable fact is that the efficiency of the proposed system is significantly influenced by ambient temperature. When temperature increases from 20 °C to 50 °C, the efficiency could be reduced by 47.2%. The performance becomes even worse when temperate is higher than 50 °C. However, the average temperature of the study area is around 27.5 °C with 22 °C in the coldest months of December to January and 33 °C for the hottest months of February to April. Hence, the efficiency is not expected to be significantly affected by the variations in the atmospheric temperature.
Besides, methane compositions of the biogas vary from 0% to 80% as shown in Table 11. Its effects on electricity output and exhaust temperature is demonstrated in Figure 8. It is indicated that energy content of fuel greatly determines the power production of the engine. This is because heat content of fuel defines the amount of its available chemical energy. In order to meet the electric power and heat demand, it will be uneconomical to operate the system with fuel less than 60% methane purity, which justifies extra costs on biogas scrubbing.
Co-efficiency of performance (COP) for absorption cooling system is calculated as 0.51 for the exhaust driven system while absorption unit driven by hot water has a COP of 0.40. Thus, a total 35.5 kW cooling load is produced from 76 kW heat supplied to the generators. The calculated energy utilisation efficiency of the digestion system is 98%. According to the composition of the feedstock, the digestion process is exothermic which means that the internal heat generated by microbial activities is high enough to offset most of the heat that is being lost to the environment. Thus, the efficiency of the system is 54.89% when heat is only recovered for cooling. Comparably, the overall system efficiency is 72.45% when heat is recovered for cooling and AD process.

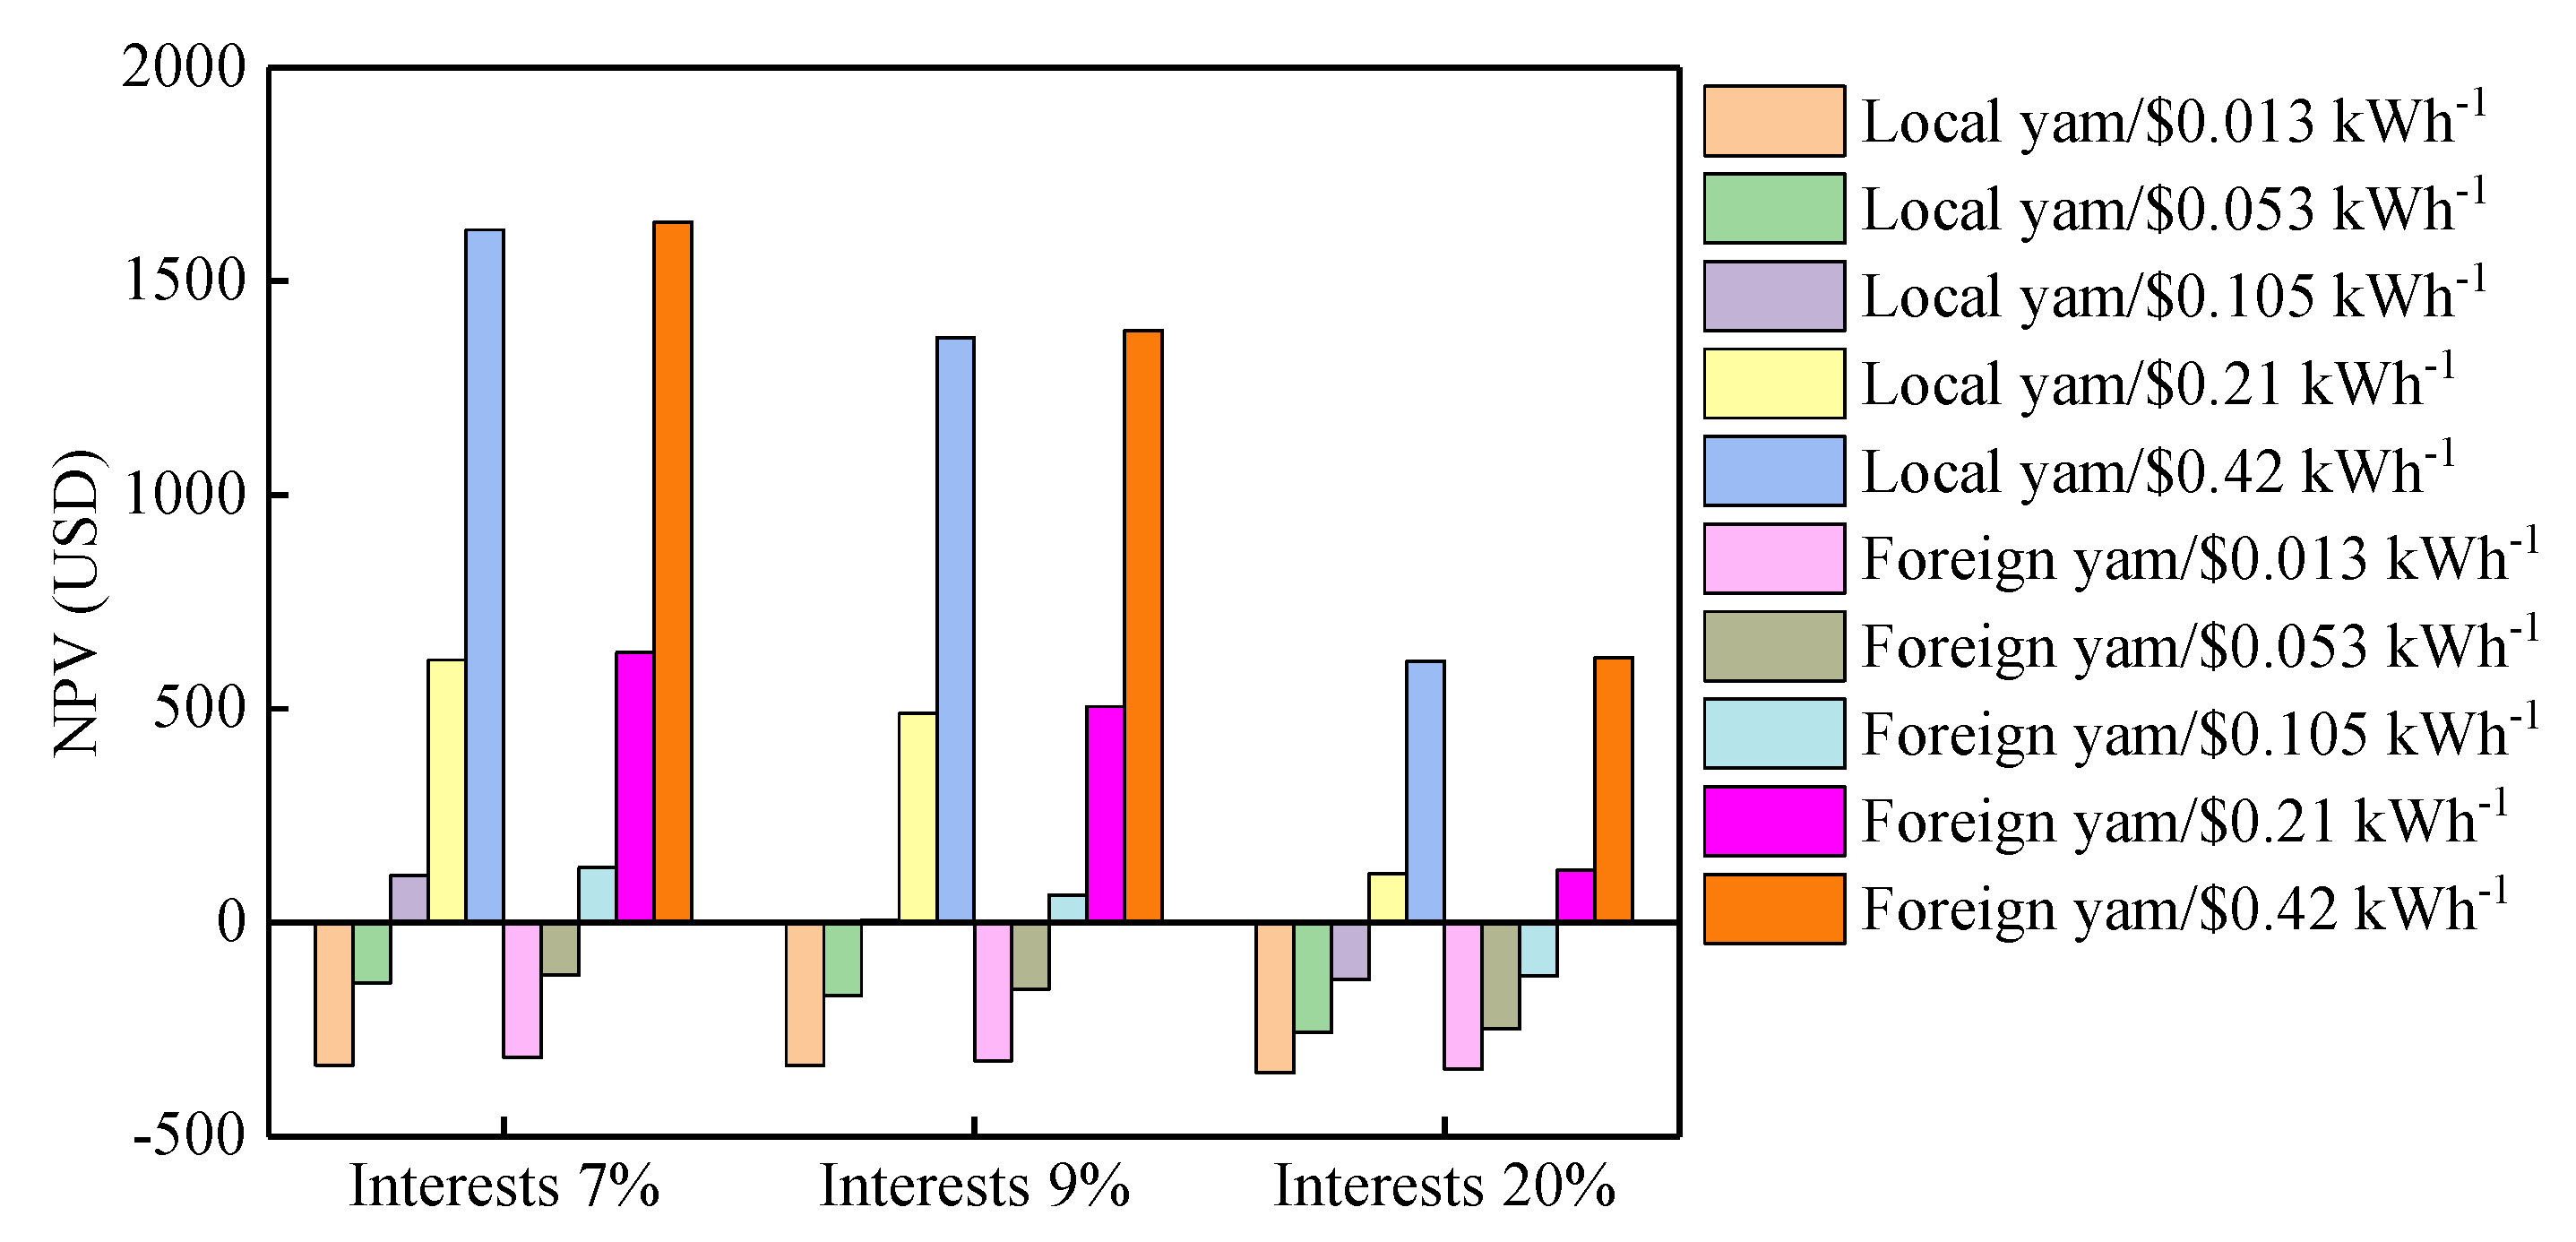
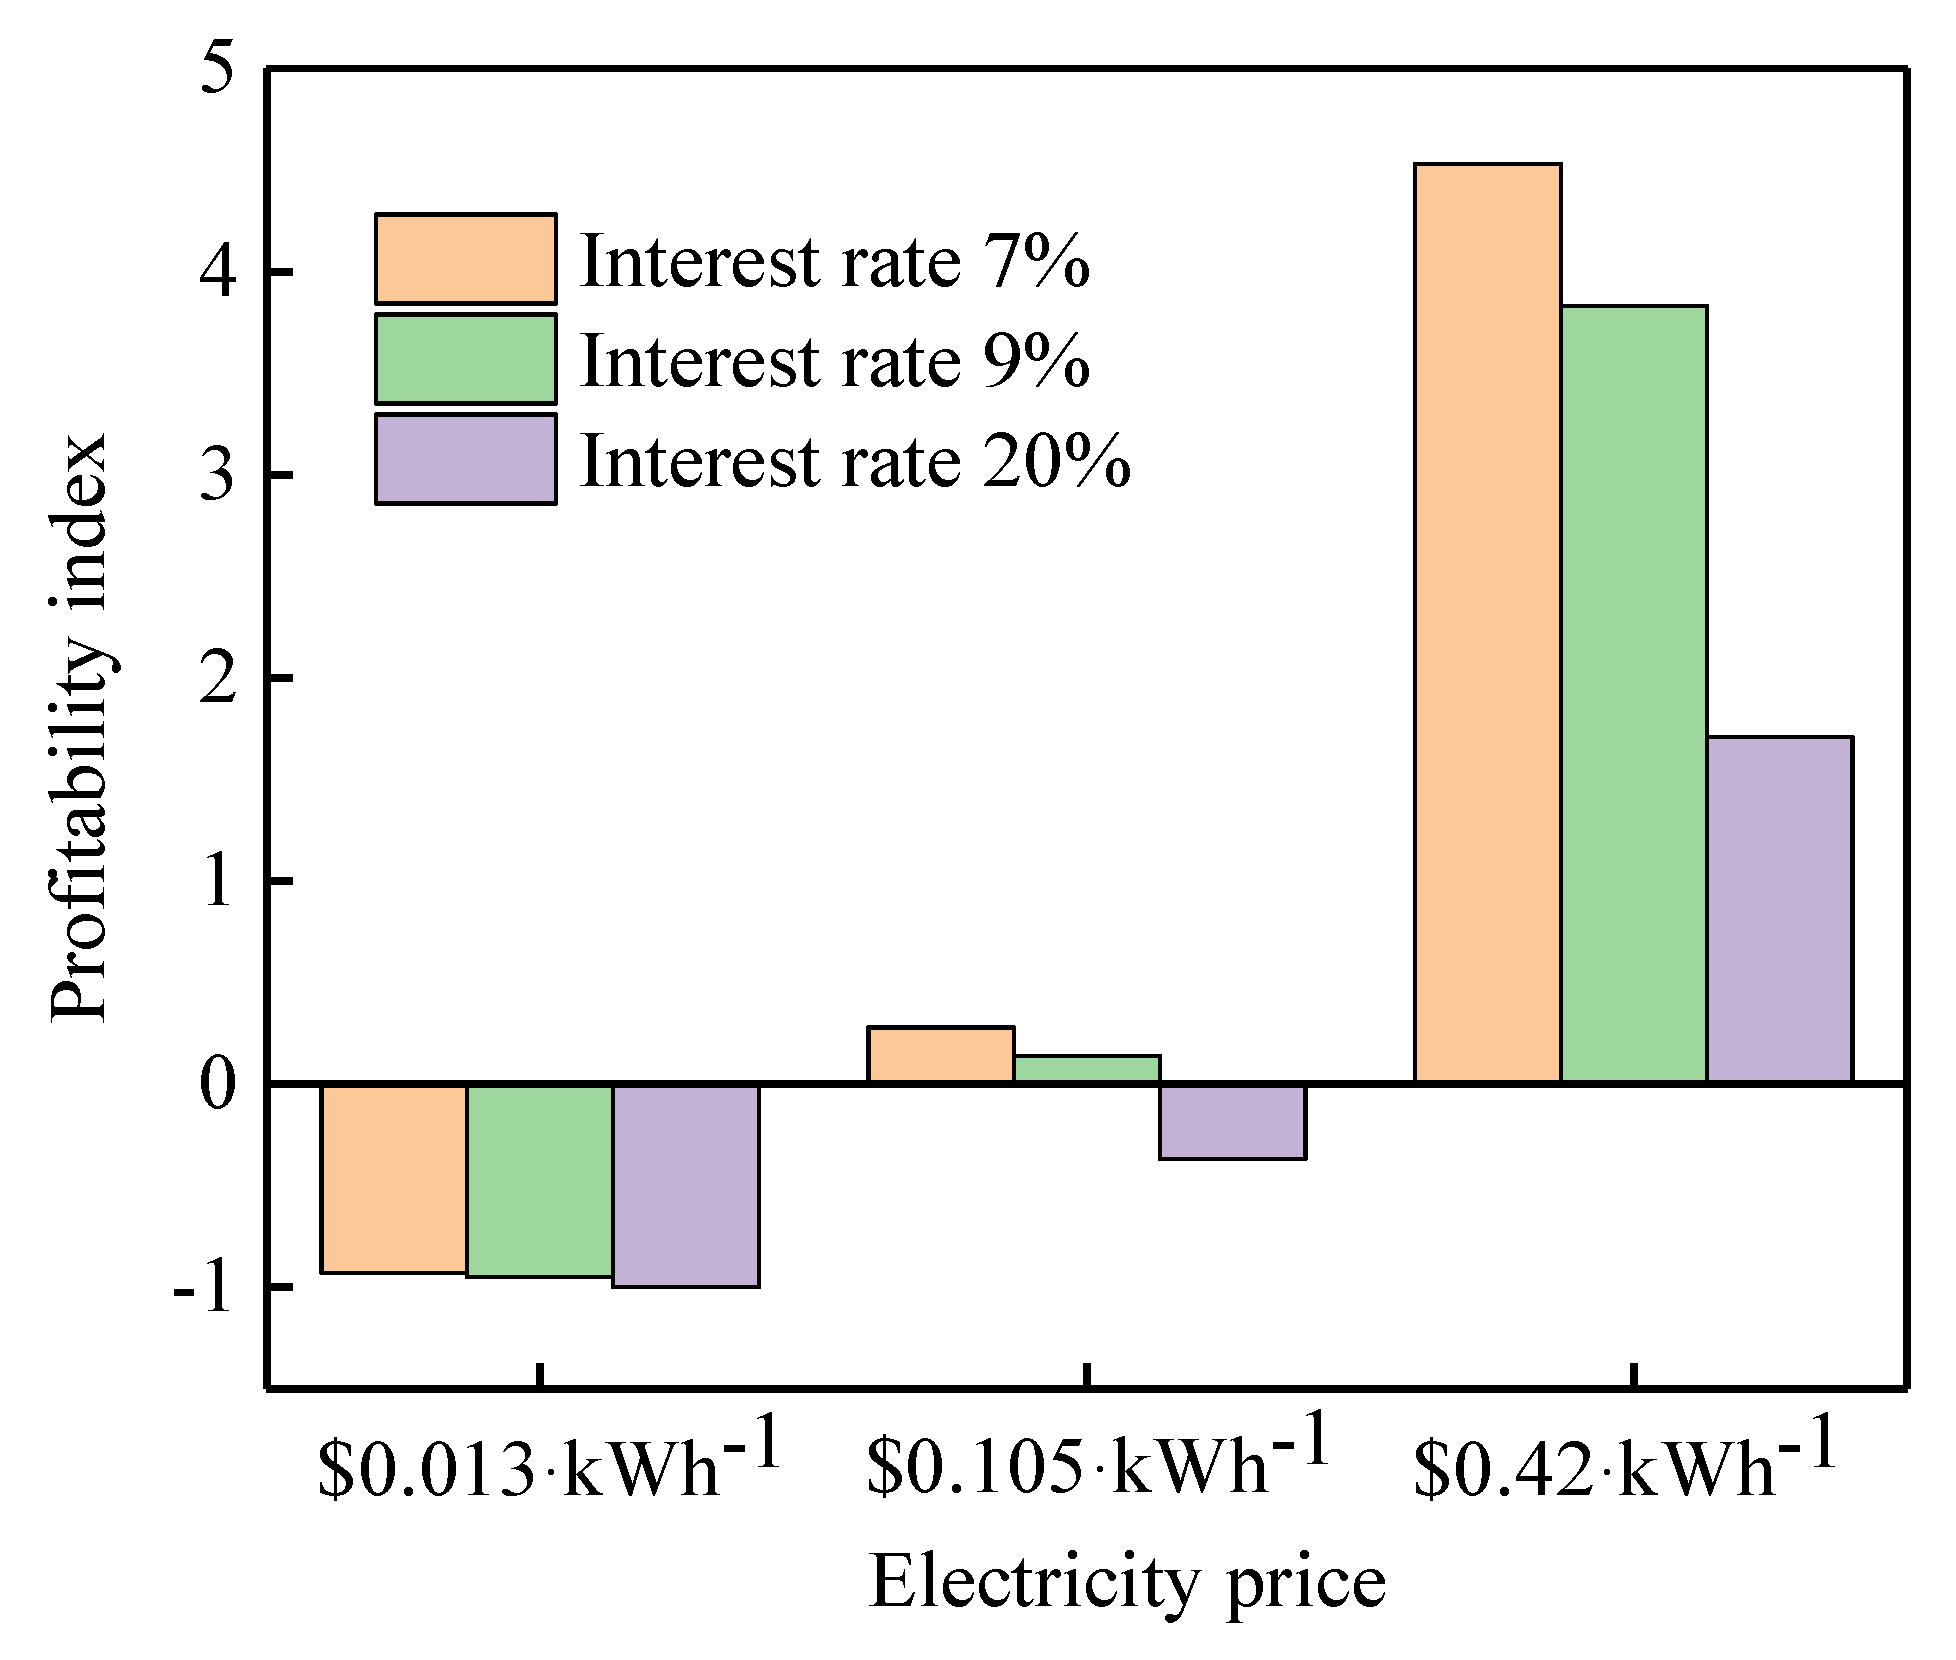
3.4. Economic Evaluation Results

Effects of various electricity prices and interest rates on NPV are presented in Figure 9. It is observed that profitability of the system is sensitive to both electricity price and interest rate. At current electricity price of USD0.013·kWh−1 for rural consumers, NPV remains negative regardless of income from local or foreign sales of yam tubers. When electricity is sold at USD0.105·kWh−1, i.e., 25% of proposed selling price of USD0.42·kWh−1, NPV is positive in most cases but subject to interest rate. The calculation results show that it becomes uneconomical when interest rate is above 10.5%. Table 12 shows effects of interest rates on LCOE. It is demonstrated that LCOE for local sale varies between USD0.115·kWh−1 and USD0.276·kWh−1 when interest rate increases from 7% to 20%. Comparably, LCOE for foreign sale is lower than that for local sale which ranges from between USD0.111·kWh−1 and USD0.272·kWh−1. In order to make the system feasible, rural price of electricity cannot less than USD0.115·kWh−1, which could also explain the reasons for negative NPVs at USD0.013·kWh−1 and USD0.053·kWh−1. Also worth noting that NPV are very attractive at USD0.42·kWh−1 and USD0.21·kWh−1. However, these prices are considered too expensive for rural dwellers but a price of USD0.105·kWh−1 looks reasonable, which is a threshold value among the selected five prices. As aforementioned, it will become negative when interest rate is higher than 10.5%. Thus the additional income from sales of yam could be a solution to compensate for the difference between LCOE and proposed selling price of USD0.105·kWh−1, which becomes achievable if the yam are exported.
Profitability index indicates a similar trend with NPV, which is shown in Figure 10. Profitability index cannot be negative. When the value is much larger than zero, the project becomes more profitable. Thus, the highest profit could be obtained at USD0.42·kWh−1 when interest rate is 7%. Payback periods in terms of various electricity prices and interest rates are shown in Table 13. At the electricity selling price of USD0.013·kWh−1, the project is unable to payback during the plant’s life span. A discounted payback period of 11.54 years is obtained at USD0.105·kWh−1, which could be considered to be feasible for rural energy project especially when placed in context of other non-monetary revenues.
The rural electrification agency’s price of USD0.420·kWh−1 looks good with DPP of 2 years. However, it puts extra burden of higher electricity tariff payment on impoverished rural dwellers majority of whom are currently living below poverty line of USD2·day−1. However, with the income from the cold storage of agricultural products and 7% interest rate, the project has a DPP of 11.54 years and 9.3 years for local and foreign sales of yam respectively when electricity is sold at USD0.105·kWh−1. Therefore, a reduced interest rate around 4% is welcome for rural electrification investors. At this interest rate, DPP is around 6.84 years, which is comparable to the payback periods of renewable energy systems across the world.

4. Conclusions

A bio-gas driven CCP system is evaluated to post-harvest storage of yam tubers within a rural community. Both mass and energy balance are presented, and the results are further used for economic analysis. Conclusions are yielded as follows:
It is worth noting that a sustainable farming is achievable in rural areas. Agricultural residues can be successfully used to generate decentralised distributed power. Heat recovered for cold storage of agricultural produce and AD system are capable of increasing the system’s efficiency from 26.73% for the electricity generation only to about 72.45% for CCP system. This efficiency is a function of the extent of purification of the biogas, which determines quantity and quality of the recoverable heat. Also internal heat generation by AD system plays major role in offsetting the effect of heat loss to the surrounding and it becomes significant when the operational temperature of AD is increased. Heat loss is increased by 57.14% when the digestion is operated at 55 °C against mesophilic digestion at 35 °C. Therefore, considering the previously mentioned, mesophilic digestion process is recommended.
All economic indices are negative at the current rural electricity tariff of USD0.013·kWh−1 while extra income from the combined system is not enough to offset the difference between the cost of electricity generation and rural selling price. The proposed NREA USD 0.42·kWh−1 looks good with less than three years payback periods but puts burden of payment on poor rural households. However, with the income from cold storage and electricity price of USD0.105·kWh−1 (25% of the NREA proposed tariff) an 11.54 years DPP is achievable which can be reduced to 6.84 years if the interest rate could be reduced to 4%. The lower electricity price with a shift special loan scheme is therefore recommended for promoting renewable energy systems in rural areas, which becomes more attractive when electricity delivery is combined with agricultural product processing.
The case study is quite insightful for rural areas in most places of West Africa based on techno-economic analysis in this paper and also the proposed CCP system using AD process could be applied for cold storage of other agriculture produce.

Author Contributions

Conceptualization, R.L. and P.P.; methodology, R.L.; software, R.L.; validation, M.A.; formal analysis, R.L.; investigation, L.J.; resources, R.L.; data curation, L.J.; writing—original draft preparation, R.L. and L.J.; writing—review and editing, R.W.; supervision, L.J.; Y.W.; A.R.; project administration, A.R.; funding acquisition, A.R.; N.E.

Funding

This study is partly supported by the Engineering and Physical Science Research Council (EPSRC), UK (RE4Food project -EP/L002531/1); EPSRC IAA Phase 2 (EP/K503885/1)–‘Computational fluid dynamics (CFD) enabled optimisation of a hybrid solar dryer for sub-Saharan Africa; EPSRC Global Challenges Research Fund Institutional Sponsorship Award 2016–Institutional Sponsorship Funding, ‘Preparing for GCRF Award: Optimisation of different solar dryers used in Sub-Saharan Africa using computational fluid dynamics (CFD)’.

Acknowledgments

The authors wish to thank the Nigeria’s Petroleum Technology Development Fund for sponsoring this research work.

Conflicts of Interest

The authors declare no conflict of interest.

Nomenclature

AArea (m2)
ADAnaerobic digestion
APAspen Plus
AWACAmmonia-water absorption chiller
CpSpecific heat capacity (kJ·kg−1·°C−1)
CCPCombined cooling and power
CHPCombined heat and power
DCIDiscounted cash inflow
DPPDiscounted payback period
fCash flow (USD)
FITsFeed in tariffs
HXHeat exchanger
HPHorsepower
haHectare
hrHour
IInvestment cost (USD)
ICEInternal combustion engine
IWAInternational water association
LCOELevelised cost of energy
MMass (kg)
NREANigerian rural electrification agency
NPVNet present value (USD)
NRTLNon-Random two-liquid model
nPeriod (year)
PHLPostharvest loss
PIProfitability Index
QHeat (kW)
rInterest rate (%)
RCSTRRigorous continuous stir tank reactor
SSASub-Saharan African region
TTemperature (°C)
TLCCTotal life cycle cost (USD)
VSVolatile solids
yrYear

Greek letters

µEfficiency (%)
εEmissivity of the outer brick wall
ơStefan-Boltzmann constant

Subscripts

ambAmbient
bioBiogas
CO2Carbon dioxide
dDigestion
eElectricity
genGenerator
hHeat
overOverall
resRespiration
sSensible
storstorage
wWater
wmWarm
yYam

References

  1. Ansah, I.G.K.; Tetteh, B.K.D.; Donkoh, S.A. Determinants and income effect of yam postharvest loss management: Evidence from the Zabzugu District of Northern Ghana. Food Secur. 2017, 9, 610–620. [Google Scholar] [CrossRef]
  2. FAOSTAT. Country Crop Production Data; Food Agriculture Organization: Rome, Italy, 2017. [Google Scholar]
  3. Newspaper, T.P. FG targets $8bn annual FX earning from yam export. The Punch Newspaper, 22 June 2017. [Google Scholar]
  4. Rehman, I.H.; Kar, A.; Banerjee, M.; Kumar, P.; Shardul, M.; Mohanty, J.; Hossain, I. Understanding the political economy and key drivers of energy access in addressing national energy access priorities and policies. Energy Policy 2012, 47, 27–37. [Google Scholar] [CrossRef]
  5. Somorin, T.O.; Adesola, S.; Kolawole, A. State-level assessment of the waste-to-energy potential (via incineration) of municipal solid wastes in Nigeria. J. Clean. Prod. 2017, 164, 804–815. [Google Scholar] [CrossRef]
  6. Amigun, B.; von Blottnitz, H. Capacity-cost and location-cost analyses for biogas plants in Africa. Resour. Conserv. Recycl. 2010, 55, 63–73. [Google Scholar] [CrossRef]
  7. Lamidi, R.O.; Jiang, L.; Pathare, P.B.; Wang, Y.D.; Roskilly, A.P. Recent advances in sustainable drying of agricultural produce: A review. Appl. Energy 2019, 233, 367–385. [Google Scholar] [CrossRef]
  8. Lamidi, R.O.; Wang, Y.; Pathare, P.B.; Roskilly, A.P.; Aguilar, M.C. Biogas Tri-generation for Postharvest Processing of Agricultural Products in a Rural Community: Techno-economic Perspectives. Energy Procedia 2017, 142, 63–69. [Google Scholar] [CrossRef]
  9. Lamidi, R.O.; Wang, Y.D.; Pathare, P.B.; Roskily, A.P. Evaluation of CHP for Electricity and Drying of Agricultural Products in a Nigerian Rural Community. Energy Procedia 2017, 105, 47–54. [Google Scholar] [CrossRef]
  10. Purdy, A.; Pathare, P.B.; Wang, Y.; Roskilly, A.P.; Huang, Y. Towards sustainable farming: Feasibility study into energy recovery from bio-waste on a small-scale dairy farm. J. Clean. Prod. 2018, 174, 899–904. [Google Scholar] [CrossRef]
  11. Russo, V.; von Blottnitz, H. Potentialities of biogas installation in South African meat value chain for environmental impacts reduction. J. Clean. Prod. 2017, 153, 465–473. [Google Scholar] [CrossRef]
  12. Osunde, Z.D.; Orhevba, B.A. Effects of storage conditions and storage period on nutritional and other qualities of stored yam tubers. Afr. J. Food Agric. Nutr. Dev. 2009, 9, 678–690. [Google Scholar]
  13. Amponsah, S.K.; Akowuah, J.O.; Adu-kwarteng, E.; Bessah, E. Design and construction of improved yam storage structure using locally-available materials. Int. J. Res. Agric. For. 2015, 2, 1–11. [Google Scholar]
  14. Onwueme, I.C.; Charles, W.B. Tropical Root and Tuber Crops: Production, Perspectives and Future Prospects; Food Agriculture Organization: Rome, Italy, 1994. [Google Scholar]
  15. NERC-Nigeria Electricity Regulation Commission. Draft Feed-In-Tariff Regulations for Renewable Energy Sourced Electricity in Nigeria; NERC-Nigeria Electricity Regulation Commission: Abuja, Nigeria, 2015. [Google Scholar]
  16. Soneye, A.S.O. Farm Holdings in Northern Nigeria and Implication for Food Security: A Remote Sensing and GIS Assessment. Afr. J. Food Agric. Nutr. Dev. 2014, 14, 1–15. [Google Scholar]
  17. Awotide, B.A.; Karimov, A.A.; Diagne, A. Agricultural technology adoption, commercialization and smallholder rice farmers’ welfare in rural Nigeria. Agric. Food Econ. 2016, 4, 3. [Google Scholar] [CrossRef]
  18. Adeniyan, O.N.; Aluko, O.A.; Olanipekun, S.O.; Olasoji, J.O.; Aduramigba-Modupe, V.O. Growth and Yield Performance of Cassava/Maize Intercrop Under Different Plant Population Density of Maize. J. Agric. Sci. 2014, 6, 35–40. [Google Scholar] [CrossRef]
  19. Government of Benue State. Indigenous Administrative Structure and Institutions; Nigerian Benue State Minist Lands Survey, 2018.
  20. Simonyan, K.J.; Fasina, O. Biomass resources and bioenergy potentials in Nigeria. Afr. J. Agric. Res. 2013, 8, 4975–4989. [Google Scholar]
  21. Garba, N.A.; Zangina, U. Rice straw & husk as potential sources for mini-grid rural electricity in Nigeria. Int. J. Appl. Sci. Eng. Res. 2015, 4, 523–530. [Google Scholar]
  22. Nguyen, H.H.; Heaven, S.; Banks, C. Energy potential from the anaerobic digestion of food waste in municipal solid waste stream of urban areas in Vietnam. Int. J. Energy Environ. Eng. 2014, 5, 365–374. [Google Scholar] [CrossRef] [Green Version]
  23. Lindorfer, H.; Braun, R.; Kirchmayr, R. Self-heating of anaerobic digesters using energy crops. Water Sci. Technol. 2006, 53, 159–166. [Google Scholar] [CrossRef] [PubMed] [Green Version]
  24. Thirugnanasambandam, M.; Iniyan, S.; Goic, R. A review of solar thermal technologies. Renew. Sustain. Energy Rev. 2010, 14, 312–322. [Google Scholar] [CrossRef]
  25. Firdous, R.; Gilani, A.H. Changes in Chemical Composition of Sorghum as Influenced by Growth Stage and Cultivar. Asian-Australas J. Anim. Sci. 2001, 14, 935–940. [Google Scholar] [CrossRef]
  26. Fezzani, B.; Cheikh, R.B. Implementation of IWA anaerobic digestion model No. 1 (ADM1) for simulating the thermophilic anaerobic co-digestion of olive mill wastewater with olive mill solid waste in a semi-continuous tubular digester. Chem. Eng. J. 2008, 141, 75–88. [Google Scholar] [CrossRef]
  27. Mansouri, R.; Boukholda, I.; Bourouis, M.; Bellagi, A. Modelling and testing the performance of a commercial ammonia/water absorption chiller using Aspen-Plus platform. Energy 2015, 93, 2374–2383. [Google Scholar] [CrossRef]
  28. Njie, D.N.; Rumsey, T.R.; Singh, R.P. Thermal properties of cassava, yam and platain. J. Food Eng. 1998, 37, 63–76. [Google Scholar] [CrossRef]
  29. Peiris, K.H.S.; Mallon, J.L.; Kays, S.J. Respiratory rate and vital heat of some specialty vegetables at various storage temperatures. Horttechnology 1997, 7, 46–49. [Google Scholar] [CrossRef]
  30. Tampio, E.; Marttinen, S.; Rintala, J. Liquid fertilizer products from anaerobic digestion of food waste: Mass, nutrient and energy balance of four digestate liquid treatment systems. J. Clean. Prod. 2016, 125, 22–32. [Google Scholar] [CrossRef]
Figure 1. A typical Nigerian yam market [3].
Energies 12 00872 g001
Figure 2. Schematic of the designed system for cooling and power cogeneration.
Energies 12 00872 g002
Figure 3. Yam storage store: (a) overall shape; (b) inner arrangement; (c) structural cross-section.
Energies 12 00872 g003
Figure 4. Schematic diagram of anaerobic digestion process.
Energies 12 00872 g004
Figure 5. Aspen Plus (AP) model of internal combustion engine (ICE) and heat recovery.
Energies 12 00872 g005
Figure 6. AP model of Rabur Absorption chiller.
Energies 12 00872 g006
Figure 7. Electrical efficiency vs. various ambient temperatures.
Energies 12 00872 g007
Figure 8. Effect of biogas composition on power output.
Energies 12 00872 g008
Figure 9. Net present value (NPV) vs. various interest rates and sale prices.
Energies 12 00872 g009
Figure 10. Profitability index vs. various electricity prices and interest rates.
Energies 12 00872 g010
Table 1. Major yam producing countries in 2017 [2].
World (Million Tonnes)68.132
Nigeria45
Ghana7.119
Cote d’Ivoire5.809
Benin3.221
Ethiopia1.449
Togo0.786
Cameroon0.579
Central African Republic0.479
Haiti0.477
Chad0.444
Table 2. The amount of crop residue per rural household.
Crop ResidueRiceSorghumSoybean
Yield (kg·ha−1)2175.21239.8944
Planted/household (ha·yr−1)11.51.5
Household production (kg·yr−1)2175.21859.71410
Residue typeStrawHuskStrawHuskStrawpod
Moisture content (%)12.712.3715151515
Residue grain ratio (%)1.7570.201.250.202.51.0
Residue availability (%)83.510083.510070100
Residue/household (kg·yr−1)3191.25435.041941.06371.942467.51410
Table 3. Electricity demands of the selected village.
TypeUnit Energy Demand (kWh·d−1)Currently Used
Households2003.5·households−1None
Commercial4300 4 × 10 HP generator
Health centre1180 10 HP × 1
Primary school1UnknownNone
Table 4. Features of crop residues used for the study [25].
CropMoisture Content (WB)Crude Protein (%)Volatile Solids (%)Crude Fibre (%)Ether Extracts (%)Ash (%)
Rice12.7158040320
Sorghum154963535
Soybeans1512954675
Table 5. Parameters of the internal combustion engine (ICE) and the absorption chiller.
ItemsParametersAmount
Internal combustion enginePower (kW)72
Fuel consumption (Nm3·h−1)42.2
Ambient air temperature (°C)25
Jacket water temperature (°C)99
Compression ratio10.5:1
Combustion air flow rate (m3·h−1)292
Displacement (L)10.5
Exhaust stack temperature (°C)581
Exhaust gas flow rate (m3·h−1)324
Heat rejection to jacket water (kW)99
Heat rejection to lubricant oil (kW)16
Absorption chillerPower (kW)17.5
Nominal water flow rate (m3·h−1)2.77
Temperature change (ΔT) (°C)5.5
Water capacity pressure loss (kPa)29
Ambient operating temperature (°C)0–45
Thermal input (kW)25
Electric power (kW)0.84
Table 6. Inputs for economic analysis.
ParametersAmount
Capital cost (AD + ICE system) (USD·kW−1)2900
Capital cost (cold storage)a (USD·unit−1)2000
Capital cost (chiller)b (USD·unit−1)35,508.18
Fixed O&M (AD + ICE system) (USD·kW−1·yr−1)53.5
Variable O&M (AD + ICE) (USD·MWh−1)0.95
Variable O&M (cold storage) (USD·MWh−1)0.15
Fuel cost (USD·MWh−1)5
Parasitic load (%)10
Life Span (Yr)20
Interest rates (%)7, 9, 20
Capacity (kW)72
Availability (%)90
Exchange rate (USD·#−1)305
Price of yam tuber (fresh) (USD·tuber−1)0.82
Price of yam tuber (off-season) (USD·tuber−1)1.64
Price of yam tuber (export) (USD·tuber−1)3.25
Electricity price (rural grid) (USD·kWh−1)0.013
Electricity price (Self-generated) (USD·kWh−1)0.75
Electricity price (REA) (USD·kWh−1)0.42
FITs Biomass (N·MWh−1)37,357
Replacement (60000h) (USD·kW−1)1389.77
Total project cost357,324.50
a Nigerian manufacturers, b Online suppliers.
Table 7. Comparison of thermophilic and mesophilic processing conditions.
ItemsMesophilic ProcessThermophilic Process
Operating temperature (°C)3555
Percentage methane (%)64.8058.20
Specific biogas production (L·kgVS−1·day−1)256.16293.56
Specific methane production (g·kgVS−1·day−1)190.26196.80
Table 8. Biochemical energy balance of anaerobic digestion (AD) system.
CompositionPercentage
(Dry Basis)
Molar Mass
(g·mole−1)
Daily Flow
(kg·day−1)
H R 0
(kJ·mole−1)
Enthalpy Heat
(kW)
Carbohydrates64.441803466.87−138.50−30.87
Protein7.0089376.6+198.50+9.72
Lipids4.33300232.95+544.50+4.89
Total heat of enthalpy−16.26
Table 9. Total heat load of AD process.
Required Load (kW)Mesophilic (35 °C)Thermophilic (55 °C)
Substrate warming up+62.72+188.16
Biochemical heat of reaction−16.26−16.26
Heat loss through insulation+0.88+2.64
Heat loss by radiation+0.0386+0.312
Total heat load required47.38174.85
Table 10. Cooling load required.
ParticularsRequired Load (kW)
Sensible cooling load required34.83
Respiratory heat generated7.43 × 10−2
Heat loss through insulation5.93 × 10−1
Heat loss by radiation1.43 × 10−3
Total cooling load required35.50
Table 11. Composition of biogas fuel.
S/NGasMethaneCO2
1Base0.7050.295
2Bio800.8000.200
3Bio700.7000.300
4Bio600.6000.400
5Bio500.5000.500
6Bio400.4000.600
Table 12. Effects of interest rates on levelised cost of energy (LCOE).
Interest Rate (%)Local (USD·kWh−1)Foreign (USD·kWh−1)
70.1150.111
90.1240.120
200.2760.272
Table 13. Payback periods at various electricity prices and interest rates.
Interest RatesUSD0.013·kWh−1USD0.105·kWh−1USD0.420·kWh−1
7%negative11.52.01
9%negative18.62.48
20%negativenegative4.70

