1. Introduction
Geothermal energy is recognized as a source of renewable energy that is environmentally friendly and technically feasible. For this reason, geothermal energy technologies can benefit from any climate mitigation policies. Directive 2009/28/EC [
1] on the promotion of the use of energy from renewable sources has been the most significant piece of EU legislation for geothermal energy. The main objectives are focused in the reduction of at least 20% in greenhouse gas (GHG) emissions compared to 1990 levels, with 20% of the final energy consumption to come from renewable sources and the improvement of energy efficiency by 20% compared to 2007 projections. These goals are the main drivers for the growth of geothermal technologies.
For this reason, development of low energy consumption in HVAC systems is important. Taking the year 2010 in Spain as reference, the main distribution of energy consumption in buildings is concentrated in HVAC, domestic hot water (DHW), equipment, and lighting. The HVAC and DHW necessities cover 62% of the total energy consumption in buildings [
2]. The experimental installation built is composed of a ground-coupled heat pump (GCHP) and radiant floor (RF) system supported by a mechanical ventilation system (MV) [
3,
4]. The energy is extracted from a ground heat exchanger (GHE) drilled to a depth of 100 m [
5,
6,
7].
There are many studies that analyze the behavior of each of the elements that make up the geothermal system, focusing on the operation of the GHE from theoretical and simulation models [
8,
9] or in an experimental installation monitoring different variables [
10,
11,
12,
13]. Related with control systems of the installation [
14], demonstrate that the use of automatic systems to control the circulating pump speed versus classical adjustment case increased the coefficient of performance of the seasonal energy efficiency ratio (COP
sys) (COP
sys 7–8% higher and 7.5–8% lower CO
2 emission level).
Regarding the use of simulation tools [
15], analyzed the results obtained and compared this with the experimental data, based on the development of two numerical simulation models using transient systems simulation (TRNSYS). The main parameters analyzed were the useful thermal energy and COP
sys. The results present a small difference in the COP
sys (4.5%) between radiator system and radiant floor. Using the same operating conditions, the radiator system has 10% higher energy consumption and CO
2 emissions than the radiant floor system. Using ground heat exchanger software (GLHEPRO) and TRANSYS software [
16], analyzed the performance of an office building with heating and cooling necessities. The heat pump model development presented a deviation of 2% with respect to experimental results. The energy consumption of the heat pump unit was well predicted in the TRNSYS simulation model.
In relation to economic analysis [
17], performed an economic analysis of a residential ground heat system in sedimentary rock formation, demonstrating the feasibility of the system from performance analysis and giving solutions for improvement with regard to a reduction in utility bills. The analysis done between GCHP and natural gas concludes that the data also indicate a marginal reduction in utility bill, and they center the improvements in operations strategies and optimal design, two aspects that are considered in this paper from the beginning.
The present study is characterized by analyzing a building located in Madrid, Spain [
18], and consists of a GCHP, RF, and mechanical ventilation system to ensure the indoor air quality, not only focusing on energy performance, but also introducing the cost function and comparing the energy and economic results with other available technologies. The results obtained are used to analyze the possible investment for this type of installation from energy, economic, and environmental aspects, three principal factors to consider in any project. This new methodology analyzes the building globally. In addition, the difference to other studies is based on the action of four key points at the same time: decreasing the building energy demand, improving the energy efficiency of the building in the experimental design, developing a model simulation process to ensure the correct functioning of the installation, and validating the model designed in order to have a tool to simulate any building under different conditions. Using this model, a simulation process was done for the available technologies under the same building, obtaining energy results used to compare and analyze the viability of the GCHP system proposed. A new factor in this study is the comparative economic analysis between the technologies’ comments, obtaining economic results which determine the feasibility of the proposed design in a global way.
2. Experimental Building Description
2.1. Building Description
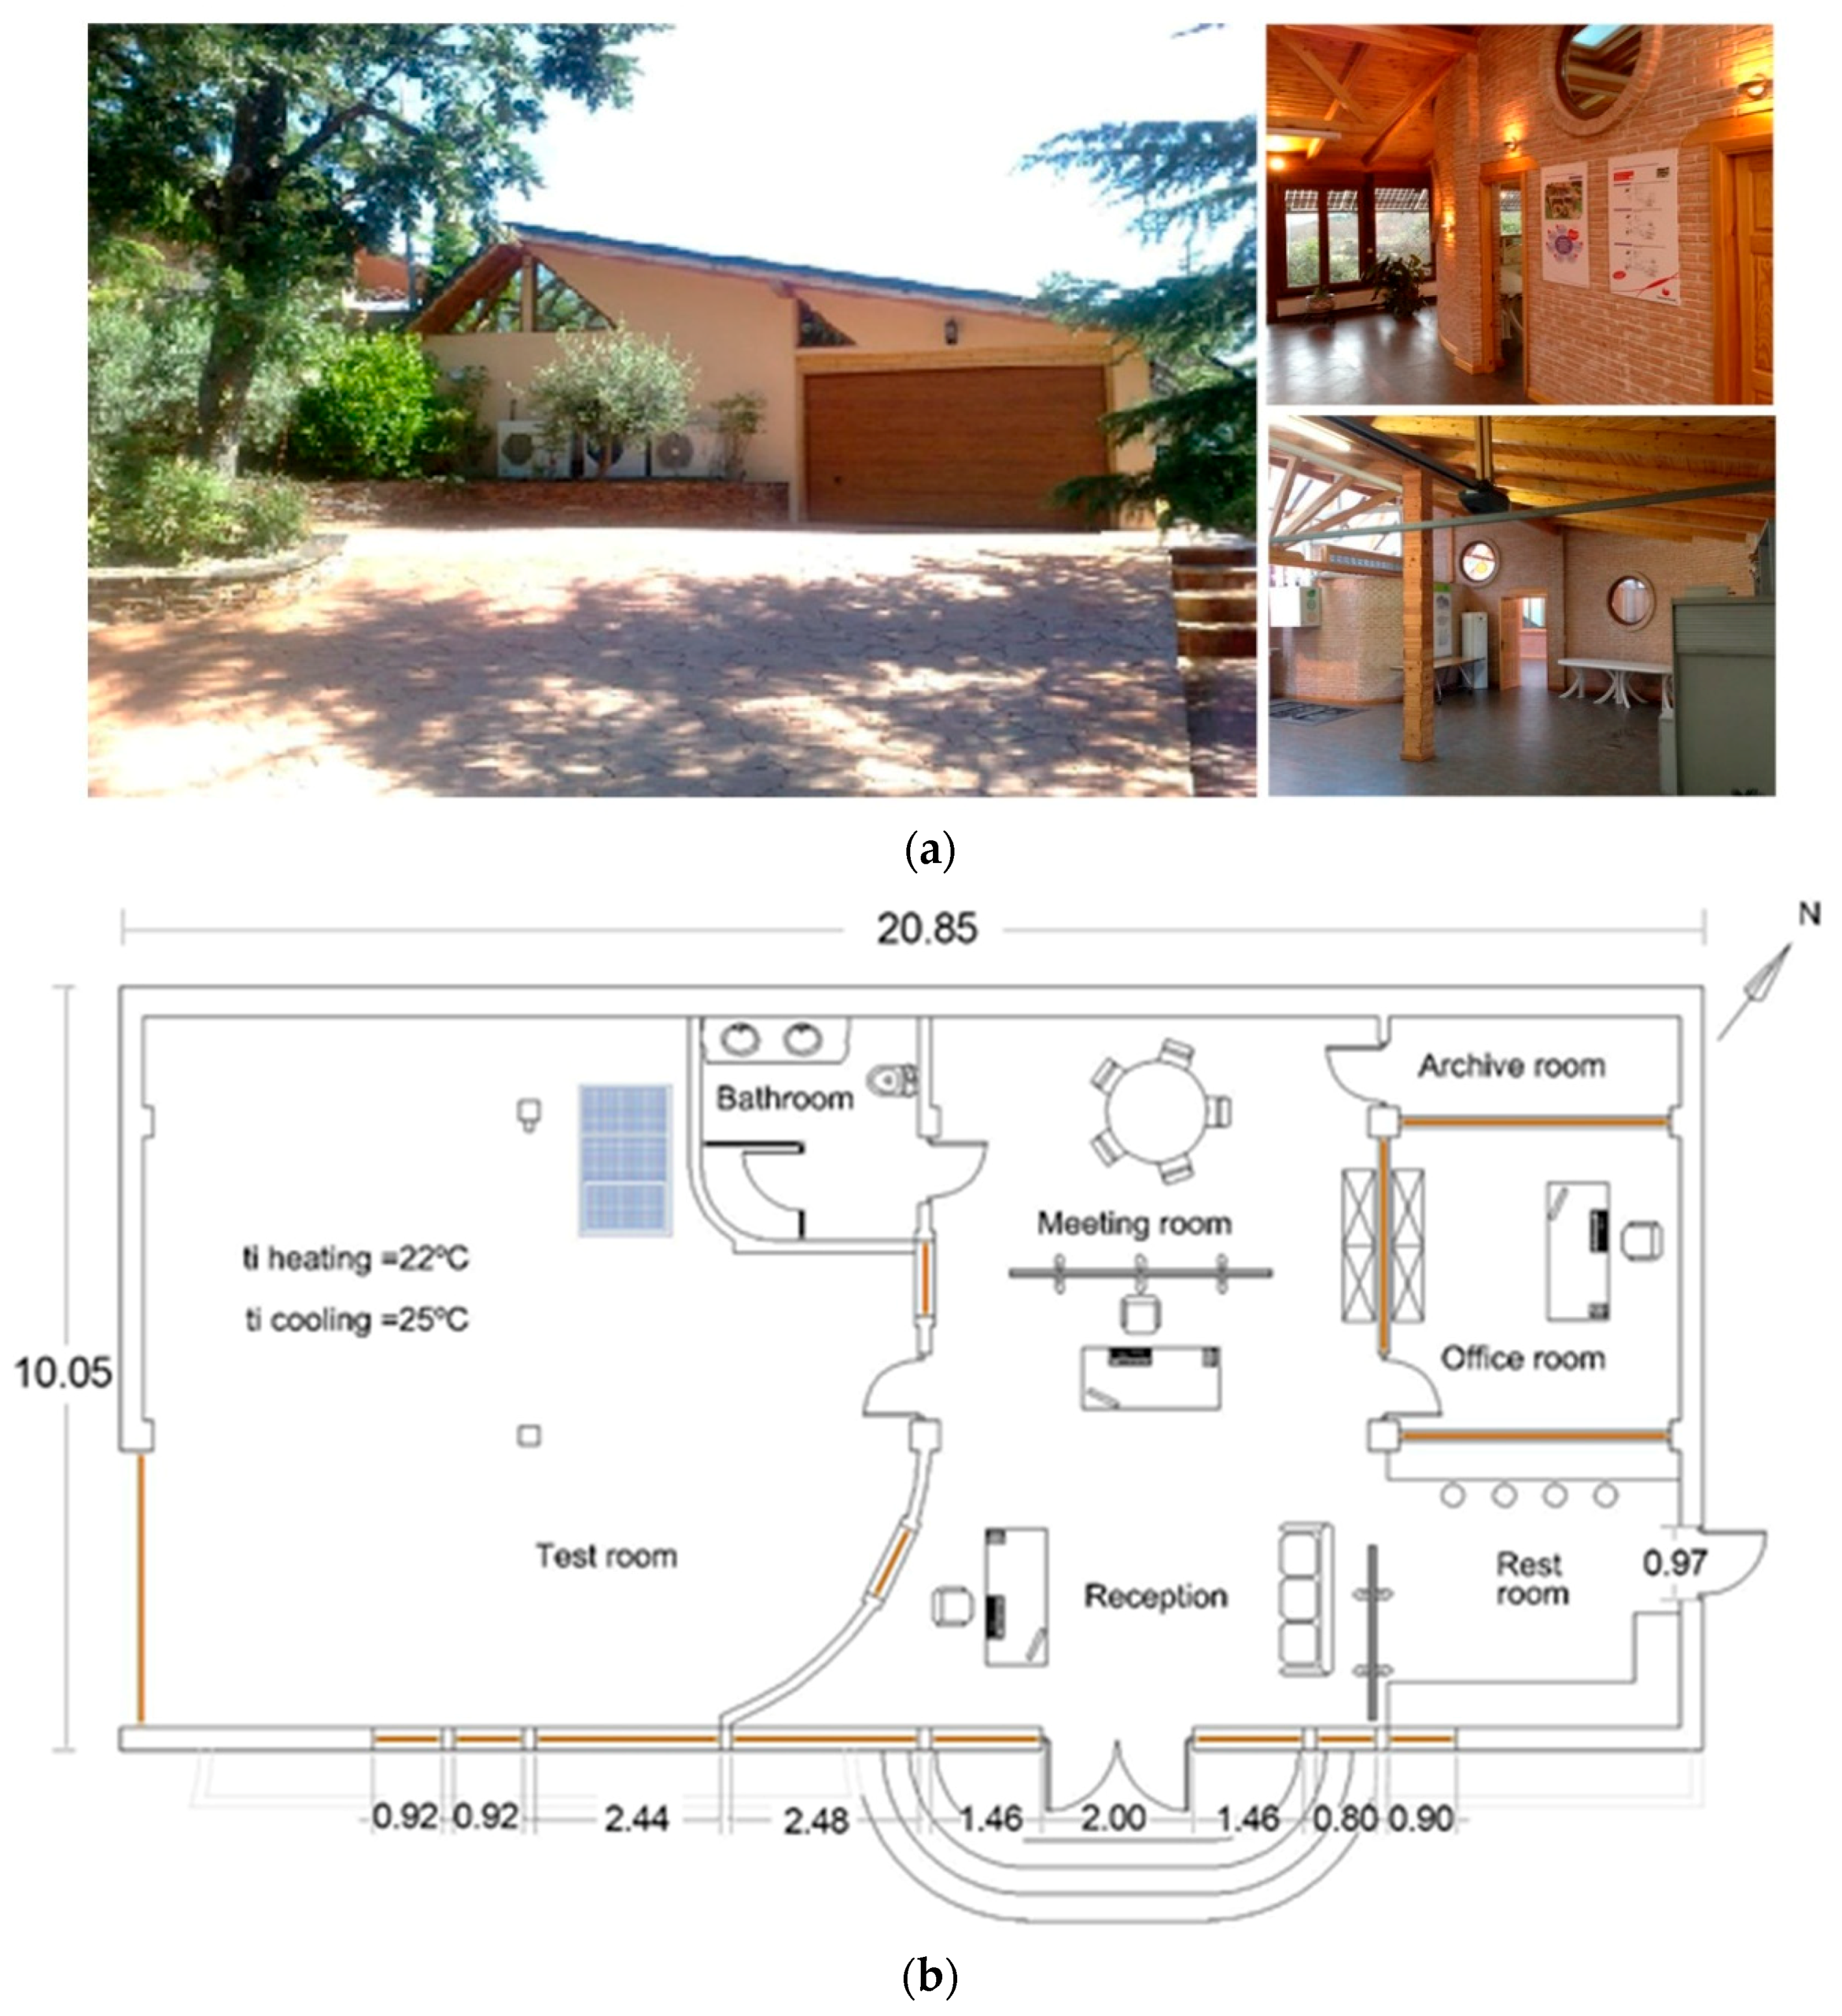
The office is located in Madrid, Spain, latitude +40.7° and longitude −3.99° and altitude of 1075 meters above sea level in a continental temperature climate (
Figure 1a). The building has 189 m
2 floor area and includes a reception, office room, meeting room, archive room, rest room, bathroom, and experimental showroom (
Figure 1b). The building is used as an office and is occupied by three people. The office building is located in Madrid, Spain, in a continental temperature climate (
Figure 1). The indoor temperature design is 22/25 °C for heating and cooling modes, respectively. The building is equipped with a vertical U-tube GHE, GCHP, RF, and MV systems.
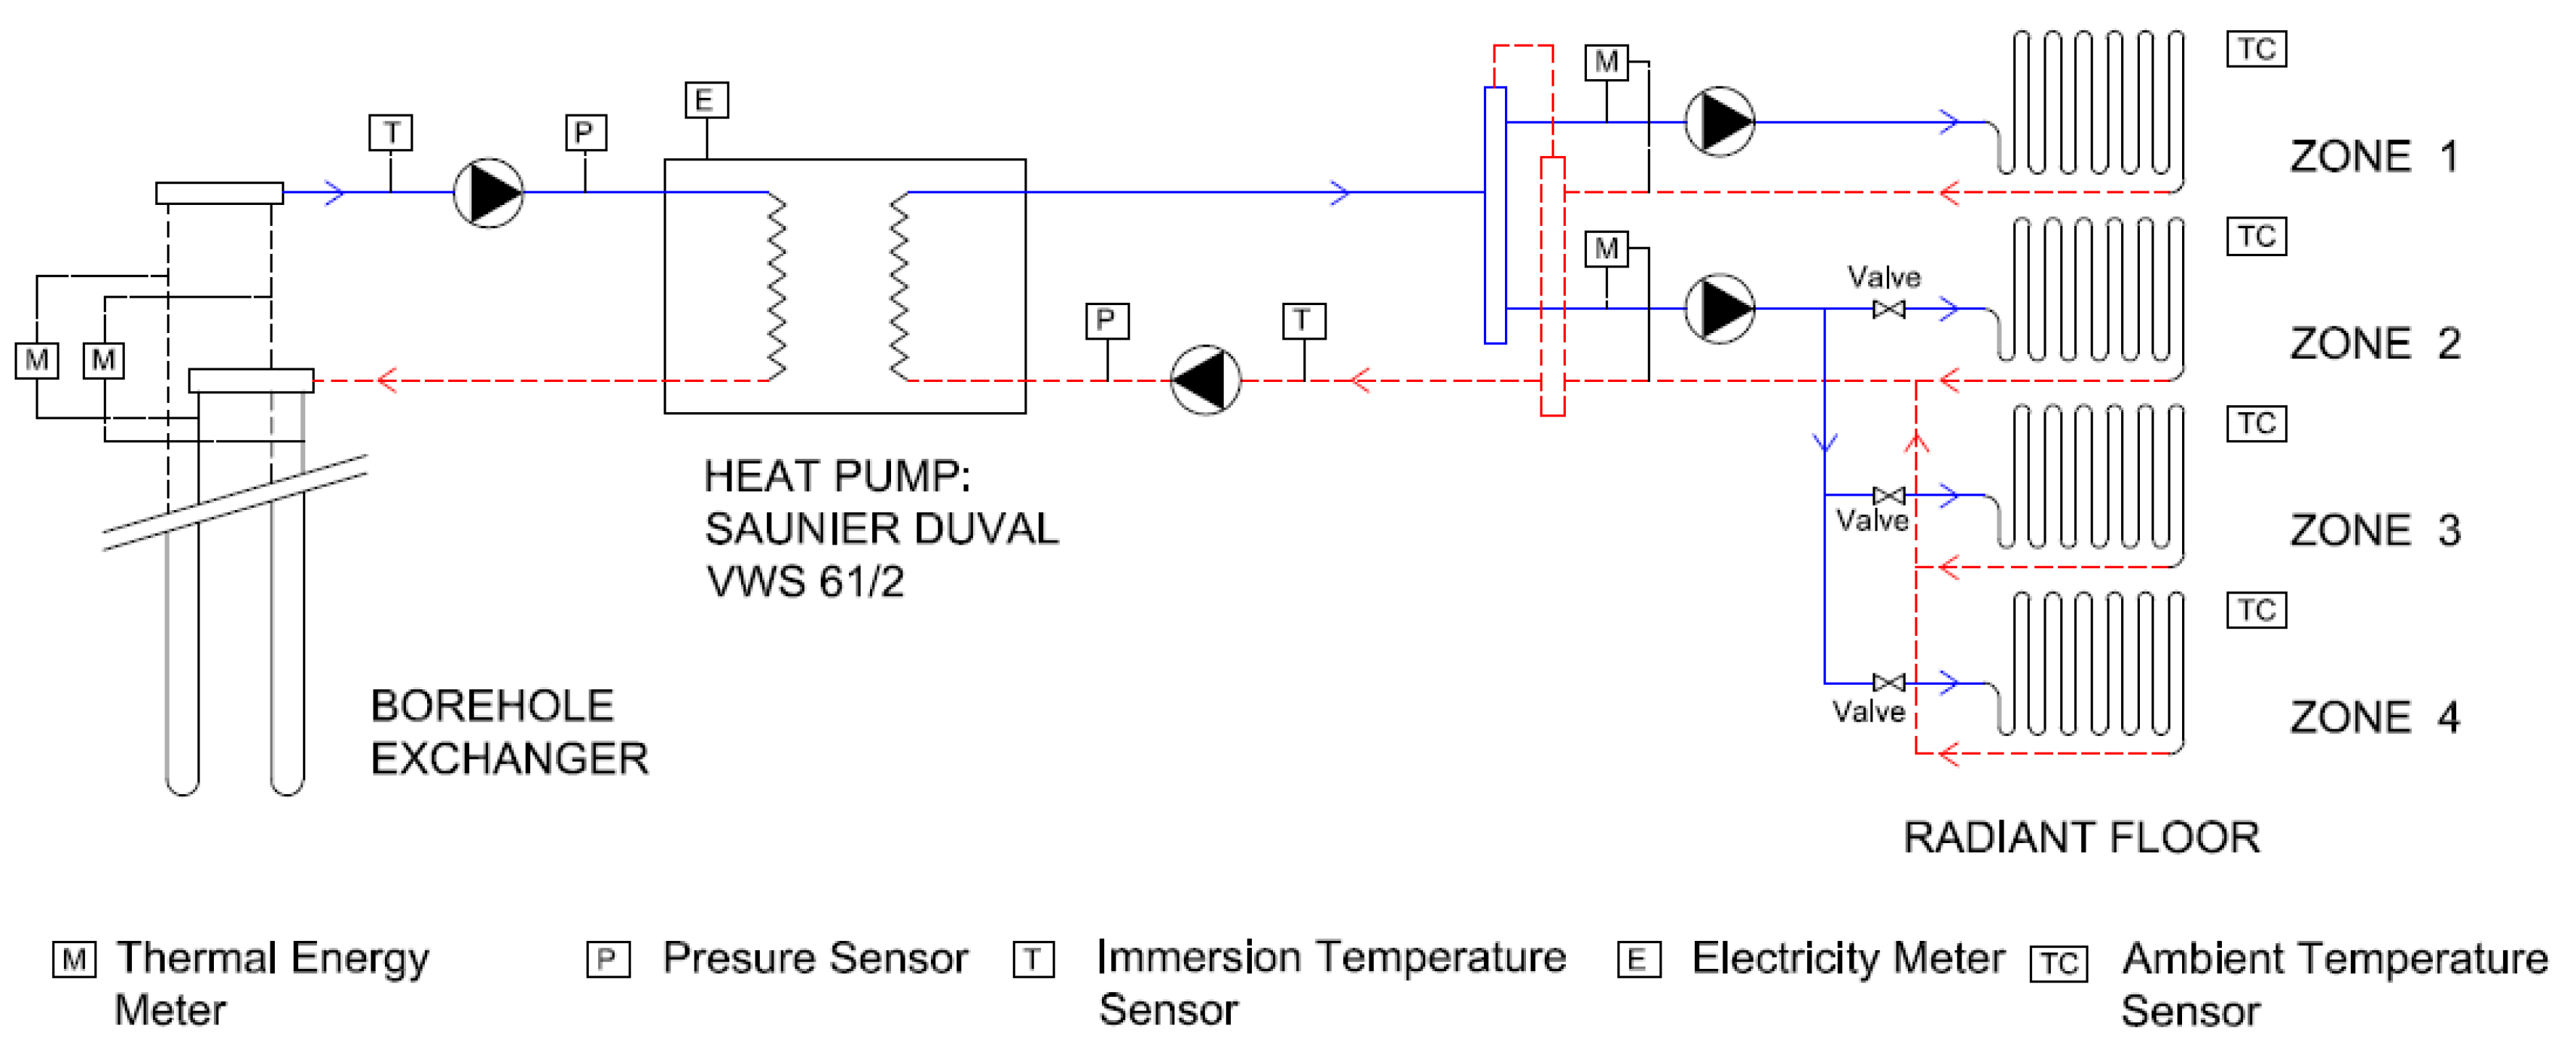
As shown in
Figure 2, the main parts of the system are BHE, heat pump unit, circulating water pumps, radiant floor, data acquisition instruments, and auxiliary parts.
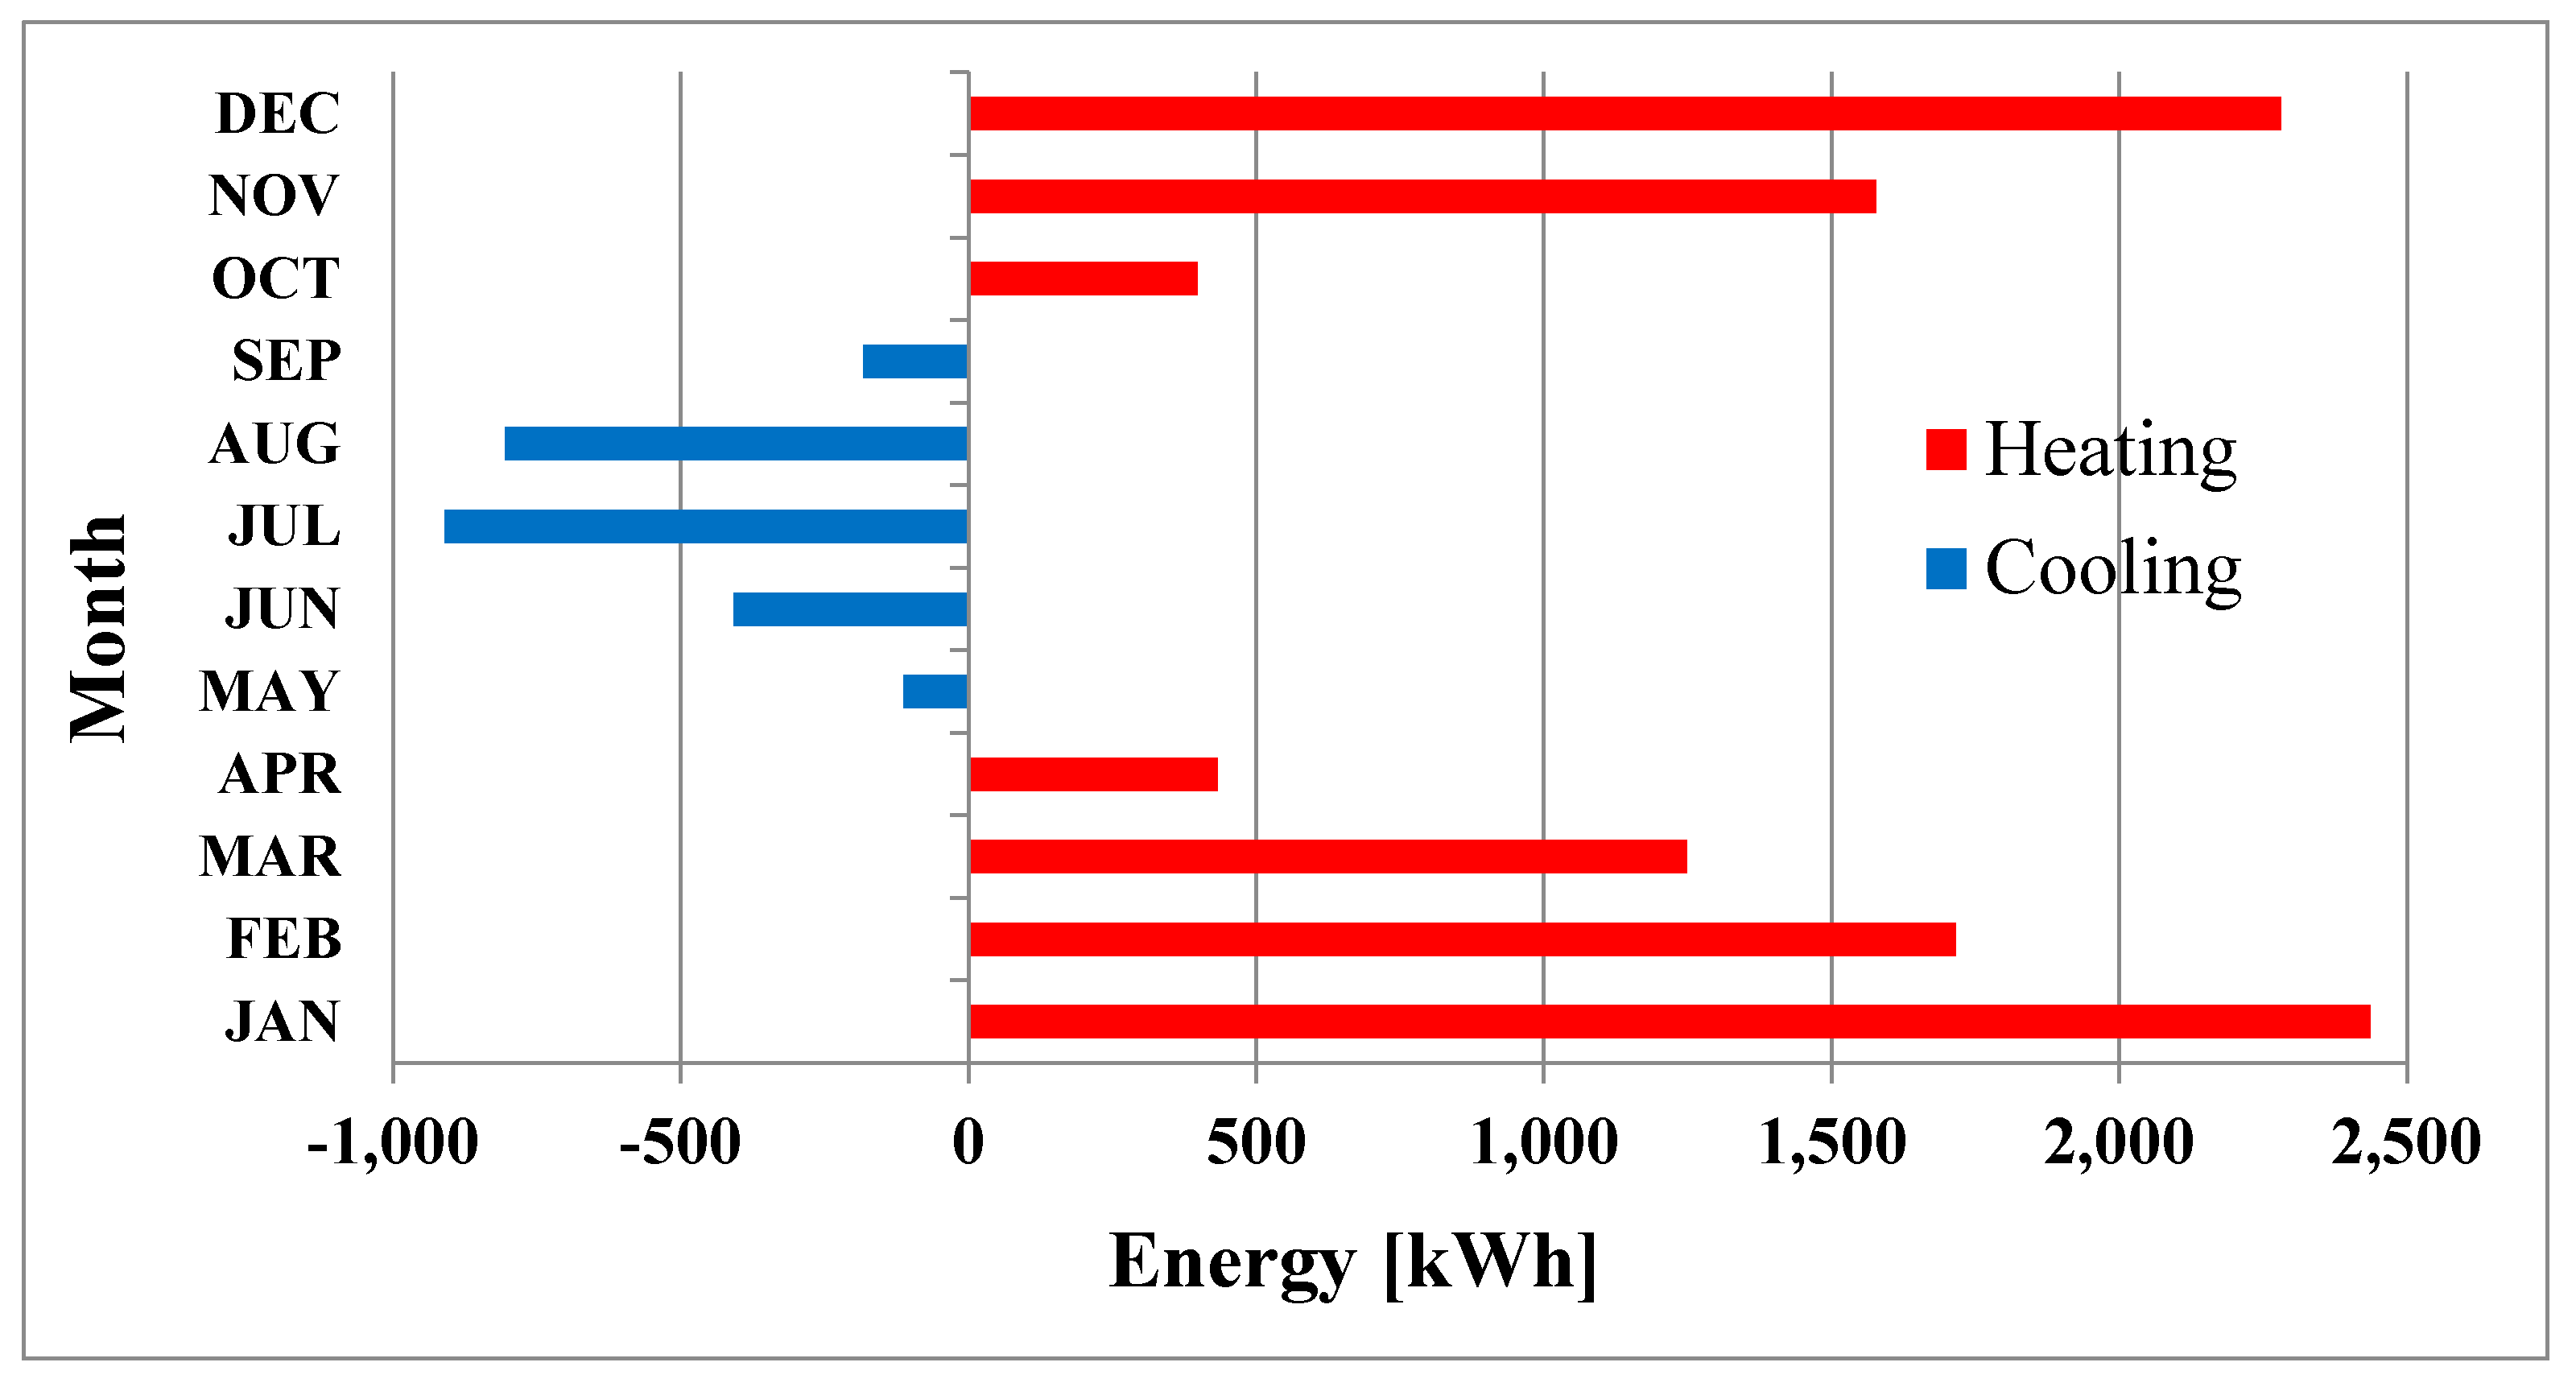
The monthly energy demand for the building in heating and cooling modes is illustrated in
Figure 3.
2.2. Borehole Heat Exchanger
The GHE is a vertical borehole with double U-shaped HDPE 100 pipes. The borehole was completely backfilled with bentonite, cement, and sand. The average thermal conductivity of the ground was 1.80 W/mK. The main thermal parameters are listed in
Table 1.
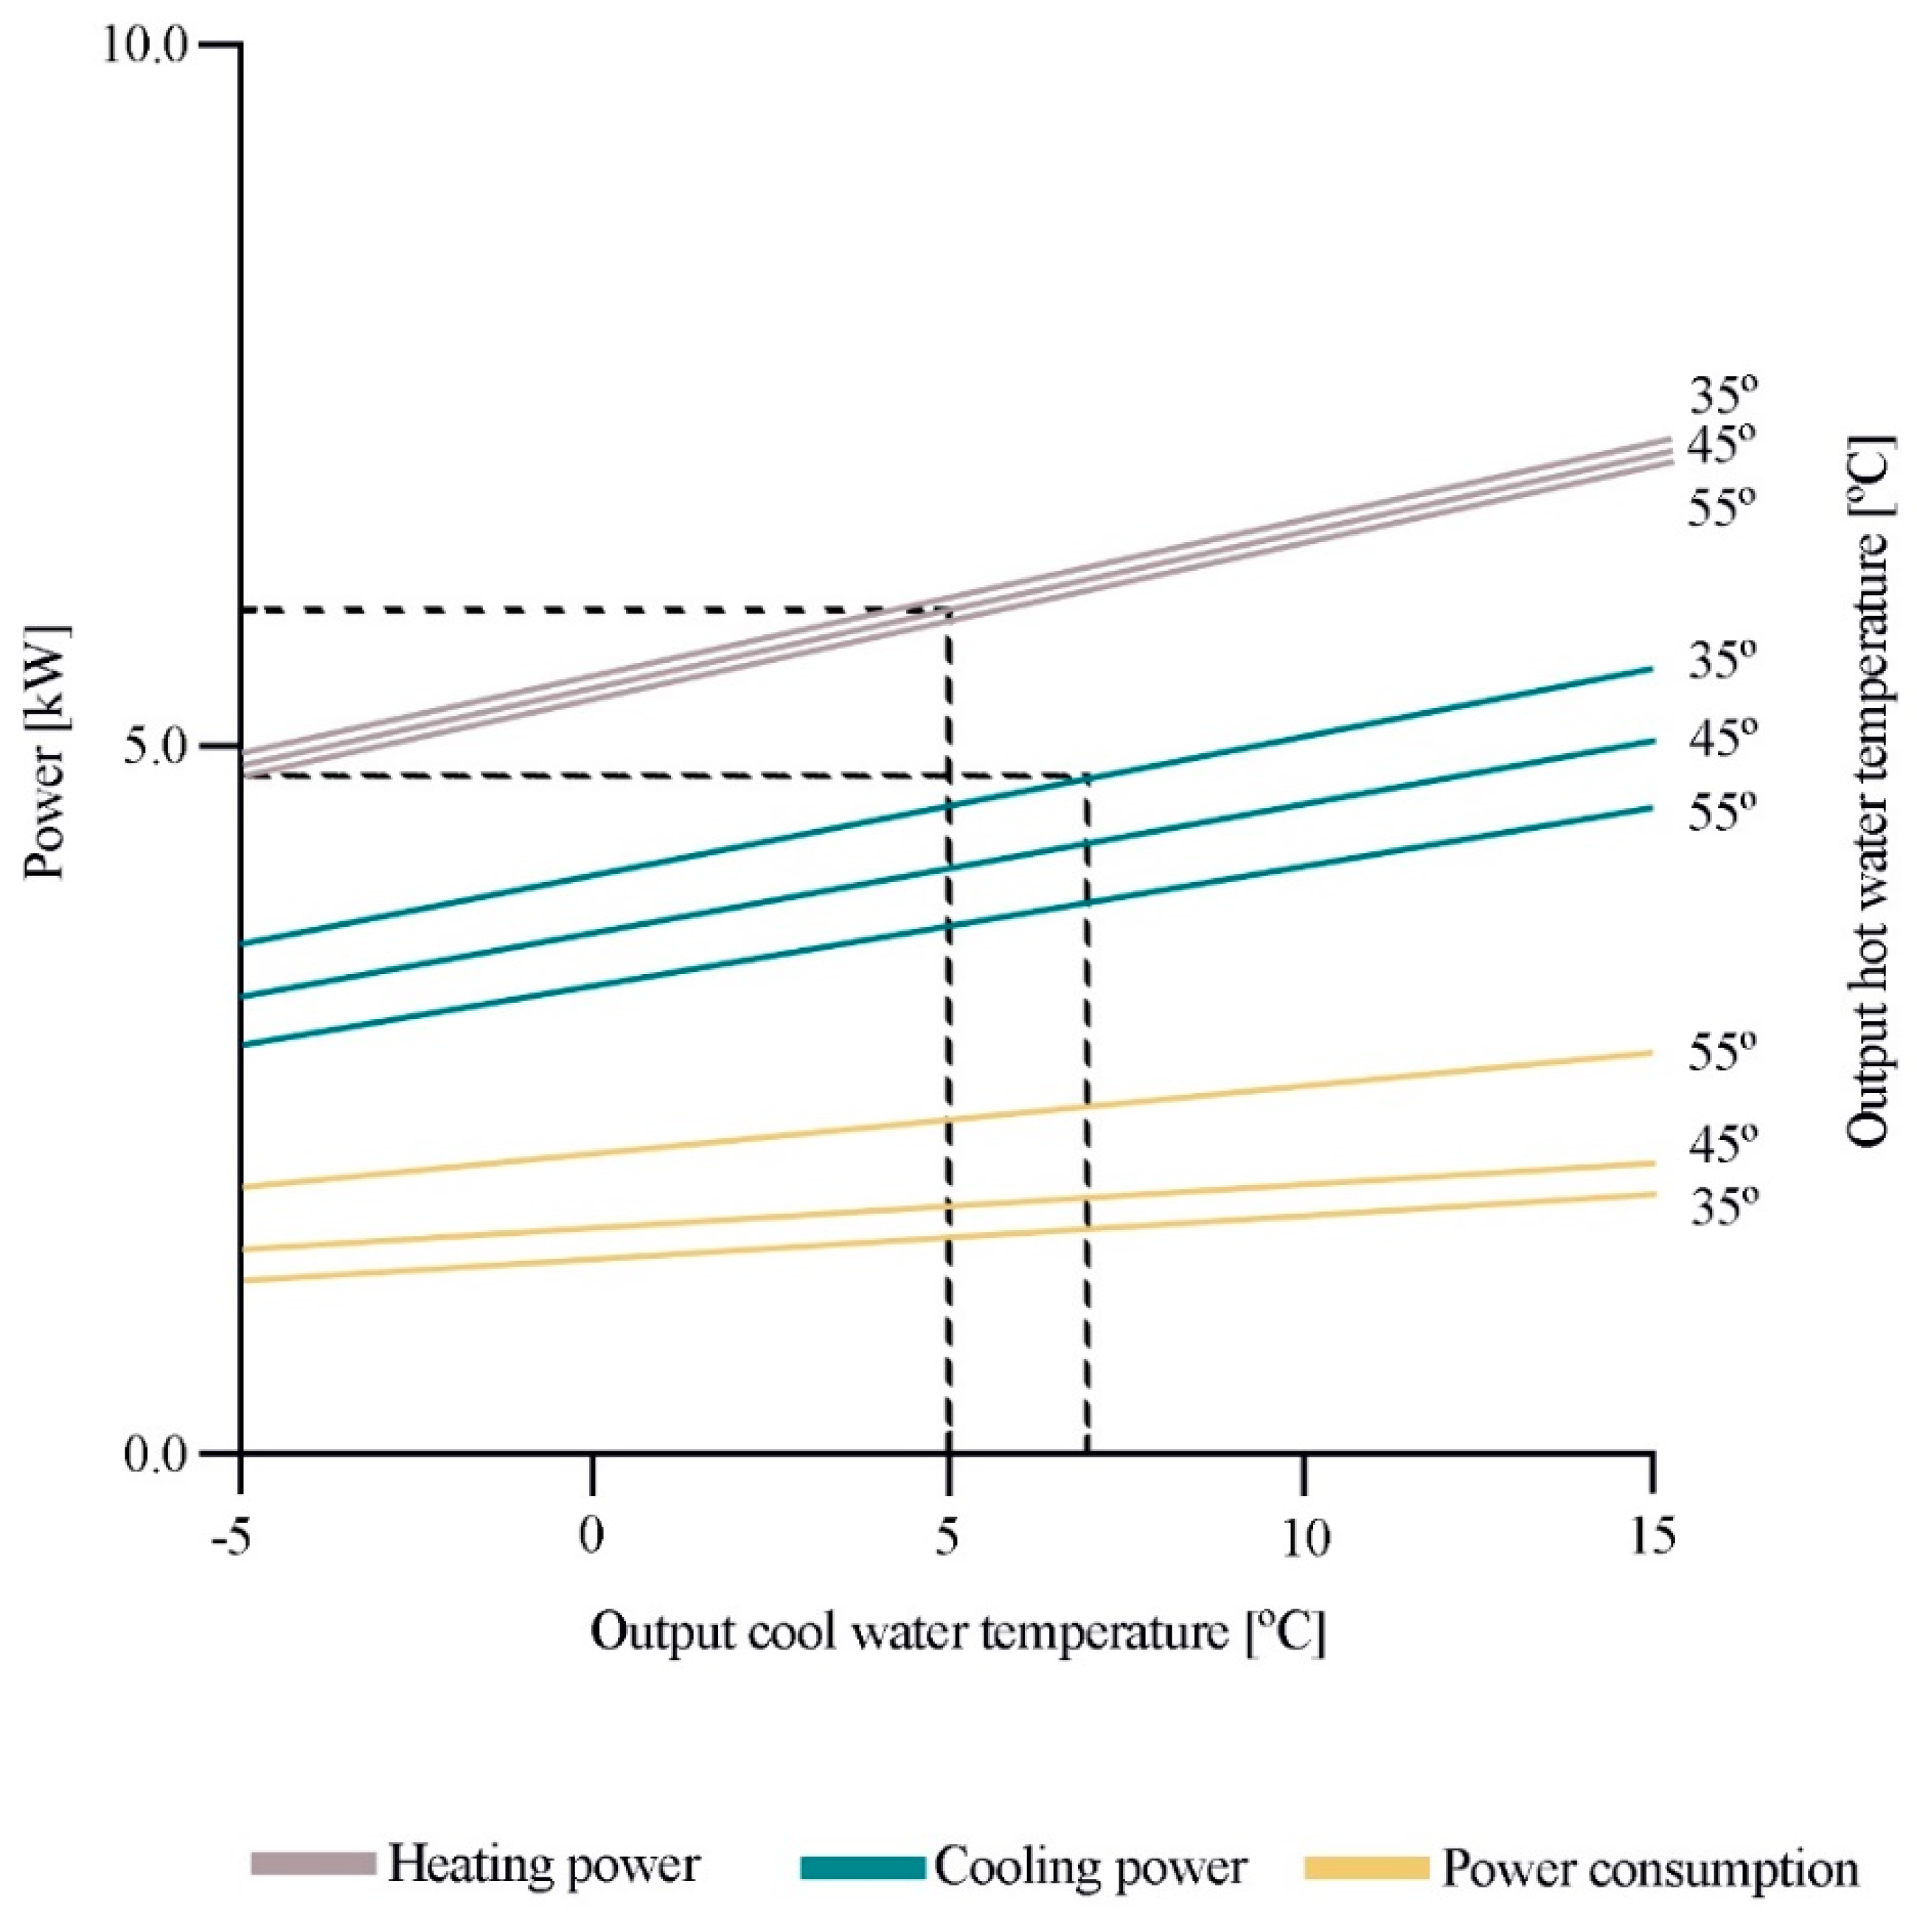
2.3. Ground-Coupled Heat Pump Unit
Due to the importance of electricity consumption in the COPSYS of the installation, it is necessary to select the adequate heat pump capacity and ensure that it can supply the thermal loads of the building under analysis. The installed GCHP is an SD VWS 61/2 model manufactured by SAUNIER DUVAL. The VWS series uses a scroll compressor unit with R-407c as a refrigerant. The COP for heating is 4.2 and an EER of 3.92 for cooling. The VWS 61/2 model has a nominal heating capacity of 6 kW and a nominal cooling capacity of 4.9 kW (a rated power of 1.25 kW). An ethylene glycol aqueous solution is circulated between the heat pump and the BHE with a WILO TOP-S 30/4EM water circulating pump with a maximum flow capacity of 4 m3/h. The same model of water pump is used for the radiant floor system. The total annual energy consumption of the water recirculating pumps is 608 kWh, which represented the 25.65% of the total energy consumption of the GCHP system.
Figure 4 shows the power consumption and heating and cooling capacities, and they were used to model the heat pump in EnergyPlus. The nominal rates have been calculated using hot water at 35 °C and cold water at 7 °C for cooling capacity, and cold water at 5 °C and hot water at 45 °C for heating capacity.
2.4. Mechanical Ventilation
The installed VMC is a SIBER DF MAX double flow equipment, with a maximum flow rate of 220 m3/h. The outside air is filtered and heated before being blown into the rooms in winter and cooled in summer with a 92% heat recovery.
2.5. Radiant Floor System
The RF system is distributed in four areas and with seven hydraulic circuits in order to ensure hydronic balance. The heat in each area is provided by one variable circulating pump and other variable circulation pumps for the other three zones. To achieve higher performances of the HVAC system, the thermostat controls the speed of the variable circulation pump depending on the heat carrier demand in the zone.
Figure 5 shows the distribution of RF circuits over the ground floor. This system guarantees a homogeneous indoor temperature distribution and increases the COP
SYS of the GCHP [
19,
20,
21]. The main characteristics are listed in
Table 2.
2.6. Data Acquisition and Experimental Procedure
A temperature and humidity sensors system were installed in the building, connected to a thermostat model EXACONTROL E7R C/SH, Saveris V2.0 converter, with a range of 0 to 80 °C and humidity range of 0% to 100%, with accuracy ±0.15 °C and 3%, respectively. These temperature sensors are Pt100. A Siemens Coriolis mass flow meter, model SITRANS FC MASS 6000 with an accuracy <0.1% was installed. The power meters are from Fluke, model 1736/EUS, with accuracy ±1.4 of the nominal value and used to measure the power consumption of the HP, MV, internal/external pumps, PCs, and lighting. The temperature sensors for the RF system are Orkli V05, with a range of 0–100 °C with an accuracy of ±0.3 °C.
3. Experiment Results
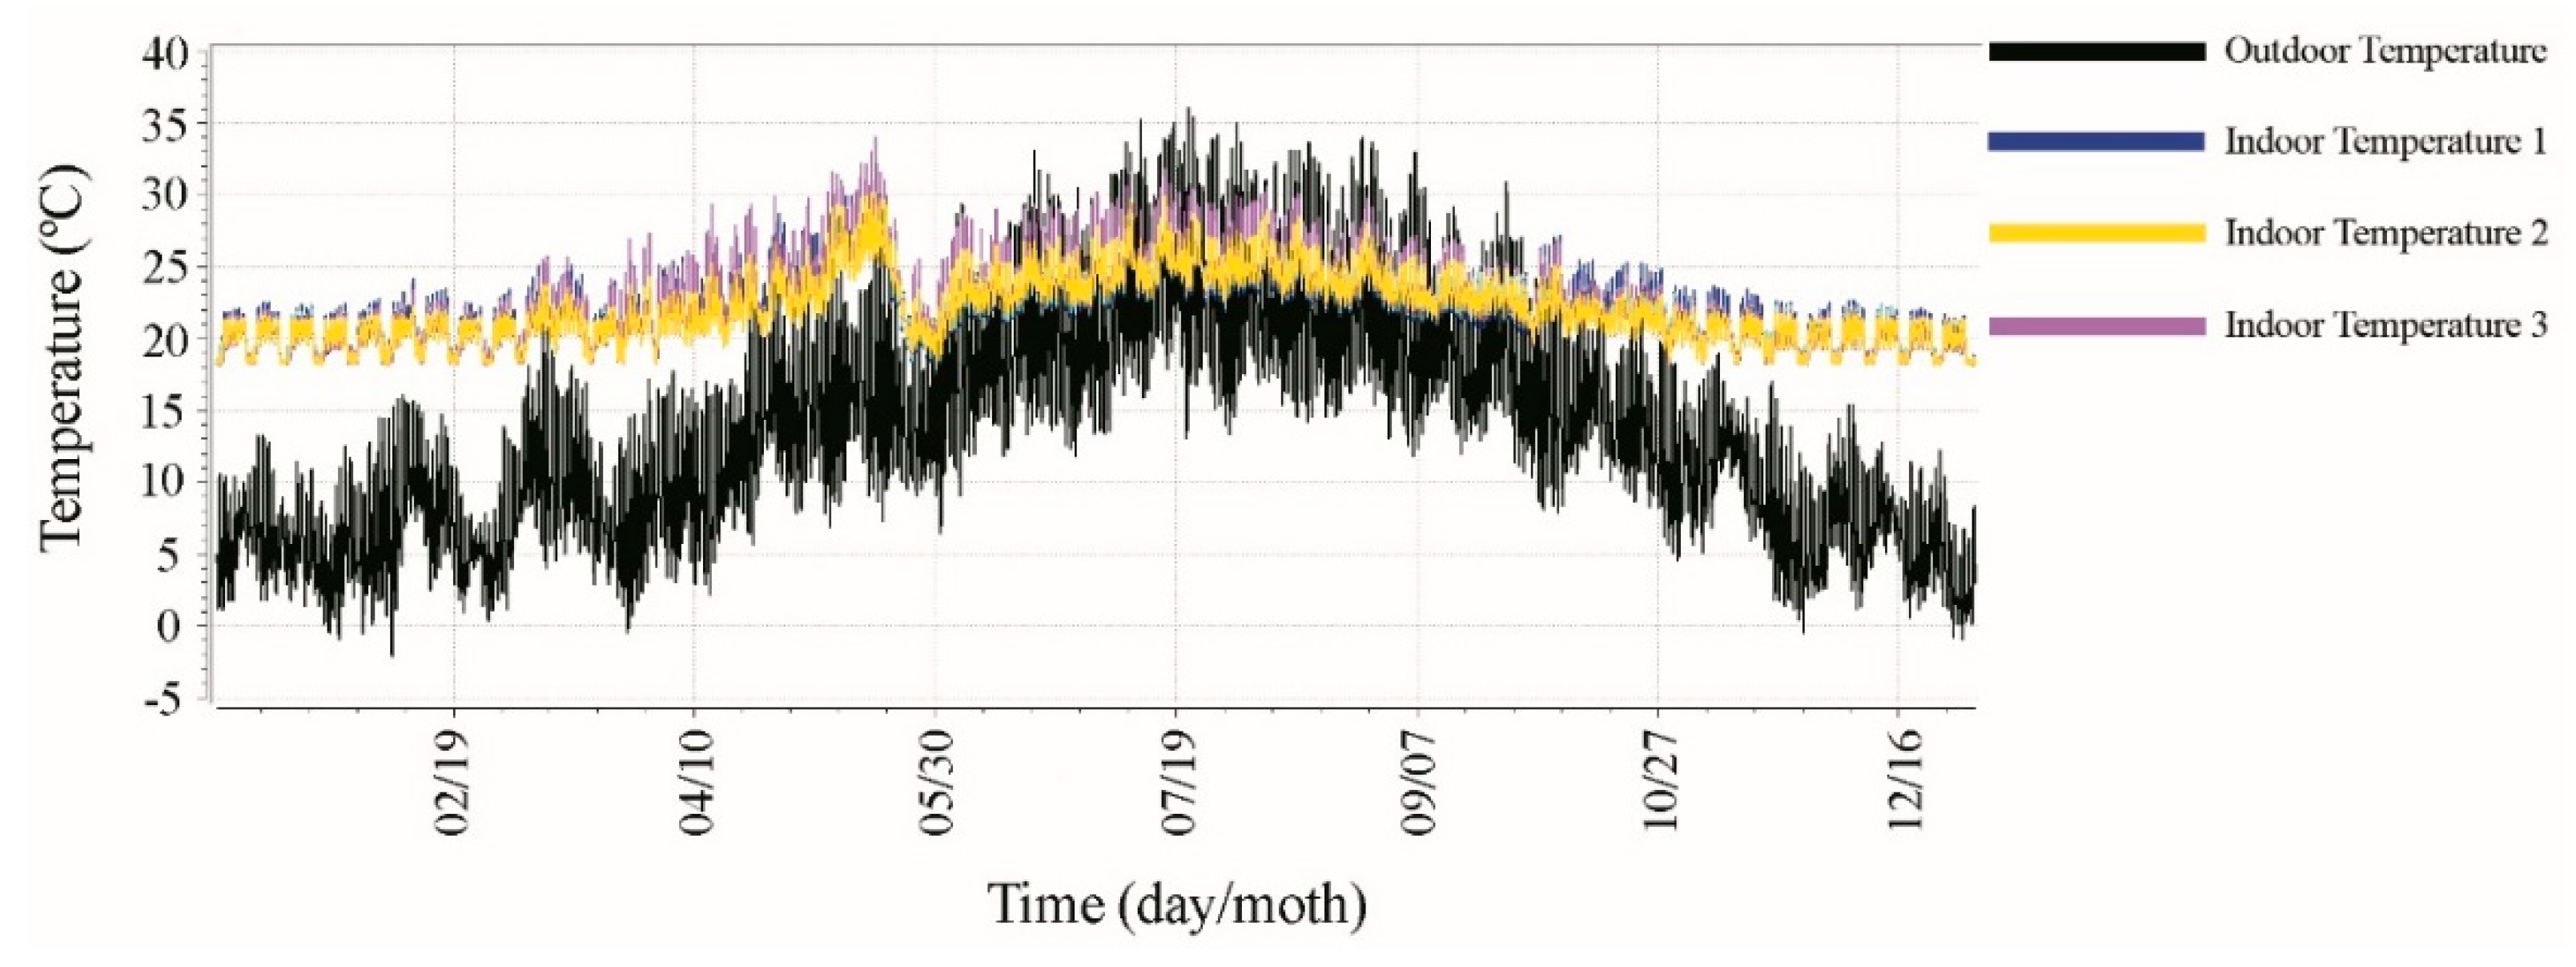
The study was carried out considering the two most unfavorable weeks in heating and cooling modes, obtained from the weather data file. The period corresponds to the months of January and July of 2011. The daily analysis period corresponds to the time band from 09:00 hs to 18:00 hs. Annual indoor and outdoor temperatures were measured for each zone and its evolution during the year is presented in
Figure 6. It is observed that in heating and cooling modes, the average temperature for each zone reaches the defined setpoints of 22 °C in heating and 25 °C in cooling operation.
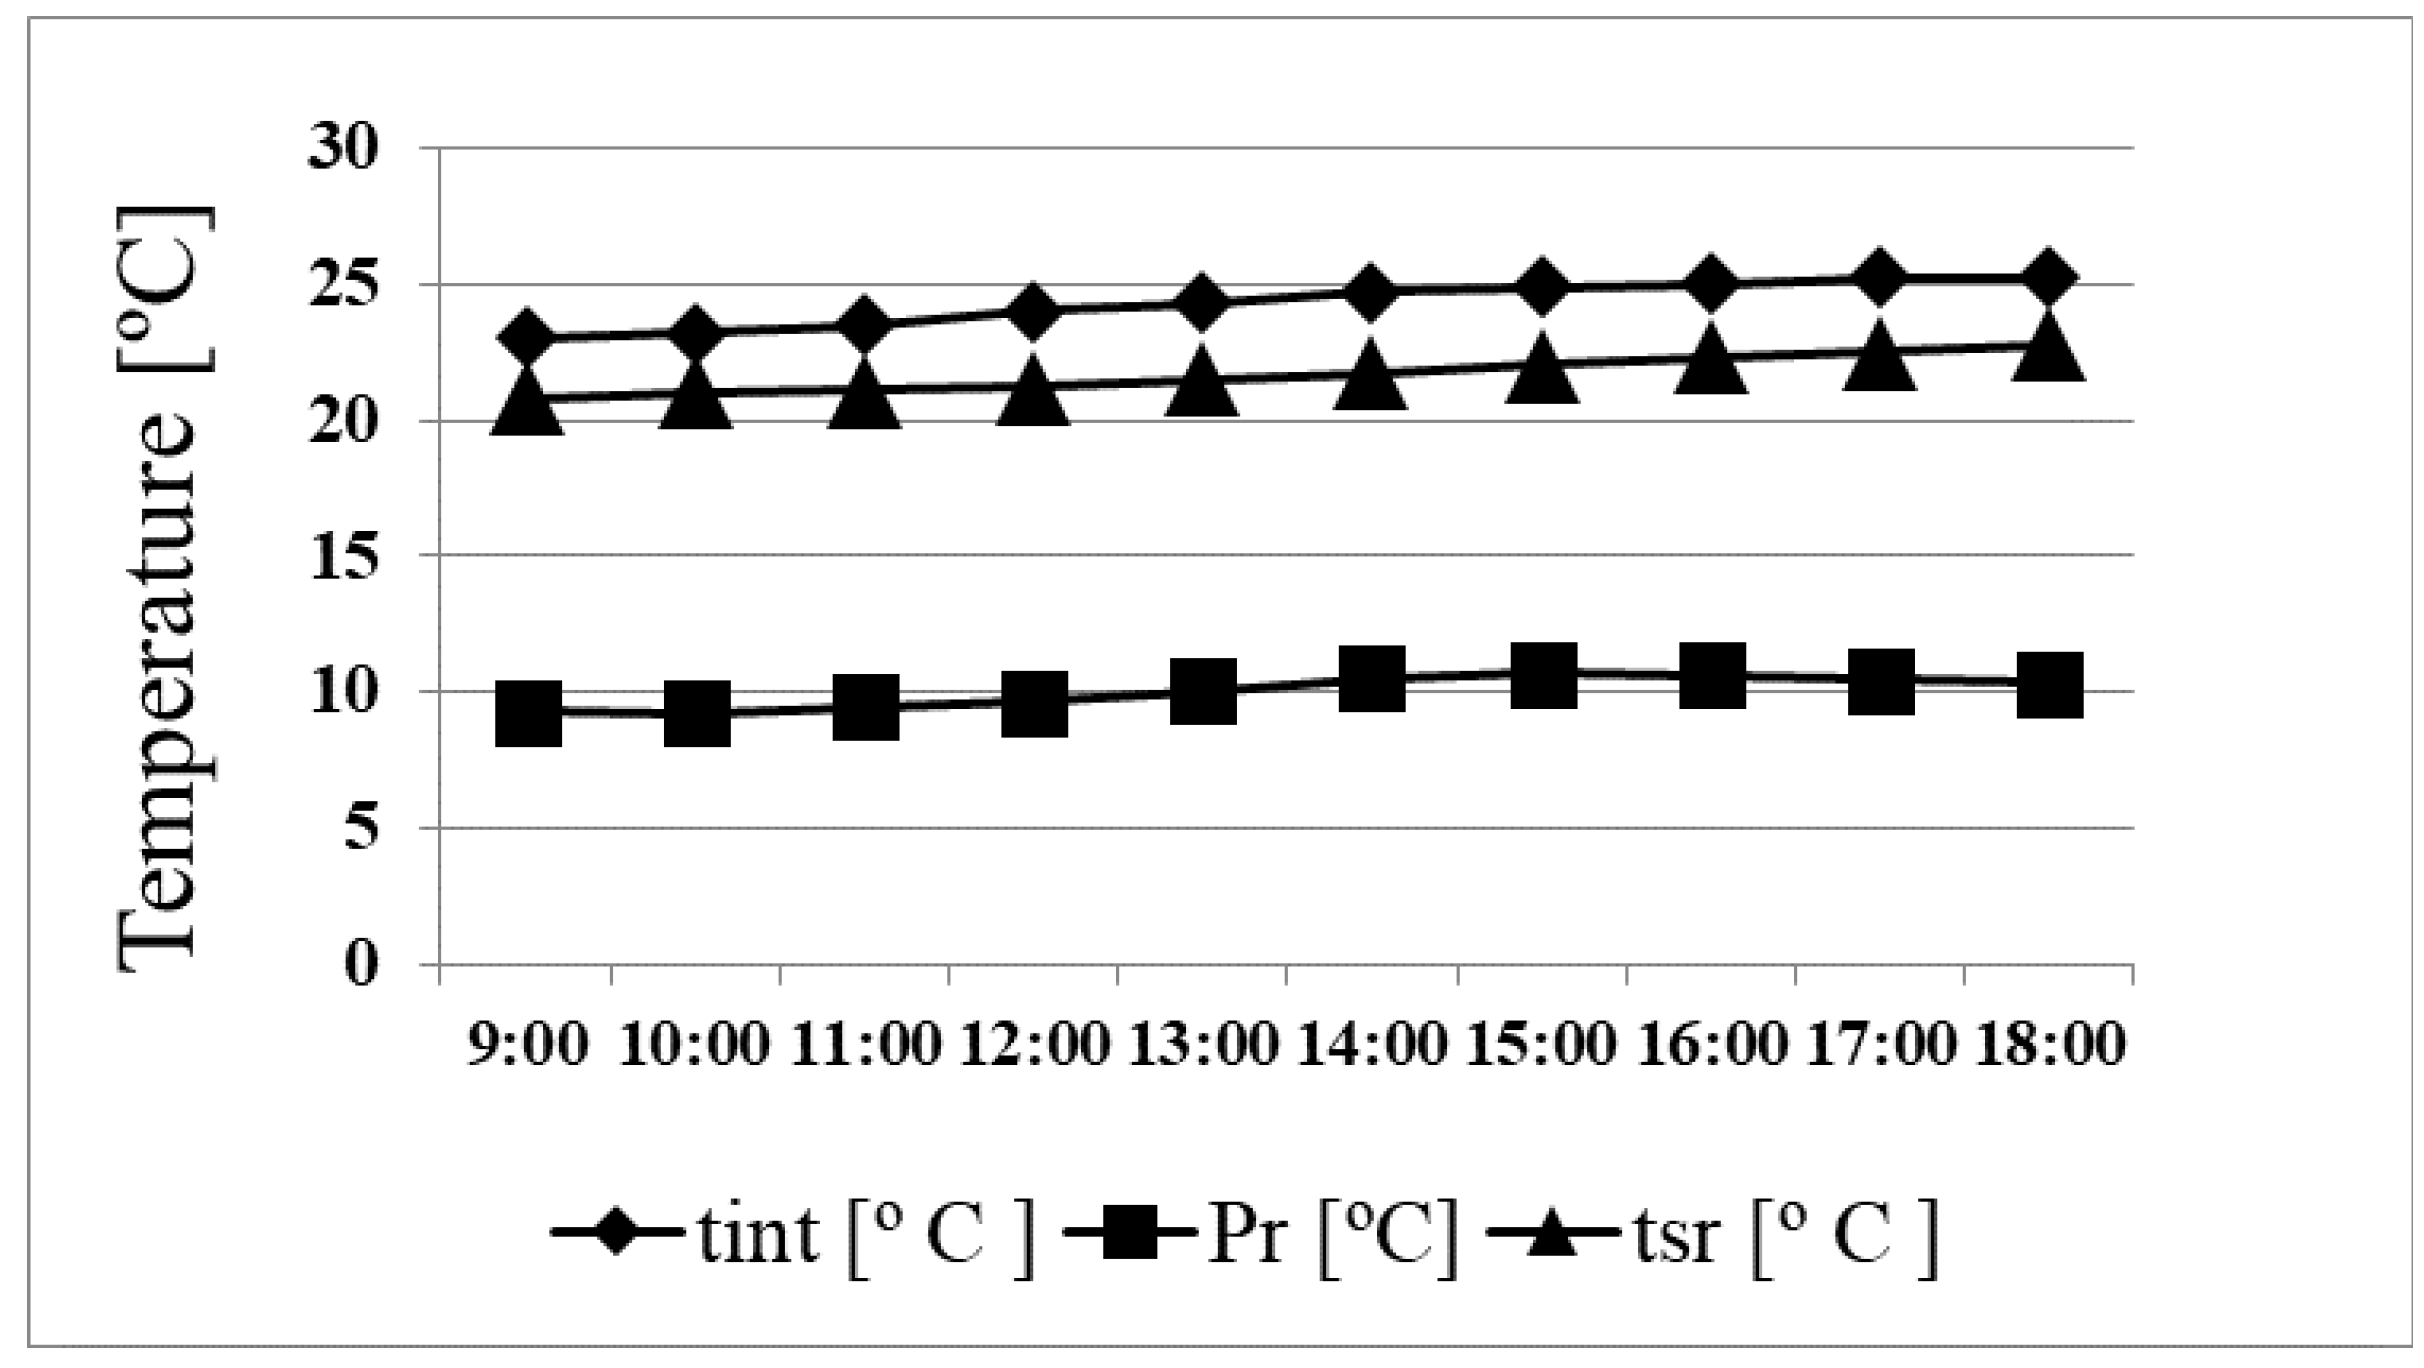
Figure 7 and
Figure 8 show the comparison between indoor/outdoor ambient air temperature and surface average floor temperature reached in heating and cooling modes. The results show that the GCHP system can maintain the indoor temperature during all the processes.
Table 3 shows how the comfort temperature and RH parameters are reached in heating and cooling modes in a period of one year. In order to optimize the energy consumption, the DHW values are maintained at a low step. The COP
sys in cooling operation is higher than in heating. This is due to the MV in night periods exerting a cooling effect over the system, minimizing the thermal demand.
Figure 9 shows the non-existence of condensation.
4. Numerical Simulation
EnergyPlus was the software used for the design of the simulation model.
Figure 10 shows the model of the building created in SketchUp, necessary to characterize the building.
Simulation Models in EnergyPlus
EnergyPlus was the software selected to simulate the thermal operation of the office building. Using software specifications and building characteristics data, the calculation model is implemented. Three principal models are used in the simulation process. The heat exchanger was done using GLHEPRO program [
22]. Based on physical parameters generated from the catalog data of the pump unit, a second model was used to describe the heat pump unit [
23,
24]. For modeling the transient heat conduction through the radiant floor system, the conduction transfer method (CTFs) was used.
Figure 11 shows the node scheme which represents the configuration of the system implemented in EnergyPlus to integrate all the process and elements to model the simulation process.
Figure 12 and
Figure 13 show the comparison between the simulated and experimental values using the statistical method coefficient of multiple determinations (R
2).
5. Results and Discussion
In this section, the main results from real and simulated process are shown and analyzed. First, the most significant results of the GCHP systems are discussed, comparing the experimental and simulated results for the monthly average temperature of each of the four zones. The energy consumption of the system is illustrated comparing the experimental and simulated values obtained in the process. Finally, the heat flow transfer to the geothermal field and radiant floor system is analyzed and discussed.
In
Figure 14, the comparison between the real and simulated average monthly zone temperature values are represented. It is observed that the HVAC system supplies the energy necessary to maintain the comfort temperature conditions of 22 °C in heating and 25 °C in cooling mode in all zones.
The statistical method of coefficient of multiple determinations (R
2) was used to compare simulated and real values. The R
2 values for the different zones and the entire building are shown in
Table 4. Zone 1 and 4 have lower R
2 values than other areas because these areas have peak demand to be areas that are not continually used (test room and bathroom), which translates into greater variability in the peak value of internal loads, therefore, the time response is longer such that the difference between the real and simulated values is higher. The other two zones have a higher linearity in their internal loads to be continuous use areas. As is shown in
Figure 14, the zones 2 and 4 have R
2 values similar to the entire building.
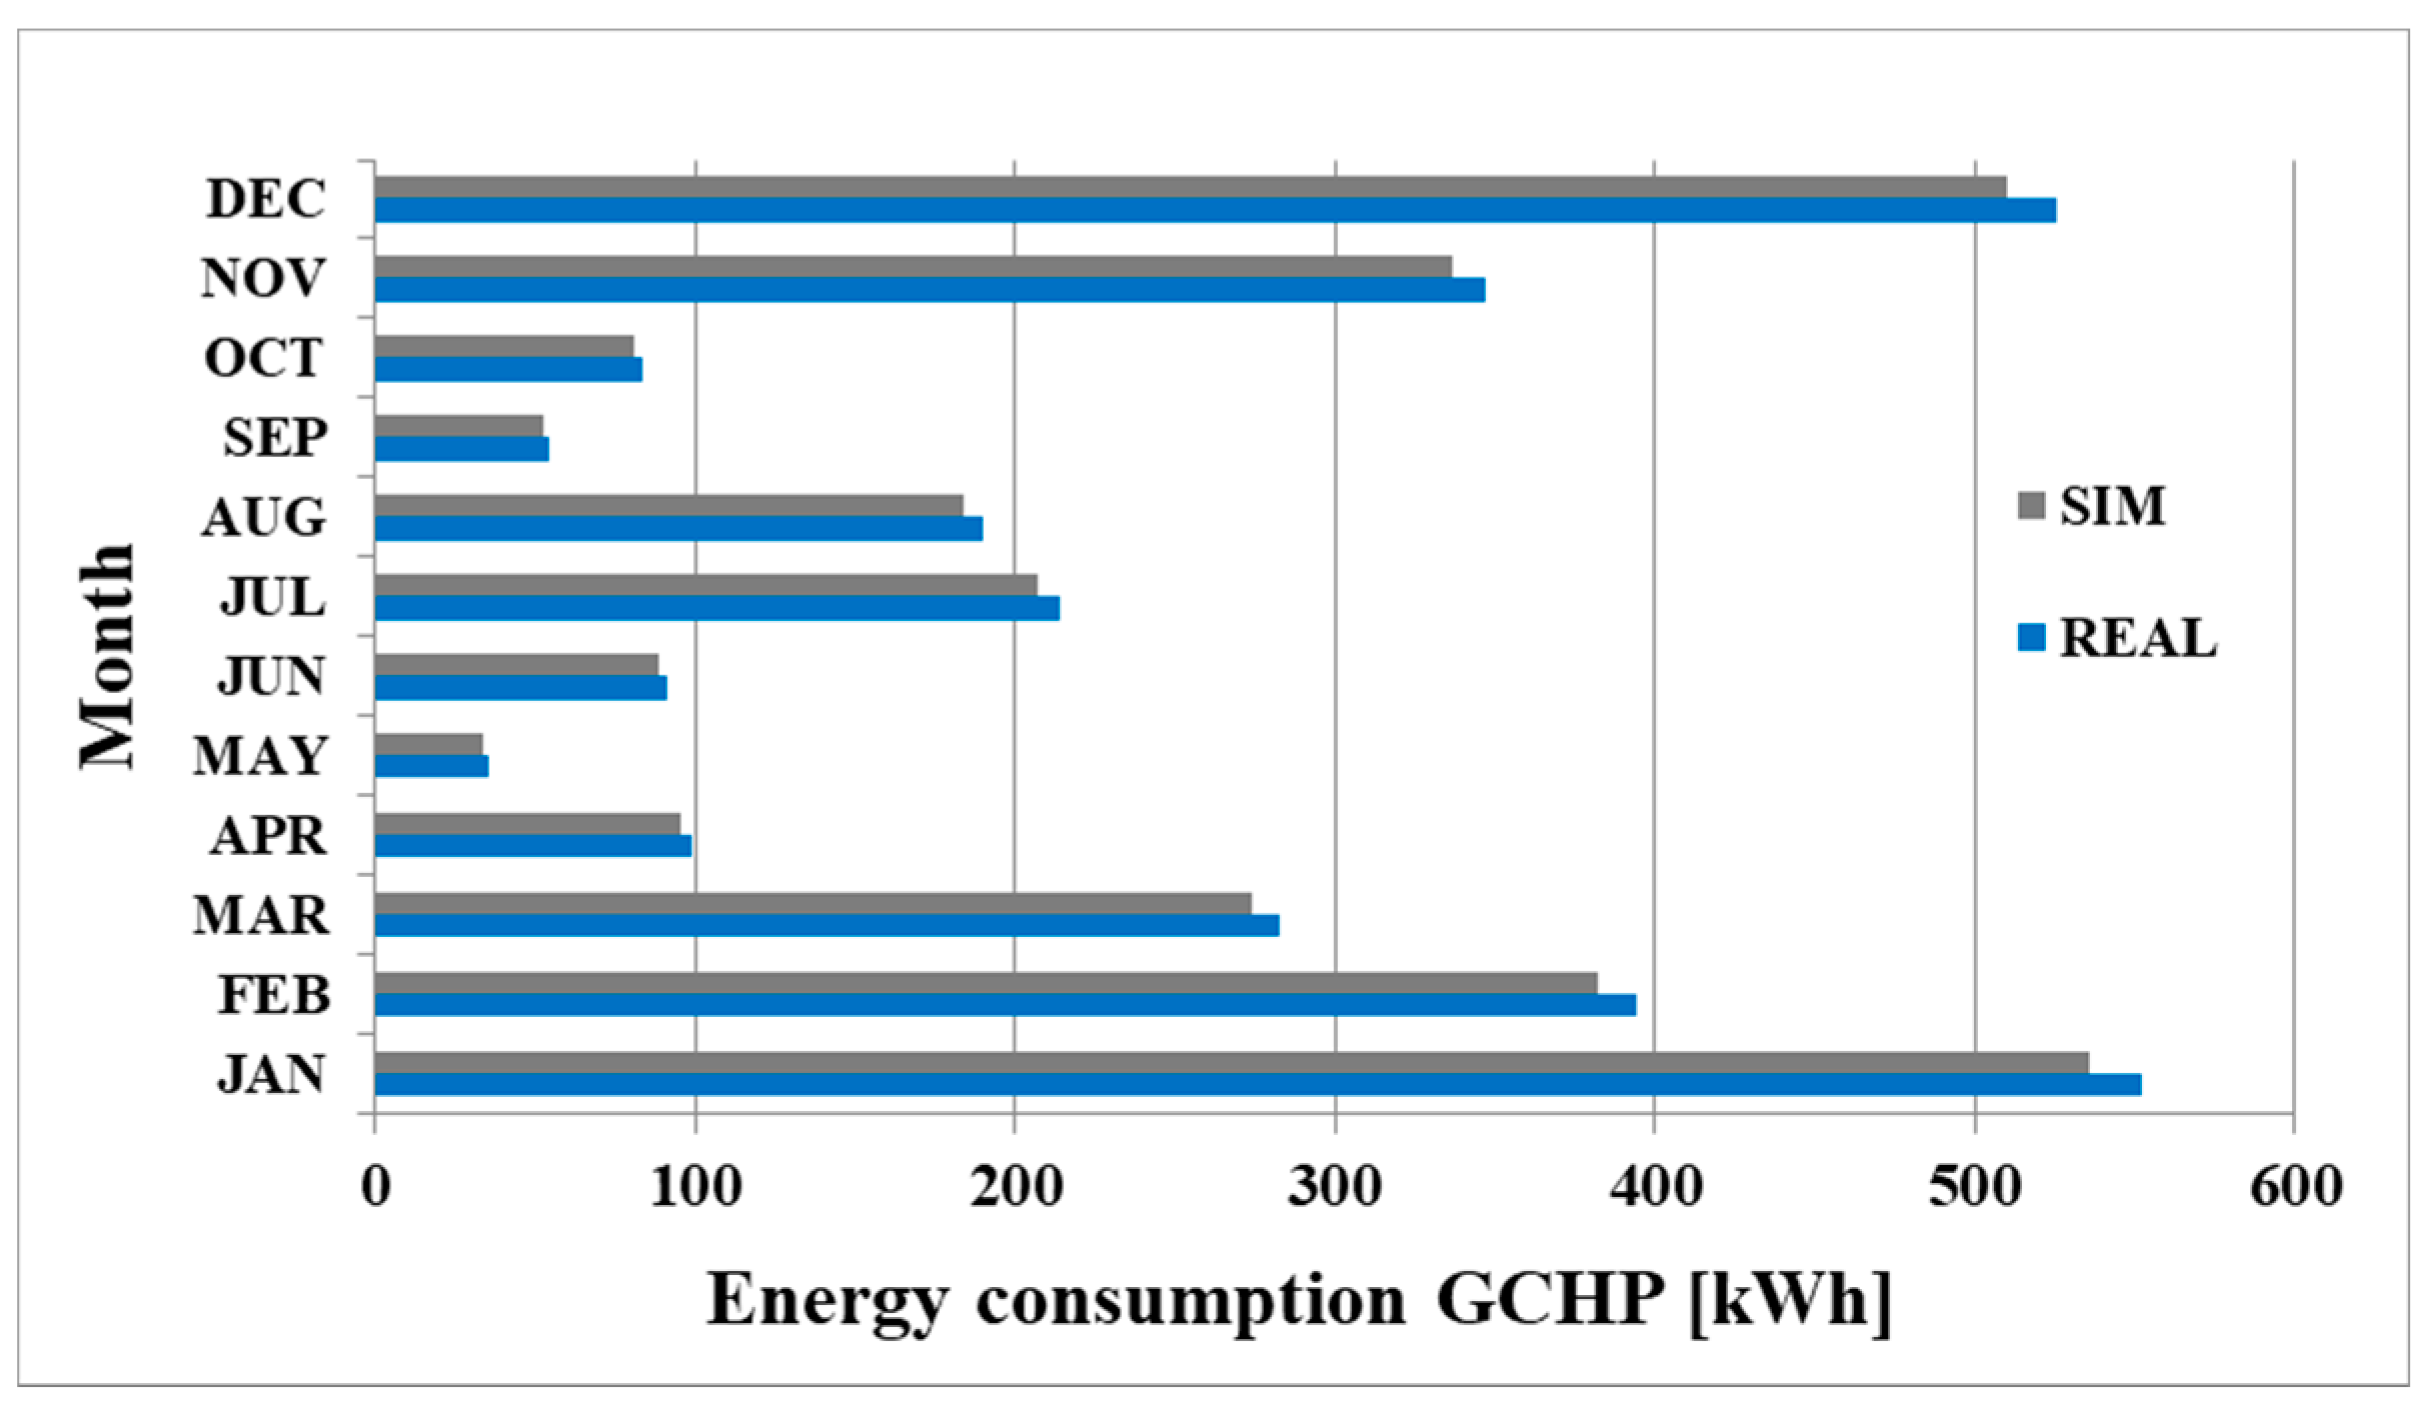
The consumption of the heat pump unit, circulating pumps, and auxiliary elements are considered to have the real value of the energy consumption of the building. In
Figure 15, the experimental and simulated values of the total energy consumption are presented. The results are in accordance with monthly energy demand presented in
Figure 3. The highest energy consumption corresponds to the heating period and is higher than in cooling period. Using the same statistical method, an R
2 value of 0.9841 is obtained for the comparison of the energy consumption of the GCHP system in real and simulated conditions.
Figure 16 shows the average monthly energy exchanged between the soil and the heat pump unit. It should be noted that this energy is more important in the period in which the temperature difference between the demand and the soil temperature is higher. These results guarantee a better performance of the heat pump and, therefore, a decrease of the energy consumption.
In this case, the radiant floor can handle the sensible load of the different zones. In particular, we can see that in the heating period, the energy exchanged is higher than in cooling mode, due to the thermal demand being more important in this period. The values shown in
Figure 17 are in accordance with the thermal demand.
The simulations results are closer to the actual results in heating and cooling mode. The COP
sys in heating and cooling mode for experimental and simulated conditions is shown in
Table 5.
5.1. Comparison of COP and CO2 Emissions with Other Proposed Technologies
In order to know the positioning of the GCHP system designed, a comparison with natural gas, diesel, and biomass was conducted. The three systems are composed of a boiler for each technology and radiant floor for distribution. An additional heat pump unit is installed in order to satisfy the cooling demand and maintain the same conditions for the analysis. The model validated the calculated COP
SYS and CO
2 emissions. In
Table 6, the primary energy coefficients are listed in order to obtain the CO
2 emissions.
In
Table 7, annual COP
sys and CO
2 emissions values are shown.
The results show that the GCHP system is the technology with the highest COPsys in heating and cooling modes, and least CO2 emissions, with the latter surpassed only by biomass.
5.2. Comparative Economic Analysis
For the comparative economic analysis of the four technologies proposed, the cost of the installations, maintenance, and energy source for each technology is presented. An economic lifetime of 15 years is considered. The cost data were obtained in 2015 through different companies specializing in these kinds of systems. Using the data of energy price forecast from the hydrocarbon geoportal of the Spanish industrial and energy ministry, and combined with the average annual fuel/electricity consumption obtained from real/simulated data, the annual fuel cost is calculated. A fixed percentage of the initial installation of each system is considered for determining the annual maintenance cost. The results are shown in
Table 8.
As
Figure 18 shows, GCHP systems are, for the first time, not the economically preferred investment as a HVAC system for buildings. Only after some years of functioning were the economic results for this technology better than all the other options. The accumulated savings (positive values) from GCHP versus natural gas, biomass, and diesel are shown in
Figure 19.
After 6.5 years’ functioning of the installation, the GCHP overcame the cost of diesel, and in the seventh year, natural gas. Only after 9 years did the proposed system reach costs equivalent to using biomass. In
Figure 20, the accumulated cost for each technology during a 15-year period is illustrated.
6. Conclusions
The use of low enthalpy geothermal systems in buildings with low energy demand is a recommended option to satisfy HVAC and DHW necessities. This paper shows the position of the system proposed against other technologies—natural gas, diesel, and biomass—from energy, economic, and environmental aspects. The parameter selected to analyze the comfort of the installation is the mean indoor temperature in each area. EnergyPlus was the software used to create the simulation model, in order to describe the operation of the installation.
The results obtained show that the indoor temperature in each area is closed to the objective. The differences were only of 0.3/0.2 °C in heating and cooling modes respectively. The average temperature reached in cooling and heating modes was 24.8/21.7 °C, considered to be a good performance for the designed HVAC system.
A comparison between experimental and simulation results was done in order to validate the model designed. The R2 results obtained represented a good approximation of the model to real operation. The performance of the system is represented by the COPsys, which was 3.86/5.89 for heating and cooling modes, and represents a good performance.
Natural gas, diesel, and biomass were the technologies selected for the comparison done. The COPsys obtained in heating modes was 1.03/0.9/0.8 respectively, which show the high performance of the GCHP compared with the rest, being higher between 3.7 and 4.8 times. In cooling operation, the COPsys was two times higher because MV ensures the indoor air quality and exerts a cooling effect over the system, minimizing the thermal demand.
The economic analysis illustrates that the GCHP systems have a higher initial cost than the rest of the available technologies. After six and seven years, the GCHP maintains HVAC conditions at lower cost than diesel and natural gas, respectively, and reaches the same level as biomass in the ninth year.
Author Contributions
Conceptualization, J.I.V. and A.V.; methodology, J.I.V. and A.V.; software, J.I.V. and A.V.; validation, I.d.A. and R.Q.; formal analysis, J.I.V.; investigation, J.I.V. and A.V.; resources, A.A.; data curation, I.d.A. and R.Q.; writing—original draft preparation, I.d.A. and R.Q.; writing—Review and editing, A.V.; visualization, A.V.; supervision, J.I.V.; project administration, A.A.; funding acquisition, A.A.
Funding
This research received no external funding.
Acknowledgments
Authors would like to thank Energies and the anonymous reviewers. Also, the assistance provided by the University of Salamanca. Authors would also like to thank Department of Construction and Agronomy, Construction Engineering Area of High Polytechnic School of Avila.
Conflicts of Interest
The authors declare no conflict of interest.
Nomenclature
| BHE | borehole heat exchanger |
| CO2 | fossil carbon dioxide emissions (kg) |
| COPSYS | seasonal energy efficiency ratio |
| Cps | factor for electricity (kgCO2/kWh) |
| CTFs | conduction transfer method |
| DHW | domestic hot water |
| GCHP | ground-coupled heat pump |
| GHE | ground heat exchanger |
| GLHEPRO | ground heat exchanger software |
| HVAC | heating, ventilating, and air-conditioning |
| MV | mechanical ventilation system |
| Pr | dew point temperature (°C) |
| RF | radiant floor |
| R2 | coeff of multiple determinations |
| text | outdoor air temperature (°C) |
| thw | hot-water temperature (°C) |
| tint | indoor air temperature (°C) |
| TRNSYS | transient systems simulation |
| tsr | surface average temperature (°C) |
References
- Directive 2009/28/EC of the European Parliament and of the Council of 23 April 2009 on the Promotion of the Use of Energy from Renewable Sources and Amending and Subsequently Repealing Directives 2001/77/EC and 2003/30/EC.
- García Lastra, A. Analysis of Spanish and European Legislation on Energy Efficiency in Buildings. Ph.D Thesis, University Pompeu Fabra, Barcelona, Spain, 2014. [Google Scholar]
- Lun, J.W. Geothermal Heat Pumps—An Overview; Quarter Bull, Geo-Heat Center: Oregon, USA, 2001; Volume 22, pp. 1–2. [Google Scholar]
- Florides, G.; Kalogirou, S. Ground heat exchangers—A review of systems, models and applications. Renew. Energy 2007, 32, 2461–2478. [Google Scholar] [CrossRef]
- Zhao, Q.; Chen, B.; Liu, F. Study on the thermal performance of several types of energy pile ground heat exchangers: U-shaped, W-shaped and spiral-shaped. Energy Build. 2016, 133, 335–344. [Google Scholar] [CrossRef]
- Zhang, W.; Yang, H.; Lu, L.; Fang, Z. The heat transfer analysis and optimal design on borehole ground heat exchangers. Energy Procedia 2014, 61, 385–388. [Google Scholar] [CrossRef]
- Yoon, S.; Lee, S.R.; Go, G.H. Evaluation of thermal efficiency in different types of horizontal ground heat exchangers. Energy Build. 2015, 105, 100–105. [Google Scholar] [CrossRef]
- Capozza, A.; Zarrella, A.; De Carli, M. Analysis of vertical ground heat exchangers: The new carm tool. Energy Procedia 2015, 81, 288–297. [Google Scholar] [CrossRef]
- Rivera, J.A.; Blum, P.; Bayer, P. Ground energy balance for borehole heat exchangers: Vertical fluxes, groundwater and storage. Renew. Energy 2015, 83, 1341–1351. [Google Scholar] [CrossRef]
- Gallero, F.J.G.; Maestre, I.R.; Gómez, P.Á.; Blázquez, J.L.F. Numerical and experimental validation of a new hybrid model for vertical ground heat exchangers. Energy Convers. Manag. 2015, 103, 511–518. [Google Scholar] [CrossRef]
- Li, M.; Lai, A.C. Review of analytical models for heat transfer by vertical ground heat exchangers (GHEs): A perspective of time and space scales. Appl. Energy 2015, 151, 178–191. [Google Scholar] [CrossRef]
- Kaushal, M. Geothermal cooling/heating using ground heat exchangers for various experimental and analytical studies: Comprehensive review. Energy Build. 2017, 139, 634–652. [Google Scholar] [CrossRef]
- Cacabelos, A.; Eguía, P.; Míguez, J.L.; Granada, E.; Arce, M.E. Calibrated simulation of a library HVAC system with a ground-source heat pump and radiant floor using TRNSYS and GenOpt. Energy Build. 2015, 108, 114–126. [Google Scholar] [CrossRef]
- Sebarchievici, C.; Sarbu, I. Performance of an experimental ground-coupled heat pump system for heating, cooling and domestic hot-water operation. Renew. Energy 2015, 76, 148–159. [Google Scholar] [CrossRef]
- Dan, D.; Sebarchievici, C.; Sarbu, I. Performance assessment of a ground-coupled heat pump for an office room heating using radiator or radiant floor heating systems. Procedia Eng. 2015, 118, 88–100. [Google Scholar]
- Montagud, C.; Corberán, J.M.; Ruiz-Calvo, F. Experimental and modeling analysis of a ground source heat pump system. Appl. Energy 2013, 109, 328–336. [Google Scholar] [CrossRef] [Green Version]
- Han, C.; Yu, X. Performance of a residential ground source heat pump system in sedimentary rock formation. Appl. Energy 2016, 164, 89–98. [Google Scholar] [CrossRef] [Green Version]
- Villarino, J.I.; Villarino, A.; Fernández, F.Á. Experimental and modelling analysis of an office building HVAC system. Appl. Energy 2016, 190, 1020–1028. [Google Scholar] [CrossRef]
- Zhang, L.; Liu, X.H.; Jiang, Y. Simplified calculation for cooling/heating capacity, surface temperature distribution of radiant floor. Energy Build. 2012, 55, 397–404. [Google Scholar] [CrossRef]
- Mazo, J.; Delgado, M.; Marin, J.M.; Zalba, B. Modeling a radiant floor system with Phase Change Material (PCM) integrated into a building simulation tool: Analysis of a case study of a floor heating system coupled to a heat pump. Energy Build. 2012, 47, 458–466. [Google Scholar] [CrossRef]
- Song, D.; Kim, T.; Song, S.; Hwang, S.; Leigh, S.B. Performance evaluation of a radiant floor cooling system integrated with dehumidified ventilation. Appl. Therm. Eng. 2008, 28, 1299–1311. [Google Scholar] [CrossRef]
- Murugappan, A. Implementing Ground Source Heat Pump and Ground Loop Heat Exchanger Models in the EnergyPlus Simulation Environment. Ph.D. Thesis, Oklahoma State University, Stillwater, OK, USA, 2002. [Google Scholar]
- Jin, H. Parameter Estimation Based Models of Water Source Heat Pumps. Ph.D. Thesis, Oklahoma State University, Department of Mechanical and Aerospace Engineering, Stillwater, OK, USA, 2002. [Google Scholar]
- Tang, C. Modelling Packaged Heat Pumps in Quasi-Steady State Energy Simulation Program. Ph.D. Thesis, Oklahoma State University, Department of Mechanical and Aerospace Engineering, Stillwater, OK, USA, 2005. [Google Scholar]
Figure 1.
(a) Experimental office building; (b) Office floor plan.
Figure 1.
(a) Experimental office building; (b) Office floor plan.
Figure 2.
Ground-coupled heat pump (GCHP) system schematic.
Figure 2.
Ground-coupled heat pump (GCHP) system schematic.
Figure 3.
Monthly energy demand.
Figure 3.
Monthly energy demand.
Figure 4.
Heat pump performance data.
Figure 4.
Heat pump performance data.
Figure 5.
Radiant floor system.
Figure 5.
Radiant floor system.
Figure 6.
Recorded annual indoor and outdoor temperature.
Figure 6.
Recorded annual indoor and outdoor temperature.
Figure 7.
Indoor temperature in heating.
Figure 7.
Indoor temperature in heating.
Figure 8.
Indoor temperature in cooling.
Figure 8.
Indoor temperature in cooling.
Figure 9.
Radiant floor (RF) system temperatures.
Figure 9.
Radiant floor (RF) system temperatures.
Figure 10.
SketchUp plan.
Figure 10.
SketchUp plan.
Figure 11.
System nodes scheme.
Figure 11.
System nodes scheme.
Figure 12.
R2 graph results in heating mode.
Figure 12.
R2 graph results in heating mode.
Figure 13.
R2 graph results in cooling mode.
Figure 13.
R2 graph results in cooling mode.
Figure 14.
Experimental and simulated average monthly temperature for each zone.
Figure 14.
Experimental and simulated average monthly temperature for each zone.
Figure 15.
Energy consumption of the GCHP system.
Figure 15.
Energy consumption of the GCHP system.
Figure 16.
Monthly energy transferred to geothermal field.
Figure 16.
Monthly energy transferred to geothermal field.
Figure 17.
Monthly energy transferred to radiant floor system.
Figure 17.
Monthly energy transferred to radiant floor system.
Figure 18.
Initial investments for the technologies proposed.
Figure 18.
Initial investments for the technologies proposed.
Figure 19.
Annual net savings for a 15-year period.
Figure 19.
Annual net savings for a 15-year period.
Figure 20.
Accumulated cost for each technology.
Figure 20.
Accumulated cost for each technology.
Table 1.
Soil features.
| Soil Contents GRAVEL + CLAY + GRANITE |
|---|
| Thermal conductivity (W/mK) 1.8 |
| Thermal diffusivity (m2/d) 0.065 |
| Average Thermal resistivity (K/(W/m) 0.059 |
Table 2.
Characteristics of the radiant floor.
Table 2.
Characteristics of the radiant floor.
| Active Radiant Floor Layer |
|---|
| Pipe wall conductivity (W/mK) 0.37 |
| Pipe wall thickness (m) 0.002 |
| Pipe outside diameter (m) 0.016 |
| Pipe spacing (m) 0.15 |
| Specific heat coefficient fluid (kJ/kgK) 4.18 |
Table 3.
Average values of experimental results. HVAC.
Table 3.
Average values of experimental results. HVAC.
| HVAC System | | | | | | COPsys | COP/ERR |
|---|
| Heating mode | 6.69 | 21.7 | 36.8 | 26.89 | 30.24 | 3.86 | 4.85 |
| Cooling mode | 25.57 | 24.8 | 40.1 | 21.3 | 28.62 | 5.29 | 6.65 |
Table 4.
R2 values for four zones and entire building.
Table 4.
R2 values for four zones and entire building.
| Tª | R2 |
|---|
| Tª average, zone 1 | 0.9841 |
| Tª average, zone 2 | 0.9913 |
| Tª average, zone 3 | 0.9914 |
| Tª average, zone 4 | 0.9871 |
| Tª average, building | 0.991 |
Table 5.
COPsys real/simulated for heating and cooling operation.
Table 5.
COPsys real/simulated for heating and cooling operation.
| | COPSYS Heating_Real | COPSYS Heating_Sim | COPSYS Cooling_Real | COPSYS Cooling_Sim |
|---|
| GCHP system | 3.86 | 3.80 | 5.29 | 5.18 |
Table 6.
Energy step factors.
Table 6.
Energy step factors.
| Energy | To CO2 Emissions (kgCO2/kWhEF) |
|---|
| Electricity | 0.331 |
| Diesel | 0.311 |
| Natural Gas | 0.252 |
| Biomass | 0.018 |
Table 7.
COPsys and CO2 emission results.
Table 7.
COPsys and CO2 emission results.
| HVAC System | COP Heating Mode | COP Cooling Mode | CO2 Emissions (Kgs) |
|---|
| GCHP | 3.86 | 5.29 | 985 |
| Natural Gas | 1.03 | 2.80 | 2741 |
| Diesel | 0.9 | 2.80 | 3715 |
| Biomass | 0.8 | 2.8 | 475 |
Table 8.
Data used for economic analysis.
Table 8.
Data used for economic analysis.
| | Geothermal | Biomass | Natural gas | Diesel |
|---|
| Total Investment (€) | 16,475 | 13,275 | 12,875 | 13,275 |
| GCHP (€) | 5800 | | | |
| Boiler (€) | | 2800 | 2400 | 2800 |
| Split (€) | | 4000 | 4000 | 4000 |
| Borehole (€) | 4325 | | | |
| Radiant Floor (€) | 6350 | 6475 | 6475 | 6475 |
| Annual maintenance cost (%) | 4.7% | 4.0% | 4.0% | 4.0% |
| Cost effective (€/kWh) | 0.1764 | 0.0507 | 0.0839 | 0.0905 |
© 2019 by the authors. Licensee MDPI, Basel, Switzerland. This article is an open access article distributed under the terms and conditions of the Creative Commons Attribution (CC BY) license (http://creativecommons.org/licenses/by/4.0/).

 ,
, 


