Thermal Comfort Evaluation of Rooms Installed with STPV Windows
by
 ,
,
Hao Tian
1 ,
,
Wei Zhang
1,*,
Lingzhi Xie
2,
Zhichun Ni
3,
Qingzhu Wei
3,
Xinwen Wu
1,
Wei Wang
1 and
Mo Chen
1 1
Key Laboratory of Deep Underground Science and Engineering (Ministry of Education), School of Architecture and Environment, Sichuan University, Chengdu 610065, China
2
Institute of New Energy and Low-carbon Technology, Sichuan University, Chengdu 610065, China
3
Suzhou Talesun Solar Technologies Co., Ltd., Suzhou 215542, China
*
Author to whom correspondence should be addressed.
Energies 2019, 12(5), 808; https://doi.org/10.3390/en12050808
Submission received: 25 January 2019
/
Revised: 21 February 2019
/
Accepted: 26 February 2019
/
Published: 28 February 2019
(This article belongs to the Special Issue Selected Papers from the 9th Edition of the International SOLARIS Conference)
Abstract
:Thermal comfort is an important aspect to take into consideration for the indoor environment of a building integrated with a semi-transparent Photovoltaics (STPV) system. The thermal comfort of units with photovoltaic windows and that of conventional windows, which is an ordinary without PV, were evaluated via on-site tests and questionnaires. Using the thermal comfort investigation of the test rig, the maximum difference in air temperature was found to be around 5 °C between test unit and comparison unit. The predicted mean vote (PMV)–predicted percentage dissatisfied (PPD) value of the test unit was better than that of the comparison unit. It was observed that on sunny days, the PMV value ranged from 0.2 (nature) to 1.3 (slightly warm) in the test unit, and that of the comparison unit was 0.7 (slightly warm) to 2.0 (warm), thereby providing better thermal comfort, especially during mornings. The maximum difference in PPD values was found to reach 27% between the two units at noon. On cloudy days, the difference was negligible, and the thermal sensation between the foot and the head were almost the same. Fifty respondents were asked to complete a carefully designed questionnaire. The thermal sensation of the test unit was better than that of comparison unit, which corresponded with the test results. Thermal, lighting, acoustic, and other environment comfort scores were combined, and the acceptance of the test unit with the STPV windows was found to be 73.8%. The thermal sensation difference between men and women was around 5%. Thus, during summer, STPV windows can improve the thermal comfort and potentially reduce the air-conditioning load.
1. Introduction
Since accelerated economic development goes hand in hand with exorbitant energy consumption, the demand of energy is continually on the rise. Thus, it is essential to reduce worldwide resource consumption [1]. About 40% of the energy is consumed in buildings [2]. Heating ventilation and air-conditioning systems (HVACs) contribute to the largest chunk of energy consumption in the overall energy demand in buildings [3]. Photovoltaics (PV) window technology is the key to solve this problem since it can reduce purchased electricity costs of air conditioning and also change the indoor environment.
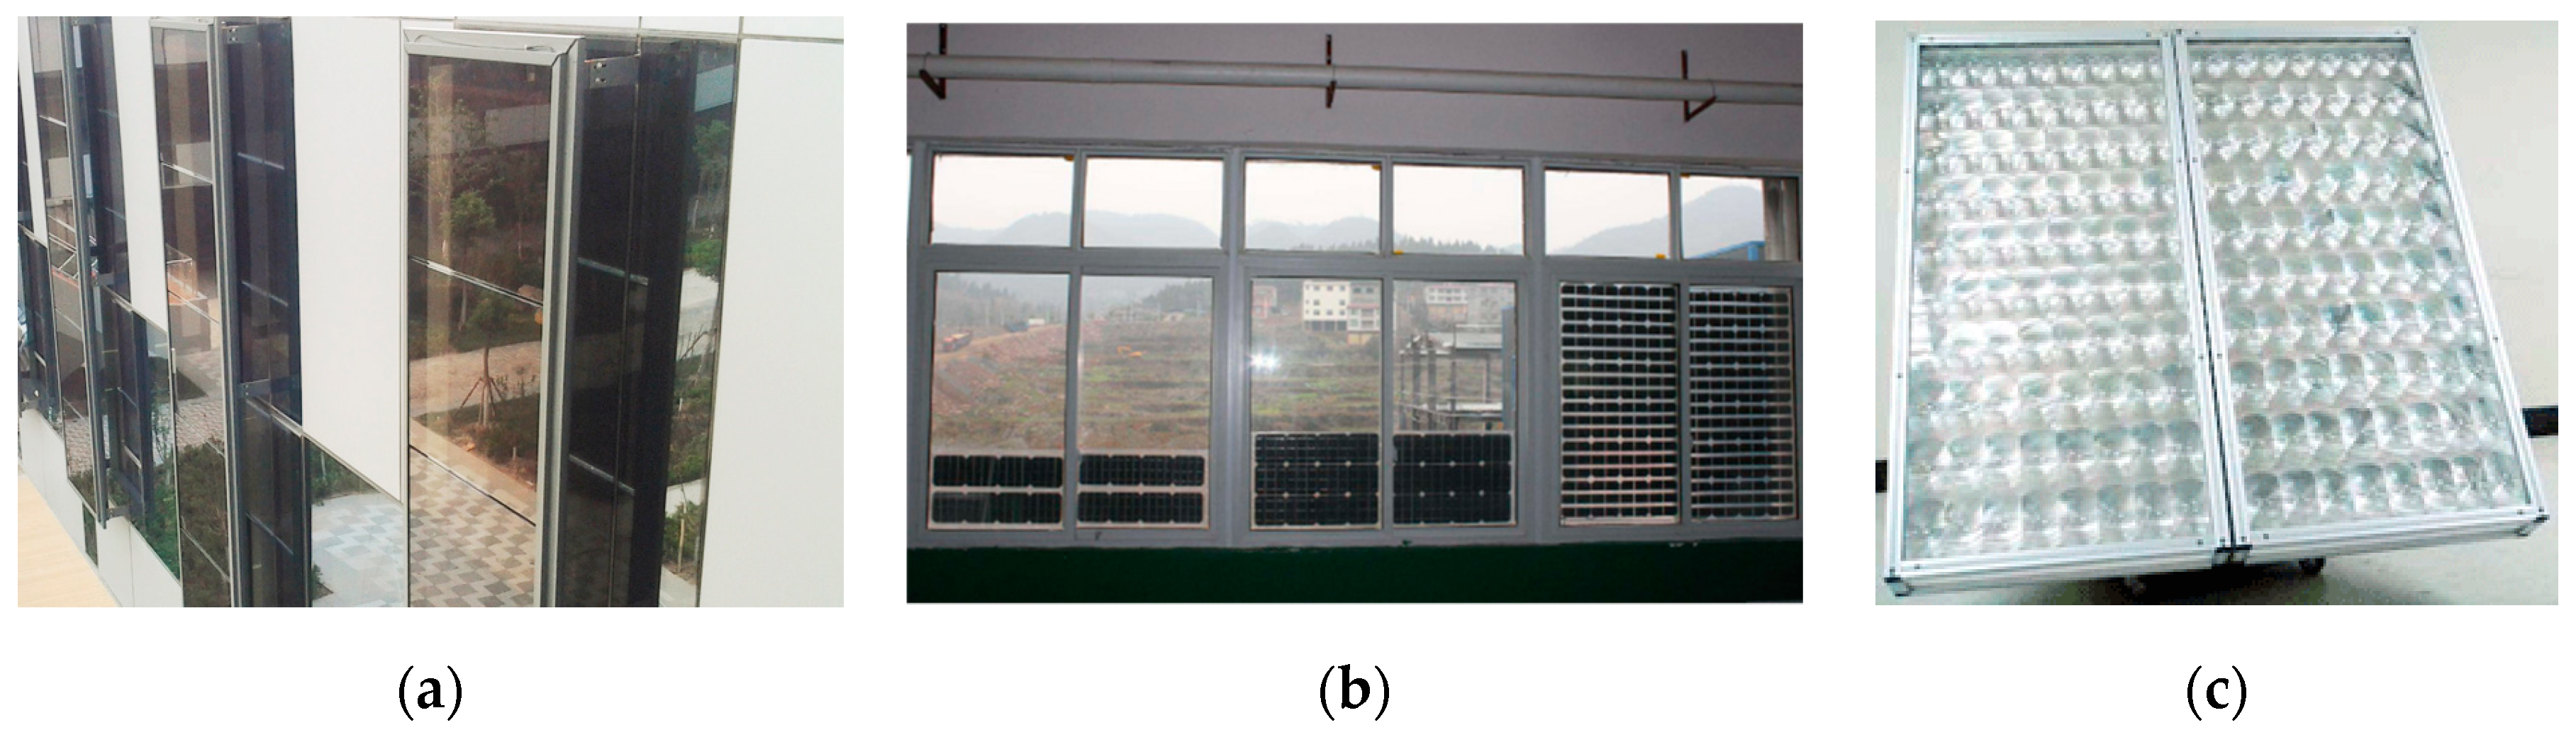
The popular photovoltaic cells applied on STPV windows can be divided into crystalline silicon solar cells (c-Si) and amorphous solar cells (a-Si). As shown in Figure 1, the c-Si module is non-transparent, but has high power generation efficiency. The a-Si module has good transmittance, but with low power generation efficiency in the range of about 4.1–12%. Recently, concentrator photovoltaics (CPVs) have been applied to STPV windows to bring about better performances.
For the research on PV window technology, a series of studies focusing on the performance of STPV windows (and others) investigated the energy saving effect of PV windows. Jong-Ho Yoon [4] conducted an experiment about the temperature of STPV windows, the results showed that the temperature of vertical windows increase significantly in summer, while that of horizontal windows and inclined windows increases significantly in winter. K.E. Park [5] discovered that when the temperature of the PV module increases by 1 °C, the power decreases by 0.48% and 0.52% under standard test conditions (STCs) (500 W/m2 outdoor). Tin-tai Chow et al. [6] designed a ventilated photovoltaic window whose new design could reduce air conditioning load and improve visual comfort. Nuria [7] installed photovoltaic windows in a room, and obtained decreased energy consumption. Cristina Cornaro et al. [8] invented dye-sensitized solar cells and tested it for its electrical and thermal properties. Dye-sensitized solar cells play an important role in renewable energy research due to its features and low-cost manufacturing processes.
The systematic investigation of buildings equipped with STPV windows should include performance assessment, energy consumption prediction, and thermal comfort evaluation. The possibility of STPV windows improving the indoor thermal environment is worth investigating. Most of the previous studies have focused on the technological aspect of STPV windows, but only a few articles focus on the indoor comfort of STPV windows. With regard to the influence of PV windows on the indoor lighting environment, Wei Wang et al. [9] discovered that on sunny days the effective daylight illumination (UDI) of the laboratory was 52.2% higher than that of the conventional room. J. Khedari et al. [10] investigated the performance of a multi-purpose PV-slat window (PV-SW) and found that the multi-purpose PV-SW can produce up to 15 W of power, decrease indoor temperature, and provide sufficient light for the house. However, a lot of researchers have investigated the indoor environment, where some focus on how PV windows affect the indoor environment.
From previous research it can be found that windows have a large impact on indoor comfort. Solar radiation enters the room mainly through windows, which affects the indoor thermal environment. Javad Khalesi et al. [11] studied the impact of a combination of a passive ventilation system and smart windows in a climate-adaptive building. It was demonstrated that up to 50% reduction in temperature difference between the floor and ceiling was achievable with electrochromic windows. MingzheLiu et al. [12] conducted parametric analysis on the heat transfer, daylight, and thermal comfort for a sustainable roof window with triple glazing and external shutter. The results revealed that the external shutter improved both the thermal and comfort performances of the window. Performance of an evaporatively-cooled window driven by a solar chimney was studied in a dry climate by Walid AbouHweij et al. [13]. A system model was coupled to a space Computational Fluid Dynamics (CFD) model to predict the window temperature and impact on comfort. The results showed significant improvement in overall thermal comfort, and air-conditioning energy savings of up to 10% were recorded. Wei Zhang et al. [14] used machine learning (ML) to bridge the gap between controllable building parameters and thermal comfort by conducting an extensive study on the efficacy of different ML techniques for modeling comfort level. Huan Zhang et al. [15] proposed a corrected predicted mean vote (CPMV) to evaluate the indoor thermal comfort in solar conditions.
The CPMV was validated to be applicable for evaluating the indoor thermal comfort of buildings with solar radiation. For the assessment of indoor thermal comfort, a test or a questionnaire were selected as the evaluation methods. In J Khalesi’s [10] research, the temperature stratification and air quality of the indoor environment are monitored. Francesca Stazi et al. [16] developed an automatic system for the opening and closing of windows in order to optimize indoor air quality and thermal comfort in classrooms. The objective approaches were compared to the students’ subjective responses, which were collected via questionnaires.
To conclude, thermal comfort is an important aspect of the indoor environment of buildings integrated with a PV system. In this article, the thermal comfort in the test unit, equipped with both PV windows and conventional windows, was evaluated by on-site testing and questionnaires. It was conducted in the city of Chengdu, which is located in the southwest of China, during the hot summer. For on-site testing, the examination of thermal comfort in the comparison unit was presented using the predicted mean vote—predicted percentage dissatisfied (PMV-PPD) index. Fifty respondents were asked to complete a well-designed questionnaire based on the standard ‘Evaluation Method of Indoor Thermal Comfort in China’ GB T33658-2017 [17].
2. Methodology
2.1. Test Unit and PV Module
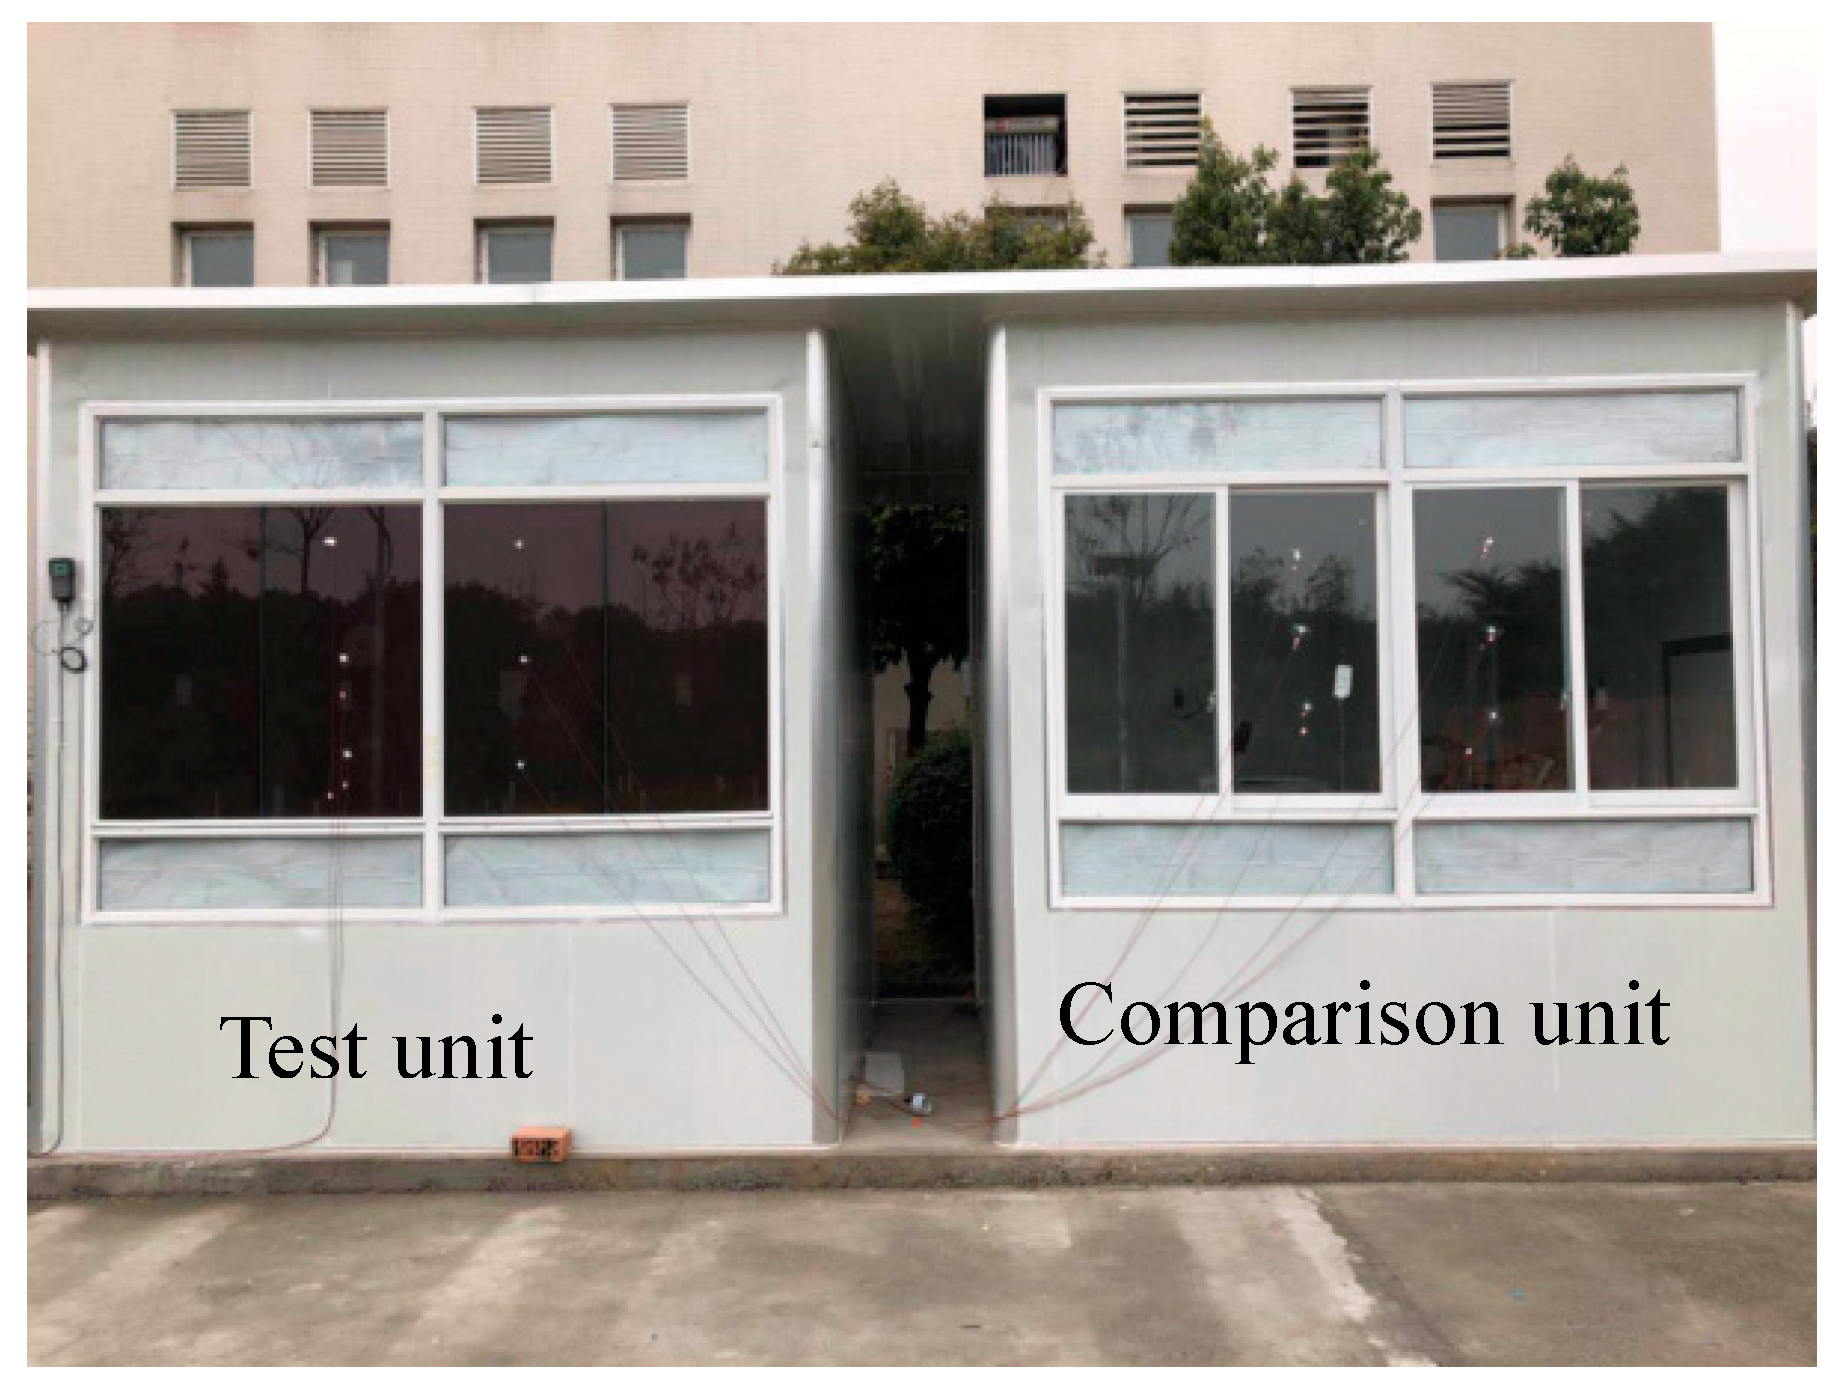
The test rig included two identical test units (3 m (depth) × 3 m (width) × 3 m (height)), as shown in Figure 2. The windows were installed on a south-facing wall. The window to wall ratio was in accordance with ‘Code for thermal design of civil building’ ‘GB-50176’ [18].
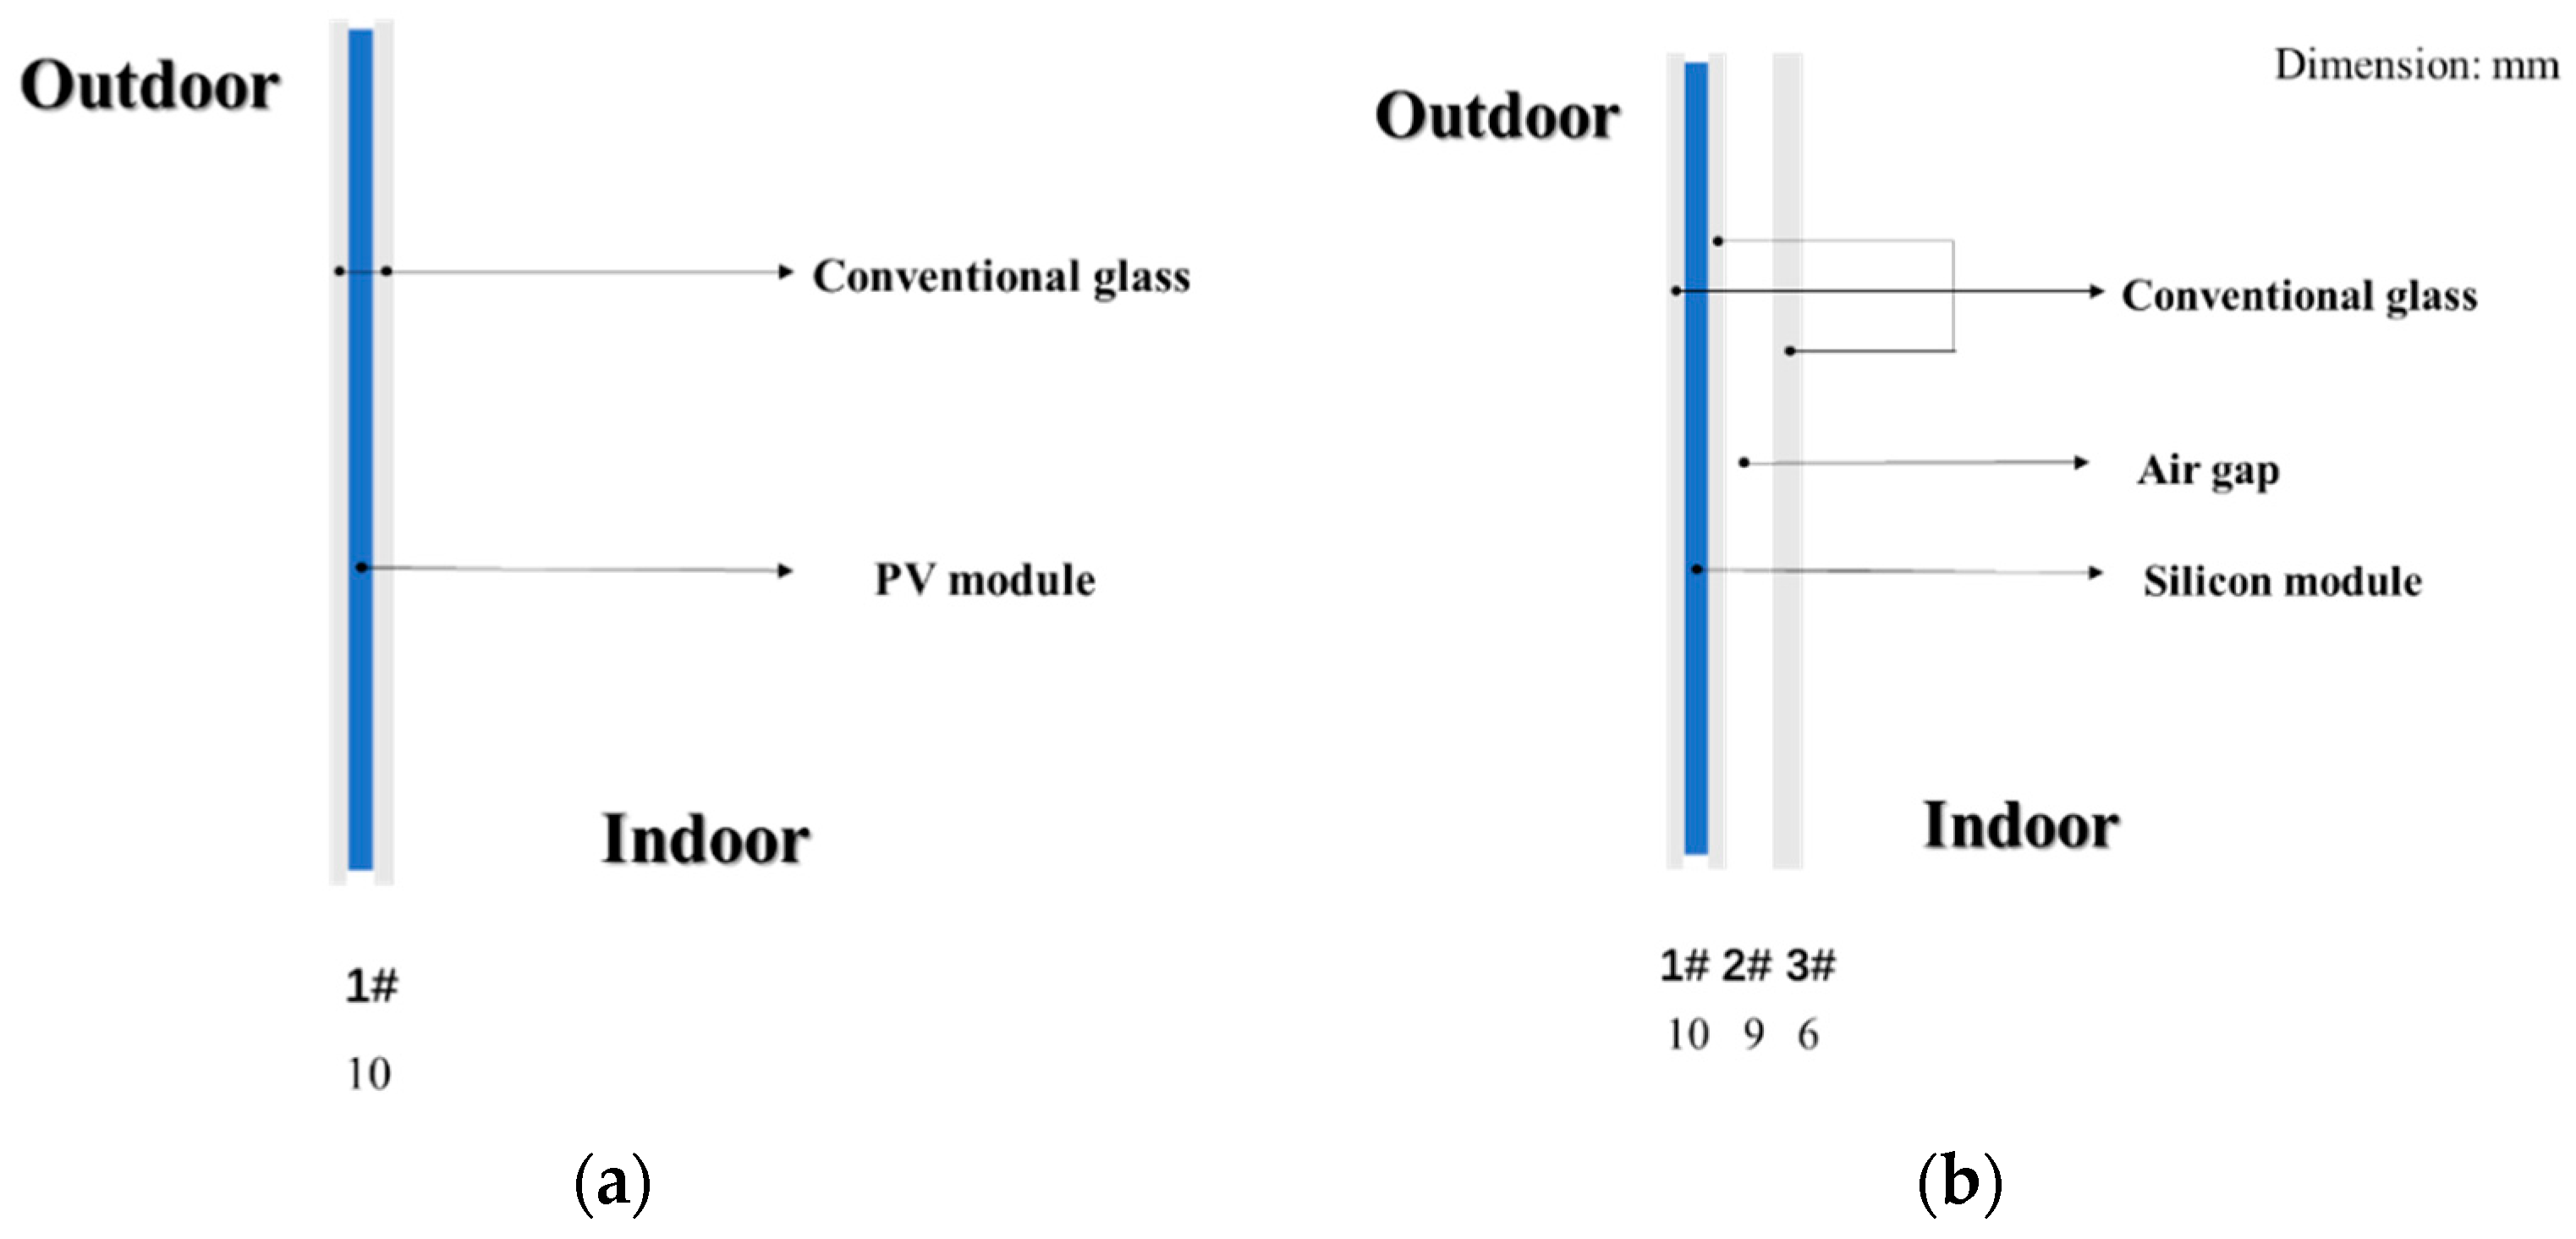
Our research team designed the prototypes of the STPV windows. The STPV window was comprised of a layer of tempered glass, a layer of air, and a layer of film module, as shown in Figure 3. The parameters of the STPV window are shown in Table 1. This increases the air thermal resistance, which can effectively prevent outdoor heat from entering.
2.2. Test Equipment and Method
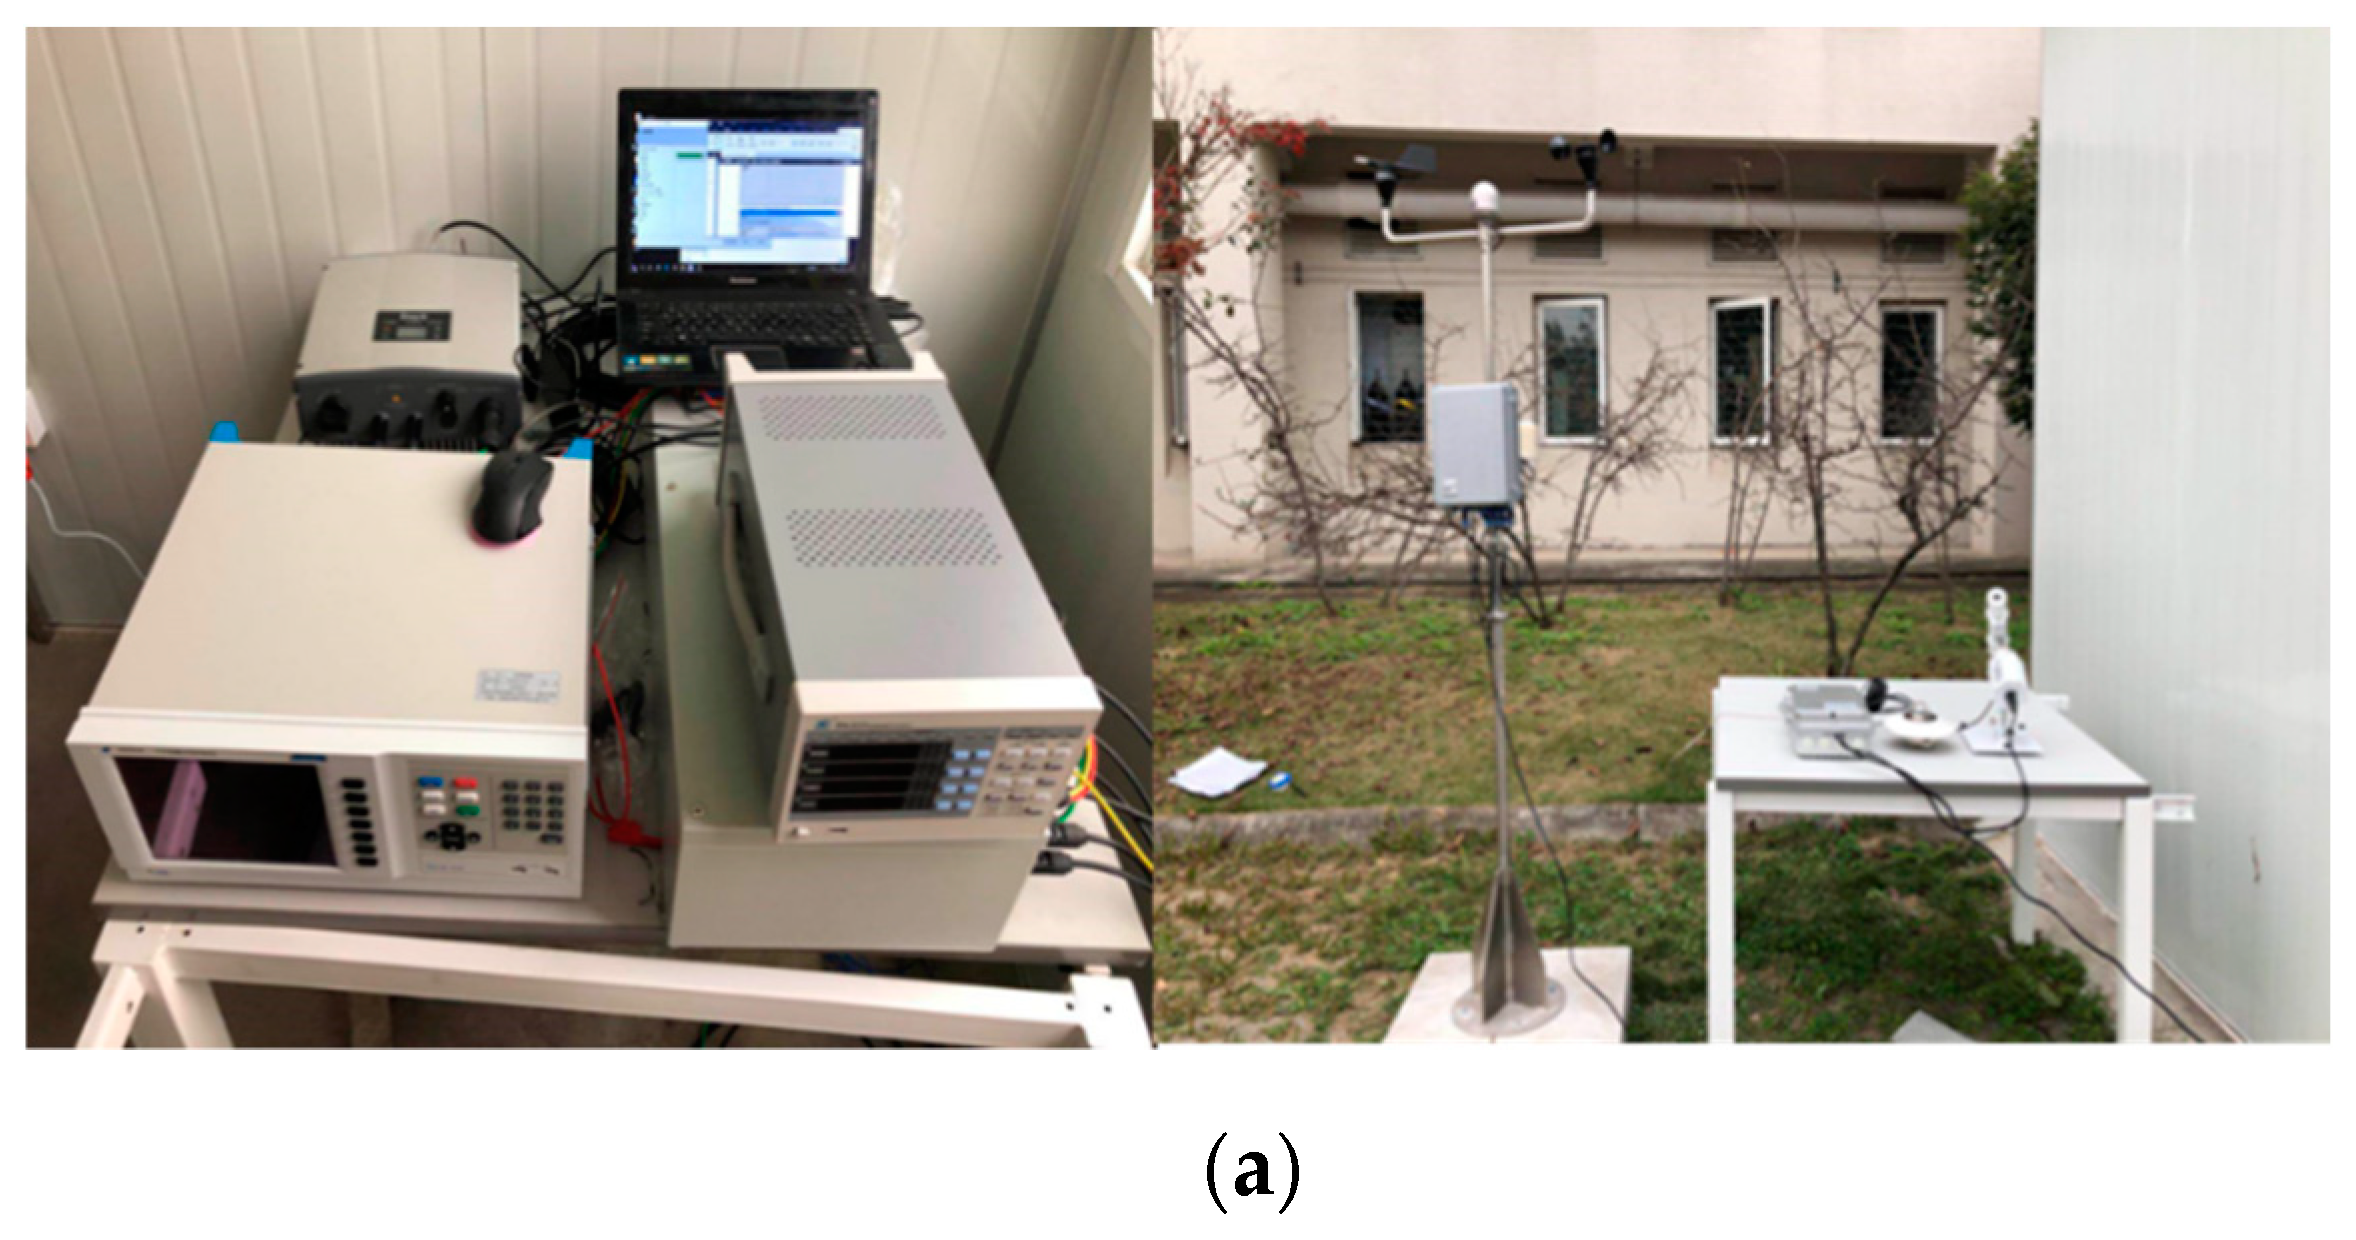
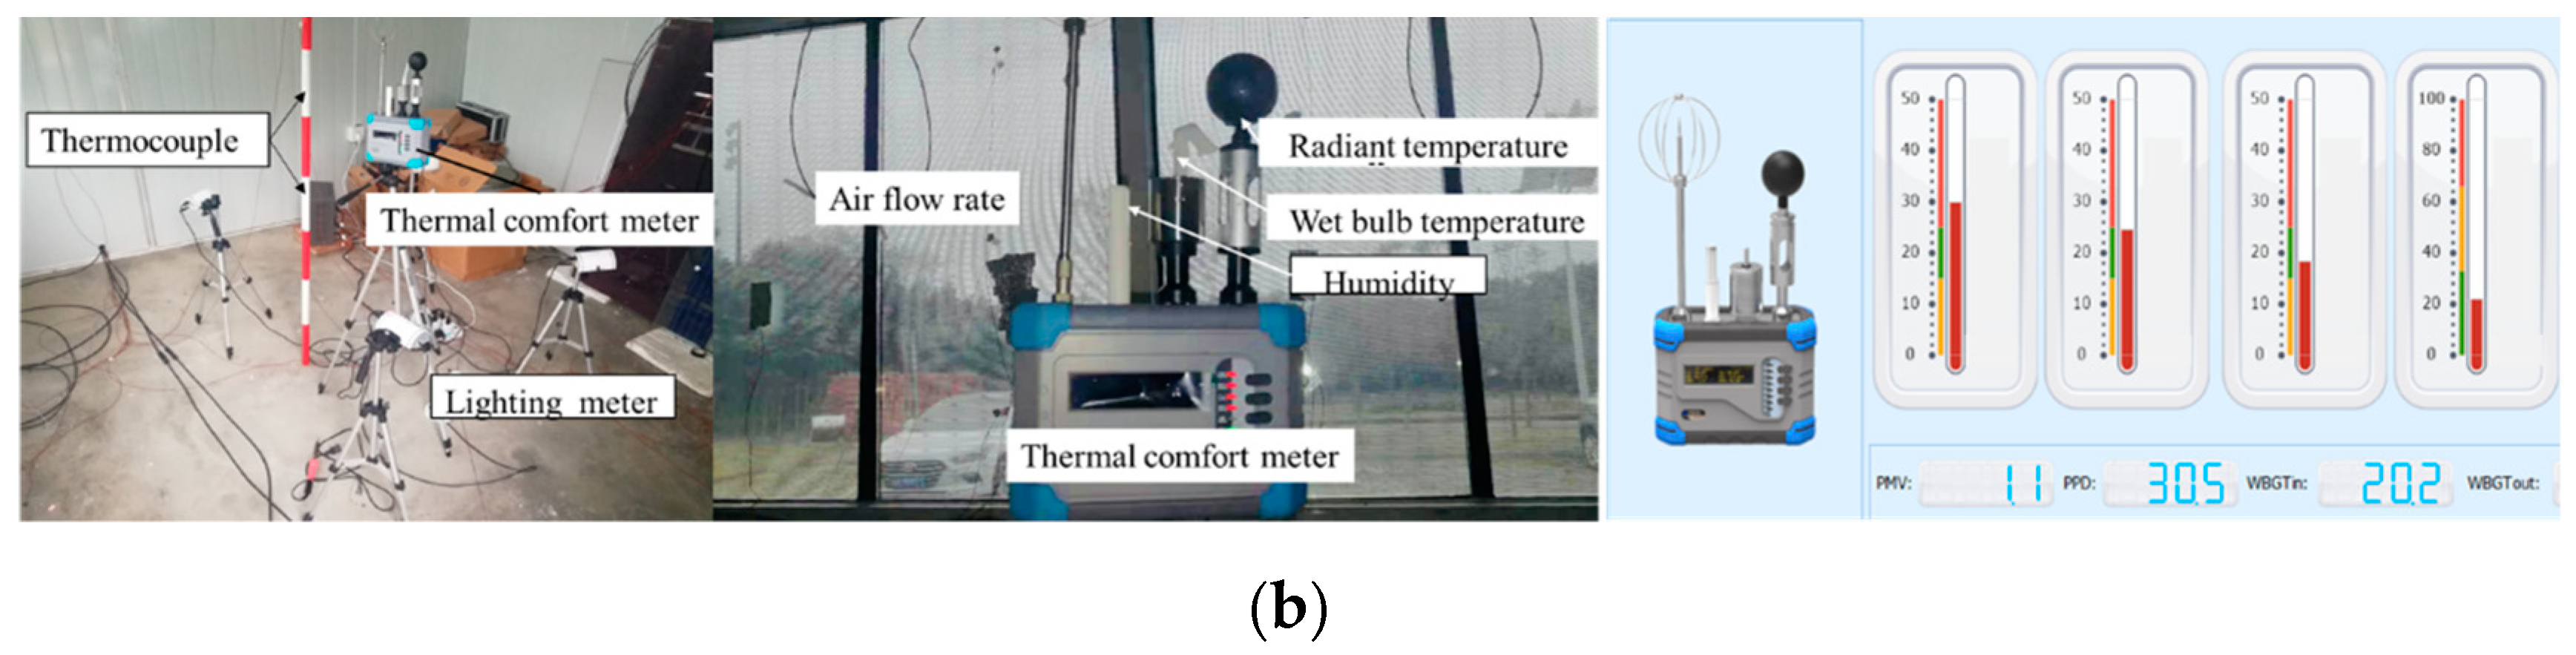
As shown in Figure 4, the weather data was monitored with outdoor test equipment, and measured humidity, outdoor ambient temperature, wind speed and direction, air pressure, global solar radiation, direct solar radiation, etc. The diagram of the indoor air temperature test is shown in Figure 5. Table 2 shows all the key instruments and their specifications.
The indoor environment test equipment was capable of measuring the indoor temperature, humidity, radiant temperature, air flow rate, wet bulb temperature, and illumination in accordance with the ‘standard of test methods for thermal environment of building’ JGJ/T 347-2014. [19]. Thermal comfort performance of the test unit and comparison unit was measured using the thermal comfort meter.
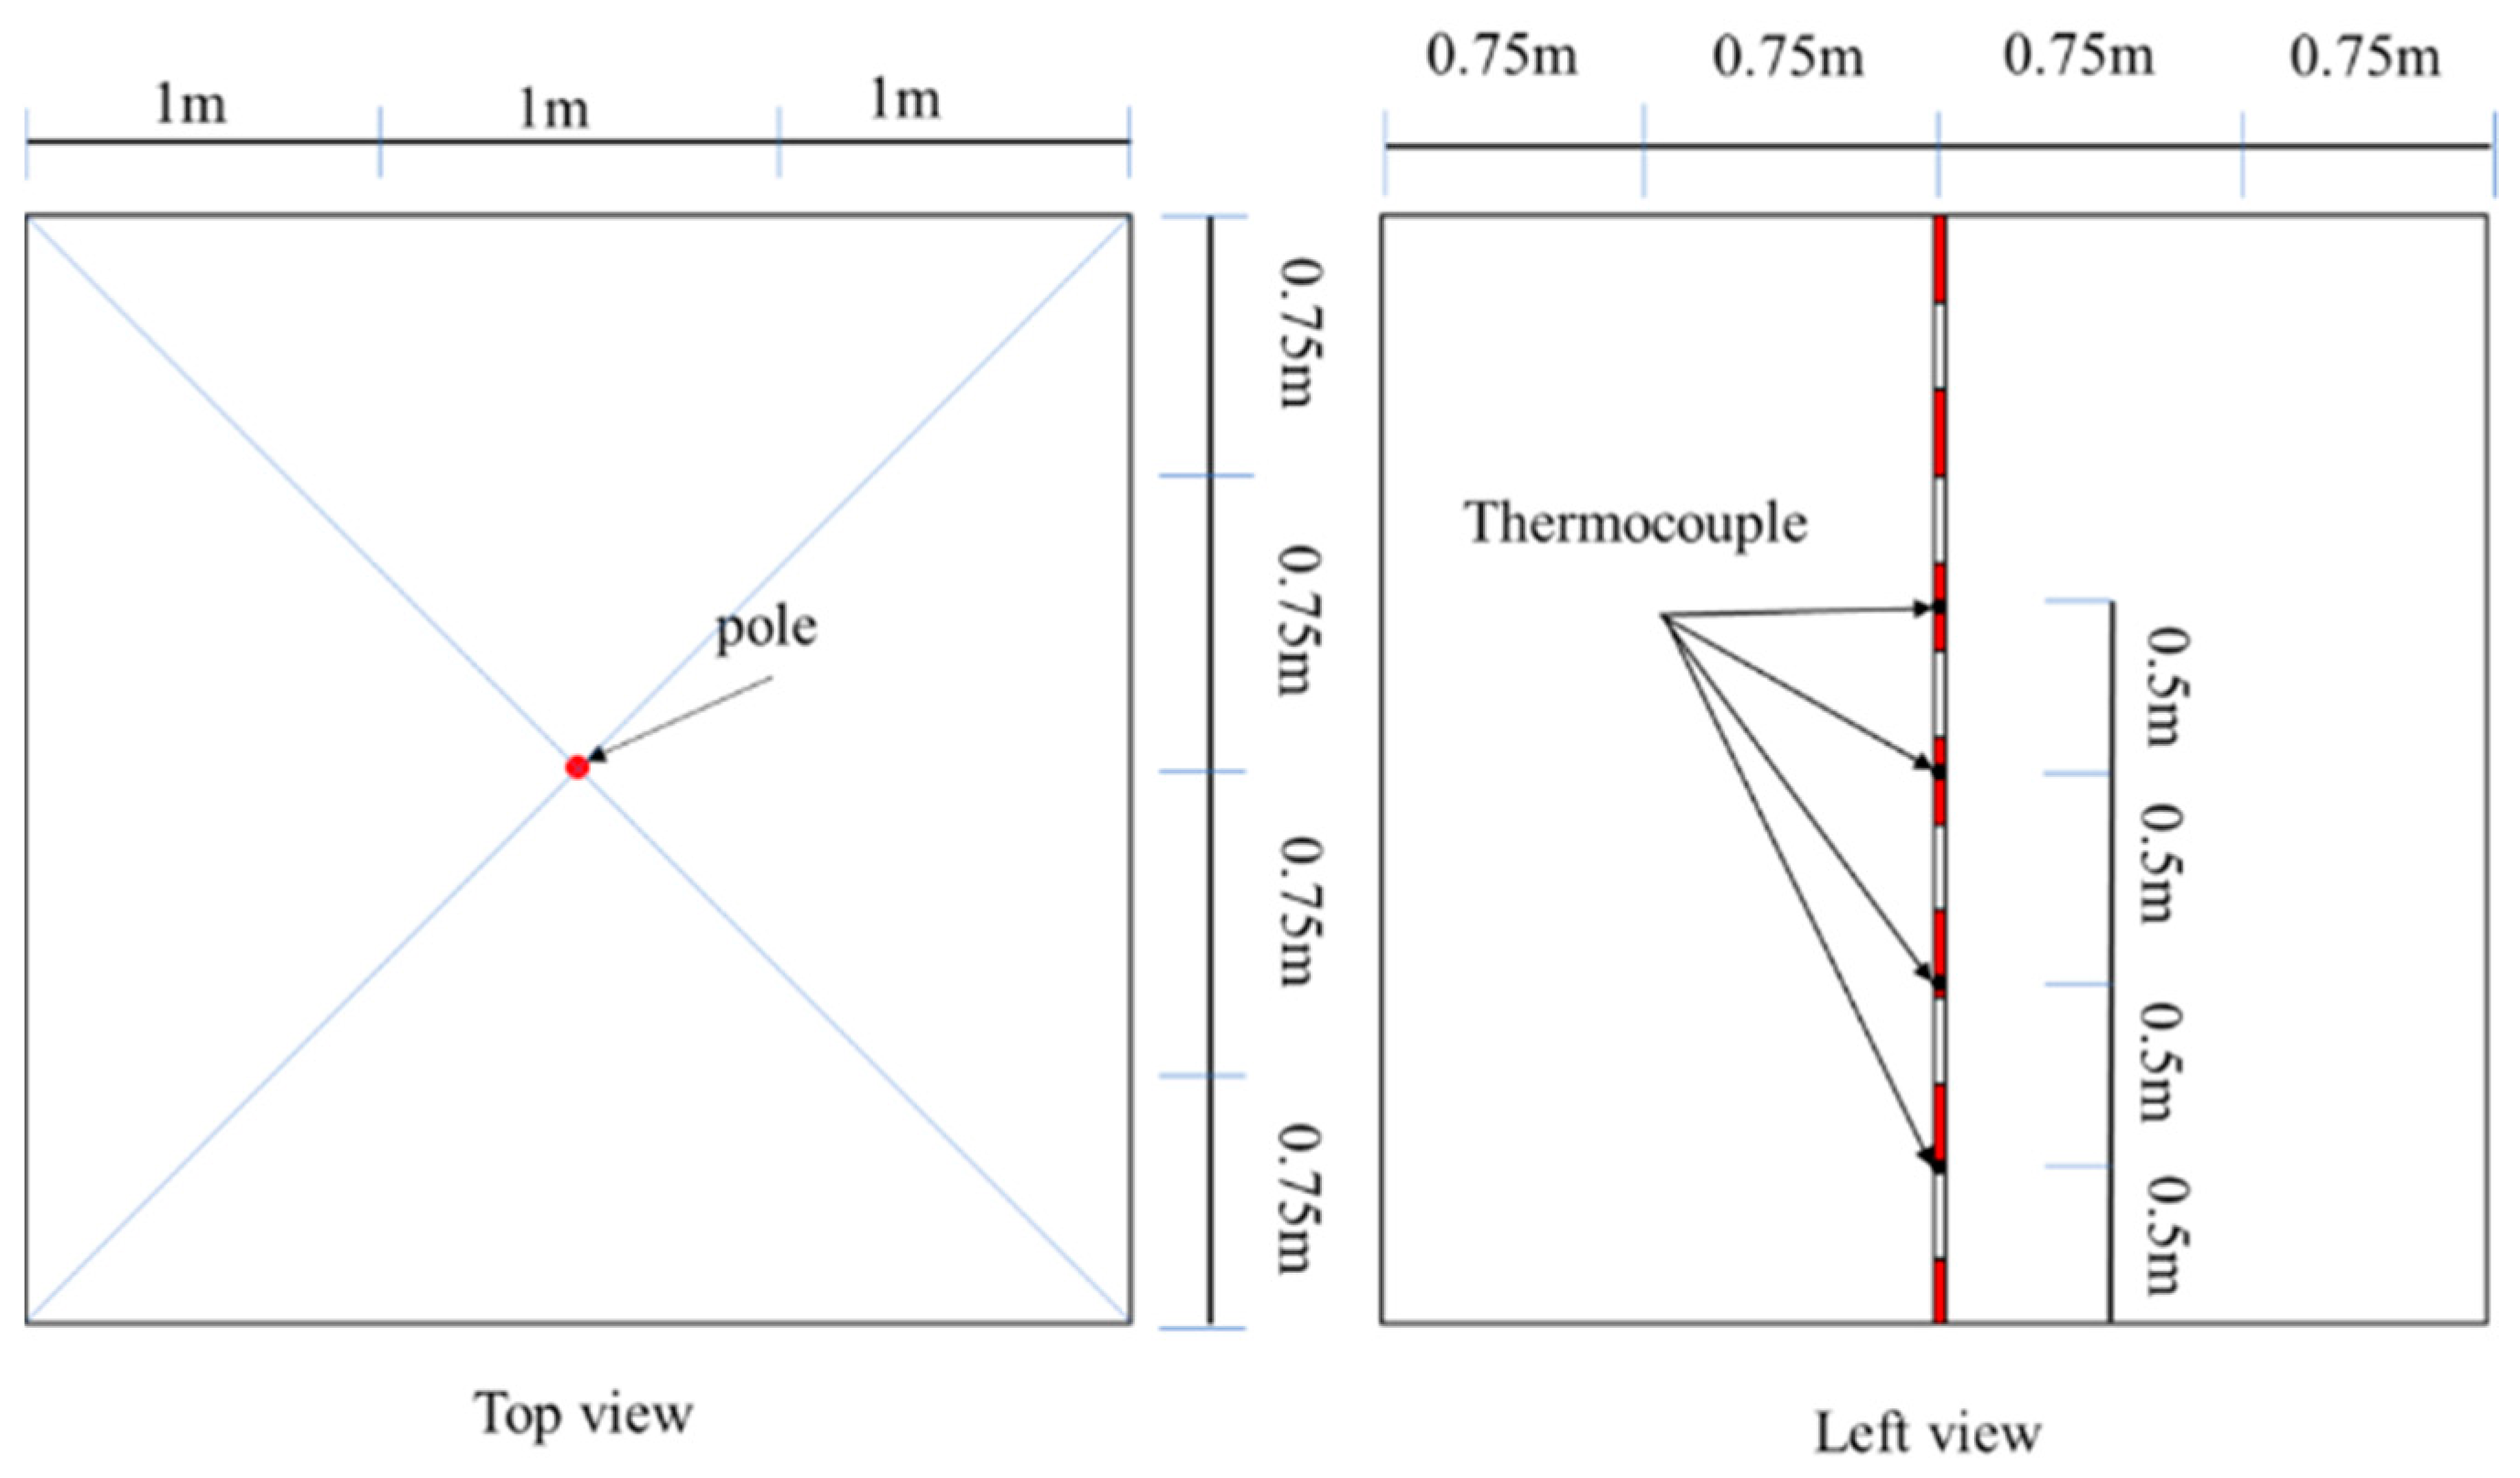
The measuring points were arranged at intervals of 0.5 m from the floor at the diagonal intersection of the building. They were mounted on a photovoltaic window facing south. Relative humidity in the test unit was measured using a high precision data recorder. The radiation temperature (Trt), ambient temperature, and air flow velocity were tested by a thermal comfort meter with relatively high precision. All the parameters were measured by the ‘Evaluation Method of Indoor Thermal Comfort in China’ [17].
The indoor air temperature, the inner and outer surface temperature of the PV module, and the ambient temperature of the test unit were measured with 15 T-type thermocouples. Relative humidity of the test unit was measured by a high precision (+2%) data recorder. The global solar irradiance on the south vertical plane was measured with an advanced digital solar radiometer, and air flow was measured using a hot wire anemometer. Radiation temperature (Trt), ambient temperature, and wind speed were measured by an outdoor environmental weather station in accordance with ‘GB T33658-2017’ [17].
2.3. Thermal Comfort Test Method
The American Society of Heating, Refrigerating and Air-Conditioning Engineers (ASHRAE) standard specifies the conditions in which a fraction of the occupants find the environment thermally acceptable. The PMV-PPD indicator is used to indicate people’s perceived value to the environment. The thermal comfort index PMV-PPD reflects the degree of human thermal balance deviation and is a comprehensive comfort indicator that represents the feelings of most people in the same environment.
PMV scales constitute seven thermal sensation points ranging from −3 (cold) to +3 (hot), where 0 represents neutral thermal sensation. PMV is a mathematical expression involving activities, clothing, and four environmental parameters, represented by equations such that Equations (1) and (2) can be plugged into Equation (3) and simplified. The intermediate value of the thermal resistance L of this paper was 0.09 m2·K/W because of the thin clothing worn by people in the summer. [17] The equations are defined as follows:
where M is the rate of metabolic heat production (W/m2), W is rate of mechanical work (W/m2), C is the rate of convective heat loss (W/m2), R is the radiative sensible heat loss from skin (W/m2), Cres is the rate of convective heat loss from respiration (W/m2), Eres is the rate of evaporative heat loss from respiration (W/m2), Ssk is the rate of heat storage in the skin (W/m2), and Scr is the rate of heat storage in the core (W/m2). Load is the thermal load on the body, defined as the difference between internal heat production and heat loss to the actual environment. Icl is the thermal resistance of clothing, in square meters degrees Celsius per Watt. fcl is the ratio of surface area of the body with clothes to the surface area of the body without clothes. ta is the air temperature, in degrees Celsius. tr is the mean radiant temperature, in degrees Celsius.
The relationship between PPD and PMV is as follows [20]:
2.4. Subjective Investigation Method
This research was carried out based on the thermal comfort opinions of students from Sichuan University and used the standard ASHRAE 7-point thermal sensation scale to assess the respondents’ perception of the indoor thermal environment. Before the experiment began, subjects were asked to sit in the test unit for 15 min. Fifty people were divided into two groups on the basis of their gender, consisting of 25 males and 25 females. Their anthropological data are shown in Table 3. The questionnaire attached to Table 4 was based on the “Evaluation Method of Indoor Thermal Comfort in China” [17].
3. Evaluation Results and Analysis
3.1. Thermal Environment Analysis with Semi-Transparent PV (STPV) Windows and Power Generation
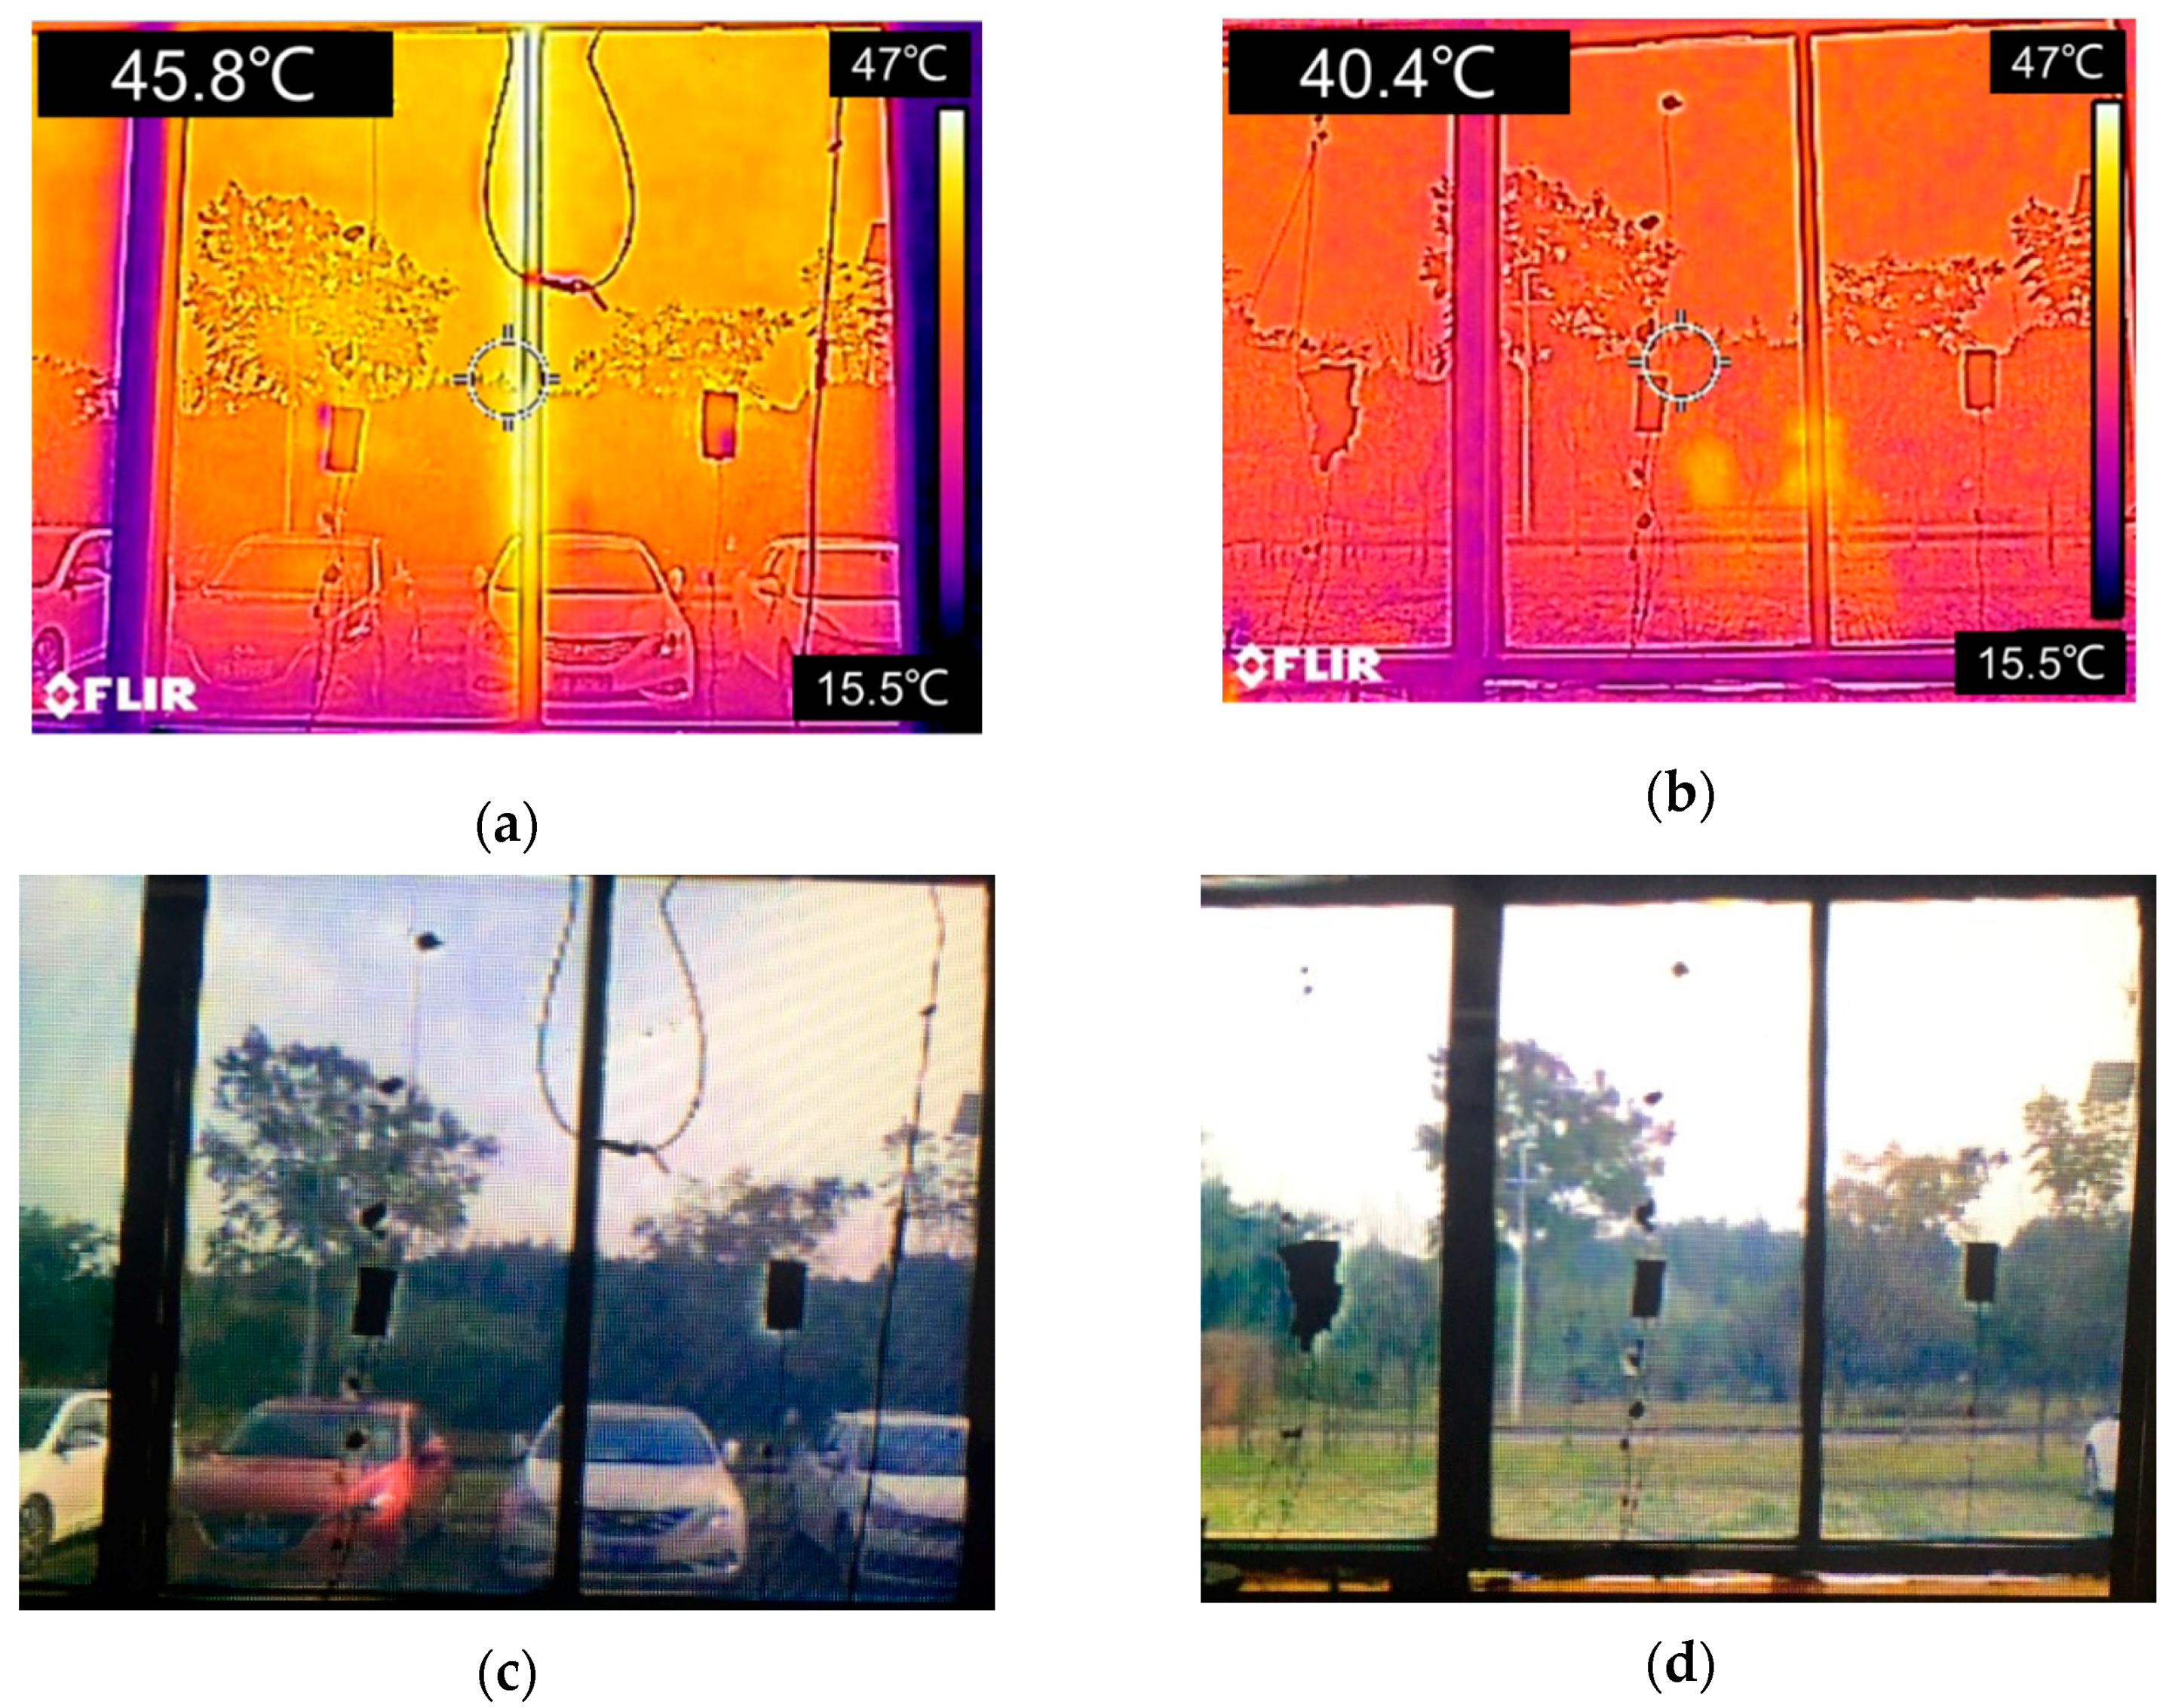
There are two situations that should to be considered in the analysis of window structure, single-layer and double-layer. As shown in Figure 6, the inner surface temperature of two STPV windows were captured by an infrared thermal imager. The temperature of the inner surface of the single-layer window was around 4 °C higher than that of double-layer window. It would bring a negative impact on the indoor thermal comfort and temperature fluctuations in the summer. A double-layer STPV window was selected with air thermal resistance in order to improve indoor thermal comfort.
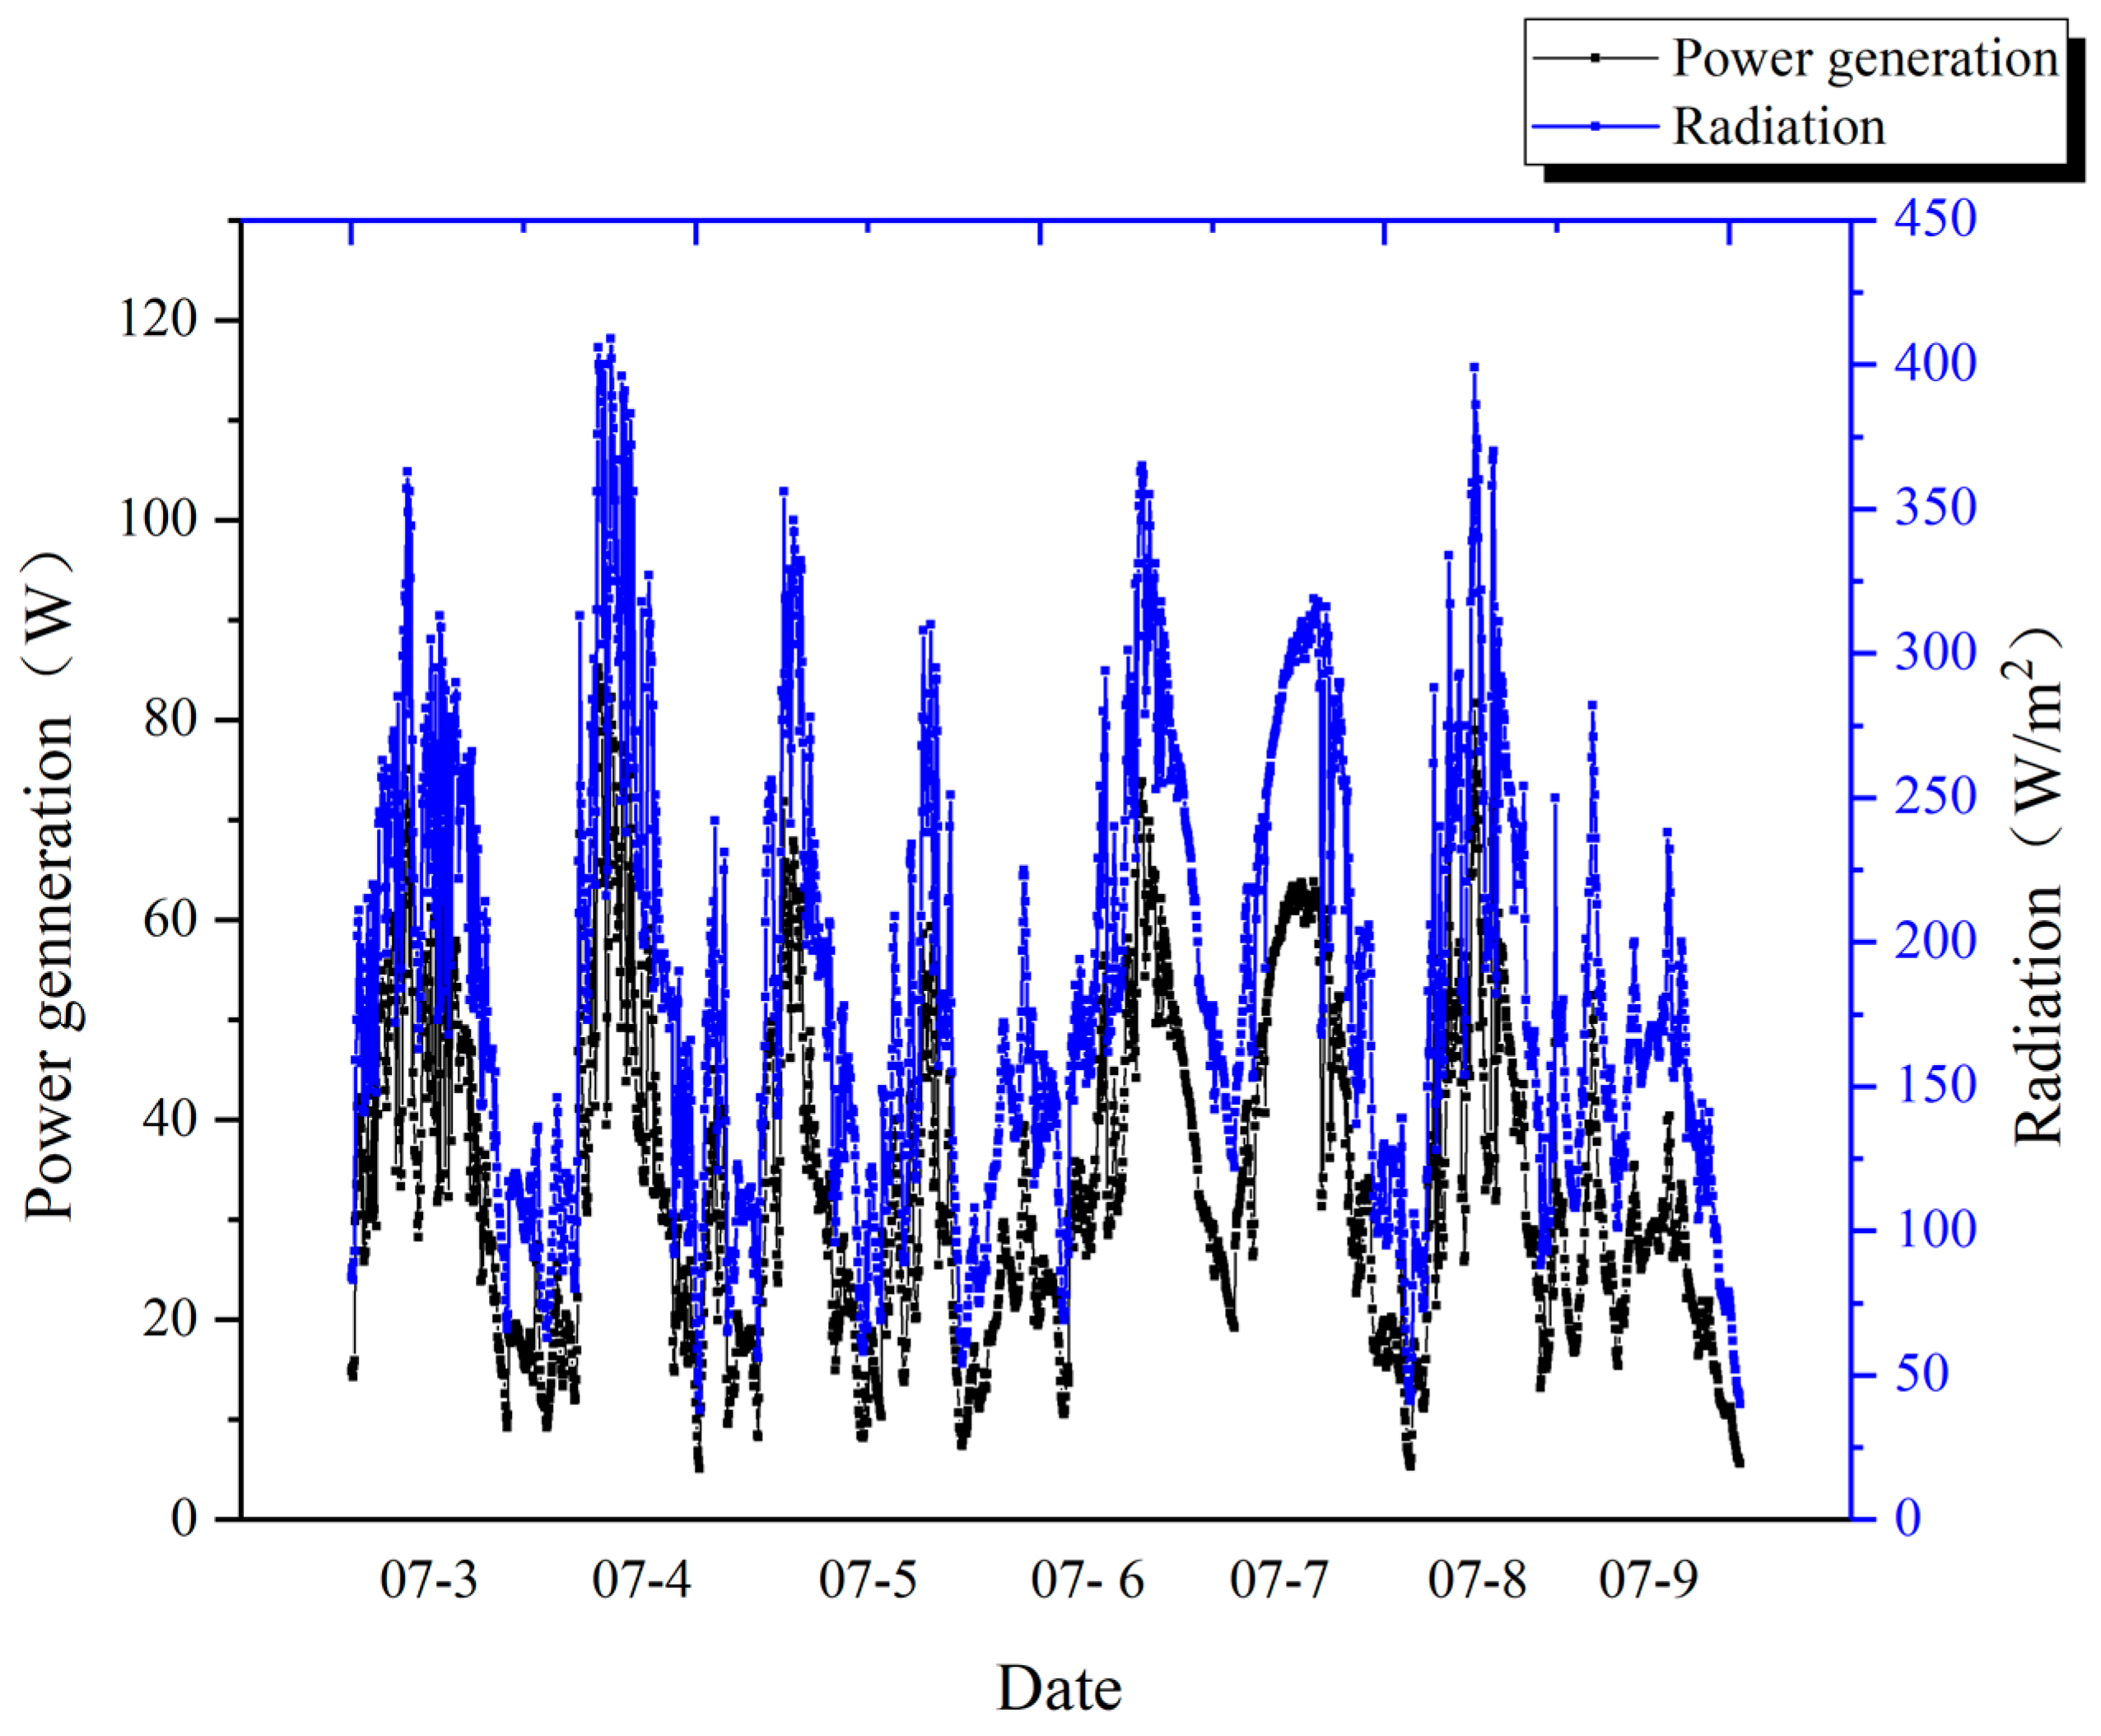
The electrical energy generated test was carried out during the thermal environment test. As shown in Figure 7, the global radiation on the window fluctuated from 50 W/m2 to 400 W/m2 with a mean value in 184 W/m2. The maximum power generation reached 30 W/m2 when the radiation was 400 W/m2. When it was sunny, the power generation could be 20 W~80 W with a mean power generation in 50 W. On the other hand, the power generation was 15 W~60 W in cloudy conditions. Compared to sunny days, the conversion efficiency on cloudy days was slightly reduced, and the maximum value was maintained at around 5%. The electrical performance test results of the a-Si window showed that the power generated by the a-Si window could meet partial energy demands of the building in this test during winter when intensity of the solar radiation is low. The mean power conversion efficiency was 5.6% during the test.
3.2. Thermal Comfort Comparison Test of the STPV Window and Conventional Window
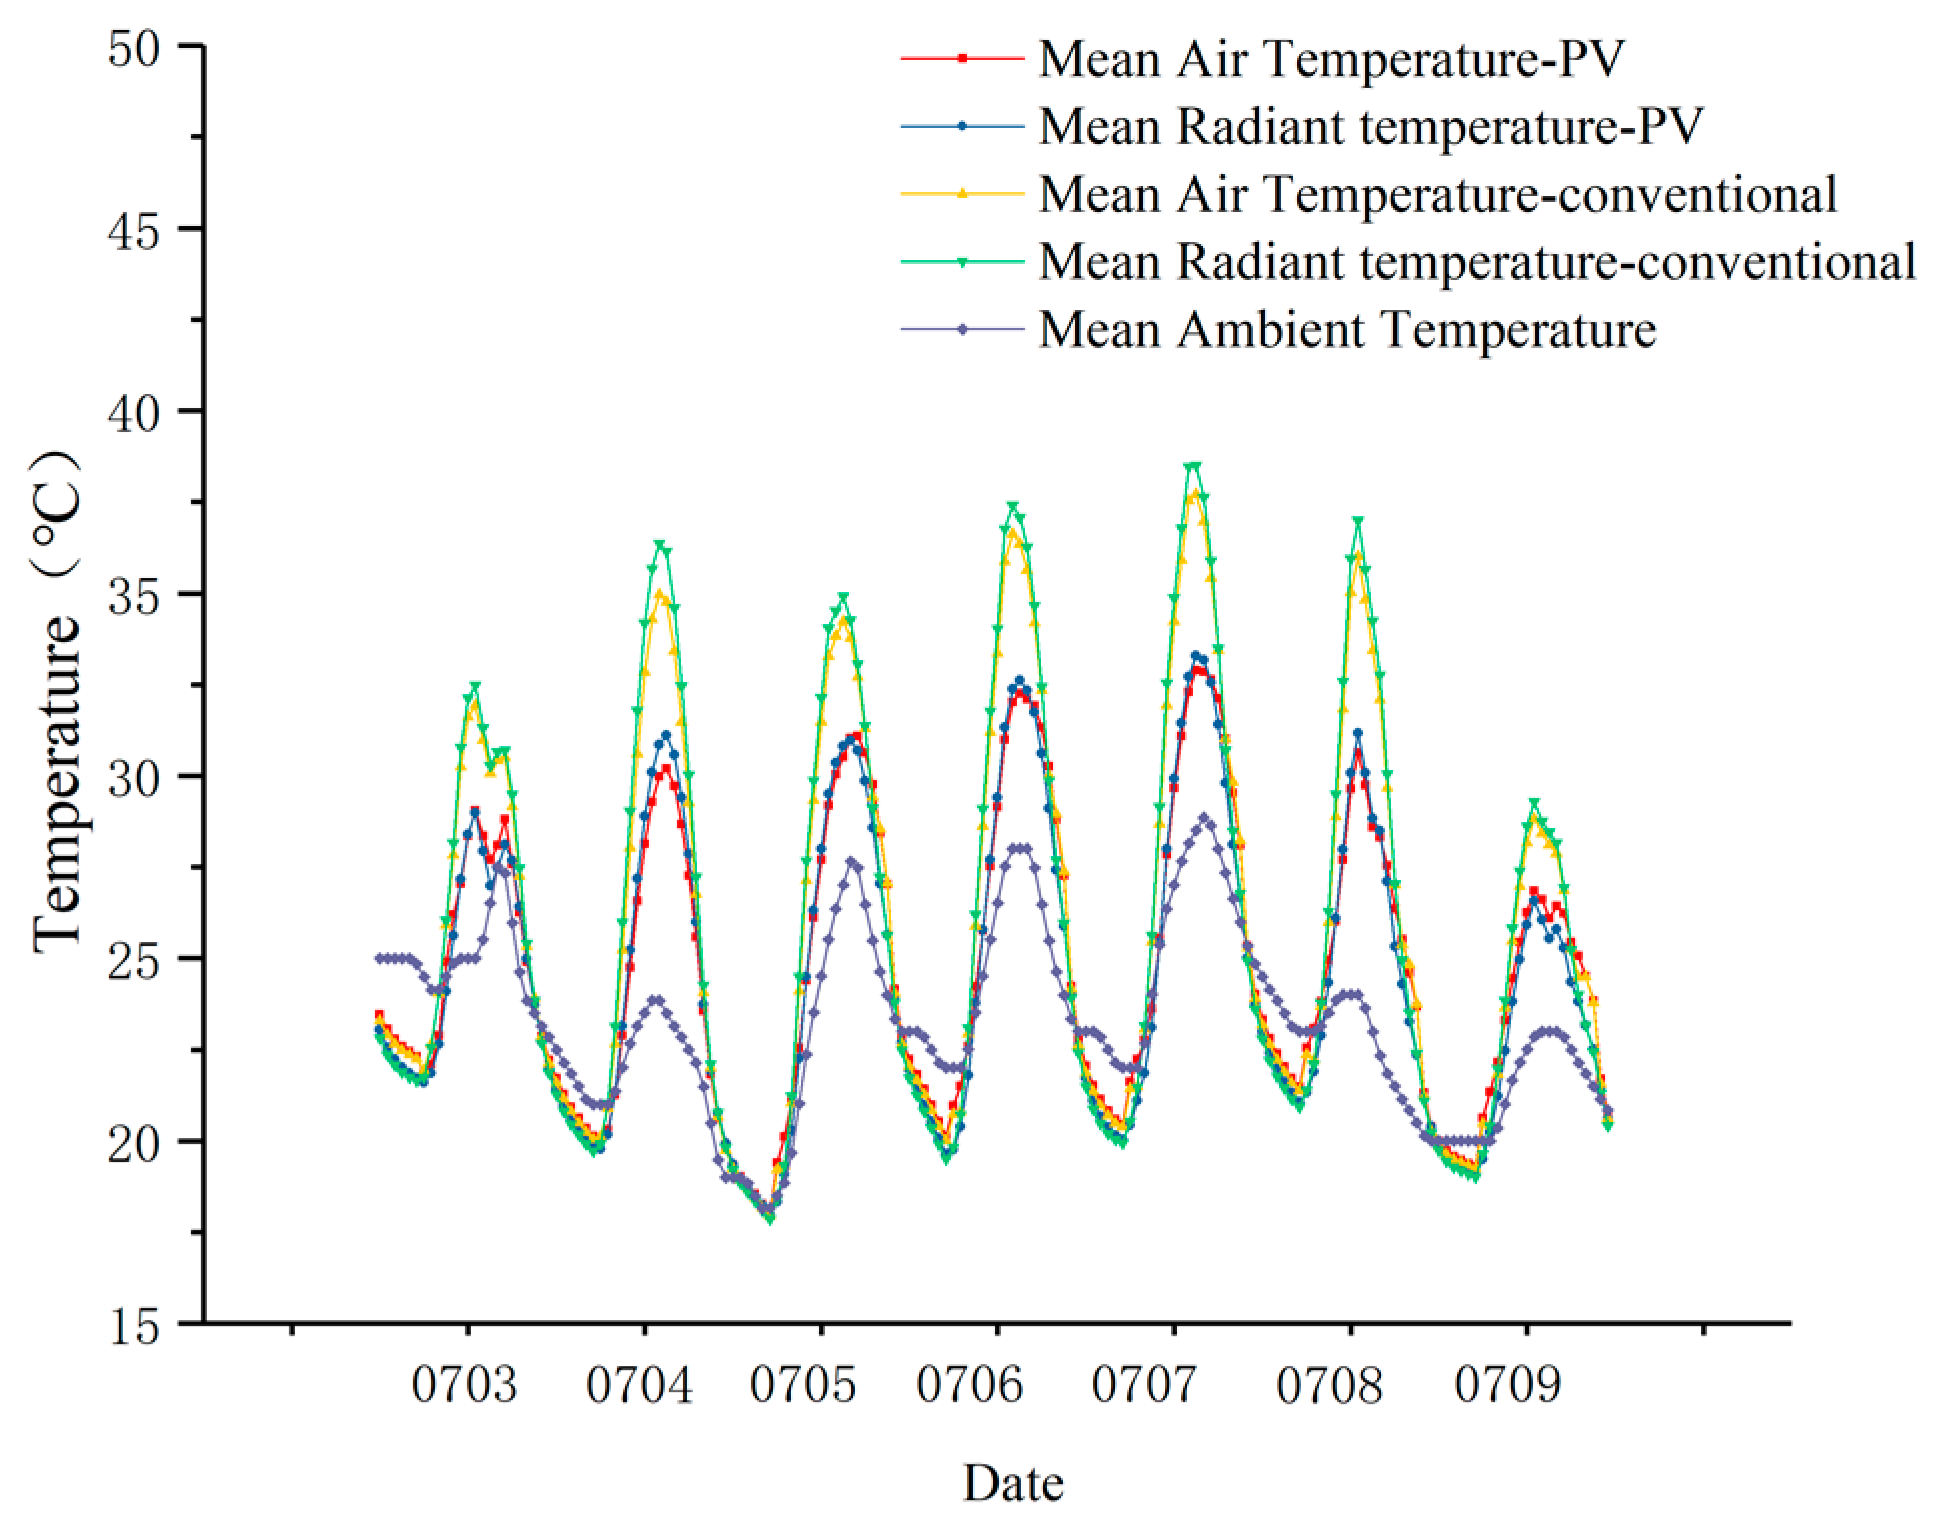
The test was carried out from 3 July to 9 July, which included four sunny days and two cloudy days. The mean air temperature and radiant temperature of the room equipped with the STPV window and conventional window are shown in Figure 8. On 7 July, a sunny day, the mean air temperature in the comparison unit and test unit reached 37 °C and 32.5 °C, respectively. The radiant temperature in the comparison unit and test unit reached 38.5 °C and 32.7 °C, respectively. On 9 July, a cloudy day, the mean air temperature in the room with conventional window and PV window reached 28.8 °C and 26.5 °C respectively. The radiant temperature in the comparison unit and test unit reached 29.3 °C and 27.4 °C, respectively. The mean air temperature and radiant temperature of the test unit were always lower than that of the comparison unit during daytime. The temperature rose at a slightly faster rate in the morning and fell at a slower rate during the afternoon. In general, the radiant temperature was higher than air temperature during the daytime and was slightly lower at night. This was because solar energy transmitted during daytime and was transmitted/conducted from indoors to outdoors at night. It can be seen from Figure 8 that after installing the STPV window, the fluctuation in air temperature and radiant temperature decreased as a result of the better thermal performance of the STPV window.
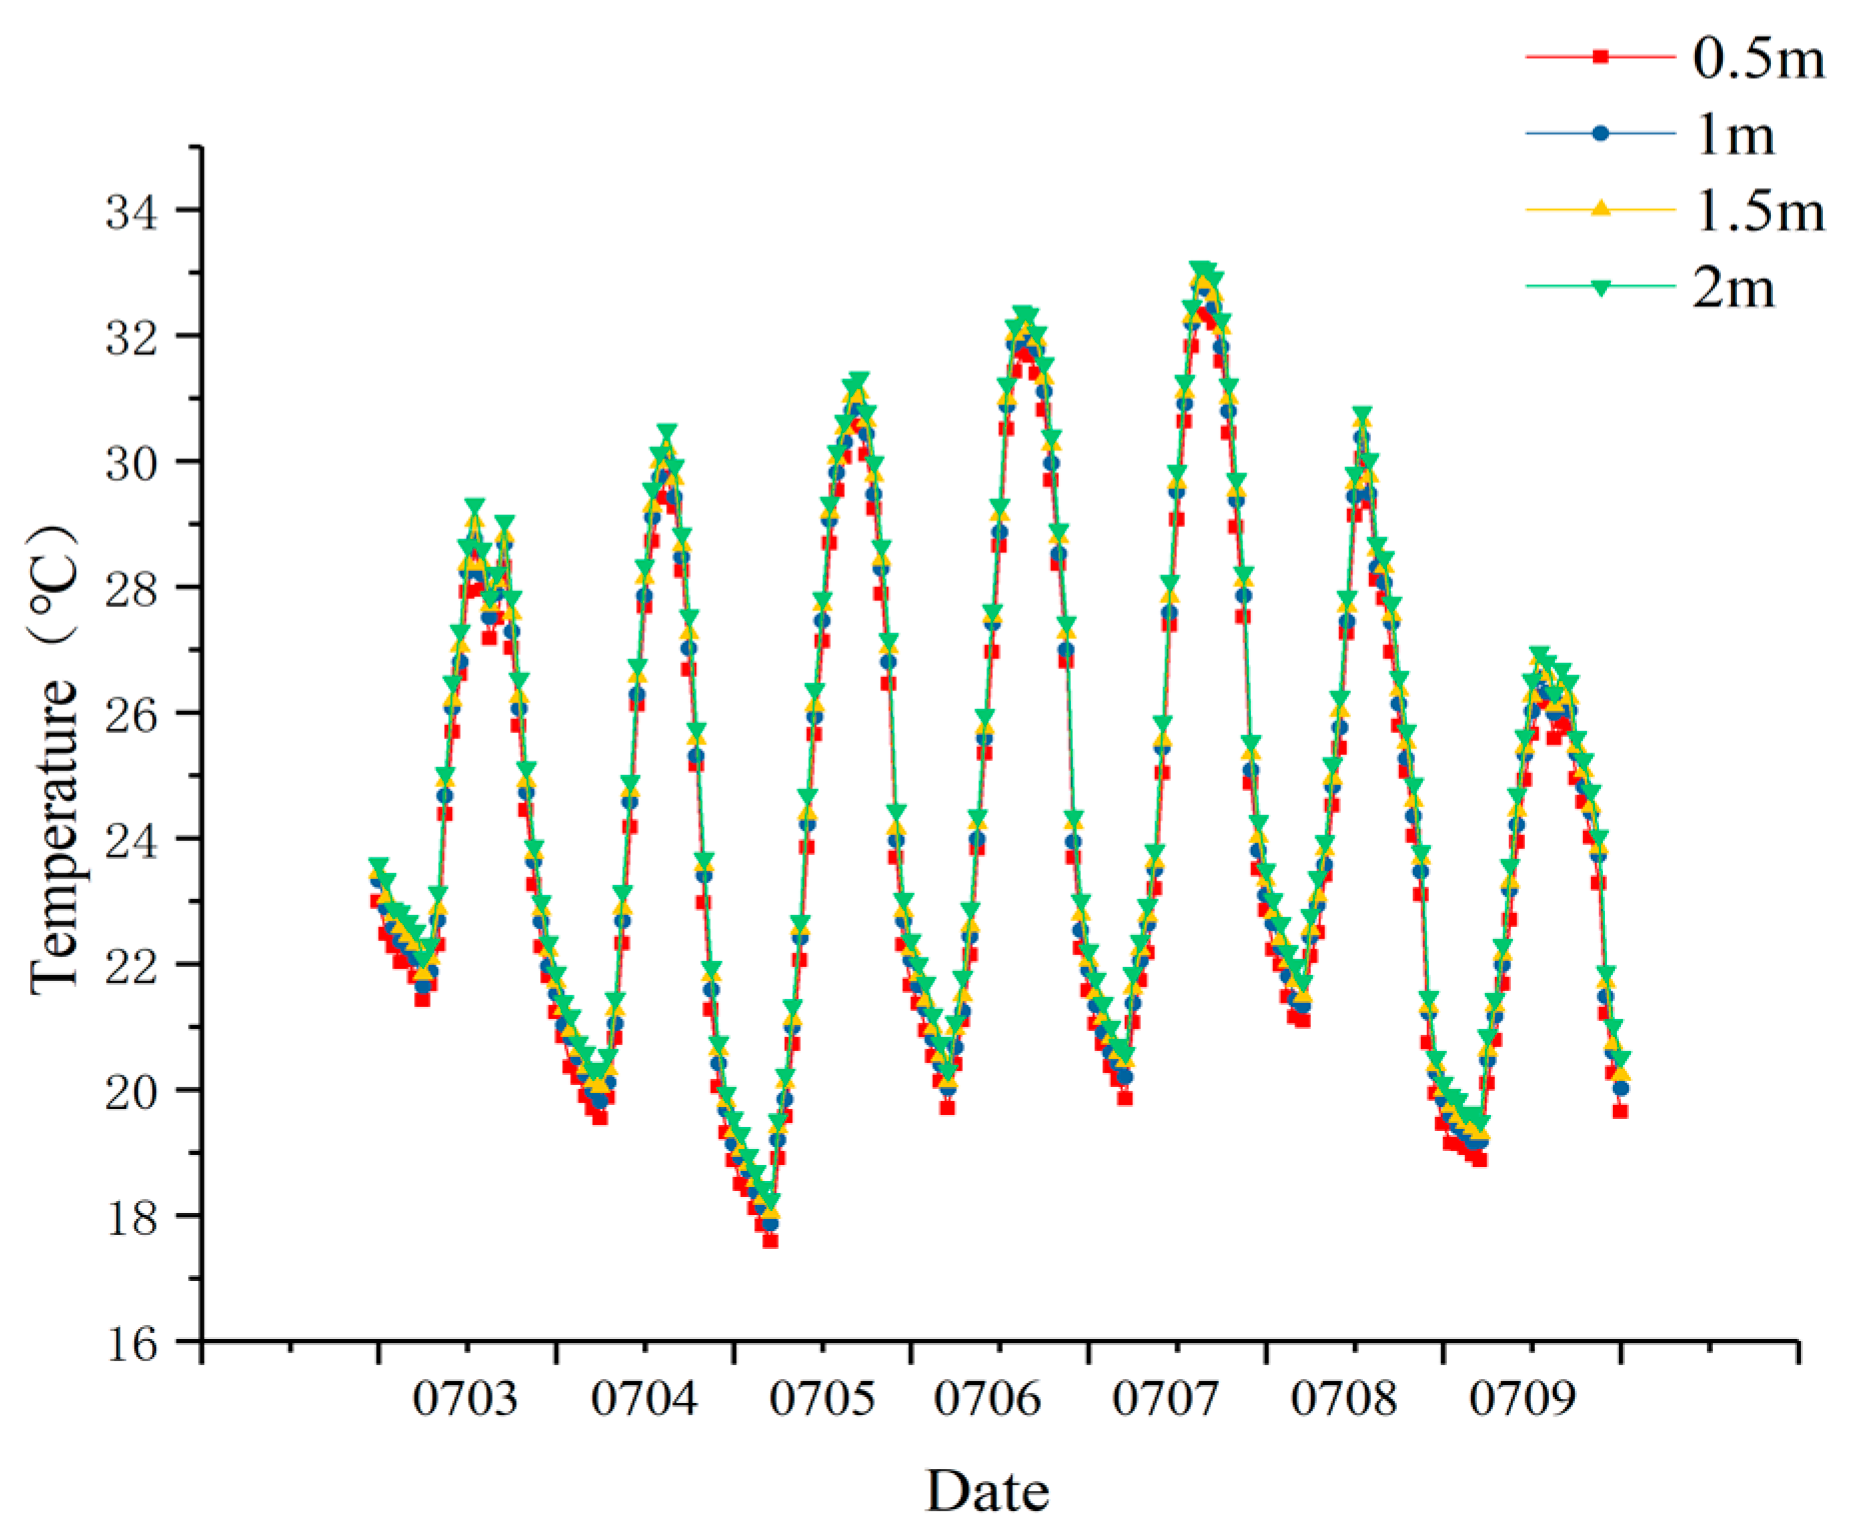
In order to analyze the local thermal comfort, the air temperatures from 0.5 m to 2 m in the test are shown in Figure 9. From 0.5 m to 2 m, the temperature gradually increased over a small range. The maximum difference between the temperature at 0.5 m and 2 m was lower than 1 °C. Thus, the temperature difference was insignificant from 0.5 m to 2 m. This indicates that the local thermal comfort was uniform and acceptable.
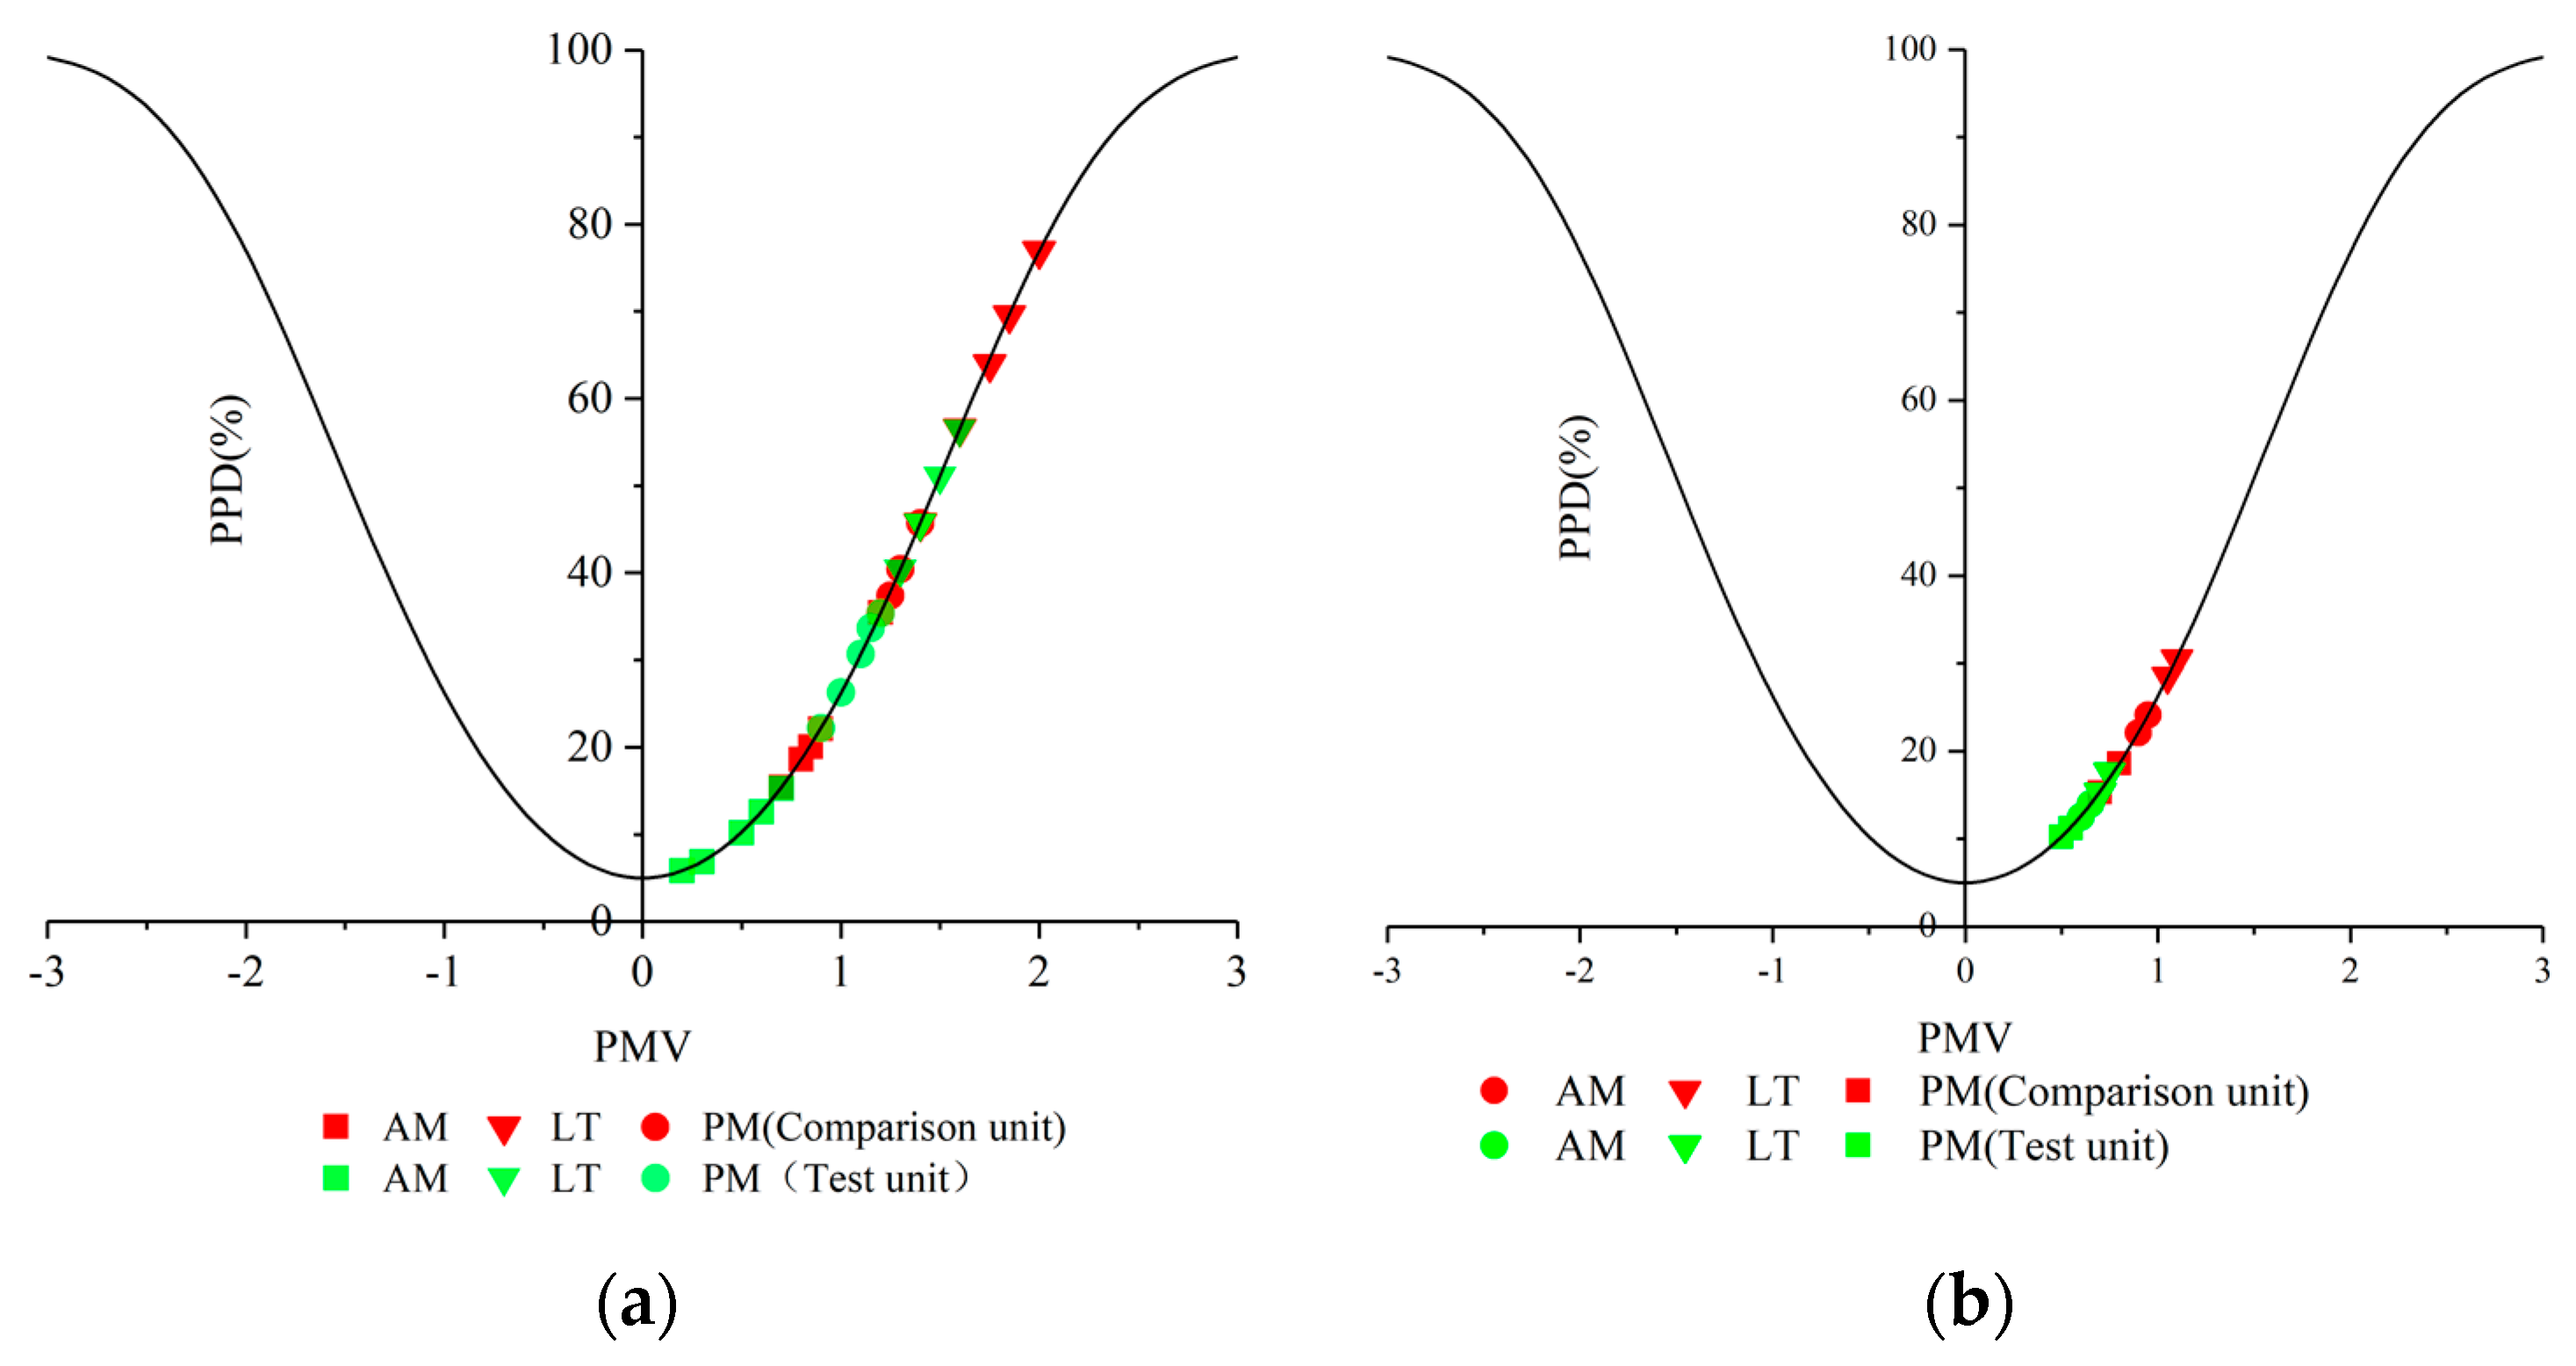
Indoor thermal comfort is a comprehensive index that includes the measurement of the solar radiation, temperature, radiant temperature, humidity, and air flow rate. The plot representation of the PMV-PPD value, proposed by GB/T50785-2012 [20] to assess the whole-body thermal comfort, can be found in Figure 10.
During sunny days, according to the test, the PPD measurements in the test unit fluctuated from 5.8% to 51.2%. In the test unit, the most uncomfortable conditions also occurred during the noon period, with a PMV value of 1.3. On the other hand, PPD measurements in the comparison unit fluctuated from 18.6% to 76.9%. The most uncomfortable conditions occurred during the noon period with a PMV value of 2.0 in the comparison unit. When the solar radiation did not reach a high value, occurring in the morning, the test unit obtained the most comfortable conditions according to the PMV-PPD value.
During cloudy days, due to the low solar radiation, the PV window only worked for short periods of time. PPD values were changed (5.8–15.3%), and the mean value was 10.47%, while the PMV distribution fluctuated from 0.51 to 0.7 with a mean value of 0.54. Compared to the test unit, the PPD value changed from 18.6% to 33.9%, and the mean value was 25.47% in the comparison unit. The PMV distribution fluctuated from 0.7 to 1.2 with a mean value of 1.02.
Due to the shielding of solar radiation, the PMV-PPD value was always higher in the comparison unit than that of test unit. Although PMV-PPD scores are not in the suggested acceptability in ASHARE standards, the test unit equipped with the STPV window showed a better thermal environment than the comparison unit.
3.3. Subjective Questionnaire Investigation
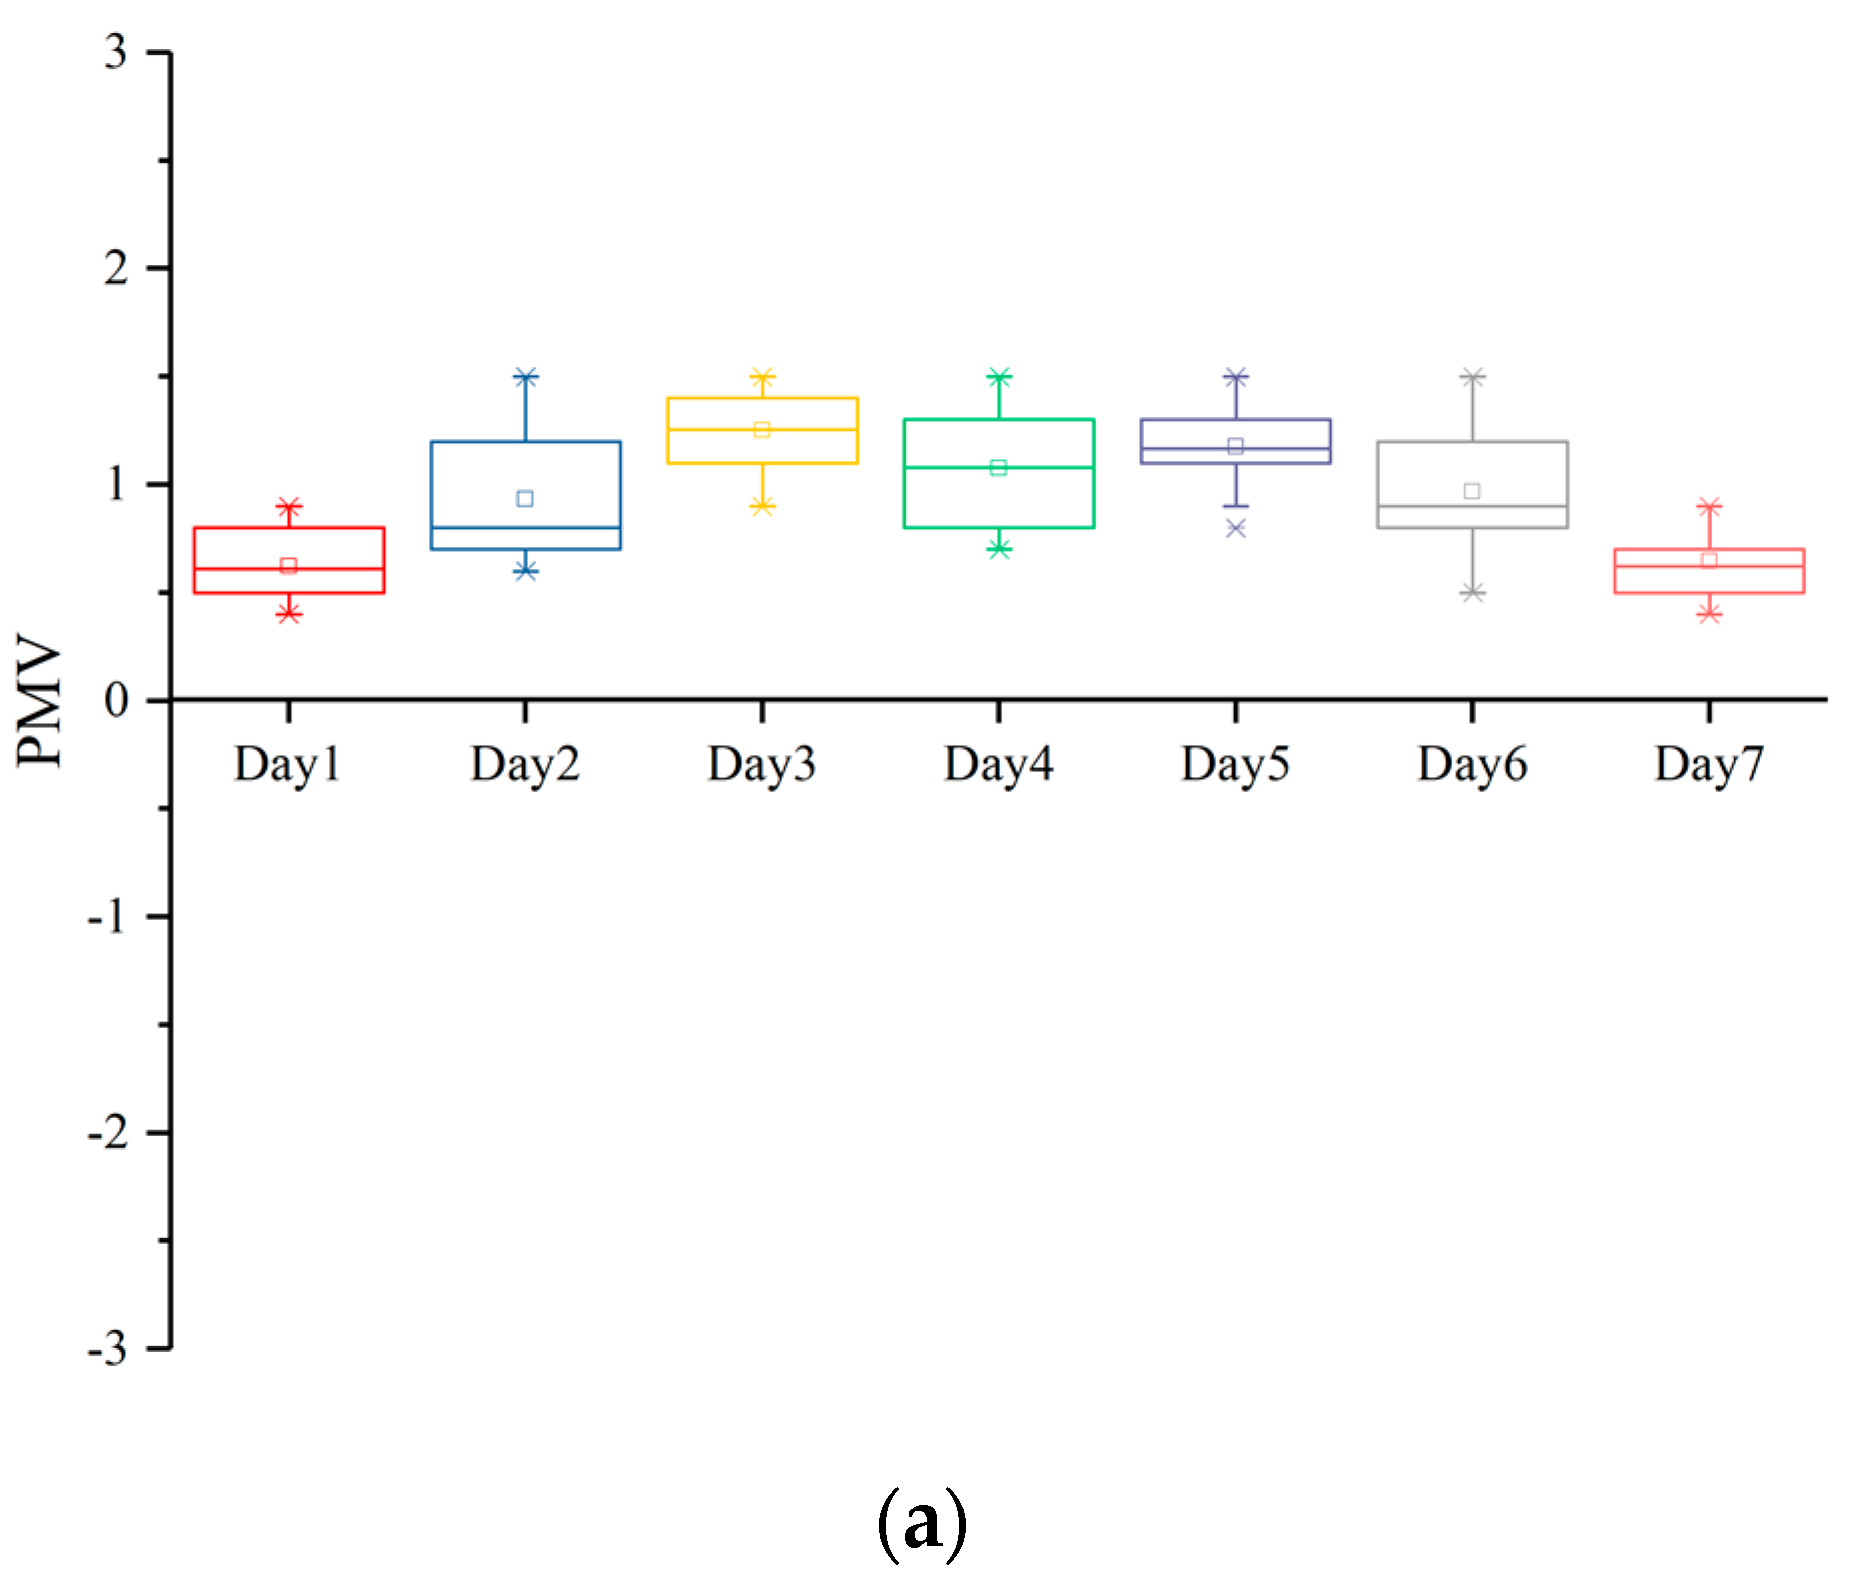
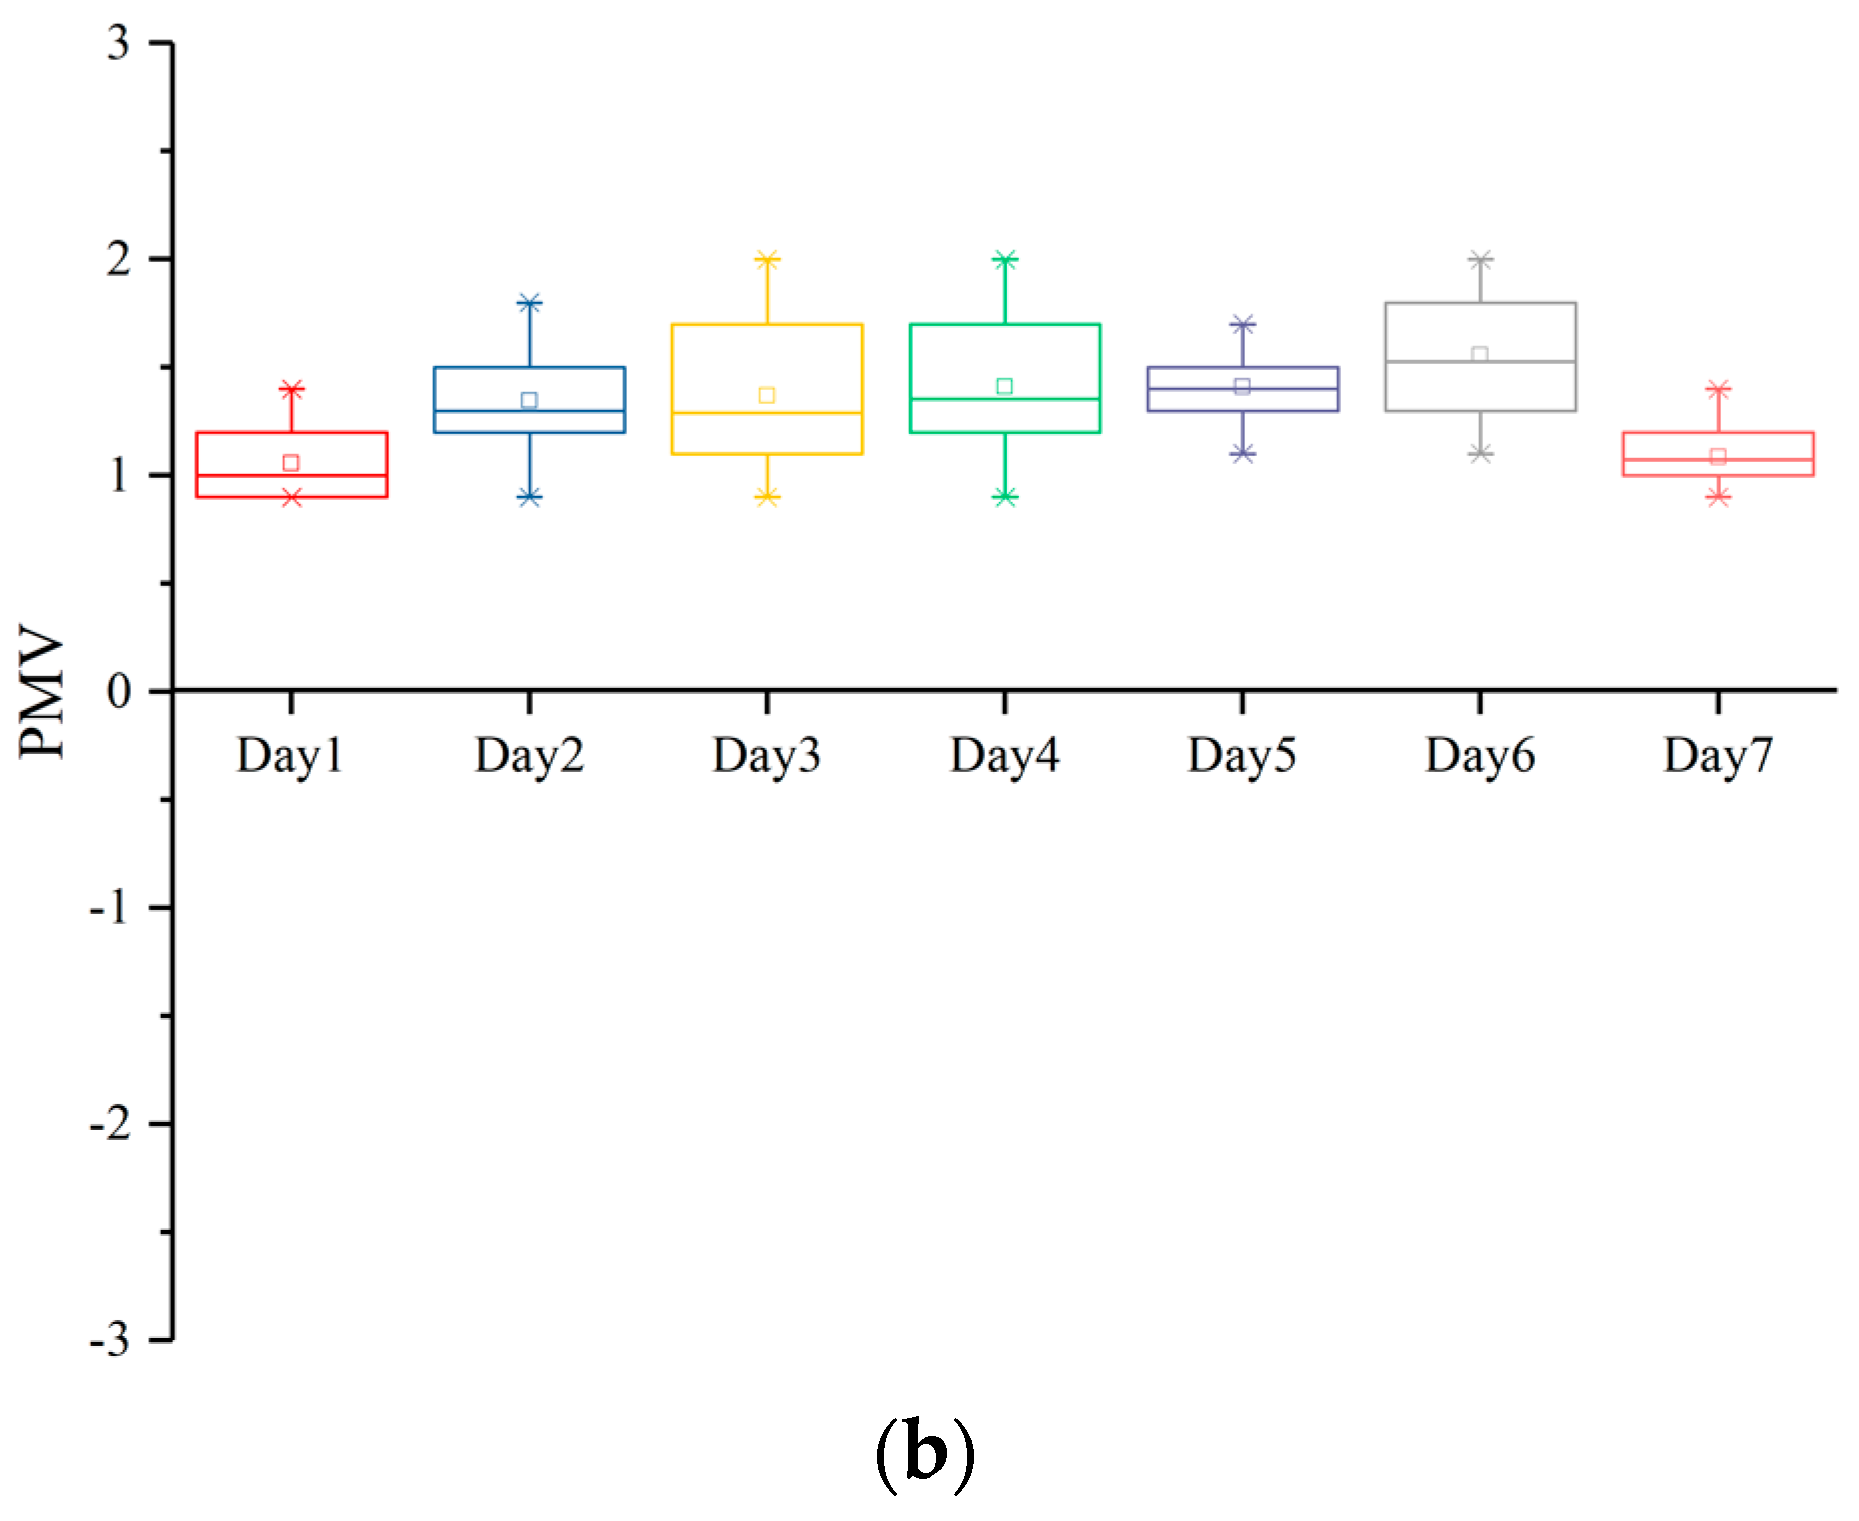
The results of the questionnaire investigation are summarized Figure 11. It provided valuable information about the offset between the two units, and they can be clearly identified. The box-plot shows the thermal sensation of the objects, the upper limit meant a higher PMV value during the questionnaire investigation, and the lower limit meant a better PMV value during the questionnaire investigation. For example, the first box-plot in Figure 11 showed that the PMV value was from 0.5–0.8, indicating that people felt comfortable during the test. The upper and lower limit in the second box-plot in Figure 10a and third box-plot in Figure 10b had a wider span, which indicated a greater temperature difference between indoor and outdoor. These box-plots showed that the gap between median and lower quartile was less than the gap between median and upper quartile, especially in the comparison unit. This phenomenon shows that many of the respondents felt hotter when they stayed in the comparison unit.
As to the respondents, thermal sensory vote statistics can be found. People felt warmer in the comparison unit than in the test unit. In the test unit the PMV ranged from 0.5–1.5, and the mean value was 1.06. In the comparison unit the PMV ranged from 0.7 to 1.9, and the mean value was 1.46. In the test unit the PPD value was 28.3%, while in the comparison unit the PPD value was 48.2%. Based on the results of the subjective investigation, the thermal comfort in unit with STPV windows was found to be 40% better than that in the corresponding unit without STPV windows. To conclude, respondents were not pleased with the thermal indoor conditions of the two units due to the lack of air-conditioning, which was crucial to not disturb the indoor environment.
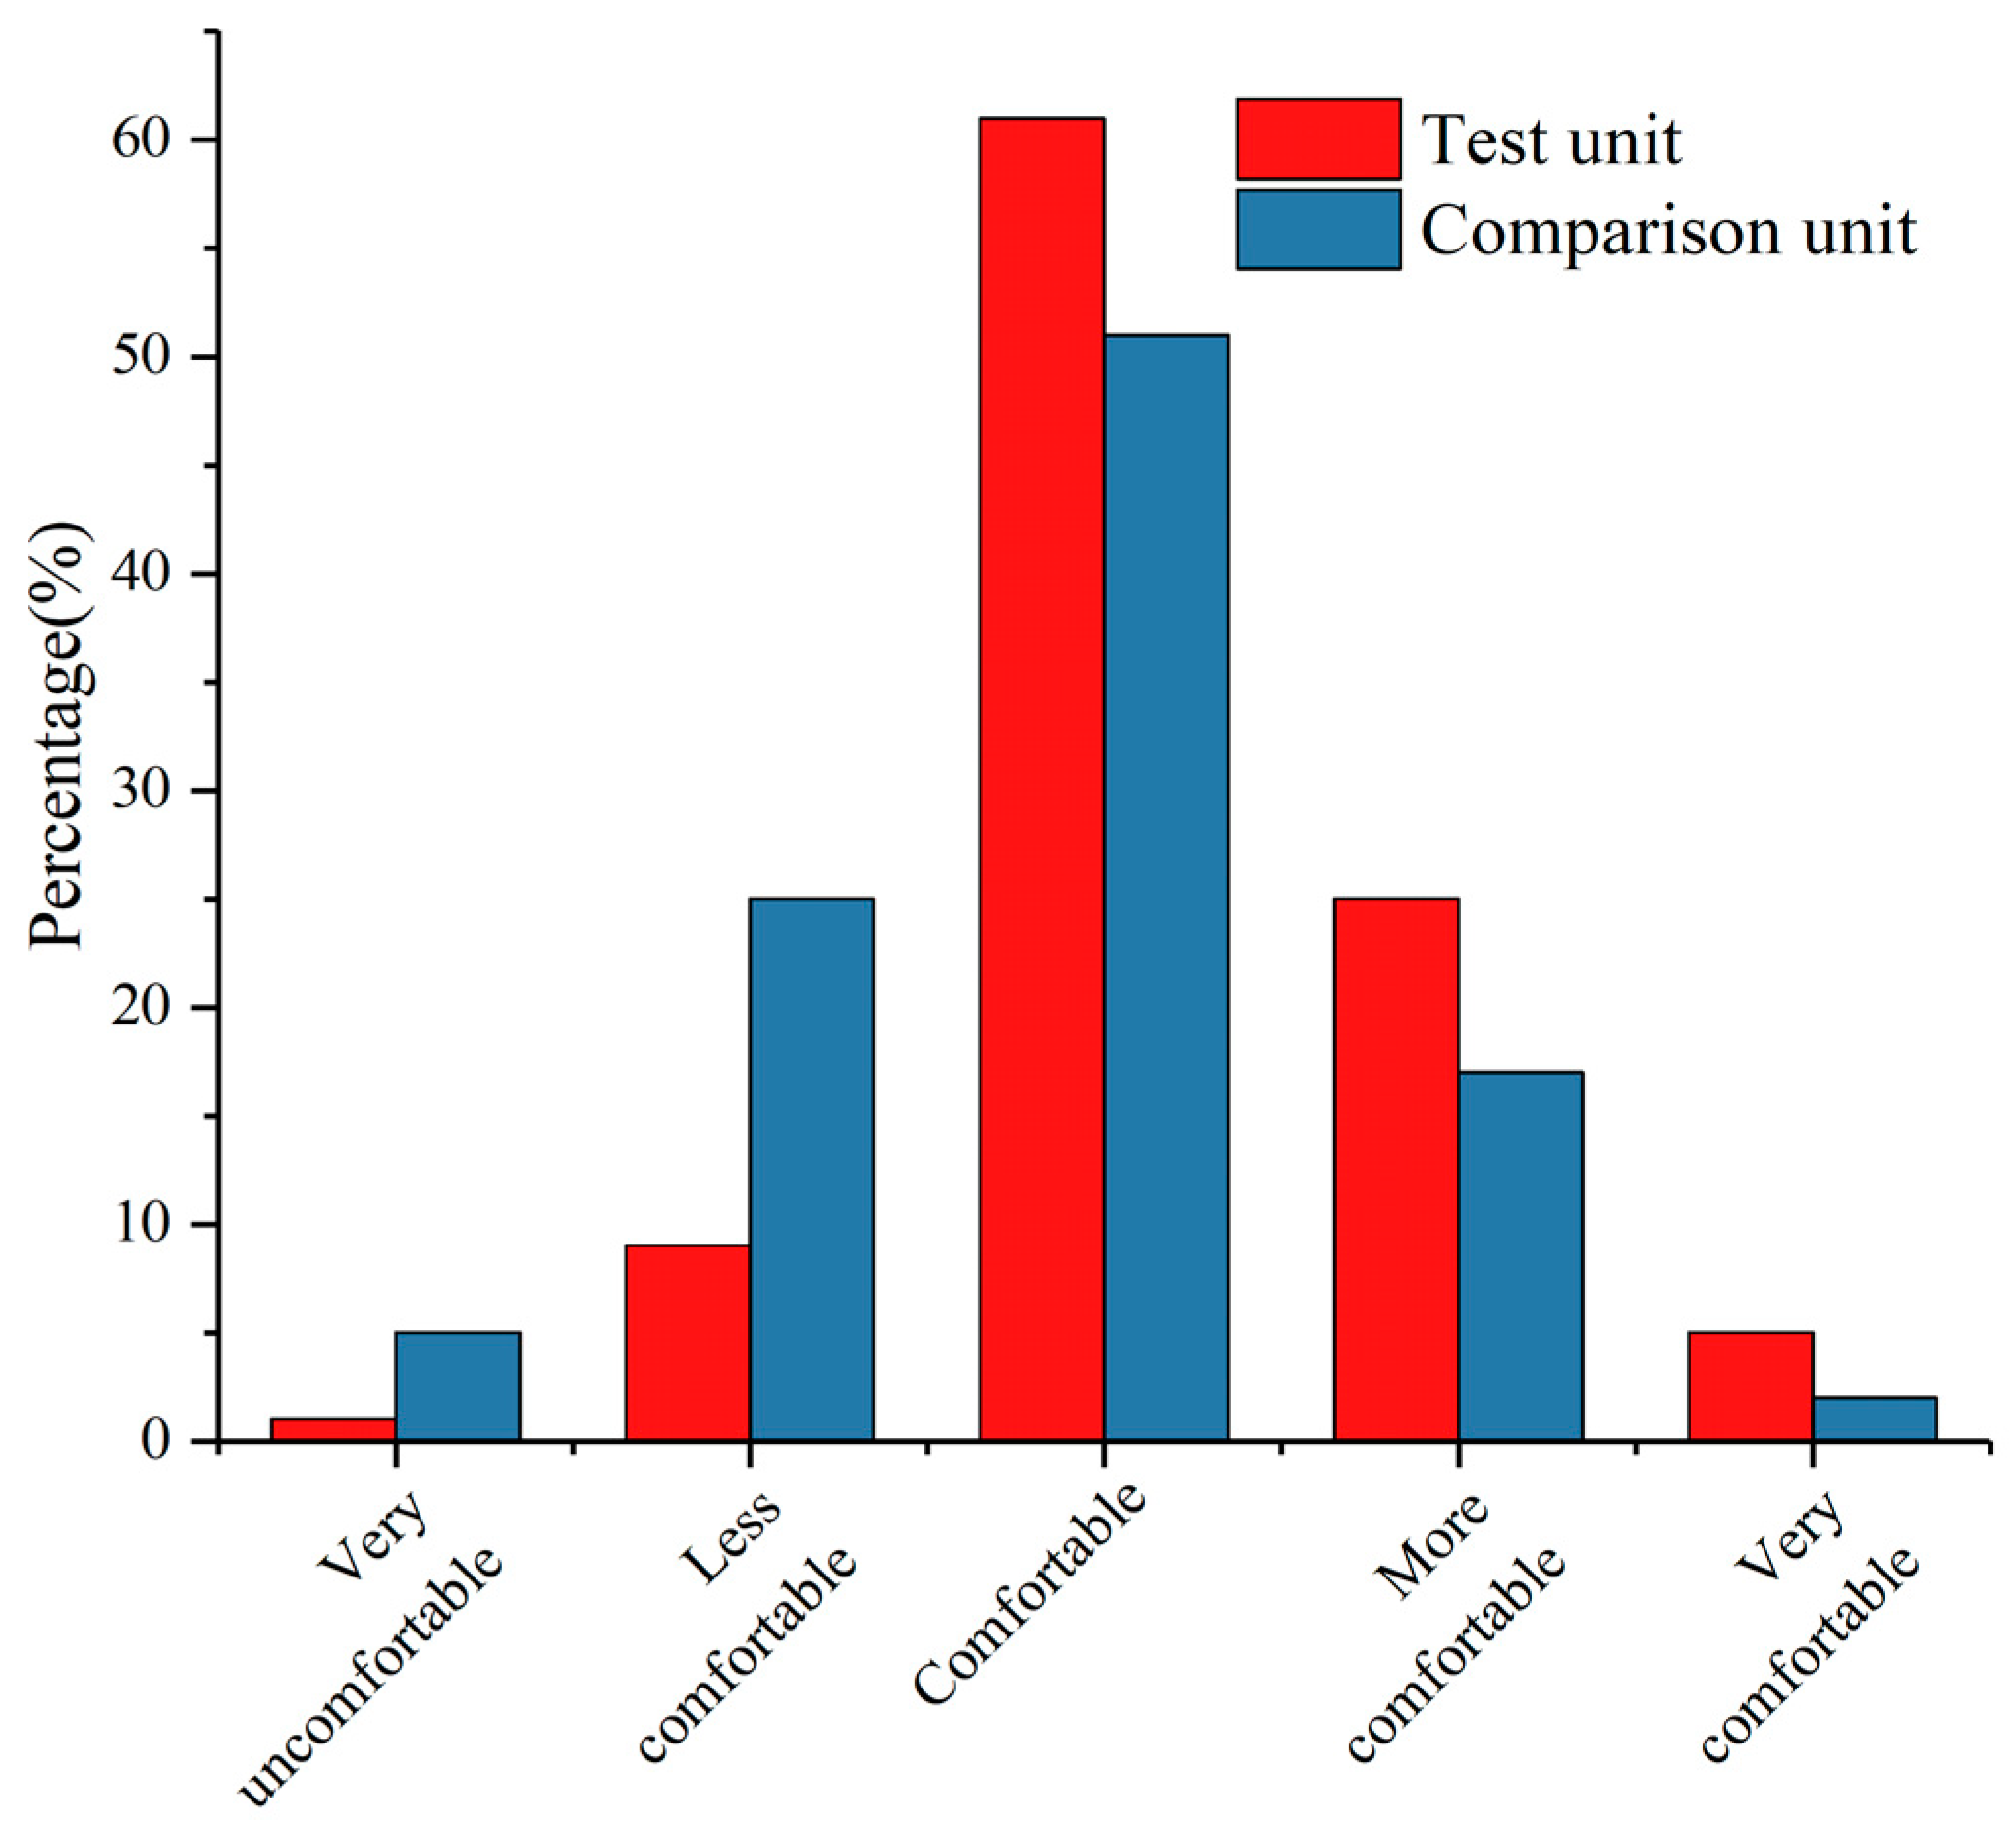
According to the results of the subjective investigation of the indoor light environment in the test unit and comparison unit, the subjective analysis results of indoor light environment are shown in Figure 12, which include the subjective perception of indoor illumination, indoor light uniformity, and indoor glare. The results showed that nearly 90% of people thought that the light environment in the unit equipped with the STPV window was more acceptable than 75% of the unit equipped with the conventional window. Thus, once combined with previous light performance tests [9], STPV windows can improve the indoor light environment. Also, the results of other indoor environmental parameters, such as hot and wet environment, acoustic environment, and indoor air quality of both units, were acceptable to more than 60% similarly for both units.
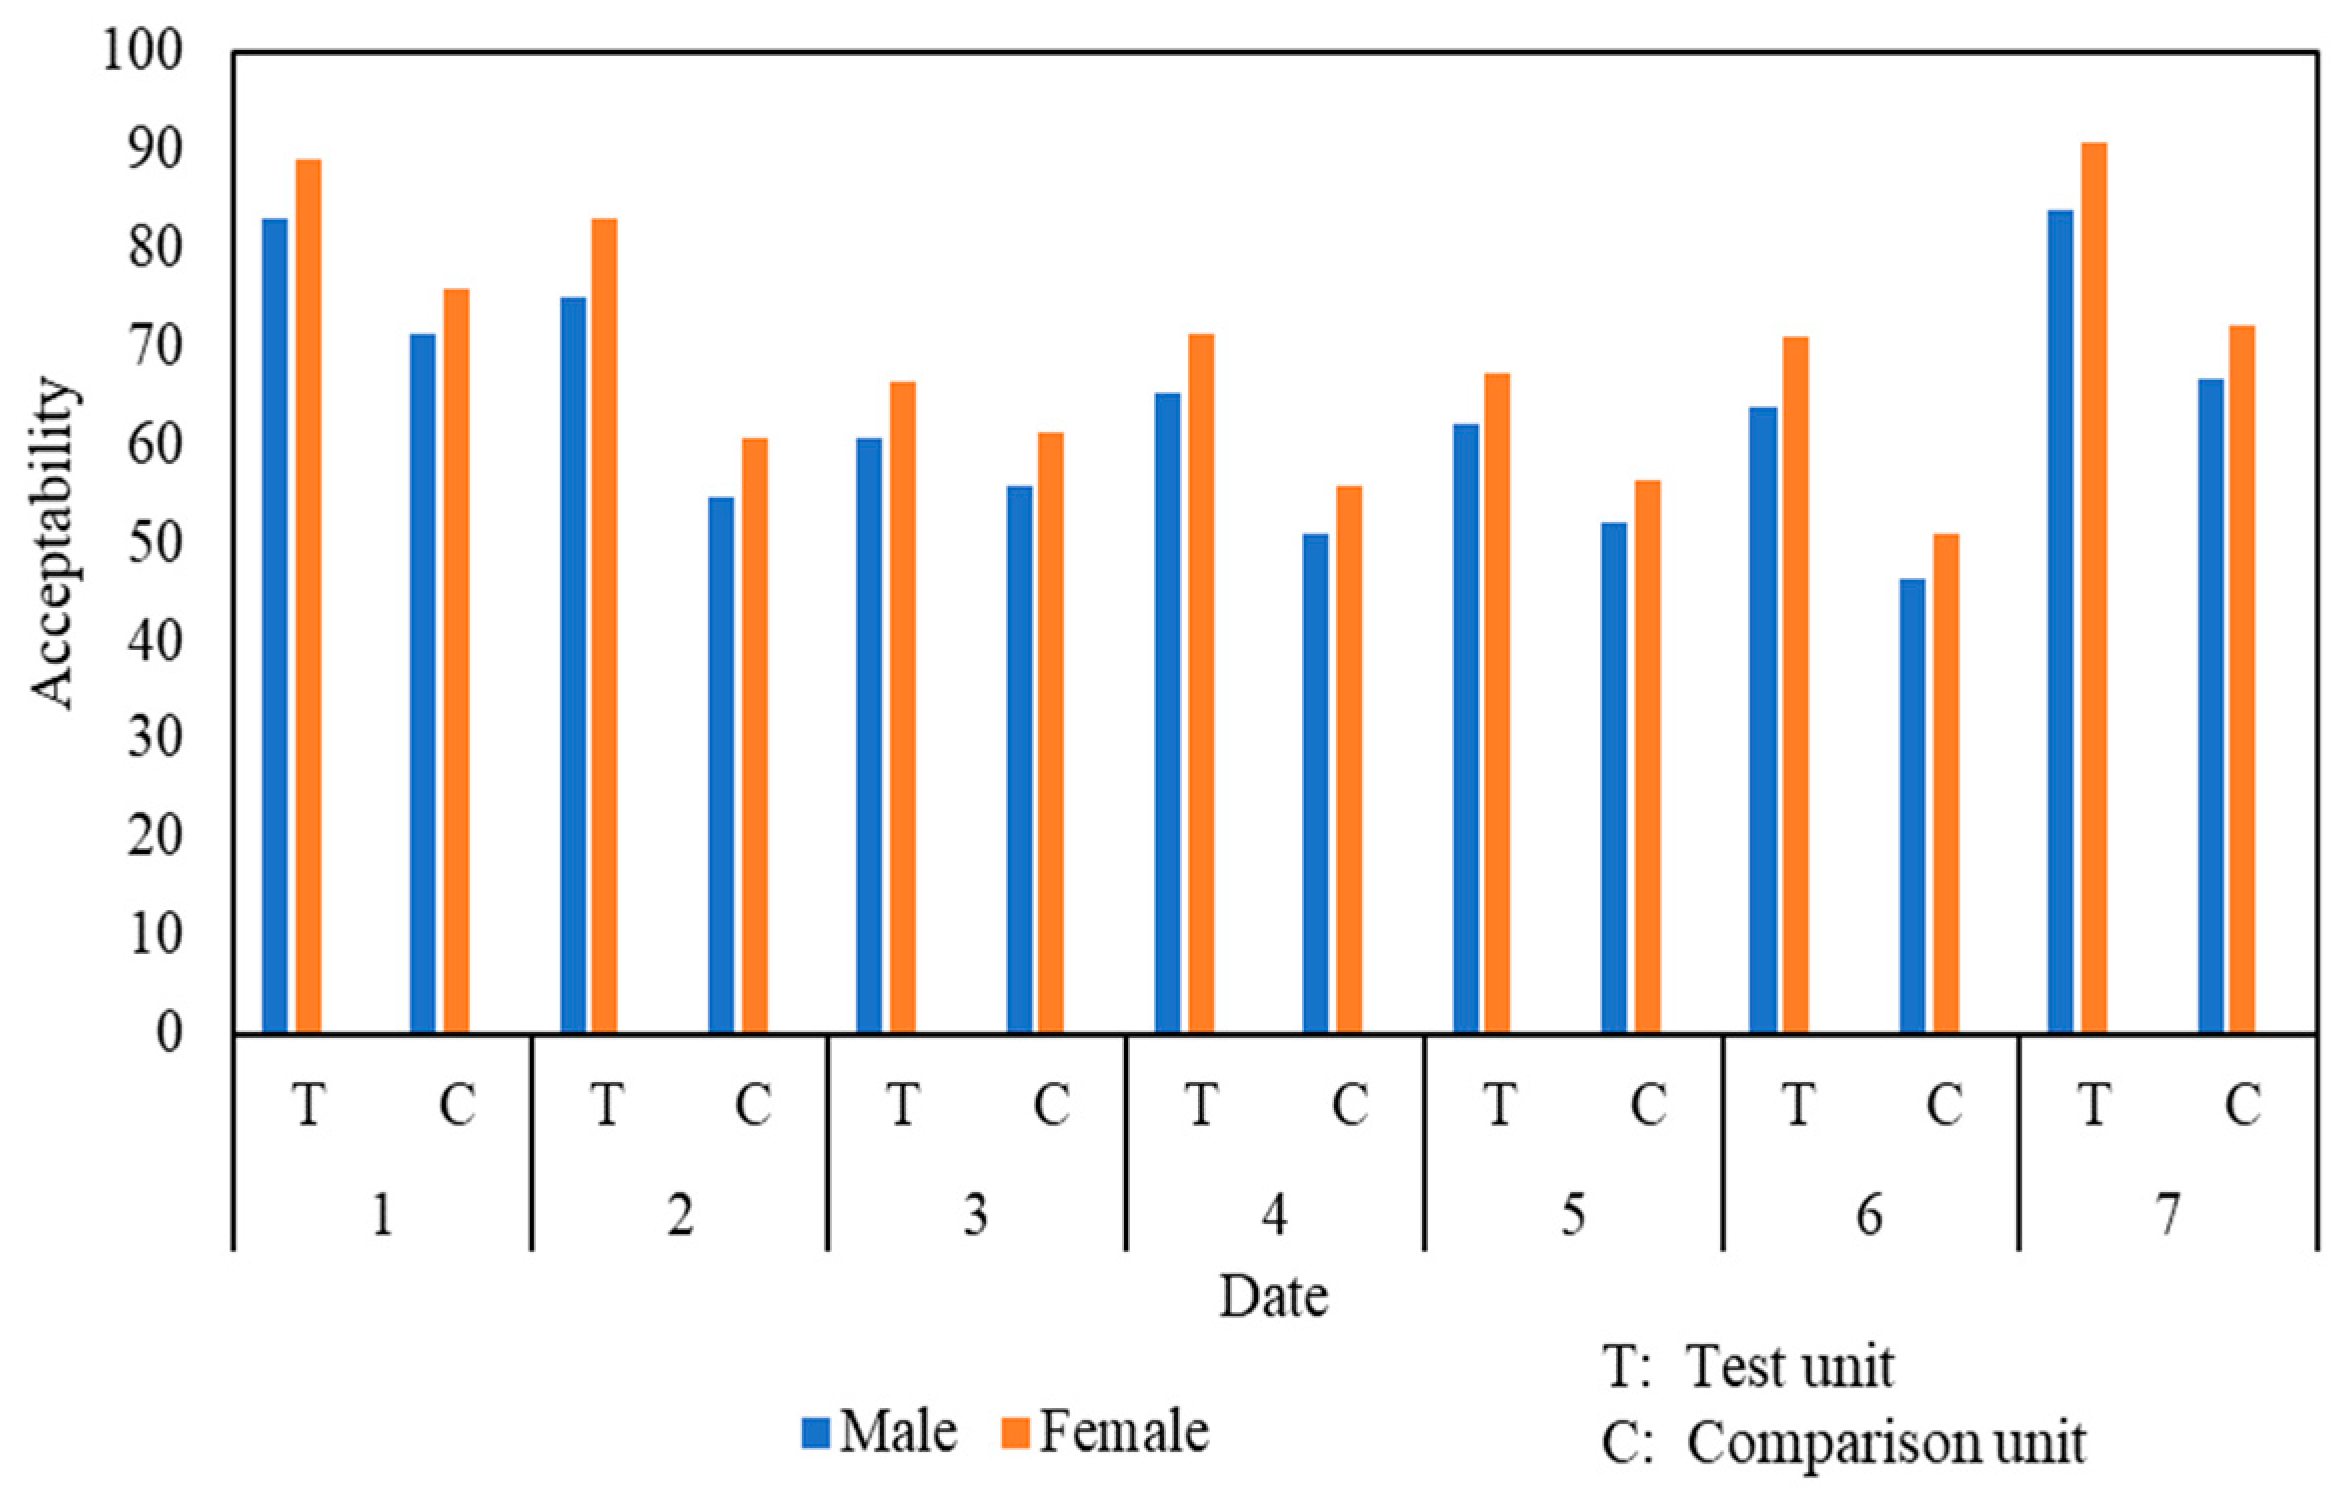
Assessment of the total acceptability rating, concerning the indoor thermal air of the test unit and the comparison unit, was carried out. The overall acceptability level related to indoor thermodynamics compared the environment of the laboratory with that of male and female respondents. It was observed in Figure 13 that the thermal responses for males showed different indoor thermal assessments in comparison to females. About 5% of the different responses indicated that females were more sensitive to deviations compared to males. It was surveyed that as the solar radiation increased, the percentage of acceptability of thermal comfort reduced in both genders. In addition, while considering the overall acceptability of humidity in all operations, the proportion of female subjects was slightly lower in comparison to male respondents. This resulted from low metabolic rates, low skin temperatures, and loss of evaporation in female respondents compared with male respondents that were interviewed.
4. Conclusions
As per our experiments, it was discovered that during summer STPV windows can potentially improve the thermal temperature and lighting comfort, and potentially reduce air-conditioning load. The indoor thermal comfort of the STPV windows were, thus, tested during summer in Chengdu, China. The conclusions, in accordance with the test results and questionnaires, were as follows:
- It was found that during the test, the power conversion efficiency of STPV window was 5.6%, and the maximum power generated was 85 W with a radiation of 400 W/m2. The panel worked normally, even with low irradiance on cloudy days, due to the absorption of weak light.
- In comparison, the inner surface temperature of the single-layer was 4 °C higher than that of double-layer windows. Thus, the higher inner surface temperature generated can bring about a negative effect on thermal comfort during summer. STPV windows had better thermal insulation effect due to the presence of the air layer to block heat transfer. This in turn increased the indoor thermal comfort of the unit installed with double-layer STPV window.
- While considering semi-transparent windows, the indoor air temperature and radiant temperature in the unit with the conventional window were higher than the unit with the STPV window, and the maximum difference in air temperature was around 5 °C between the test unit and comparison unit. Thereby, the presence of this shielding effect represented a more comfortable environment in the test unit with the STPV window than that in the comparison unit during summer.
- The PPD value of the test unit equipped with the STPV window was better than that of the comparison unit equipped with the conventional window. On a typical sunny day, the PMV value ranged from 0.2–1.3 in the test unit, while that of the comparison unit was 0.7–2.0. On the basis of the test results it was found that STPV windows effectively prevented solar radiation from entering the room and reduced the indoor radiation temperature. However, the difference was not significant on cloudy days. It is noteworthy that the thermal sensation between the foot and the head was noted to be almost the same, indicating that the indoor temperature distribution was uniform.
- It was evident from the questionnaire results that the thermal sensation of the test unit with the STPV window was better than that of the comparison unit with the conventional window. These findings are in concurrence with the test results. Upon combining thermal, lighting, acoustic, and other environmental comfort scores, the acceptability of the test unit with the STPV window was 60–91%, while that of the comparison unit with the conventional window was 54–75%. The thermal sensation difference between males and females was found to be around 5%, which can be accounted for due to the differences of heat resistance in the skin and the metabolic differences between the two sexes.
Author Contributions
Conceptualization, and Writing-Original Draft Preparation, H.T.; Writing-Review and Editing, W.Z.; Project Administration, L.X., Methodology, Z.N. and Q.W.; Experiment, W.W., X.W. and M.C.
Funding
This research was funded by National Key Research and Development Program of China (No. 2016YFE0124500), Science & Technology Department Foundation of Chengdu City, China (2017-GH02-00006-HZ) and Science & Technology Department of Sichuan Province (2019YFH0184).
Conflicts of Interest
The authors declare no conflict of interest.
References
- Tang, Y. The Integration of Photovoltaic Building Ushered in the Development of Spring; Urban Housing: Zhuhai, China, 2009; pp. 56–59. [Google Scholar]
- Li, S.; Mei, J.; Yao, Y. Research Status and Development Trend of Solar Photovoltaic Building Integration. Sichuan Archit. 2013, 33, 38–41. [Google Scholar]
- Xiao, Y.; Li, D. Application status and development trend of solar photovoltaic building integration. Energy Sav. 2010, 29, 12–18. [Google Scholar]
- Yoon, J.-H.; Shim, S.-R.; An, Y.S.; Lee, K.H. An experimental study on the annual surface temperature characteristics of amorphous silicon BIPV window. Energy Build. 2013, 62, 166–175. [Google Scholar] [CrossRef]
- Park, K.E.; Kang, G.H.; Kim, H.I. Analysis of thermal and electrical performance of semi-transparent photovoltaic (PV) module. Energy 2010, 35, 2681–2687. [Google Scholar] [CrossRef]
- Chow, T.-T.; Li, C.; Lin, Z. Innovative solar windows for cooling-demand climate. Sol. Energy Mater. Sol. Cells 2010, 94, 212–220. [Google Scholar] [CrossRef]
- Martín-Chivelet, N.; Gutiérrez, J.C.; Alonso-Abella, M.; Chenlo, F.; Cuenca, J. Building Retrofit with Photovoltaics: Construction and Performance of a BIPV Ventilated Façade. Energies 2018, 11, 1719. [Google Scholar] [CrossRef]
- Cornaro, C.; Ludovica, R.; Marco, P. Thermal and Electrical Characterization of a Semi-Transparent Dye-Sensitized Photovoltaic Module under Real Operating Conditions. Energies 2018, 11, 155. [Google Scholar] [CrossRef]
- Wang, W.; Zhang, W.; Xie, L. Experimental Assessment of the Energy Performance of a Double-Skin Semi-Transparent PV Window in the Hot-Summer and Cold-Winter Zone of China. Energies 2018, 11, 1700. [Google Scholar] [CrossRef]
- Khedari, J.; Waewsak, J.; Supheng, W. Experimental investigation of performance of a multi-purpose PV-slat window. Sol. Energy Mater. Sol. Cells 2004, 82, 431–445. [Google Scholar] [CrossRef]
- Khalesi, J.; Goudarzi, N. Thermal Comfort in a Climate-Adaptive Building with Smart Windows and Different Outlet Opening Locations. Sustain. Cities Soc. 2018, 1, 1–33. [Google Scholar]
- Liu, M.; Heiselberg, P.K.; Antonov, Y.I. Parametric analysis on the heat transfer, daylight and thermal comfort for a sustainable roof window with triple glazing and external shutter. Energy Build. 2019, 183, 209–221. [Google Scholar] [CrossRef]
- Hweij, W.A.; Al Touma, A.; Ghali, K. Evaporatively-cooled window driven by solar chimney to improve energy efficiency and thermal comfort in dry desert climate. Energy Build. 2017, 139, 755–761. [Google Scholar] [CrossRef]
- Zhang, W.; Liua, F. Improved thermal comfort modeling for smart buildings: A data analytics study. Electr. Power Energy Syst. 2018, 103, 634–643. [Google Scholar] [CrossRef]
- Zhang, H.; Yang, R. The CPMV index for evaluating indoor thermal comfort in buildings with solar radiation. Build. Environ. 2018, 134, 1–9. [Google Scholar] [CrossRef]
- Stazi, F.; Naspi, F.; Ulpiani, G. Indoor air quality and thermal comfort optimization in classrooms developing an automatic system for windows opening and closing. Energy Build. 2017, 139, 732–746. [Google Scholar] [CrossRef]
- Evaluation Method of Indoor Thermal Comfort in China GB T33658-2017; Standardization Administration: Beijing, China, 2017; pp. 11–17.
- Code for Thermal Design of Civil Building ‘GB-50176’; Standardization Administration: Beijing, China, 2017; pp. 13–19.
- Standard of Test Methods for Thermal Environment of Building JGJ/T 347-2014; Standardization Administration: Beijing, China, 2014; pp. 7–14.
- Standard of Method for Evaluating Humid and Thermal Environment in China GB/T50785-2012; Standardization Administration: Beijing, China, 2012; pp. 20–23.
Figure 1.
(a) Amorphous solar cells (a-Si), (b) crystalline silicon solar cells (c-Si), and (c) concentrator photovoltaic (CPV) cell.
Figure 1.
(a) Amorphous solar cells (a-Si), (b) crystalline silicon solar cells (c-Si), and (c) concentrator photovoltaic (CPV) cell.

Figure 2.
Test unit.

Figure 3.
Schematic diagram of PV window: (a) single-layer, (b) double-layer.

Figure 4.
Test equipment. (a) Outdoor environmental and power generation test equipment. (b) Indoor environment test equipment.
Figure 4.
Test equipment. (a) Outdoor environmental and power generation test equipment. (b) Indoor environment test equipment.


Figure 5.
Placement diagram of the test equipment.

Figure 6.
Infrared thermography of a semi-transparent PV (STPV) window: (a) single-layer, (b) double-layer. Visible light of the STPV window: (c) single-layer, (d) double-layer.
Figure 6.
Infrared thermography of a semi-transparent PV (STPV) window: (a) single-layer, (b) double-layer. Visible light of the STPV window: (c) single-layer, (d) double-layer.

Figure 7.
Power generation and radiation of STPV windows.

Figure 8.
Outdoor temperature and indoor temperature.

Figure 9.
Temperature from 0.5 m to 2 m in the room with STPV window.

Figure 10.
Mean predicted mean value (PMV) versus predicted percentage dissatisfied (PPD) for the STPV window and conventional window: (a) sunny day, (b) cloudy day.
Figure 10.
Mean predicted mean value (PMV) versus predicted percentage dissatisfied (PPD) for the STPV window and conventional window: (a) sunny day, (b) cloudy day.

Figure 11.
PMV in the (a) test unit, (b) comparison unit.


Figure 12.
Results of the subjective questionnaire survey on the indoor light environment.

Figure 13.
Overall acceptability rating of the two units.


Table 1.
Physical and electrical properties.
| a. Electrical properties of a-Si | |
| PV module | amorphous silicon |
| Maximum power (W) | 50/m2 |
| PV conversion rate | 6.7% |
| b. Physical properties | |
| Layer | thickness (mm) |
| Glass tempered | 6 |
| Air gap | 9 |
| Single PV glass | 10 |
| c. Other properties | |
| Weight density | 40 kg/m2 |
| Dimension | 1.24 m (L) 0.64 m (W) |
| Visible transmittance | 20% |
Table 2.
Instruments and specifications.
| Equipment | Manufacturer | Function | Accuracy/Sensitivity |
|---|---|---|---|
| Outdoor multi-channel PV | CETC 41 | PV testing | 0 W–10 kW |
| Solar radiation | CETC41 | Testing the solar radiation | 0–1800 W/m2; ±3% |
| Illuminance meter | CETC41 | Lighting test | 0–100,000 lux; 1 lux; ±4% |
| Multi-channel data recorder | CETC41 | Data collector | The minimum resolutions are 1 μV and 0.1 °C |
| Weather station | CETC41 | Testing outdoor environment parameters (air temperature, atmospheric pressure, humility, and air flow) | Temperature: ±0.5 °C, humidity: 0.1%, ±2%; atmospheric pressure: 1 mbar; wind rate: 0.1 m/s; wind direction: ±5% |
| Thermocouples-T | CETC41 | Temperature test | −20 °C–100 °C; 0.1 °C; ±0.5 °C |
| Thermal comfort meter | CETC41 | Testing indoor environment parameters (air temperature, radiant temperature, humility, wind direction, and air flow) | ±0.5% |
Table 3.
Anthropology data of subjects.
| Sex | Sample size | Age | Height (m) | Mass (kg) | BMI a |
|---|---|---|---|---|---|
| Male | 25 | 20.2 ± 0.8 | 1.69 ± 0.12 | 68.3 ± 0.7 | 23.9 ± 1.2 |
| Female | 25 | 19.8 ± 0.7 | 1.58 ± 0.04 | 52.1 ± 1.7 | 20.8 ± 0.1 |
a body mass index (BMI) = mass (kg)/[height (m)]2
Table 4.
Thermal comfort questionnaire.
| Survey No: | Date: | |
|---|---|---|
| Section 1: Individual Detail | ||
| 1. Age: --------------yr. 2. Sex: M F 3. Height: ------------cm 4. Weight: ------------kg | ||
| 5. Nationality: --------------- 6. Native Place: --------------------------- | ||
| Section 2: Thermal Environment | ||
| (1) | What is your feeling about the temperature in this moment? | |
| Cold Cool Slightly Cool Neutral Slightly warm Warm Hot | ||
| (2) | How do you consider the temperature difference between head and ankle? | |
| Completely not acceptable Not acceptable Slightly not acceptable Slightly acceptable Acceptable Perfectly acceptable | ||
| (3) | What is your thermal sensation? | |
| Comfort Light annoyance Annoyance Heavy annoyance | ||
| (4) | Based on your personal preferences, how would you consider the room temperature? | |
| Acceptable Slightly acceptable Not acceptable Slightly not acceptable | ||
| (5) | What is your opinion about this room? | |
| Perfectly tolerable Slightly hard to tolerate Hard to tolerate | ||
| (6) | What is your feeling about the humidity in this moment? | |
| Very dry Moderately dry Slightly dry Neutral Slightly humid | ||
| Section 3: Other environment | ||
| (1) | Subjective feeling of indoor light environment | |
| Very dark Relatively dark Generally bright Relatively bright Very bright | ||
| (2) | What do you think of the indoor light uniformity? | |
| Uneven Slightly uneven Neutral Slightly uniformity Uniformity | ||
| (3) | How’s indoor glare? | |
| Terrible Slightly terrible Normal Good | ||
| (4) | How do you feel about the indoor acoustic environment of the room? | |
| Noisy Slightly noisy Normal Slightly Quiet Quiet | ||
| (5) | How’s feeling about the indoor air quality? | |
| Terrible Slightly terrible Receivability No air quality problem | ||
© 2019 by the authors. Licensee MDPI, Basel, Switzerland. This article is an open access article distributed under the terms and conditions of the Creative Commons Attribution (CC BY) license (http://creativecommons.org/licenses/by/4.0/).
Share and Cite
MDPI and ACS Style
Tian, H.; Zhang, W.; Xie, L.; Ni, Z.; Wei, Q.; Wu, X.; Wang, W.; Chen, M. Thermal Comfort Evaluation of Rooms Installed with STPV Windows. Energies 2019, 12, 808. https://doi.org/10.3390/en12050808
AMA Style
Tian H, Zhang W, Xie L, Ni Z, Wei Q, Wu X, Wang W, Chen M. Thermal Comfort Evaluation of Rooms Installed with STPV Windows. Energies. 2019; 12(5):808. https://doi.org/10.3390/en12050808
Chicago/Turabian StyleTian, Hao, Wei Zhang, Lingzhi Xie, Zhichun Ni, Qingzhu Wei, Xinwen Wu, Wei Wang, and Mo Chen. 2019. "Thermal Comfort Evaluation of Rooms Installed with STPV Windows" Energies 12, no. 5: 808. https://doi.org/10.3390/en12050808
Note that from the first issue of 2016, this journal uses article numbers instead of page numbers. See further details here.