Monitoring of Defects of a Photovoltaic Power Plant Using a Drone
by
 , , ,
, , ,
Martin Libra
1,* ,
,
Milan Daneček
1,
Jan Lešetický
1,
Vladislav Poulek
1,
Jan Sedláček
1 and
Václav Beránek
2 1
Faculty of Engineering; Czech University of Life Sciences Prague, Kamycka 129, 16500 Prague, Czech Republic
2
Solarmonitoring, Ltd., 14700 Prague, Czech Republic
*
Author to whom correspondence should be addressed.
Energies 2019, 12(5), 795; https://doi.org/10.3390/en12050795
Submission received: 9 January 2019
/
Revised: 20 February 2019
/
Accepted: 26 February 2019
/
Published: 27 February 2019
Abstract
:Drone infrared camera monitoring of photovoltaic (PV) power plants allows us to quickly see a large area and to find the worst defects in PV panels, namely cracked PV cells with broken contacts. Roofs are suitable for the integration of PV power plants into buildings. The power plant at the Czech University of Life Sciences in Prague, which was monitored by this method, does not show any significant defects, and the produced electric energy exceeds the expected values. On the contrary, the PV power plant in Ladná has visible defects, and the data monitoring system Solarmon-2.0 also indicates defects. Our newly developed data monitoring system Solarmon-2.0 has been successfully used in 65 PV power plants in the Czech Republic and in many PV power plants throughout the world. Data are archived and interpreted in our dispatch area at the Czech University of Life Sciences in Prague. The monitoring system can report possible failure(s) if the measured amount of energy differs from the expected value(s). The relation of the measured values of PV power to the PV panel temperature is justified, which is consistent with the physical theory of semiconductors.
1. Introduction
In the first decade of this century, a series of on-grid photovoltaic (PV) power plants were installed in the Czech Republic. A similar development of photovoltaics has taken place in a number of other countries. A subsidy policy in the Czech Republic has been supporting the installations of photovoltaic power plants since 2006. However, the prices of PV panels have dropped considerably during 2007 and 2008. This has reduced the cost of PV power plants and accelerated the return of the investment. The boom came in 2008 and 2009. In the end of 2010, 2000 MWp of PV power plants and PV systems were already installed in the Czech Republic. After this, the subsidy policy changed and this boom stopped. To date (2017), the total installed nominal power has only increased marginally. Many of these PV power plants are directly integrated into buildings, including ours, which we will talk about in the following sections. Roofs and building facades are considered to be a very suitable place for the installation of photovoltaics, which is dissimilar to agricultural land. Building-integrated PV power plants are currently being installed more frequently.
PV power plants need high-quality parameters and data monitoring. For example, some papers have discussed the data monitoring of PV power plants, rooftop power plant [1], power plant connected into the single phase grid [2] and review about monitoring [3]. Reference [4] talks about the monitoring of meteorological data and radiation intensity by satellites. We have developed our own data monitoring system Solarmon-2.0 (older version [5] and new version [6]), which is already installed at 65 PV power plants in the Czech Republic and abroad (Romania, Slovakia, and Chile). Data are collected and evaluated continuously, with some results having already been discussed in the above-mentioned paper and in other publications, such as [7] and [8].
PV GIS (Geographical Information System, http://re.jrc.ec.europa.eu/pvgis/apps4/pvest.php#) is an internationally used internet application that can forecast the yield of electricity produced in PV power plants at a given location. If the amount of electricity produced is too low or the decrease in the PV power conversion efficiency of the power plant is too high, this indicates a failure of the PV power plant. Errors may be different, but defects in PV panels are the most common. The most common defects include cracked photovoltaic (PV) cells, broken interconnecting contacts, degradation of encapsulation, and corrosion of outlets into the interconnection box. Broken PV cells and interconnecting contacts are among the worst defects. If the electrical contact is not interrupted over the damaged location, the current flows through the entire PV cell, but it is likely that the interruption will occur later due to temperature changes or mechanical stress due to weathering, cleaning, or animals. If the contact is interrupted, the electrical current flows only across a certain part of the damaged PV cell, which limits the current flowing through serially connected PV cells. This reduces the efficiency of PV energy conversion. In addition, the current flow inside the PV panel causes the variation of current densities inside individual PV cells. The PV cells are non-uniformly heated, and this effect accelerates the degradation of the PV panel. Different temperatures of individual PV cells can be monitored by an infrared camera as the PV cell with a higher current density is warmer. The defects of PV cells also affect the I-V characteristic of the PV panel.
The methods of detecting PV panel defects have been mentioned in our previous paper [9]. There were studied faults of PV systems in other references, for example early degradation of silicon PV modules [10] and statistics of the faults [11]. In particular, it is the detection of thermal inhomogeneity by the infrared camera and the detection of cracks by the method of electroluminescence of PV cells after introducing the electric current into the PV panel from an external source. The most actual method of detecting defects by means of electroluminescence is described in the paper in detail in [12]. In this article, we present the monitoring of a small PV power plant (10 kWp) integrated into the building roof using an infrared camera that is onboard a drone. For example, a similar method was used in the work [13] to fault detection for large photovoltaic systems. We compared the results with the similar monitoring of a larger PV power plant. This method is especially appropriate if the building-integrated PV power plant is not easily accessible. Other PV systems integrated into buildings and data evaluation have also been described in a number of other references. There have been described design optimization of roof integrated PV systems [14], estimation of solar energy potential on building roofs [15], energy analysis of a solar house [16].
2. Materials and Methods
We have already monitored a number of PV power plants using drones. In this article, we present the results from monitoring the PV power plant installed at the Czech University of Life Sciences in Prague with a nominal output of 10 kWp. The power plant is integrated into the roof of the Faculty of Engineering. It was installed in 2015 and connected to our above-mentioned Solarmon monitoring system. The GPS coordinates of the building are 50°7’43" N and 14 22’27" E with an altitude of 280 m. As the monitoring of other PV power plants was similar, we chose the larger PV power plant in Ladná (4 MWp) for the comparison of results.
PV-panels based on the polycrystalline silicon of the German production Renesola, Ltd. were used for the construction of a small PV power plant at the University. The following parameters were used: type JC 260M-24/Bb, maximum power of 260 W, open-circuit voltage of 37.6 V, short-circuit current of 8.95 A, voltage at maximum power of 30.5 V, and current at maximum power of 8.53 A. PV panels are installed on fixed stands with an inclination of 35° and facing almost to the south. A deviation of approximately 10° to the east is given by the orientation of the building. A total of 40 PV panels are divided into two independent sections (each section with 20 PV panels and a rated output power of 5 kWp). In each section, 20 PV panels are connected in series and connected to a three-phase inverter of German production SMA Solar Technology, AG type STP 5000TL-20, which has a maximum DC voltage of 1000 V, maximum direct current of 10 A, alternating voltage of 400 V, and maximum alternating current of 7.3 A.
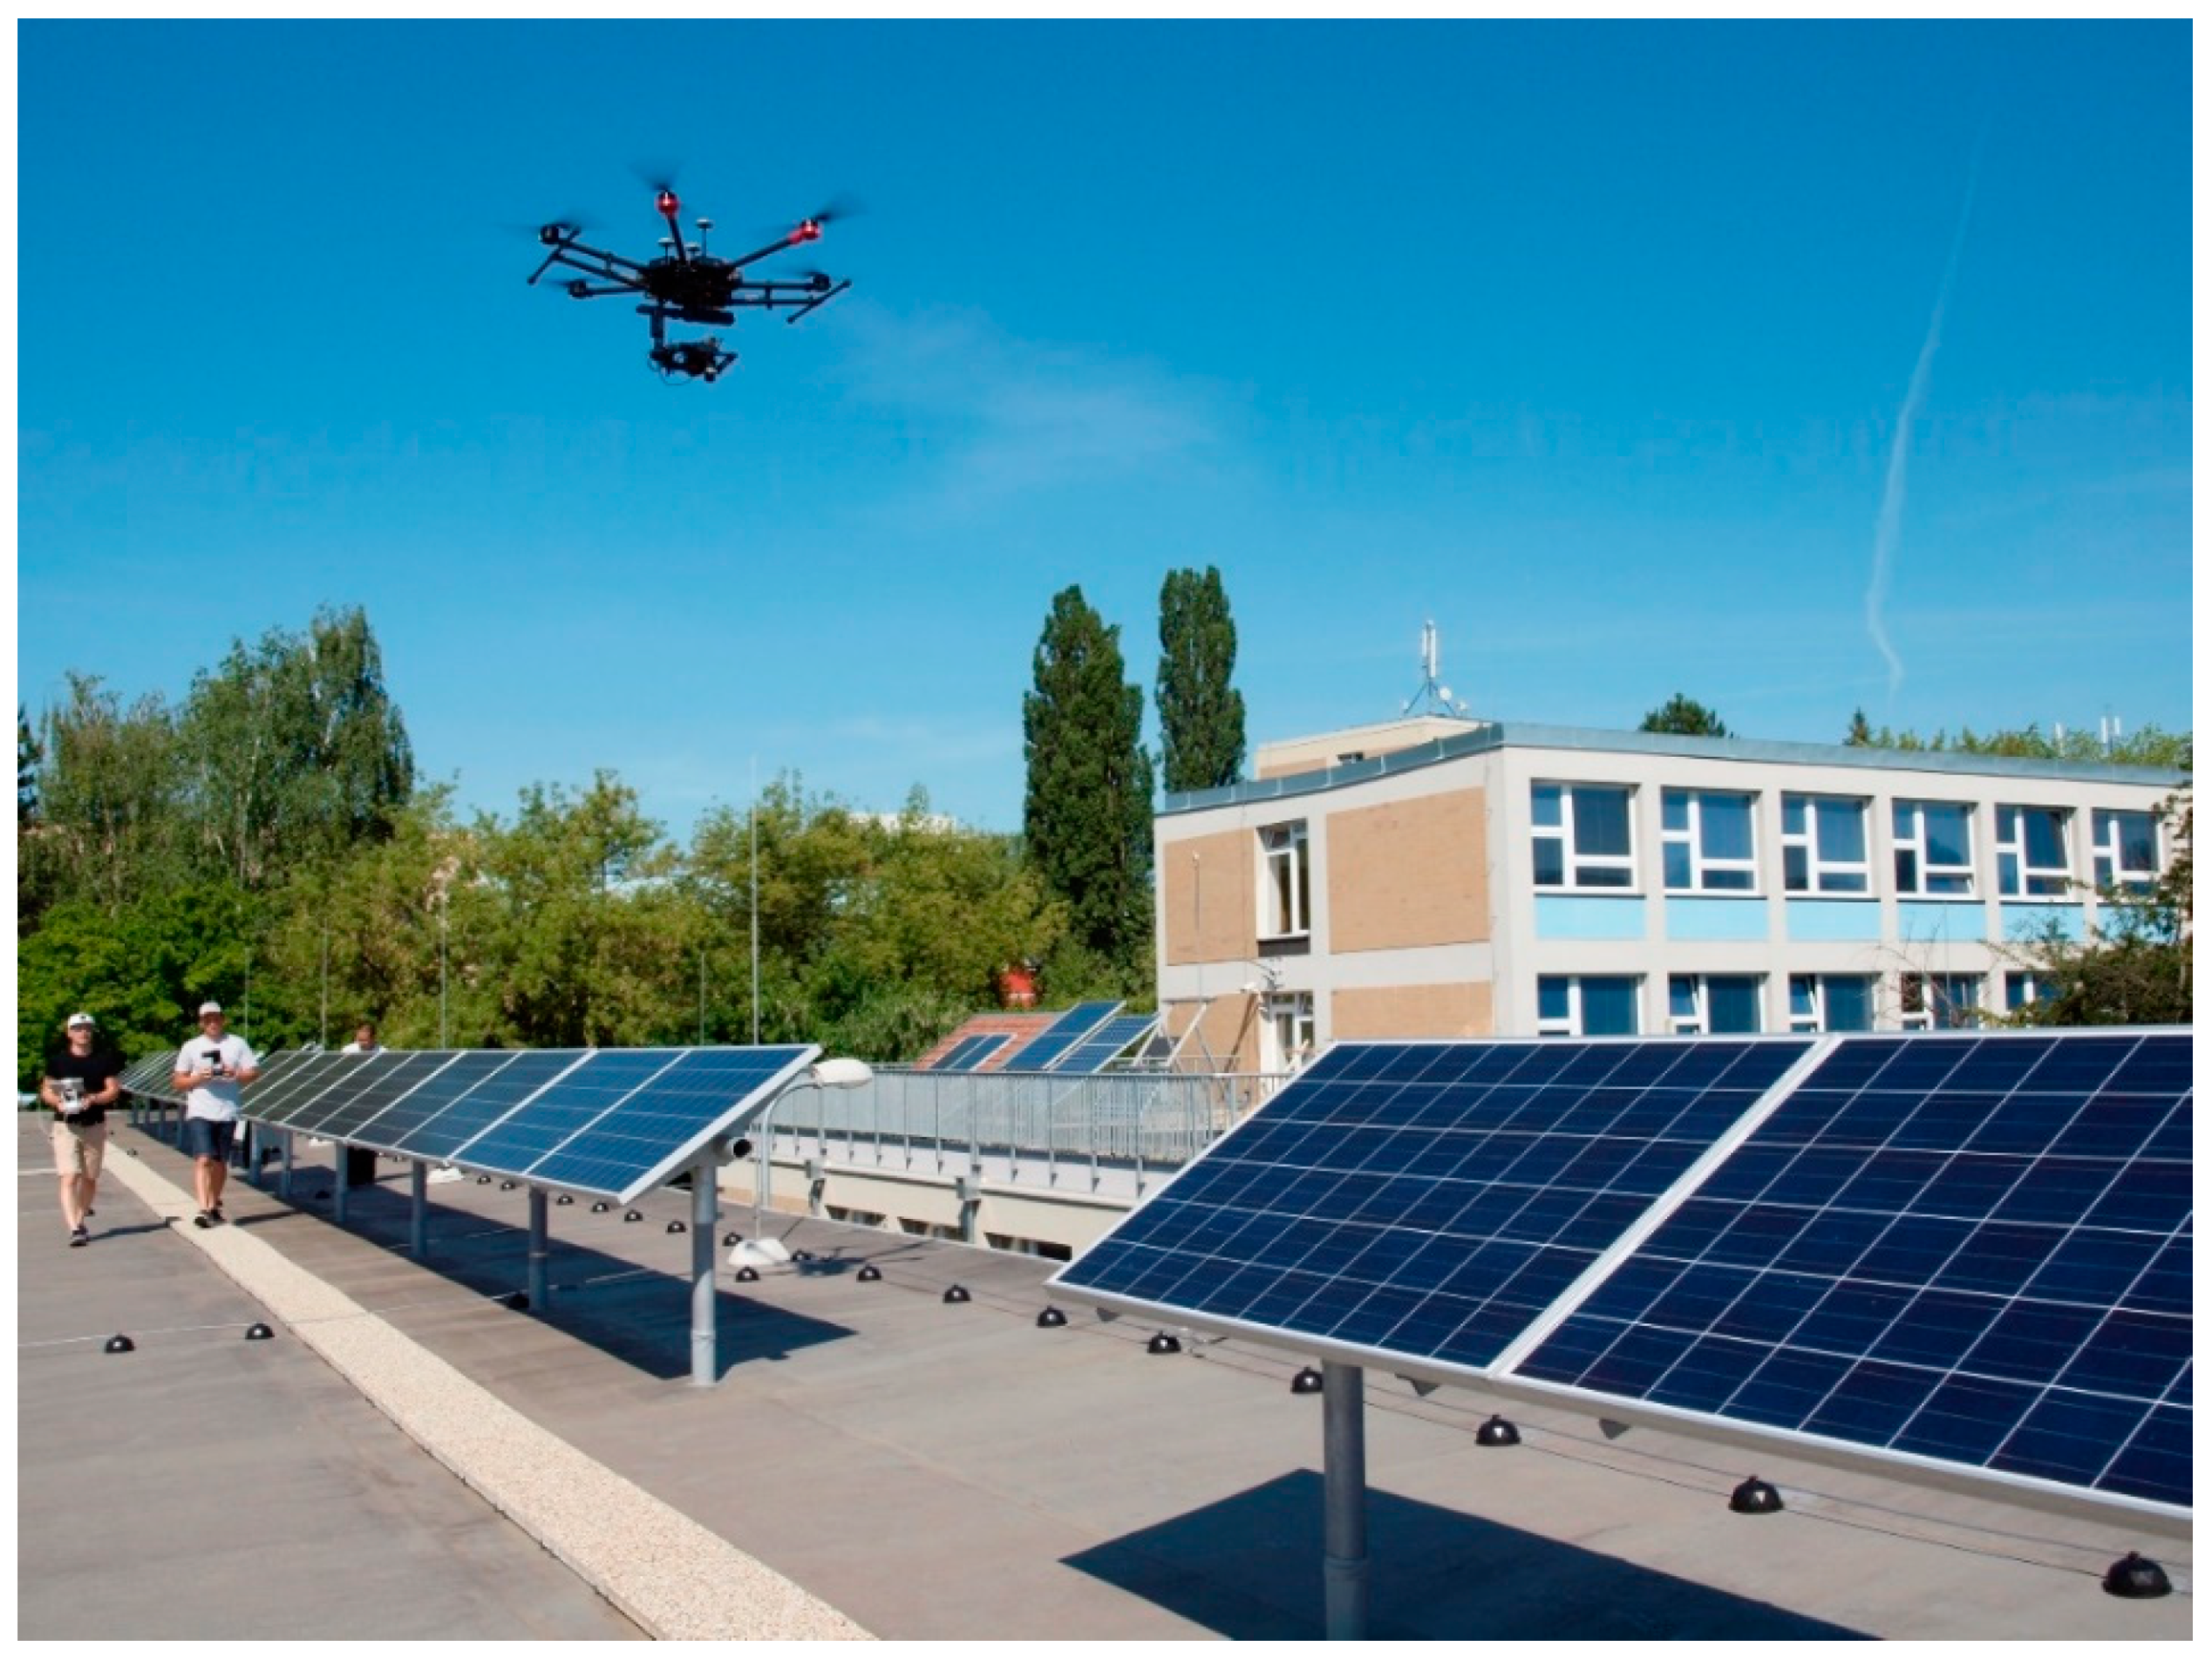
The monitoring of the temperature of PV panels by a drone was conducted in cooperation with Upvision, s.r.o. during a sunny day on 20 June 2017. On this day, the PV power plant had been operating for less than two years. The operational time of the drone is 20 minutes (period between 2 recharging cycles). The drone carried the infra-camera Flir A65. Figure 1 shows the PV power plant and the drone during temperature monitoring. Figure 2 shows the infrared camera in detail. The camera resolution is 640 × 512 pixels and has a thermal sensitivity of 0.05 °C, temperature range of 40–160 °C, and spectral range of 7.5–13 μm. Data processing was conducted using the Flir software (Flier Systems Inc., Nashua, NH 03063, USA).
The values of wind speed and air temperature were obtained from the meteorological station installed in the campus of the Czech University of Life Sciences in Prague.
We used our Solarmon monitoring system to collect data from the PV power plant and compared the results with the prerequisites of the site according to the above-mentioned internationally used PV GIS application.
3. Results and Discussion
With the infrared camera located on the drone, it is relatively simple to see a large area and monitor the differences in temperatures in a relatively short time. In a previous work [17], this method was used to detect the occurrence of animals and look for lost people. If we use this method to monitor the PV power plant, we can only find large forms of PV panel damage, especially cracked PV cells with broken contacts. However, these defects are the worst and they have to be found preferentially.
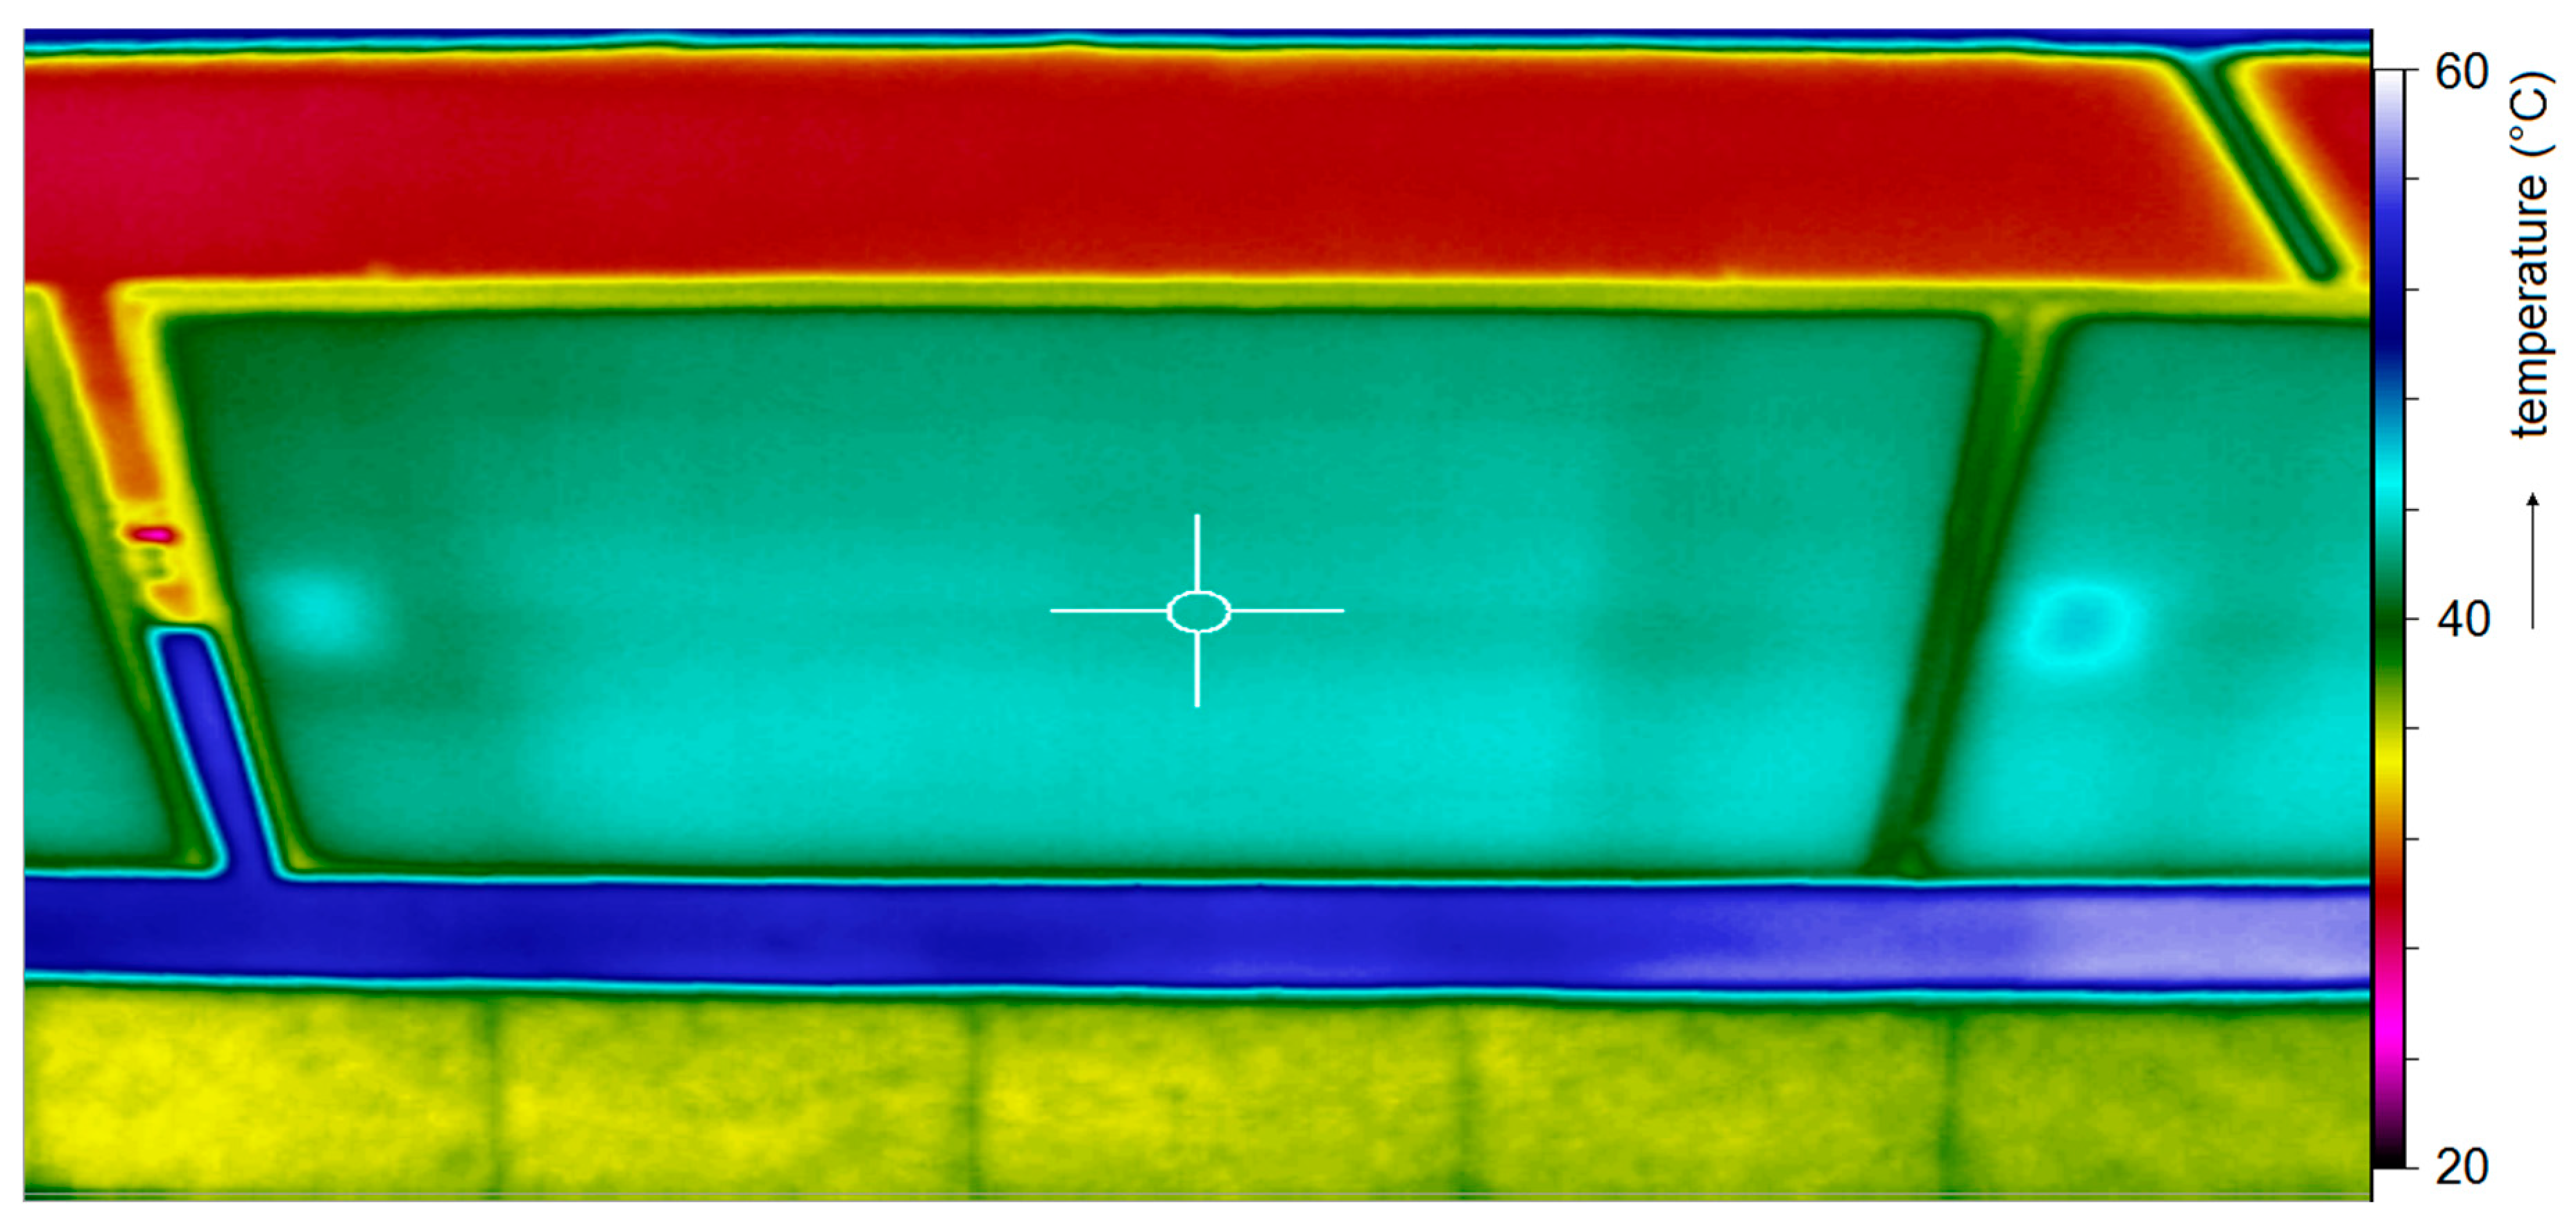
Figure 3 shows a typical PV panel image (bird view) from the infrared camera. The pictures of all other PV panels were very similar during the monitoring. It is evident that the temperature distribution is homogeneous with values around 45 °C throughout the PV panel (at about 10 a.m.). There are no places with significantly increased temperature. The slightly increased temperature on the left side of each PV panel is not a fault, but it corresponds with the location of the box with the contact pins on the back of the panel. In this place, the PV panel is not cooled as much as other locations. This indicates that the PV panels have no apparent significant damage and perfect operation is expected. By comparing Figure 3 with Figure 1, it is apparent that the roofing is warmest at the area of impact of direct solar radiation (about 55 °C) while light tiles reflect more radiation and they are therefore a bit cooler. In the area that is shaded by the PV panels, the roof temperature is about 30 °C.
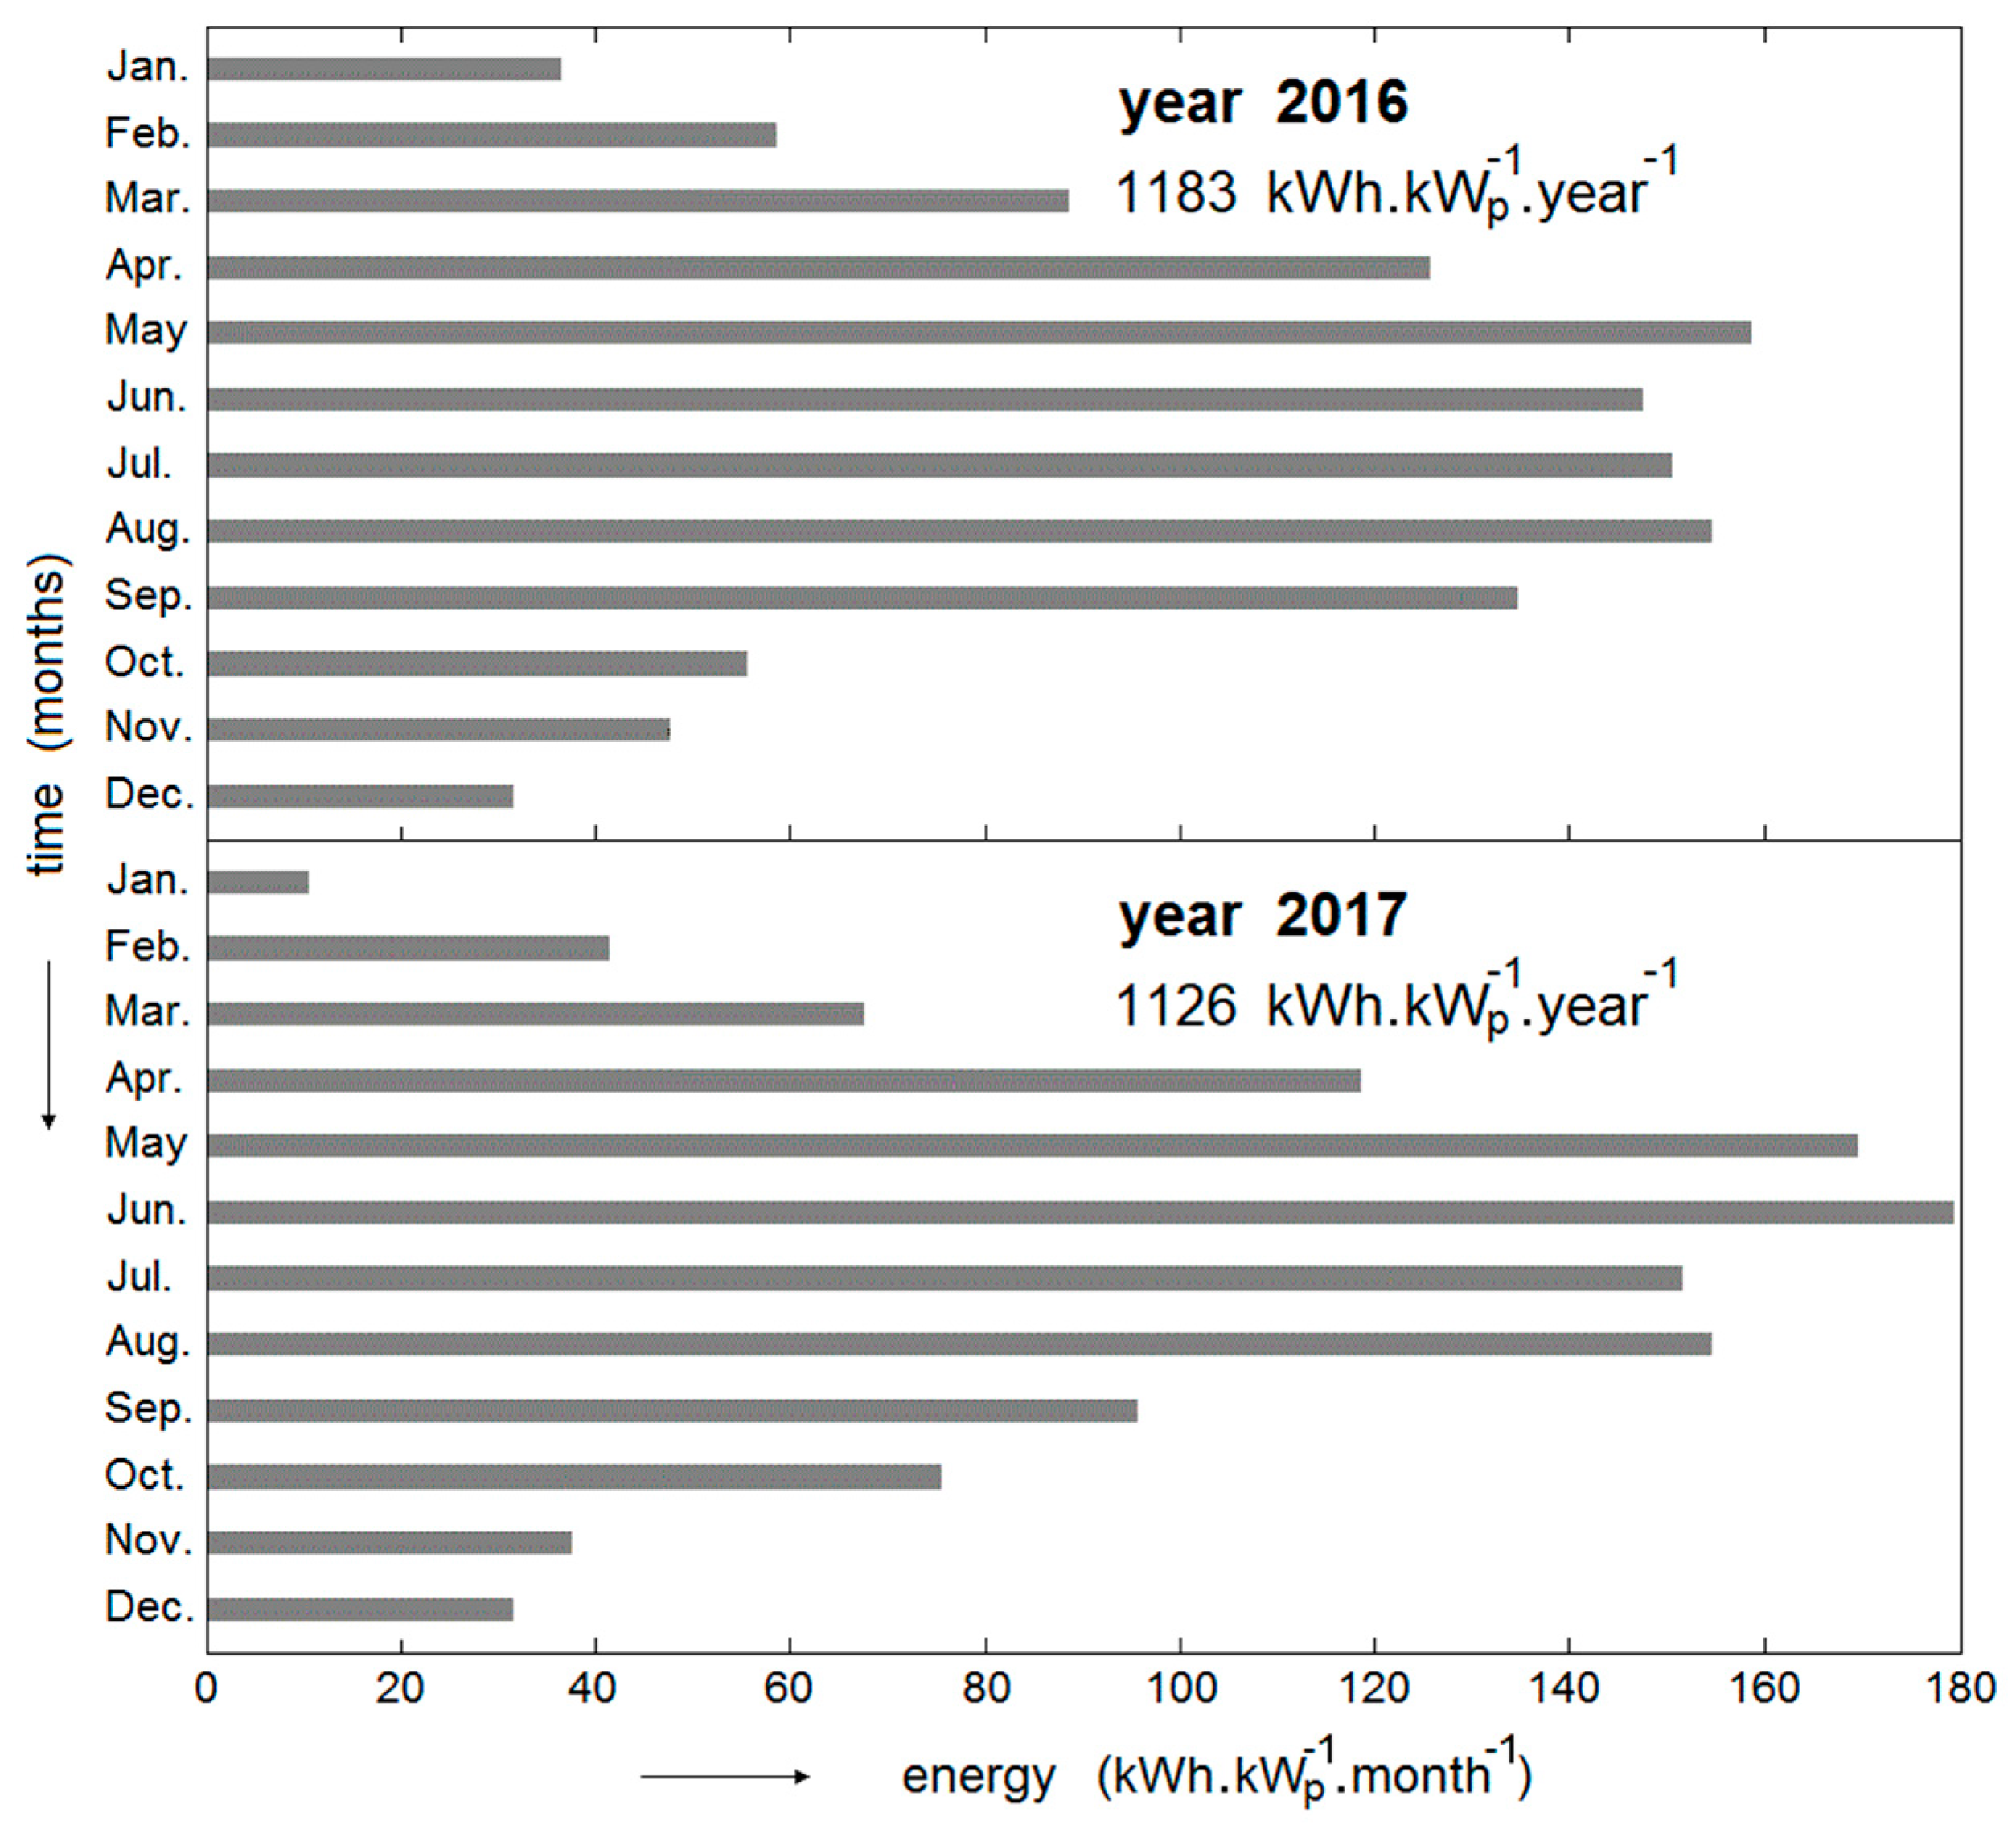
The premise of the flawless operation corresponds to our data analysis from the Solarmon monitoring system. Figure 4 shows the generation of the electric energy in 2016, which is the first year of operation of the PV power plant. The comparison of the measured values with the assumption according to the internationally used PV GIS application [18] shows that the annual electric energy production is actually about 20% higher than the expected value. A more detailed breakdown of monthly values is provided in Table 1. The amount of the produced electric energy exceeds expectations, and it is the most important indicator of the quality of the PV system. All significant defects would immediately lead to a reduction in these values. In this case, our monitoring system would immediately report a suspected malfunction.
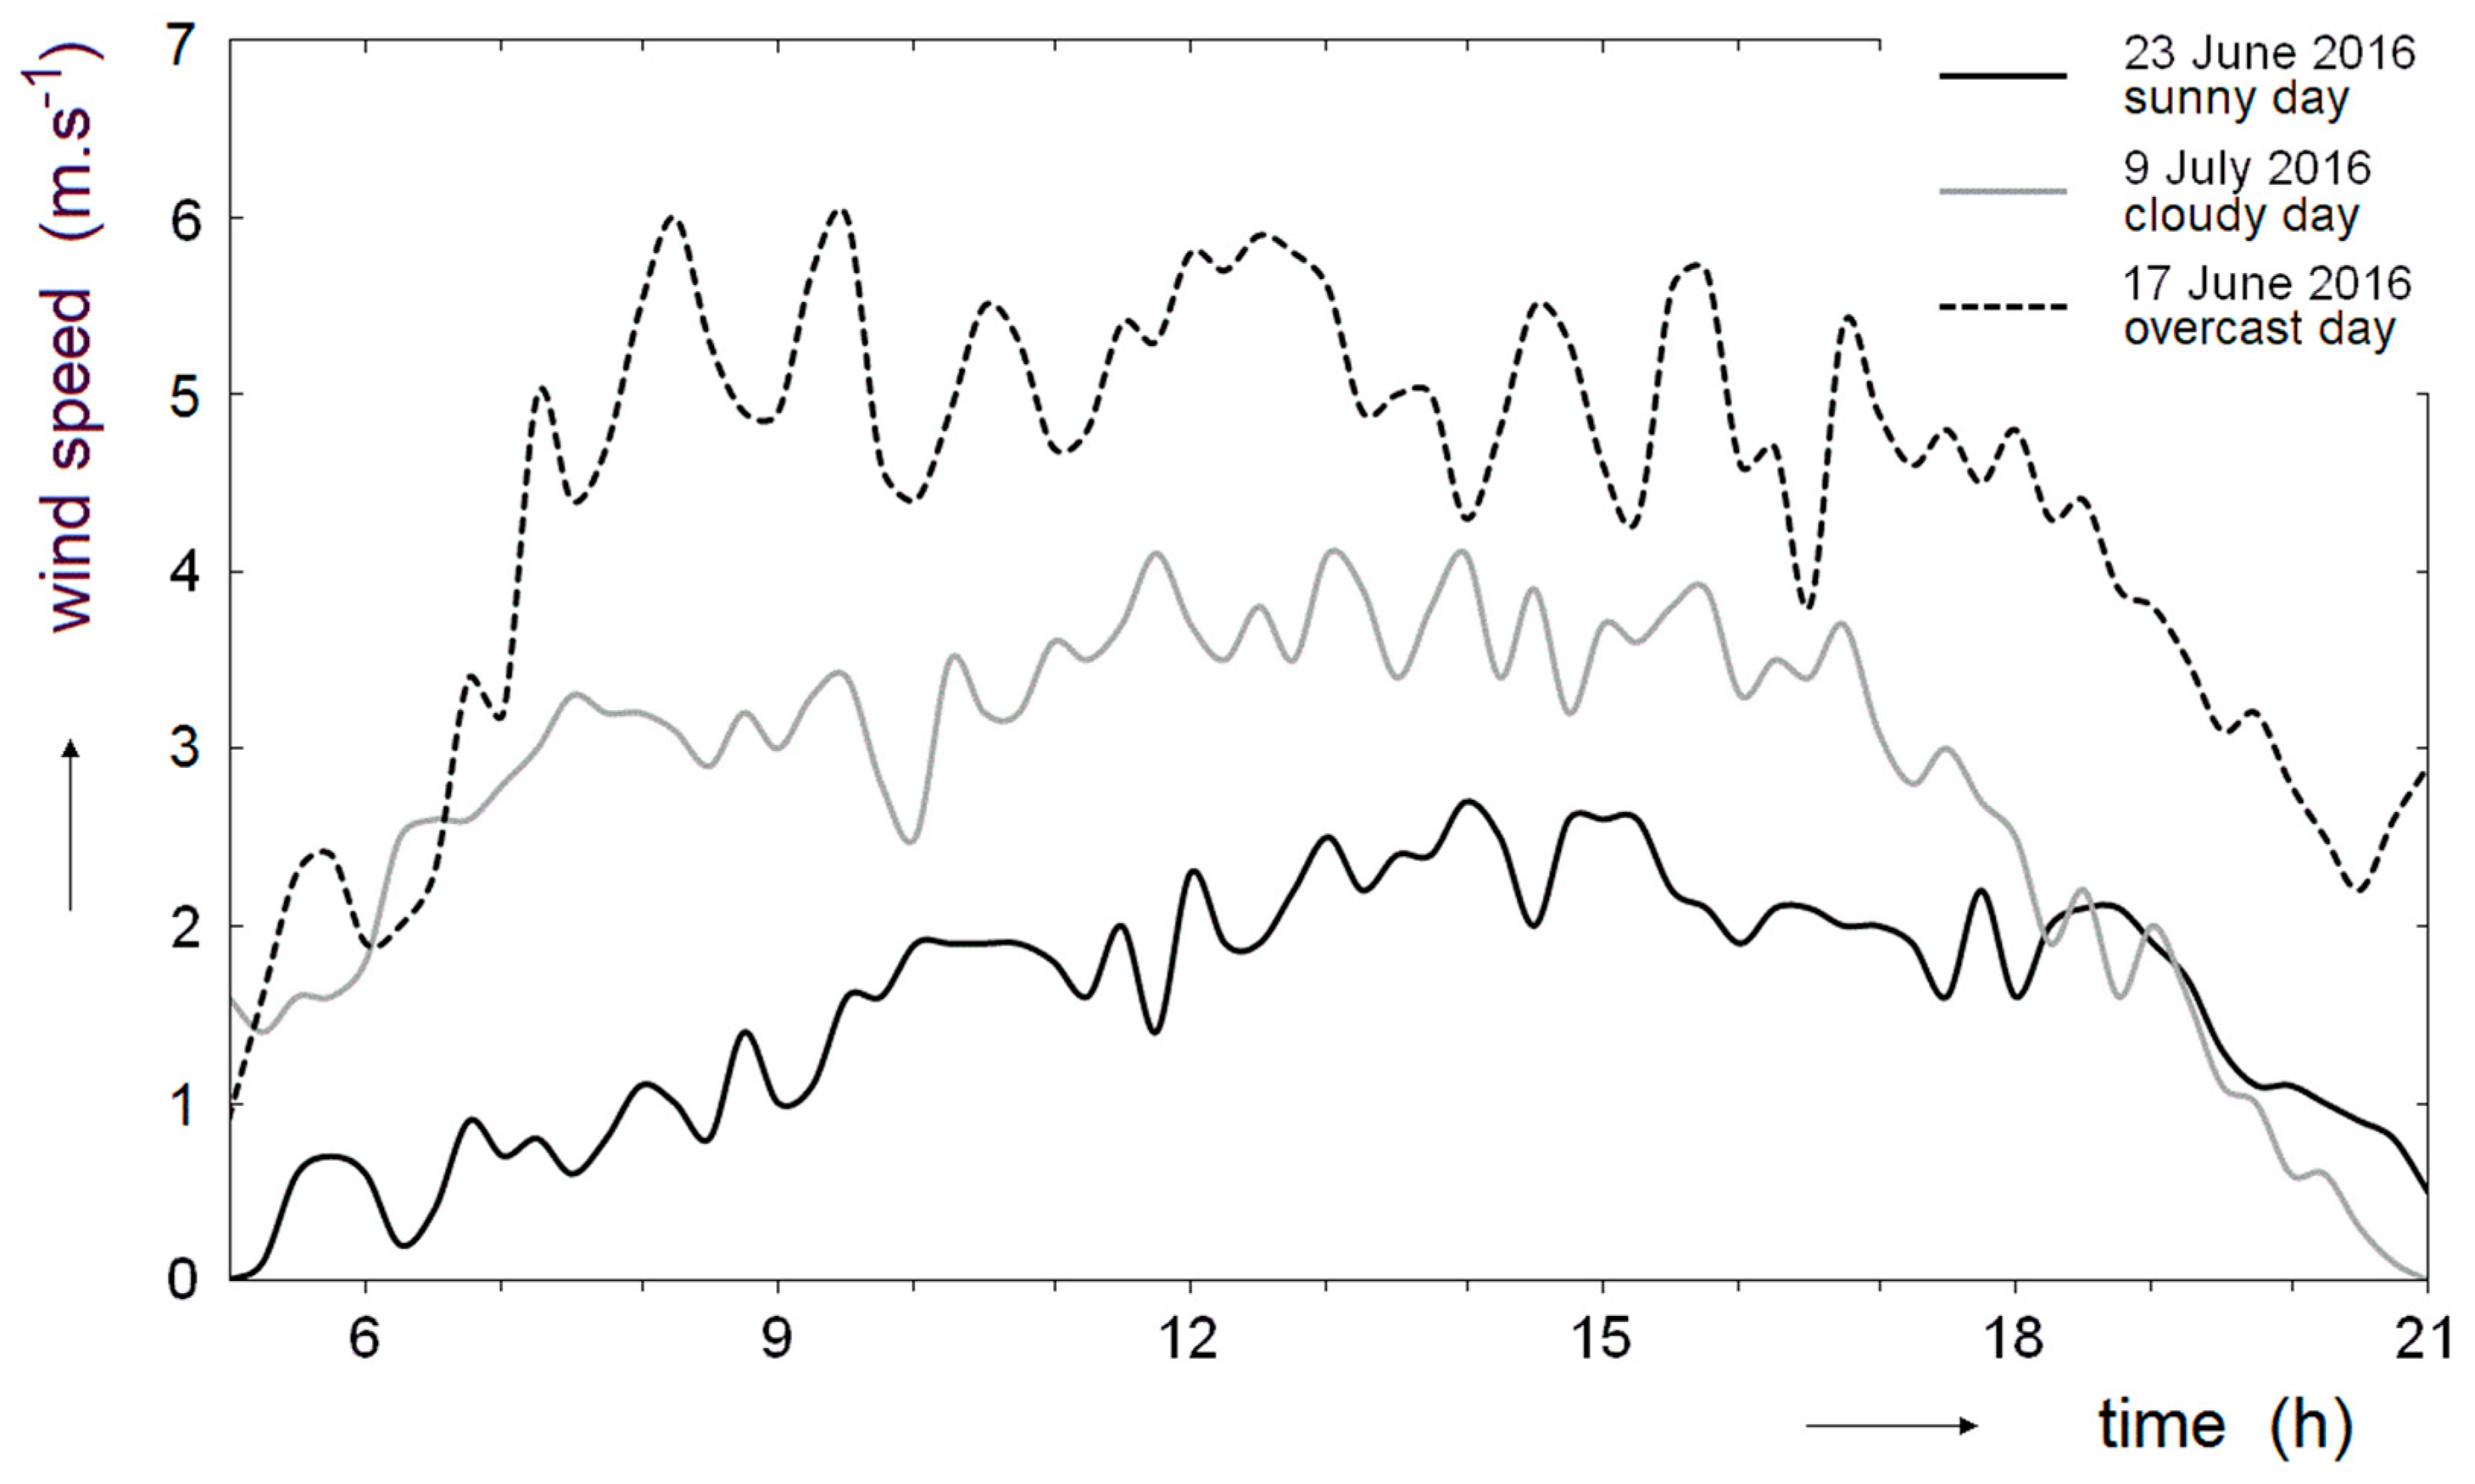
Figure 5 shows the dependence of the instantaneous power relative to time during the three selected days at the turn of the spring and summer of 2016. We chose the sunny, cloudy, and overcast days. The daily values of the electric energy production are also presented and they correspond to the area under the graph as it applies , where E is the generated electric energy, P is the instantaneous power, and t is the time. When comparing the sunny and cloudy days, the local maxima on the instantaneous power curve are higher during a cloudy day. This is related to the lower temperature of the PV panels. With an increase in temperature, the Fermi energy level moves from the edge to the center of the forbidden band in the band structure of energy levels of the semiconductor. This effect is based on the physical theory of solids. This reduces the potential barrier at the PN junction in the semiconductor PV cells. The reduced potential barrier decreases the photovoltaic voltage and consequently the generated power. The theoretical physical justification for this phenomenon was published in a previous work [19]. During a cloudy day, the temperature of the PV panels is lower because most of the energy supply is obtained from direct solar radiation, and during the shading of the sun, this energy does not fall. The resulting temperature is always reliant on the balance between received energy and the energy transmitted by radiation, heat conduction, and air flow. If the sun is suddenly out from behind clouds during the cloudy day, the temperature of the PV panels is lower at the beginning. According to the physical theory, the instantaneous power increases by about 0.5% when the temperature of the PV panels decreases by 1 °C. Figure 5 shows that during the relatively cloudy day of 9 July 2016, the maximum power output after the clouds suddenly disappeared was 15% higher than on a cloudless day (23 June 2016). PV panels were intensively cooled due to the higher wind speed during the cloudy day of 9 July 2016 (see Figure 6) and the air temperature was around 24 °C in the afternoon. On the other hand, the temperature of the air was around 31 °C in the afternoon during the clear skies day of 23 June 2016. The temperature differences in the PV panels between these days reached up to about 30 °C. The PV panels had a temperature of about 25 °C when they were shaded on 9 July. A temperature of about 53 °C had PV panels that were illuminated by direct solar radiation on 23 June. The temperatures of the PV panels were measured only by an infrared camera, but the measured values correspond well to the theory of solids.
The results from the PV power plant in Ladná with substantial PV panel failures are used as a reference. In this case, the Solarmon monitoring system also indicates possible failures in the appropriate part of the power plant.
4. Conclusions
We consider roofs to be a very convenient place to install small PV power plants that are to be integrated into buildings. We consider the usage of agricultural land for large PV power plants to be far less appropriate, and we recommend a reduction of this usage to a minimum.
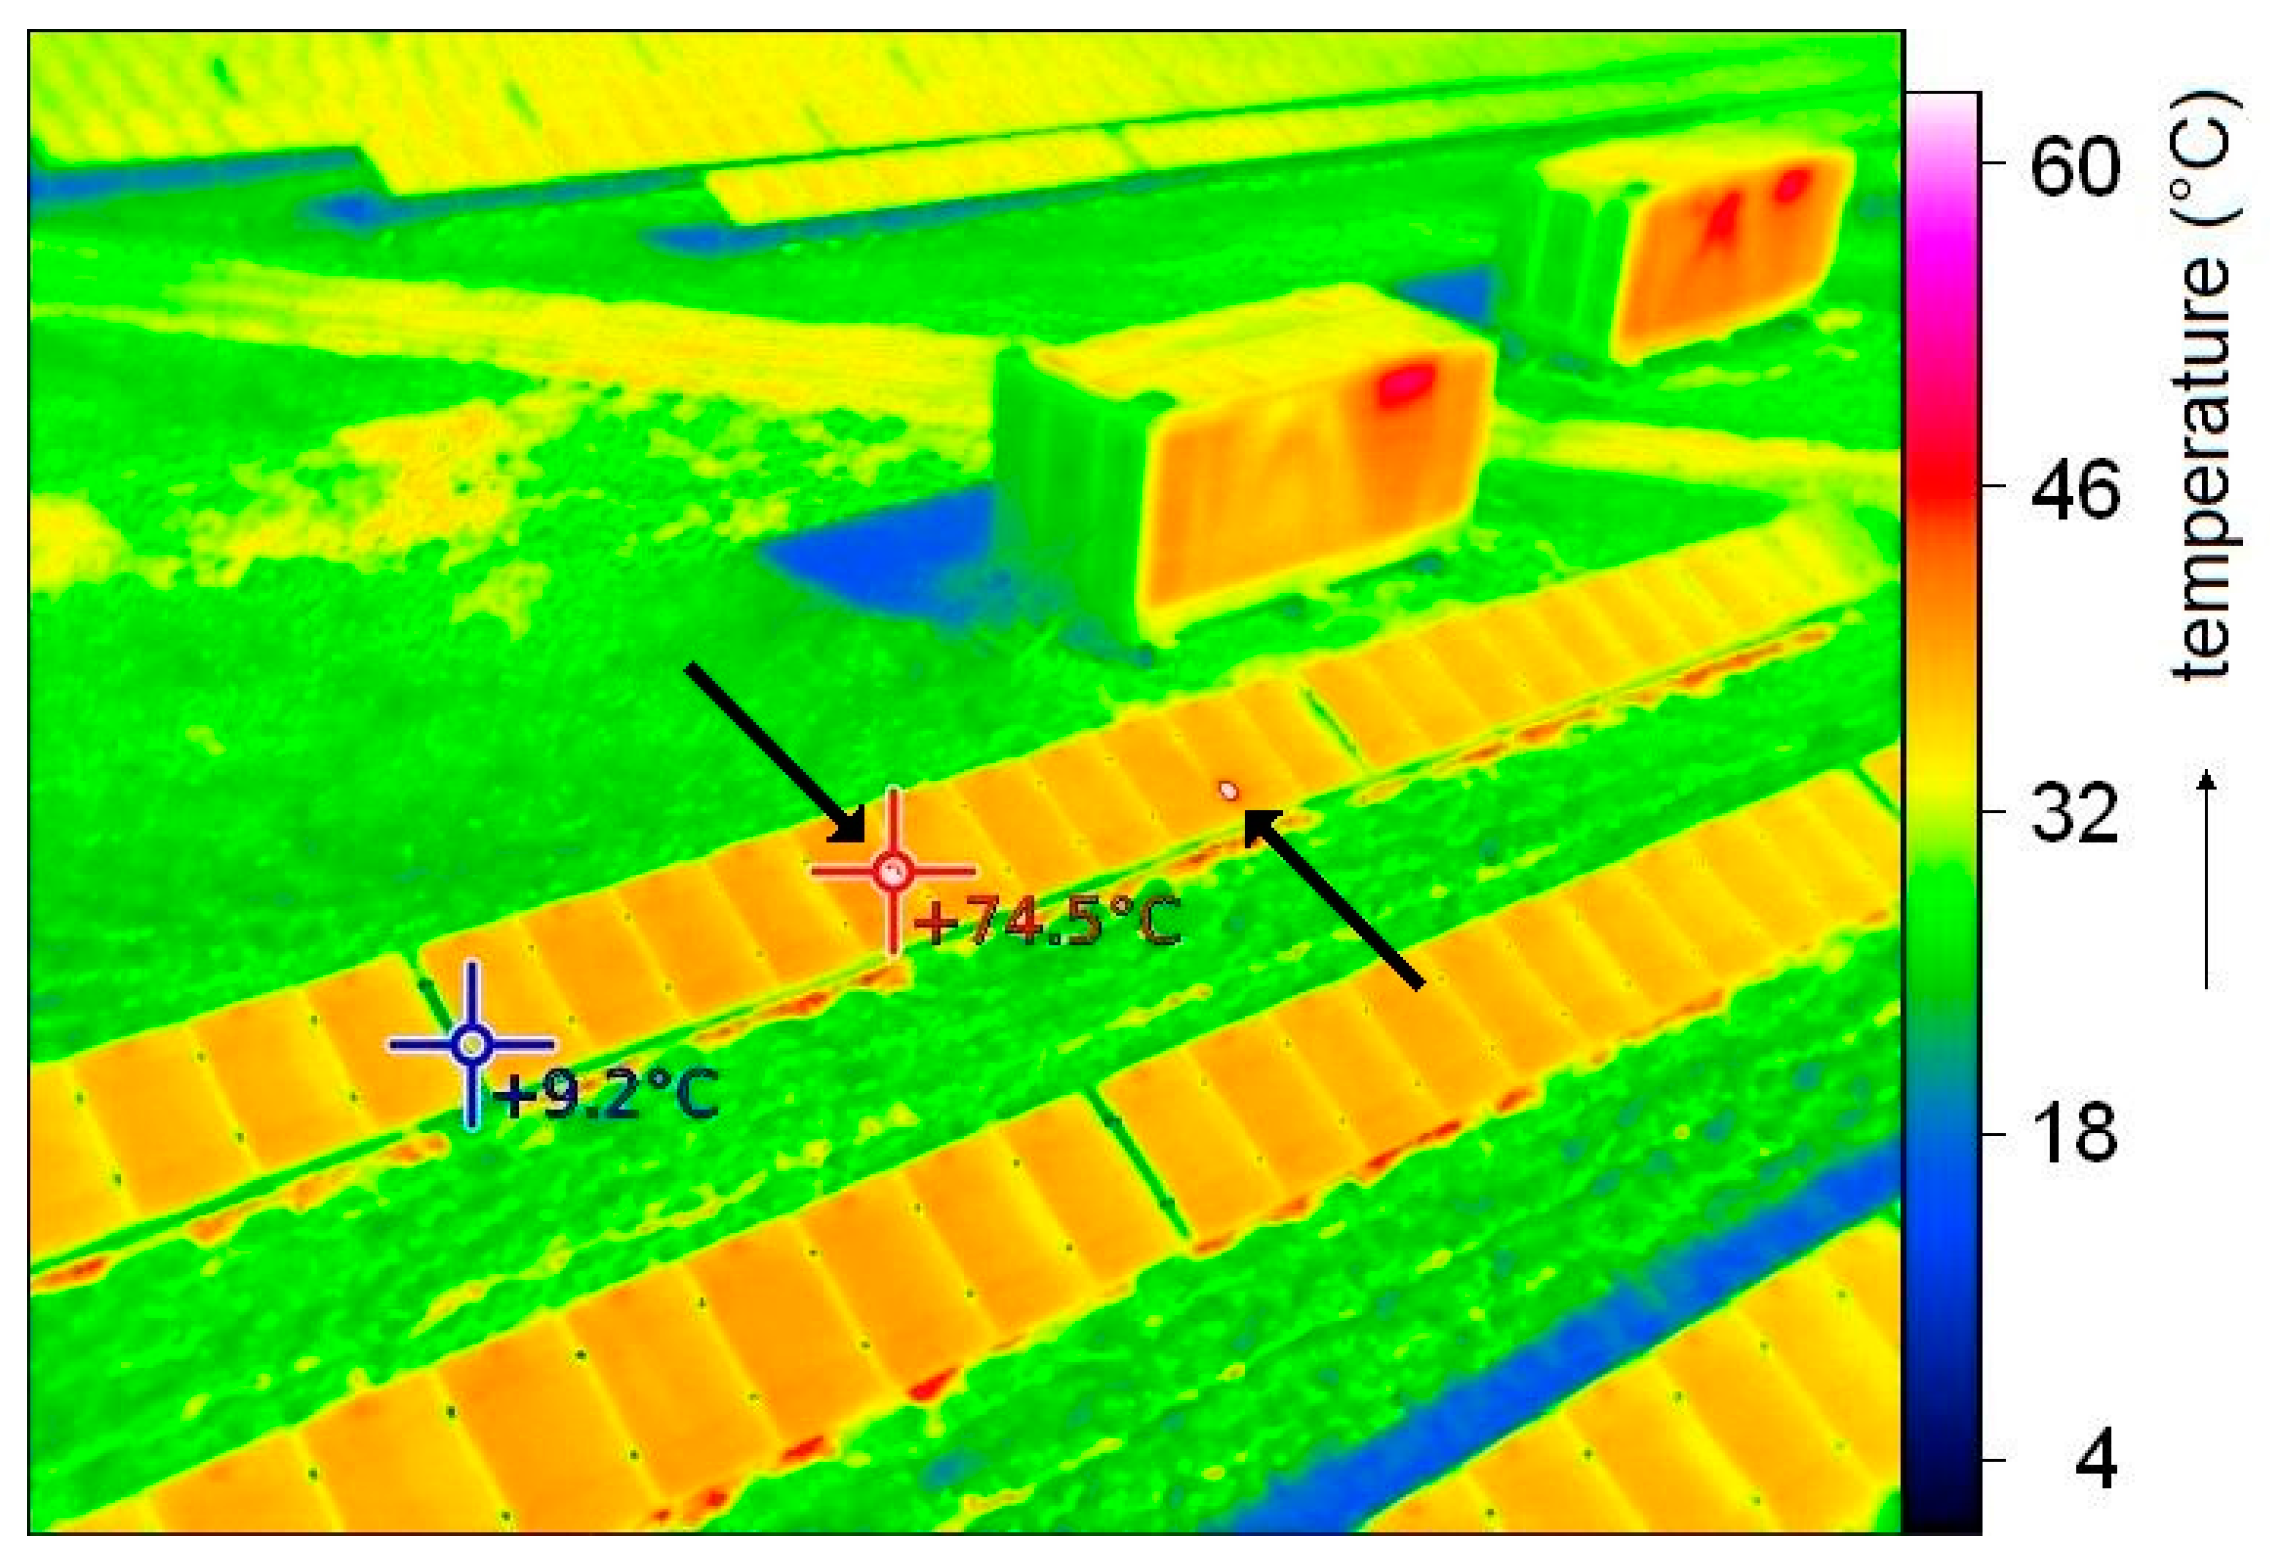
Using the drones and an infrared camera to monitor the defects of the PV power plant is relatively simple, fast, and operational but only serves as an approximate control of the state of the PV panels. However, the ability of the quick detection of the worst defects is the main advantage. Cracked PV cells with broken contacts are the worst defects. It can be seen (Figure 3) that our above-mentioned PV power plant does not have any significant flaws. We suggested the use of drones to monitor parameters [20]. This method is appropriate if there is limited access to the building-integrated PV power plant, such when it is located on the roof or the facade. Figure 7 shows a similar image from a larger PV power plant in Ladná as an example. We can see two damaged hot spots on the PV panels in the central part of the image. In the background, we can see the ventilation of the heat released by the inverters.
The evaluation of the figures, such as Figure 7, yields the following conclusions: (a) If the temperature of the hot spots is more than 20 °C above the temperature of the PV panel, the panel has to be replaced; (b) if there are more than three low temperature hot spots (temperature less than 20 °C above the PV panel temperature), the panel has to be replaced; and (c) if there is a complete string(s) with an increased temperature, the panel has to be repaired and the bypass diode has to be replaced.
We believe that there is no need to test PV panels with more demanding electroluminescence technology until there is a reason to suspect larger PV panel faults. Such suspicion may arise from the infrared monitoring mentioned above or from a significant decrease in PV plant power and consequently a decrease in the electric energy production.
Our Solarmon monitoring system for photovoltaic power plants has been installed in 65 PV power plants and it has good performance in all of them. The data have been archived and evaluated in our dispatching center. The PV power plant integrated into the roof of the Faculty of Engineering of the Czech Technical University in Prague has been working for nearly two years. Its initial parameters are very good and the amount of the produced electric energy significantly exceeds the expected values for the site. It can be assumed that the values of the amount of the produced electric energy will drop slightly during the ageing of PV panels. However, the initial values are very good, and they indicate the good quality of all the components.
The effectiveness of the proposed PV systems can be further enhanced by the design elements that we have developed and published earlier, such as using a tracking PV panel stand [21] or mirror concentrators [22]. In references [23] and [24], the authors used the so-called hybrid solar panels to combine photovoltaic and photothermic energy conversion in order to increase efficiency. In the case of the usage of radiation concentrators, it is necessary to choose a reasonable construction and to look for any economic advantage. The amount of the produced electric energy can be lower due to the reduced PV energy conversion efficiency from the increase in the PV panel temperature. If the temperature is too high, the concentrators are no longer efficient enough. The efficiency of the PV energy conversion is approaching zero at the temperatures of PV panels based on crystalline silicon around 200 °C, as explained above.
Our results are in agreement with the results presented in the previous work [25]. Sometimes, there are troubles with connection of the renewable energy power sources to the public grid, see reference [26]. Monitoring of defects using a drone in possible in the case of other energy sources as well. See for example the reference [27], the drone was used for inspection of the wind turbine.
Author Contributions
Conceptualization, M.L. and V.P.; Methodology, V.B.; Software, V.B.; Validation, J.S. and M.D.; Formal Analysis, J.L.; Investigation, M.L.; Resources, J.S.; Data Curation, J.S.; Writing-Original Draft Preparation, M.L. and V.P.; Writing-Review & Editing, M.L.; Visualization, J.L.; Supervision, M.L.; Project Administration, V.P.; Funding Acquisition, J.S.
Funding
This research was funded by internal grant of the Faculty of Engineering.
Acknowledgments
The authors are grateful to the company Upvision, Ltd. for kind help with measurements using the drone.
Conflicts of Interest
The authors declare that there is no conflict of interest regarding the publication of this paper.
References
- Ayompe, L.M.; Duffy, A.; McCormack, S.J.; Conlon, M. Measured performance of a 1.72 kW rooftop grid connected photovoltaic system in Ireland. Energy Convers. Manag. 2011, 52, 816–825. [Google Scholar] [CrossRef]
- Yahyaoui, I.; Segatto, M.E.V. A practical technique for on-line monitoring of a photovoltaic plant connected to a single-phase grid. Energy Convers. Manag. 2017, 132, 198–206. [Google Scholar] [CrossRef]
- Madeti, S.R.; Singh, S.N. Monitoring system for photovoltaic plants: A review. Renew. Sustain. Energy Rev. 2017, 67, 1180–1207. [Google Scholar] [CrossRef]
- Rezk, H.; Tyukhov, I.; Raupov, A. Experimental implementation of meteorological data and photovoltaic solar radiation monitoring system. Int. Trans. Electr. Energy Syst. 2015, 25, 3573–3585. [Google Scholar] [CrossRef]
- Beránek, V.; Libra, M. Monitoring system for photovoltaic power plants. In Proceedings of the 4th International Conference on Trends in Agricultural Engineering, Prague, Czech Republic, 7–10 September 2010; pp. 668–675. [Google Scholar]
- Beránek, V.; Olšan, T.; Libra, M.; Poulek, V.; Sedláček, J.; Dang, M.-Q.; Tyukhov, I.I. New Monitoring System for Photovoltaic Power Plants’ Management. Energies 2018, 11, 2495. [Google Scholar]
- Libra, M.; Kouřím, P.; Poulek, V. Behavior of photovoltaic system during solar eclipse in Prague. Int. J. Photoenergy 2016, 2016, 2653560. [Google Scholar] [CrossRef]
- Libra, M.; Beránek, V.; Sedláček, J.; Poulek, V.; Tyukhov, I.I. Roof photovoltaic power plant operation during the solar eclipse. Sol. Energy 2016, 140, 109–112. [Google Scholar] [CrossRef]
- Olšan, T.; Libra, M.; Poulek, V.; Chalupa, B.; Sedláček, J. Combination of Three Methods of Photovoltaic Panels Damage Evaluation. Sci. Agric. Bohem. 2017, 48, 98–101. [Google Scholar]
- Munoz, M.A.; Alonso-García, M.C.; Vela, N.; Chenlo, F. Early degradation of silicon PV modules and guaranty conditions. Sol. Energy 2011, 85, 2264–2274. [Google Scholar] [CrossRef] [Green Version]
- Harrou, F.; Sun, Y.; Taghezouit, B.; Saidi, A.; Hamlati, M.E. Reliable fault detection and diagnosis of photovoltaic systems based on statistical monitoring approaches. Renew. Energy 2018, 116, 22–37. [Google Scholar] [CrossRef]
- Kasemann, M.; Grote, D.; Walter, B.; Kwapil, W.; Trupke, T.; Augarten, Y.; Bardos, R.A.; Pink, E.; Abbott, M.D.; Warta, W. Luminescence Imaging for the Detection of Shunts on Silicon Solar Cells. Prog. Photovolt. Res. Appl. 2008, 16, 297–305. [Google Scholar] [CrossRef]
- Alsafasfeh, M.; Abdel-Qader, I.; Bazuin, B.; Alsafasfeh, Q.; Su, W. Unsupervised Fault Detection and Analysis for Large Photovoltaic Systems Using Drones and Machine Vision. Energies 2018, 11, 2252. [Google Scholar] [CrossRef]
- Ioannou, A.K.; Stefanakis, N.E.; Boudouvis, A.G. Design optimization of residential grid-connected photovoltaics on rooftops. Energy Build. 2014, 76, 588–596. [Google Scholar] [CrossRef]
- Li, Y.; Ding, D.; Liu, C.; Wang, C. A pixel-based approach to estimation of solar energy potential on building roofs. Energy Build. 2016, 129, 563–573. [Google Scholar] [CrossRef]
- Wermager, S.; Baur, S. Energy Analysis of a Student-Designed Solar House. Energies 2013, 6, 6373–6390. [Google Scholar] [CrossRef] [Green Version]
- Gonzalez, L.F.; Montes, G.A.; Puig, E.; Johnson, S.; Mengersen, K.; Gaston, K.J. Unmanned Aerial Vehicles (UAVs) and Artificial Intelligence Revolutionizing Wildlife Monitoring and Conservation. Sensors 2016, 16, 97. [Google Scholar] [CrossRef] [PubMed]
- Photovoltaic Geographical Information System PV GIS. Available online: http://re.jrc.ec.europa.eu/pvgis/apps4/pvest.php# (accessed on 26 October 2017).
- Libra, M.; Poulek, V.; Kouřím, P. Temperature changes of I-V characteristics of photovoltaic cells as a consequence of the Fermi energy level shift. Res. Agric. Eng. 2017, 63, 10–15. [Google Scholar] [Green Version]
- Villarini, M.; Cesarotti, V.; Alfonsi, L.; Introna, V. Optimization of photovoltaic maintenance plan by means of a FMEA approach based on real data. Energy Convers. Manag. 2017, 152, 1–12. [Google Scholar] [CrossRef]
- Poulek, V.; Khudysh, A.; Libra, M. Self powered solar tracker for Low Concentration PV (LCPV) systems. Sol. Energy 2016, 127, 109–112. [Google Scholar] [CrossRef]
- Poulek, V.; Khudysh, A.; Libra, M. Innovative low concentration PV systems with bifacial solar panels. Sol. Energy 2015, 120, 113–116. [Google Scholar] [CrossRef]
- Matuška, T.; Sourek, B.; Jirka, V.; Pokorny, N. Glazed PVT collector with polysiloxane encapsulation of PV cells: Performance and economic analysis. Int. J. Photoenergy 2015, 2015, 718316. [Google Scholar] [CrossRef]
- Shemelin, V.; Matuška, T. Detailed Modeling of Flat Plate Solar Collector with Vacuum Glazing. Int. J. Photoenergy 2017, 2017, 1587592. [Google Scholar] [CrossRef]
- Rodrigues, E.M.G.; Godina, R.; Marzband, M.; Pouresmaeil, E. Simulation and Comparison of Mathematical Models of PV Cells with Growing Levels of Complexity. Energies 2018, 11, 2902. [Google Scholar] [CrossRef]
- Prehoda, E.; Pearce, J.M.; Schelly, C. Policies to Overcome Barriers for Renewable Energy Distributed Generation: A Case Study of Utility Structure and Regulatory Regimes in Michigan. Energies 2019, 12, 674. [Google Scholar] [CrossRef]
- Shihavuddin, A.; Chen, X.; Fedorov, V.; Christensen, A.N.; Riis, N.A.B.; Branner, K.; Dahl, A.B.; Paulsen, R.R. Wind Turbine Surface Damage Detection by Deep Learning Aided Drone Inspection Analysis. Energies 2019, 12, 676. [Google Scholar] [CrossRef]
Figure 1.
Photovoltaic (PV) power plant and drone during temperature monitoring.

Figure 2.
The infrared camera in detail.

Figure 3.
Typical PV panel image from the infrared camera.

Figure 4.
Electric energy production during 2016–2017.

Figure 5.
Dependence of the instantaneous power relative to time during the three selected days in 2016.
Figure 5.
Dependence of the instantaneous power relative to time during the three selected days in 2016.

Figure 6.
Dependence of the wind speed relative to time during the three selected days in 2016.

Figure 7.
Image of the higher PV power plant from the infrared camera with hot spots emphasized by arrows.
Figure 7.
Image of the higher PV power plant from the infrared camera with hot spots emphasized by arrows.


Table 1.
Electric energy production during years 2016–2017—comparison of the measured values with the assumption according to PV GIS.
Table 1.
Electric energy production during years 2016–2017—comparison of the measured values with the assumption according to PV GIS.
| Month | El. Energy—PV GIS Prediction (kWh·kWp−1) | El. Energy—Production (kWh·kWp−1) | Comparison (%) |
|---|---|---|---|
| January 2016 | 29.5 | 36 | +22 |
| February | 47.4 | 58 | +22 |
| March | 88.7 | 88 | −1 |
| April | 116.0 | 125 | +8 |
| May | 121.0 | 158 | +31 |
| June | 120.0 | 147 | +22 |
| July | 119.0 | 150 | +26 |
| August | 113.0 | 154 | +36 |
| September | 89.1 | 134 | +50 |
| October | 63.8 | 55 | −14 |
| November | 32.9 | 47 | +43 |
| December | 25.3 | 31 | +23 |
| Total 2016 | 965.7 | 1183 | +22.5 |
| January 2017 | 29.5 | 10 | −66 |
| February | 47.4 | 41 | −14 |
| March | 88.7 | 67 | −24 |
| April | 116.0 | 118 | +2 |
| May | 121.0 | 169 | +40 |
| June | 120.0 | 179 | +49 |
| July | 119.0 | 151 | +27 |
| August | 113.0 | 154 | +36 |
| September | 89.1 | 94 | +5 |
| October | 63.8 | 75 | +18 |
| November | 32.9 | 37 | +12 |
| December | 25.3 | 31 | +23 |
| Total 2017 | 965.7 | 1126 | +16.6 |
© 2019 by the authors. Licensee MDPI, Basel, Switzerland. This article is an open access article distributed under the terms and conditions of the Creative Commons Attribution (CC BY) license (http://creativecommons.org/licenses/by/4.0/).
Share and Cite
MDPI and ACS Style
Libra, M.; Daneček, M.; Lešetický, J.; Poulek, V.; Sedláček, J.; Beránek, V. Monitoring of Defects of a Photovoltaic Power Plant Using a Drone. Energies 2019, 12, 795. https://doi.org/10.3390/en12050795
AMA Style
Libra M, Daneček M, Lešetický J, Poulek V, Sedláček J, Beránek V. Monitoring of Defects of a Photovoltaic Power Plant Using a Drone. Energies. 2019; 12(5):795. https://doi.org/10.3390/en12050795
Chicago/Turabian StyleLibra, Martin, Milan Daneček, Jan Lešetický, Vladislav Poulek, Jan Sedláček, and Václav Beránek. 2019. "Monitoring of Defects of a Photovoltaic Power Plant Using a Drone" Energies 12, no. 5: 795. https://doi.org/10.3390/en12050795
Note that from the first issue of 2016, this journal uses article numbers instead of page numbers. See further details here.