Article

A Life Cycle Assessment of Biomethane Production from Waste Feedstock Through Different Upgrading Technologies

1
Department of Science and Technology (DiST), University of Naples “Parthenope”, Centro Direzionale, ISOLA C4 80143 Naples, Italy
2
School of Environment, Beijing Normal University, 19 Xinjiekouwai St., Haidian District, Beijing 100875, China
3
Institute of Energy Economics and Rational Use of Energy (IER), University of Stuttgart, Heßbrühlstrasse 49a, 70565 Stuttgart, Germany
*
Authors to whom correspondence should be addressed.
Energies 2019, 12(4), 718; https://doi.org/10.3390/en12040718
Submission received: 29 December 2018 / Revised: 5 February 2019 / Accepted: 16 February 2019 / Published: 22 February 2019
(This article belongs to the Section A4: Bio-Energy)

Abstract

:
Upgrading consists of a range of purification processes aimed at increasing the methane content of biogas to reach specifications similar to natural gas. In this perspective, an environmental assessment, based on the Life Cycle Assessment (LCA) method, of different upgrading technologies is helpful to identify the environmental characteristics of biomethane and the critical steps for improvement. The aim of this work is to conduct an LCA of biomethane production from waste feedstock, using the SimaPro software. The study focuses on the comparison of several upgrading technologies (namely, membrane separation, cryogenic separation, pressure swing adsorption, chemical scrubbing, high pressure water scrubbing) and the on-site cogeneration of electricity and heat, including the environmental benefits deriving from the substitution of fossil-based products. The results show a better environmental performance of the cogeneration option in most of the impact categories. The Fossil resource scarcity is the impact category which is mainly benefited by the avoided production of natural gas, with savings of about 0.5 kg oil eq/m3 of biogas for all the investigated technologies, with an average improvement of about 76% compared to conventional cogeneration. The results show that the membrane upgrading technology is slightly more environmentally convenient than the other upgrading technologies.

1. Introduction

In recent years, a growing interest has arisen in the generation and use of renewable energy (RE), to switch from fossil-based to more sustainable production and consumption patterns. RE plays a key role in minimizing several environmental and socio-economic concerns, although the non-climate related environmental impacts generated from RE as compared to fossil-based energy are still rarely debated in the pertinent scientific literature [1,2]. In particular, bioenergy from waste feedstock represents a valuable prospect that increasingly attracts the attention of populations and governments towards waste-based biorefinery processes. In this perspective, anaerobic digestion (AD) for biogas production seems to be a viable way to simultaneously improve waste management while producing RE [3].
The term AD refers to a complex anaerobic biodegradation process carried out by a variety of different species from two entirely different biological kingdoms (Bacteria and Archaea) [4]. The main product of this bioconversion process is biogas, a mixture which mainly consists of methane (CH4) and carbon dioxide (CO2), but also contains several impurities [5]. Gas production, pH, in and out solids content, volatile acids concentration and alkalinity are the commonly measured operational parameters [6]. Usually, produced biogas is burned in on-site cogeneration units to simultaneously produce heat and electricity, for internal consumptions of the AD plant with the injection of electricity excess in the national grid [7]. Alternatively, it can be purified to increase its CH4 content, thus providing a promising energy carrier, namely biomethane (bioCH4), that can be used as vehicle fuel or injected into the natural gas grid network, similarly to fossil-based CH4 [8].
New legislation concerning bioCH4 has recently been approved in Italy, promoting its use in the transport sector with the aim of diversifying and decarbonizing natural gas [9,10]. In addition, financial incentives have also been established for new bioCH4 plants and biogas plants that will be converted to bioCH4 production [11]. BioCH4 is obtained from biogas by means of a purification process called upgrading. The upgrading technologies remove CO2 and other impurities from biogas in order to increase the concentration of bioCH4 up to more than 95% [12]. Currently, there are several upgrading technologies available, which can be differentiated according to their CO2 removal method. The main technologies are: cryogenic or membrane separation, adsorption (Pressure Swing Adsorption PSA), absorption (chemical scrubbing with amine, High Pressure Water Scrubbing HPWS, among others) [13]. Generally, CO2 can be recovered and reused for other industrial applications.
In this perspective, it is crucial to assess and quantify the environmental impacts generated from the upgrading technologies and ascertain the potential advantages in comparison with the conventional on-site Combined Heat and Power (CHP) plants. On the one hand, the environmental sustainability of biogas has been widely analyzed in literature using Life Cycle Assessment (LCA). Berglund and Börjesson described the energy balance of biogas production in a life cycle perspective, highlighting that the net energy output turns negative when transport of raw materials exceeds distance limits [14]. Collet et al. performed a life cycle assessment of biogas production from microalgae feedstock and compared the results to algal biodiesel and to first generation biodiesel production, concluding that the reduction of electrical consumption and the maximization of methane yield are of major importance to guaranty the environmental friendliness of the whole system [15]. Many other LCA studies on biogas production systems followed in Europe and worldwide, which provided a solid knowledge base to improve the efficiency of such systems and reduce their environmental impacts [16]. On the other hand, the environmental aspects specifically related to biogas upgrading techniques have only been dealt with in the last decade, since bioCH4 represents a relatively recent application. Pertl et al. compared different upgrading technologies by means of a life cycle approach, from plant cultivation to the energy conversion process, and identified an upgrading scenario with minimum overall greenhouse gases (GHG) emissions, concluding that the reduction of GHG may be limited in comparison with the reference scenario (conventional energy supply system based on natural gas) [17]. Jury et al. assessed a new technology for bioCH4 production by mono-fermentation of cultivated crops, finding out that bioCH4 production and subsequent injection into the grid contributes to climate change with impacts that are 30–40% (on a 500-year time horizon) or 10–20% (on a 100-year time horizon) lower than natural gas importation [2]. Poeschl et al. performed an attributional LCA of multiple biogas production and utilization pathways, indicating the tri-generation as the most promising pathway for sustainable biogas utilization in small-scale plants [18]. Starr et al. evaluated three biogas upgrading technologies, namely HPWS, alkaline with regeneration and bottom ash upgrading, the second resulting the most impactful [13]. Cozma et al. evaluated the environmental impacts of HPWS, identifying global warming, acidification and human toxicity as the impact categories that are mostly damaged [19]. Morero et al. compared upgrading systems based on different solvents (water, amine, diglycolamine and polyethylene glycol dimethylether), concluding that water produces a minor impact in most of the considered categories and is the most feasible solvent for achieving the lowest payback period [20,21]. Chemical absorption processes with aqueous solution of mono-ethanolamine (MEA), sodium hydroxide (NaOH) and potassium hydroxide (KOH) were also compared through a simulation software, showing that MEA solution provides the best performances [22]. More recently, Castellani et al. assessed the carbon and energy footprint of a hydrate-based biogas upgrading system in combination with CO2 valorization, pinpointing that this scenario has an overall energy efficiency of about 0.82, higher than the worldwide average energy efficiency for fossil-based methane (0.75) [23]. Shanmugam et al. compared the environmental performance of liquefied bioCH4 (LBM) and Diesel operated Tractor Trailer (TT) through LCA, concluding that the highest reduction in global warming potential and fossil depletion potential impacts is achieved by LBM, which can be an environmentally preferred alternative to diesel for operation of TTs [24]. Finally, Ardolino et al. assessed the environmental sustainability of an anaerobic digestion process of municipal solid waste, where the produced biogas is upgraded to bioCH4 for the road transport sector by means of a membrane separation unit, finding that the bioCH4 scenarios largely improve the impact categories of global warming and non-RE [7].
Beyond the technical aspects of producing bioCH4 and the identification of the most performing upgrading technology, the main gap in the scientific literature is an evaluation of the environmental sustainability of using biogas to produce bioCH4 rather than electricity and heat in combustion engines, that represents the most common method used to valorize biogas. In such a context, the aim of this work is an LCA of the use of biogas obtained from biogenic waste feedstock to produce bioCH4 throughout the main upgrading technologies (membrane separation, cryogenic separation, PSA, chemical scrubbing, HPWS) and a comparison with the reference case of using it on-site in a CHP plant. This study also includes additional environmental benefits deriving from the substitution of fossil-based products such as natural gas, electricity and heat. The novel aspects of this study consist of the perspective of the LCA results split over different stages of the bioCH4 production process, with special focus on those steps and hotspots entailing the highest environmental impacts. The contribution of each input flow in the global framework of the investigated system can be quantified and going backwards to the previous phase is crucial in the identification of the flows that are actually responsible for the generated impacts, thus allowing concrete improvement proposals.

2. Materials and Methods

LCA is a methodology for the comprehensive assessment of the environmental impact associated to a product or process throughout its life cycle (from extraction of raw materials to product disposal at the end of use) and it is sometimes referred to as cradle-to-grave analysis [25]. However, when the system boundaries are restricted to selected life cycle stages (e.g., from raw materials extraction to product manufacture, as in the investigated case study), a cradle-to-gate perspective can be applied. According to the ISO standards, this LCA is compiled of several interrelated components: (i) goal and scope definition; (ii) inventory analysis; (iii) impact assessment and (iv) interpretation of results for explanation of conclusions and recommendations [26,27].

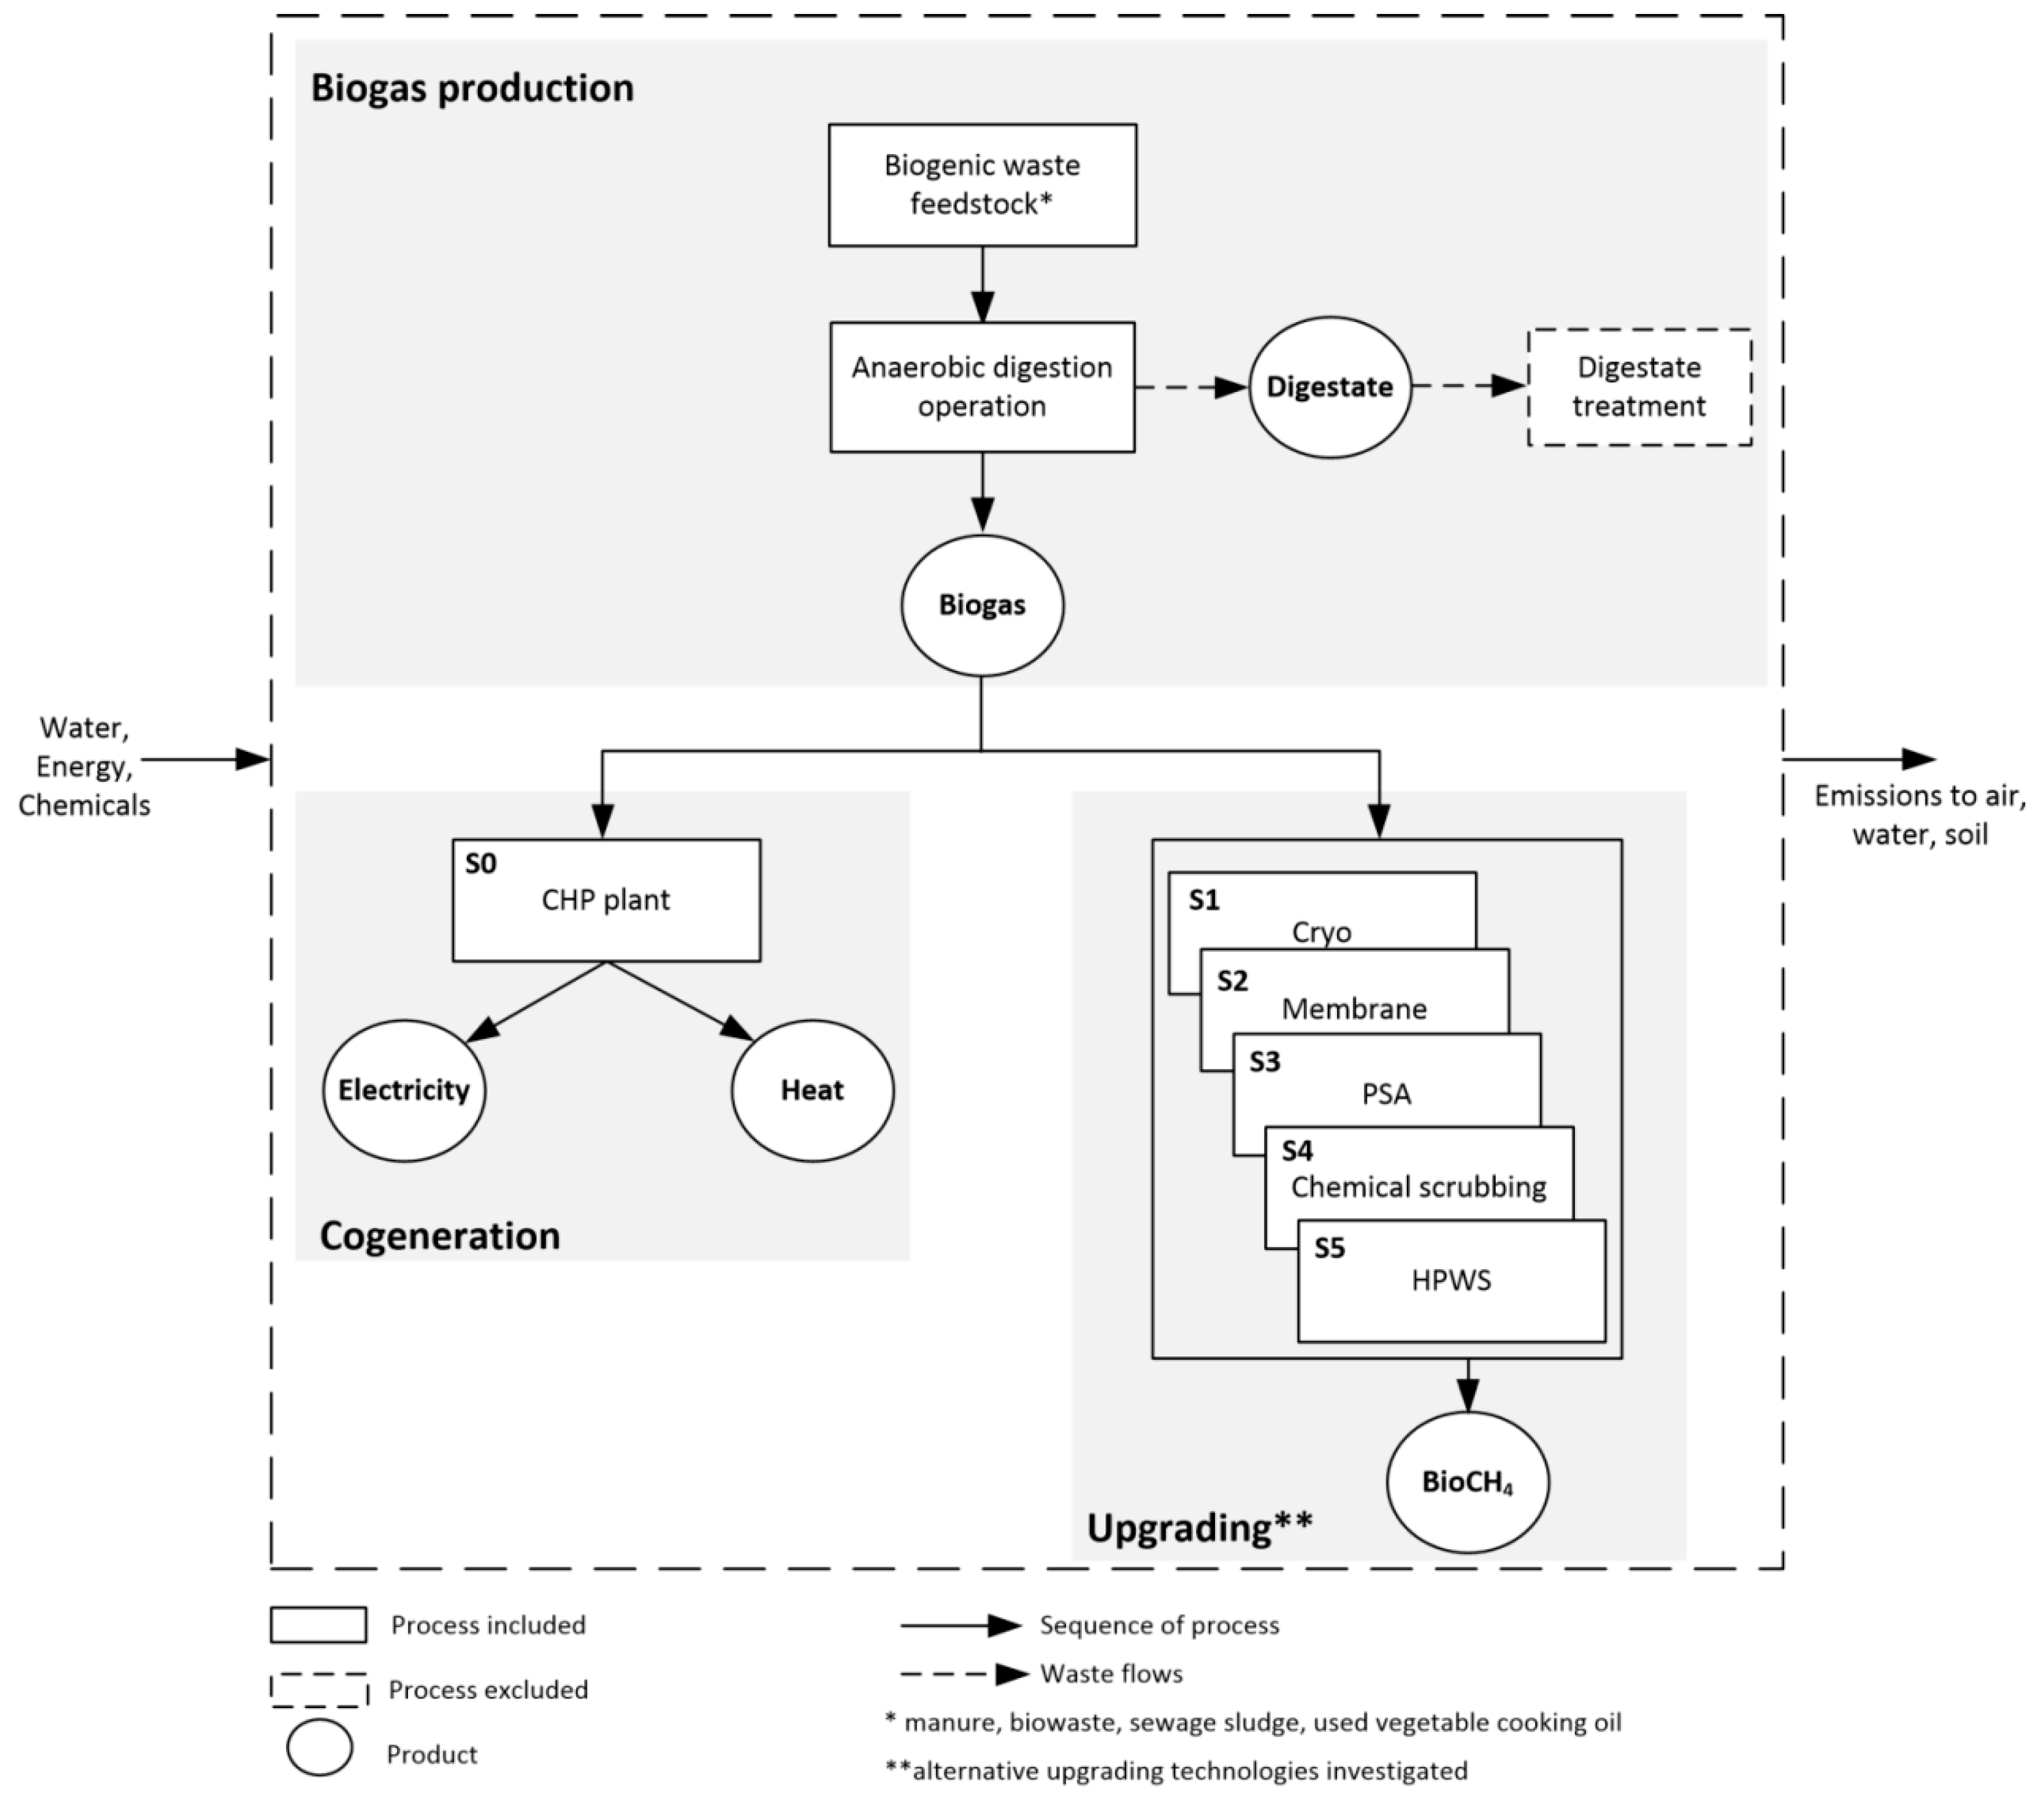
2.1. Goal and Scope Definition

The goal of this study is to evaluate the environmental costs and benefits generated from different uses of biogas with the purpose of comparing the bioCH4 production to the cogeneration of electricity and heat. The functional unit (F.U.) selected is the use of 1 m3 of biogas produced from biogenic waste feedstock and represents the reference to which all the inputs and outputs of the system are adjusted. According to the International Reference Life Cycle Data System (ILCD) Handbook [28], the analyzed context can be identified as a micro-level decision support (so-called situation A) and an attributional Life Cycle Inventory (LCI) modeling framework is therefore applied. The examined system is schematically shown in Figure 1. The boundary of the investigated system is defined from cradle to gate, being limited to the biogas production and conversion into bioCH4 or into electricity and heat, while neglecting any following uses. The biogas production step is common to both investigated routes (upgrading and cogeneration). According to the Ecoinvent database v.3.4 [29], a mix from different waste sources (solid and liquid manure, biowaste, sewage sludge, used vegetable cooking oil) is considered for the biogas production by means of AD. The following upgrading scenarios are included: S1 (Cryo), based on cryogenic separation that uses the principle of fractionation by sublimation or condensation of CO2 at different temperatures; S2 (Membrane), in which the CO2 is separated through polymeric, inorganic or mixed matrix membranes at low pressure (close to 1 bar) and at high pressure (20–36 bar); S3 (PSA), based on adsorption of adsorbent materials, like zeolites and activated carbon, that are able to selectively retain some compounds of a mixture by molecular size; S4 (Chemical scrubbing), consisting of the absorption of CO2 and H2S into a liquid phase (mono-ethanolamine MEA solution, in the present study); S5 (HPWS), that exploits the higher solubility of CO2 than CH4 in water. The scenario S0 (CHP plant) is included as reference case for the cogeneration of electricity and heat.

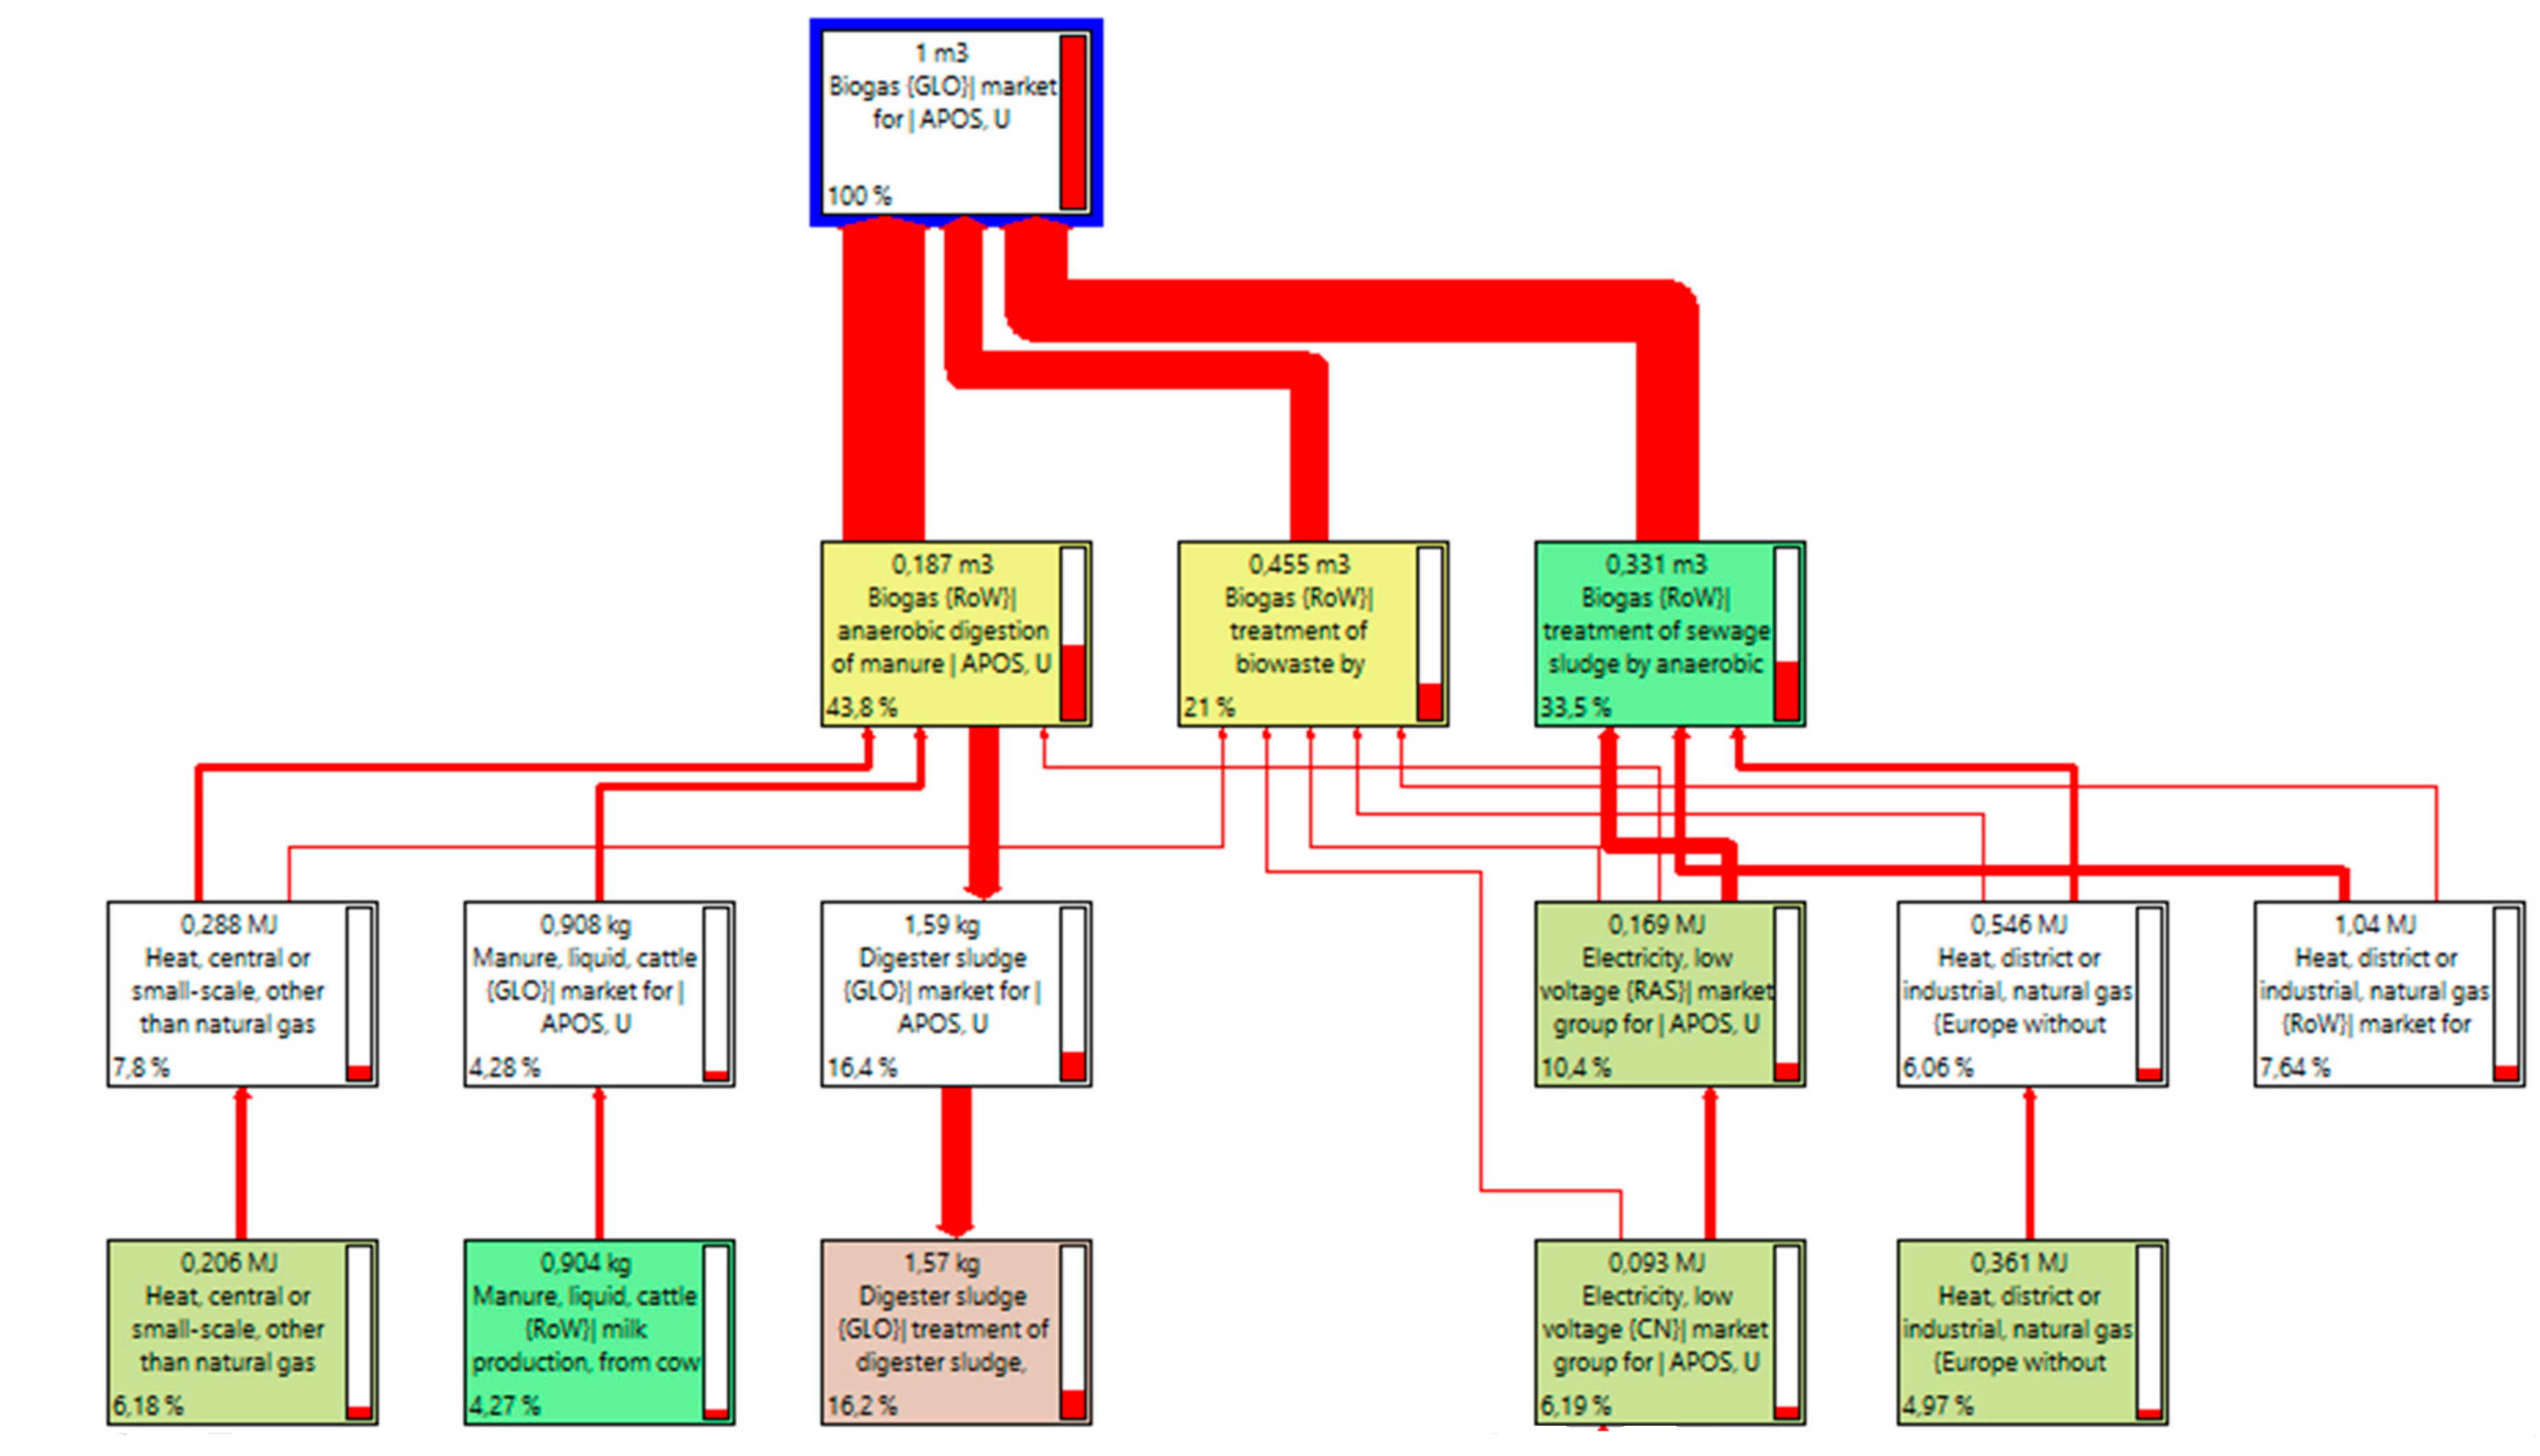
2.2. Life Cycle Inventory (LCI)

Inventory data for the investigated biogas conversion routes are shown in Table 1. The cogeneration process is modeled according to the Ecoinvent dataset representing the production of grid-connected electricity at high voltage and heat as a co-product, in a cogeneration unit with a capacity of 160 kWel. For the upgrading technologies, the PSA scenario is adjusted from the process available in the Ecoinvent database v.3.4 [29]. Accordingly, the other scenarios are modeled by introducing the specific values of energy and material requirements as well as the specific bioCH4 yields [1,19,30,31,32,33]. Regarding the emissions to air from the upgrading processes, it is assumed that the direct emissions mainly depend on the treatment of biogas and do not vary among the different technologies, except in the case of chemical scrubbing, where specific emissions (namely, ammonia and acetaldehyde), possibly originated from the chemical additive (MEA), are added.
A system boundaries expansion (or avoided burden approach) is also applied: the avoided production of natural gas that can be substituted from bioCH4 is accounted for. In addition, electricity and heat recovery in the CHP plant is credited, based on average data (i.e., electricity and heat market mix), after deducting the self-consumption of the plant.

2.3. Life Cycle Impact Assessment (LCIA)

The Life Cycle Impact Assessment (LCIA) of the F.U. is carried out with the SimaPro software version 8.5.2.0 [35]. In particular, the impact assessment is performed by means of one of the most recent and up-to-date LCA methods, the ReCiPe 2016 Midpoint (H) V.1.02 [36]. In this study, according to the recommendations from the ILCD Handbook [28], the following midpoint impact categories are analyzed: Global Warming (GW, in kg CO2 eq), Stratospheric ozone depletion (SOD, in kg CFC11 eq), Terrestrial acidification (TA, in kg SO2 eq), Freshwater eutrophication (FE, in kg P eq), Human toxicity, including both carcinogenic and non-carcinogenic (HT, in 1,4-DCB eq), Mineral resource scarcity (MRS, in kg Cu eq), Fossil resource scarcity (FRS, in kg oil eq), Water consumption (WC, in m3). The Cumulative Energy Demand (CED) method is also applied for a deeper understanding of the aspects related to energy requirements, to investigate the use of non-renewable (fossil, nuclear, biomass from primary forests) and renewable (biomass from agriculture, wind, solar, geothermal, water) sources involved in the production system [37].
Furthermore, the well-known Monte Carlo simulation approach is used to propagate the uncertainty linked to key foreground input/output and background processes/emissions along the evaluated stages of the best performing upgrading technology option. The function implemented in the SimaPro 8.5.2.0 software, namely a log-normal distribution, is used, considering a sample size of 1000 trials.

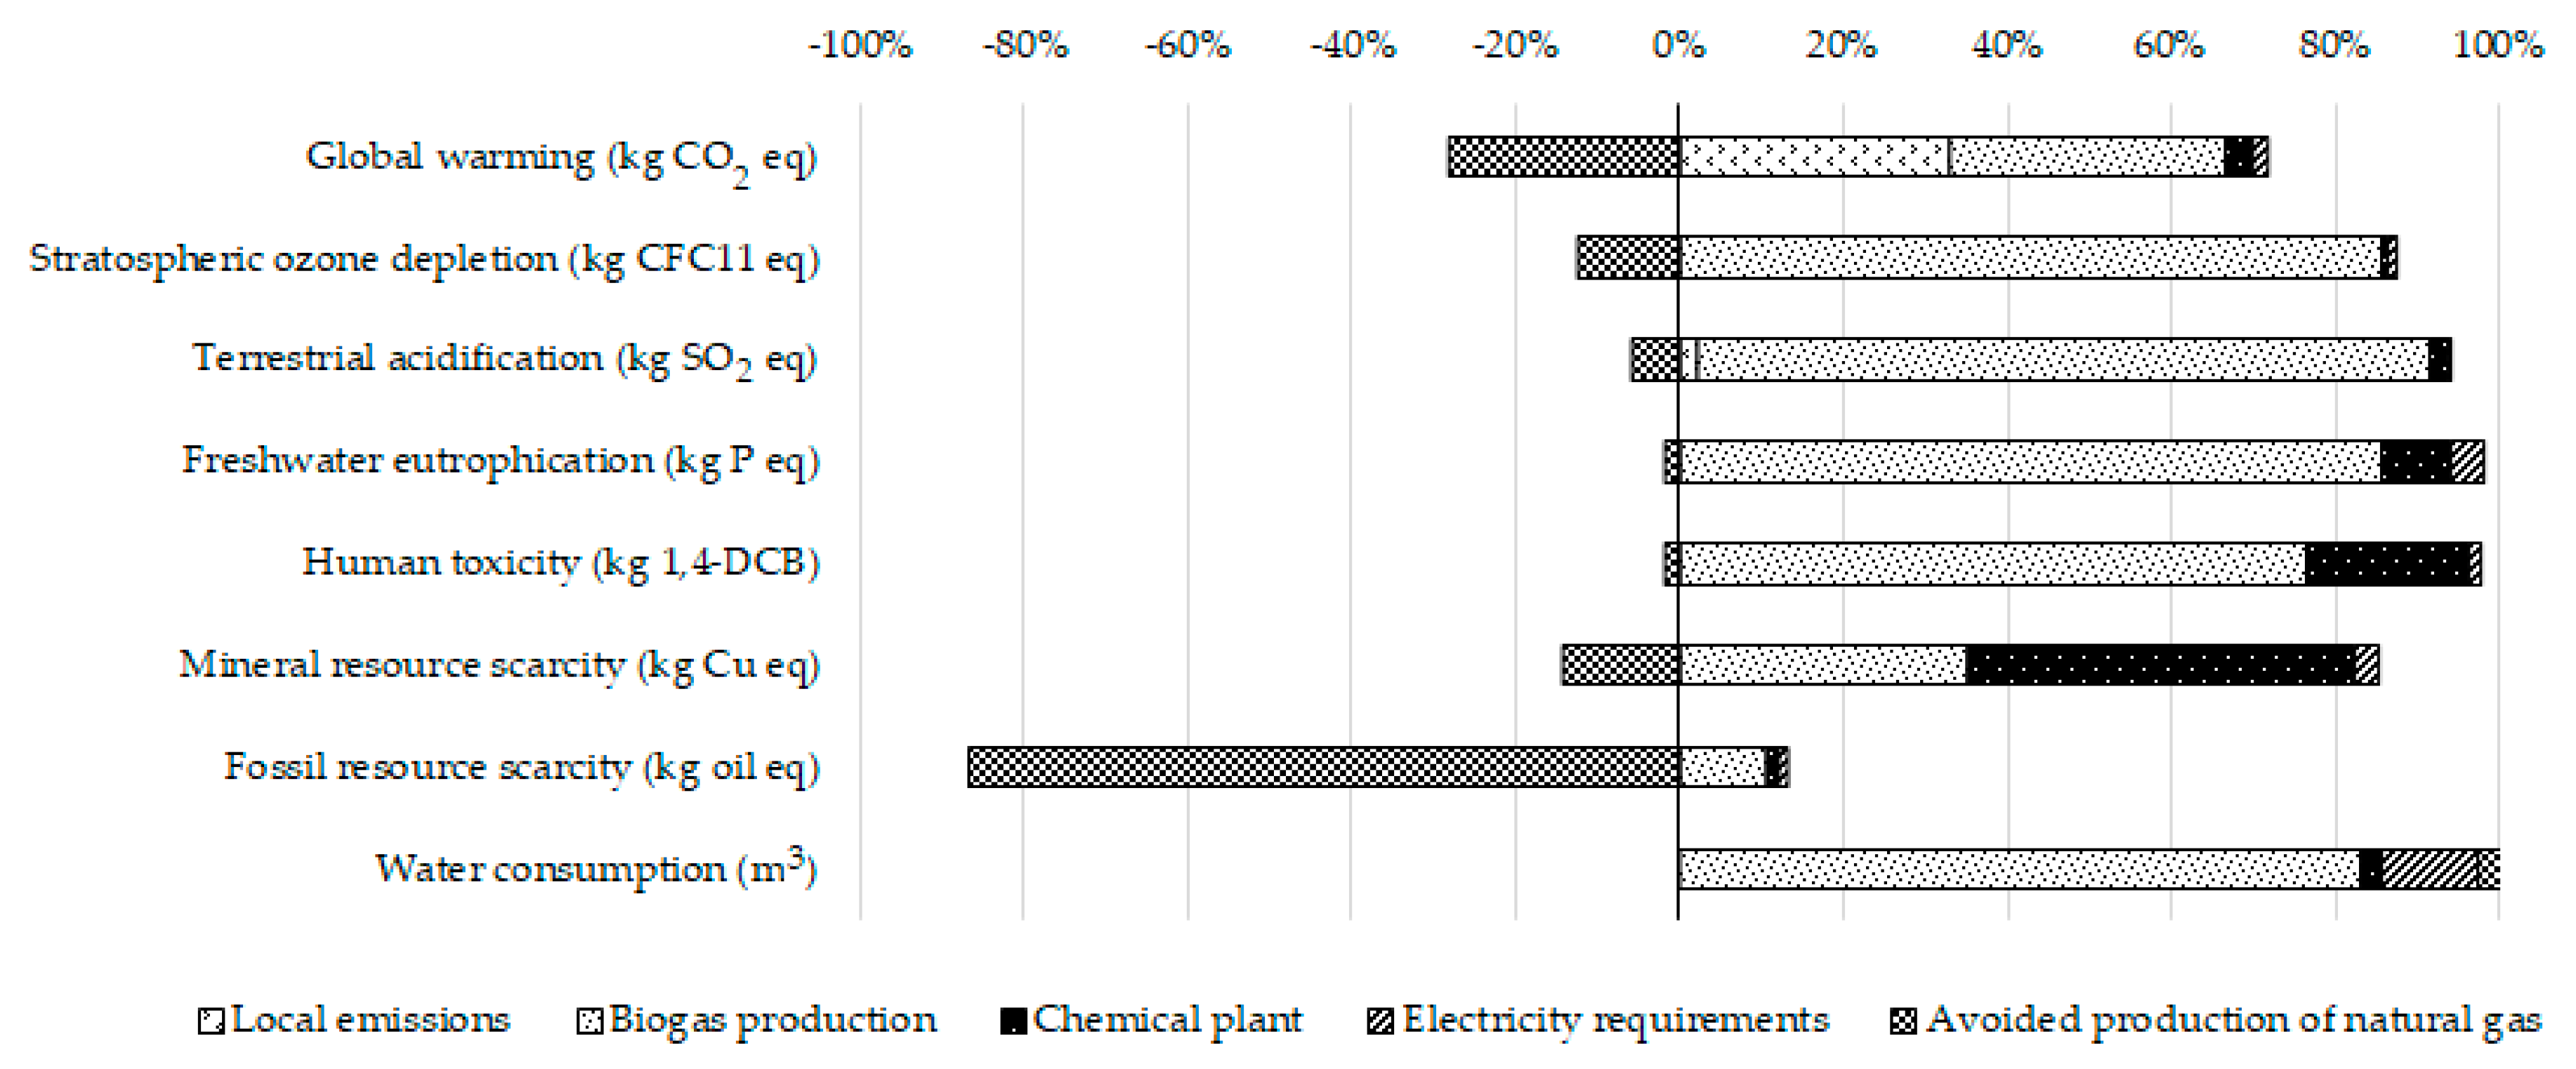
3. Results and Discussion

The goal of the performed analysis is twofold: firstly, it is intended to identify the main contributors to the environmental impacts generated by the upgrading of biogas to bioCH4 in a life cycle perspective, in terms of physical flows, consumed resources and emissions to the environment, also by quantifying the environmental benefits derived from the avoided production of natural gas. Secondly, it is aimed at comparing the upgrading technologies among each other and with the widespread use of biogas in a conventional CHP plant.
Table 2 summarizes the ReCiPe Midpoint (H) characterized impacts calculated for the different upgrading scenarios (S1 to S5) and the reference scenario (S0), with reference to a functional unit of 1 m3 of used biogas. The impacts on Stratospheric ozone depletion, on Terrestrial acidification and on Freshwater eutrophication are very similar in all scenarios, whereas in the remaining impact categories the reference scenario shows the best environmental performance, generating smaller impacts than the upgrading scenarios (for instance, 0.57 kg CO2 eq are released per m3 of used biogas in S0 versus 1.27 kg CO2 eq in S4). Among the upgrading technologies, the membrane separation generates the lowest impacts on all the investigated categories, whereas the chemical scrubbing causes the highest impacts on Global warming and Fossil resource scarcity.
The results of the CED method are displayed in Table 3, indicating the contributions of different types of energy. The share from non-renewable sources (in particular, fossil and nuclear) ranges from 77% up to 83% in all the investigated scenarios. The cryogenic separation option (S1) is the most demanding technology in terms of total energy demand (13.5 MJ), whereas the reference scenario (S0) requires only 6.30 MJ and, among the selected upgrading technologies, the membrane separation (S2) is confirmed to be less impactful, requiring a total energy amount of 8.68 MJ. Therefore, for the investigated production system, despite being based on biomass, the results are still very highly dependent on non-renewable energy sources.
In Table 4 and Table 5 the results of the avoided burden approach are shown respectively for the ReCiPe Midpoint and the CED impact assessment methods: the system expansion is applied by subtracting the impacts of natural gas from the impacts generated by the upgrading scenarios (due to the avoided production of an appropriate amount of natural gas that can be substituted by the produced bioCH4) or those of grid electricity and heat from the reference scenario (due to the avoided production of electricity and heat from fossil sources that can be substituted by energy recovered in the CHP plant). When the total calculated impacts consist of negative values, this means that the negative impacts (environmental savings) are larger than the positive ones (environmental loads). Therefore, negative values of the impacts suggest potential environmental savings and state the amount of environmental benefits that can be achieved.
Also in the framework of the avoided burden approach, the general trend of results is unchanged: the cogeneration option achieves better overall results and, among the upgrading technologies, the membrane separation is slightly more advantageous from the environmental point of view than the other investigated technologies. In the case of the cogeneration route, net advantages (with negative shares larger than positive ones) are reached in different impact categories, namely Global warming, Fossil resource scarcity and Water consumption, respectively amounting to −0.83 kg CO2 eq, −0.30 kg oil eq and −0.003 m3 per m3 of used biogas. In the case of the upgrading routes, the impact category that benefited the most from the substitution of natural gas by bioCH4 is Fossil resource scarcity (with an average improvement of about 76% compared to cogeneration), with savings ranging from 0.48 kg oil eq saved in S4 to 0.54 kg oil eq saved in S2. In the remaining impact categories, the total values are positive, thus indicating that the impacts generated by the treatment in the upgrading or in the cogeneration processes are higher than the benefits gained due to the avoided production of natural gas or to the energy recovery. Under this perspective, it is necessary to emphasize that the different routes that biogas may undertake generate environmental consequences strictly depending on the level of technologies used and that there is still considerable scope for improvement in the upgrading technologies.
Similar observations arise from the CED characterized impacts (Table 5): if bioCH4 is supposed to substitute natural gas, significant savings in non-renewable fossil energy are gained, achieving the highest value of 24.6 MJ saved in S2. In the case of the reference scenario (S0), the avoided production of electricity and heat allows savings in almost all the different types of energy sources considered, especially in the non-renewable fossil energy with 13.6 MJ saved.
For the upgrading technology based on membrane separation, that showed the highest environmental performance, Figure 2 shows the breakdown of the impacts generated from different steps in the conversion of biogas into bioCH4.
The share of biogas production is the highest in most impact categories, ranging from 41% of the impacts in Mineral resource scarcity up to 98% in Stratospheric ozone depletion. In the Global warming impact category, 46% of the impacts are caused by emissions locally released in the upgrading of biogas to bioCH4, whereas the contribution of the chemical plant achieves 55% in the Mineral resource scarcity category. The benefits derived from the avoided production of natural gas are particularly relevant in Fossil resource scarcity and Global warming impact categories, respectively amounting to −0.63 kg oil eq and −0.43 kg CO2 eq per m3 of biogas used.
In Figure 3 a network diagram summarizing the contribution of the different input flows involved in the production process of 1 m3 of biogas is displayed, with reference to the impact category of Global warming, the thickness of the arrows being proportional to the contribution to the investigated impact category, thus allowing to go through the different phases and to identify the most impacting input in each one. It becomes evident that the relevant impact ascribed to biogas production mainly depends on the anaerobic digestion of manure and, in particular, on the treatment of digester sludge in the municipal incinerator. A substantial environmental impact mitigation can be gained if the digestate is treated in such a way it can substitute fossil-based synthetic nitrogen and phosphate fertilizers. This result confirms that feedstock choice is important in management of biogas life-cycle impacts. Poeschl et al., for instance, calculated that biogas from straw feedstock could achieve up to a ten times higher impact reduction in Global warming compared to cattle manure [18]. Therefore, the composition of the mix of waste sources for biogas production may determine significant variations in all impact categories.
A direct comparison of the results achieved in this study with previous LCA literature is challenging, due to differences in the selection of FU, system boundaries, impact assessment methods and the modeled sources of avoided burdens and in the process yields which vary according to local conditions and technologies levels. Although most of the published bioCH4 LCA studies follow the ISO standards, the numerical results have to be evaluated against the background of their individual scope and implementation (system boundary, functional unit, allocation method, database, etc.). For instance, the system boundary defined by Ardolino et al. is in a way comparable to the one proposed in this paper, since it includes a biowaste-to-biomethane scenario and a biowaste-to-energy scenario, investigated by means of a system expansion to quantify the avoided burden [7]. However, in Ardolino et al. the assessment is tailored on an anaerobic digestion plant for the treatment of the organic fraction of municipal solid waste and, therefore, the selected functional unit is referred to the service provided by the plant, i.e., the treatment of 100 t/d of waste organic fraction obtained by MSW separate collection [7]. Moreover, the impact assessment method used is Impact 2002+, not allowing a comparison of calculated impacts but only of the overall picture of the environmental impacts and benefits from biogas upgrading. In such a wider framework, the production of bioCH4 always results cleaner than the production of energy in terms of non-renewable fossil energy, whereas the impact on global warming is susceptible to variability if the end use phase of bioCH4 (for example, in the road transport sector) is accounted for or not. When the system boundary is limited from cradle to gate (such as in the present study), more benefits in global warming are gained by the CHP scenario, since the production of diesel and the avoided emissions for its utilization are missed. As a consequence, some limits of this analysis can be deduced. Firstly, it would be helpful to include the end use phase of bioCH4, since it may replace different fossil fuels, depending on the achieved quality varying with the selected upgrading technology. In addition, due to the lack of reliable data, the CO2 separated from the upgrading technologies is treated as an emission to air in this study, thus neglecting the possible environmental advantages of CO2 recovery. However, these aspects may be addressed in future studies.
Several uncertainty sources, mainly linked to methodological choices, initial assumptions, such as allocation rules, system boundaries and impact assessment methods, as well as quality of the available data may affect the results of an LCA study [38]. For this reason, an uncertainty assessment is necessary to test the robustness of results. Table 6 shows the obtained results for each midpoint indicator related to the membrane upgrading technology, with the indication of mean, standard deviation (SD), coefficient of variation (Cv, defined as the ratio between the SD and the mean), standard error of the mean (SEM, defined as the standard deviation of the sampling distribution of the mean). A low variation of the values (Cv in the range of 5–51%) results for almost all the midpoint indicators (GW, SOD, TA, MRS, FRS), thus indicating that the data have good reliability [39]. The impact categories most affected by uncertainty (with higher Cv values) are FE, HT, WC. In particular, Water Consumption (WC) shows much larger values of Cv, thus requiring further studies about the assessment method for this category, to decrease the global uncertainty related to its impact calculation.

4. Conclusions

This study is aimed at assessing the environmental costs and benefits of different usages of biogas, comparing upgrading technologies for bioCH4 production with the conventional on-site cogeneration. The achieved results show a better environmental performance of the cogeneration option (S0) in most of the impact categories, whereas the membrane separation (S2) results less impactful than the other upgrading technologies. At the same time, the results highlight the benefits that can be gained in each impact category by means of substitution of natural gas with bioCH4. In both investigated routes, a significant share of impacts is generated by the fate of digestate produced as a co-product in the AD. Therefore, substantial savings in terms of environmental impacts can be obtained using the digestate as fertilizer, thus avoiding the impacts of fossil fertilizers. Moreover, differences among scenarios may be better evaluated including the end use phase of produced bioCH4: depending on the quality of bioCH4 products deriving from different upgrading technologies, different fossil fuels may be replaced with consequences on the investigated impact categories. Future investigations should be carried out that also include the environmental advantages of CO2 recovery from upgrading technologies and the most up-to-date available conversion technologies. Finally, the importance of site-specific data (such as local emissions or additional inputs related to CH4 preparation for the chosen use as liquefied fuel) is crucial, with a special focus on scaled-up industrial case studies in order to bridge the knowledge gap between laboratory tests and large-scale operations. If the economic aspects of bioCH4 production and utilization are also carefully evaluated, it would become possible to provide a useful tool for policy-makers in planning a greater share of renewable energy sources and shifting towards greater sustainability.

Author Contributions

The research topic was under the supervision of S.U., S.D. and L.E.; C.F. and J.G. collected data, G.F. and F.C. analyzed data by means of LCA. All authors commented results and contributed to writing and approved the final manuscript.

Funding

This research received no external funding.

Acknowledgments

G. Fiorentino, S. Ulgiati and F. Corcelli gratefully acknowledge the financial support received from the EU Project EUFORIE-European Futures for Energy Efficiency, funded EU Horizon2020 programme (649342), call identifier H2020-EE-2014-2-RIA, topic EE-12-2014, Socioeconomic research on energy efficiency. S. Ulgiati and S. Dumontet also acknowledge the financial support by the Sino-Italian, High Relevance Bilateral Project (Italian Ministry of Foreign Affairs and International Cooperation-MAECI).

Conflicts of Interest

The authors declare no conflict of interest.

References

  1. Collet, P.; Flottes, E.; Favre, A.; Raynal, L.; Pierre, H.; Capela, S.; Peregrina, C. Techno-economic and life cycle assessment of methane production via biogas upgrading and power to gas technology. Appl. Energy 2017, 192, 282–295. [Google Scholar] [CrossRef]
  2. Jury, C.; Benetto, E.; Koster, D.; Schmitt, B.; Welfring, J. Life cycle assessment of biogas production by monofermentation of energy crops and injection into the natural gas grid. Biomass Bioenergy 2010, 34, 54–66. [Google Scholar] [CrossRef]
  3. Lin, L.; Xu, F.; Ge, X.; Li, Y. Improving the sustainability of organic waste management practices in the food-energy-water nexus: A comparative review of anaerobic digestion and composting. Renew Sust. Energy Rev. 2018, 89, 151–167. [Google Scholar] [CrossRef]
  4. McCarty, P.L. The development of anaerobic treatment and its future. Water Sci. Technol. 2001, 44, 149–156. [Google Scholar] [CrossRef] [PubMed]
  5. Deublein, D.; Steinhauser, A. Biogas from Waste and Renewable Resources: An Introduction, 2nd ed.; John Wiley & Sons: Weinheim, Germany, 2011. [Google Scholar]
  6. Speece, R.E. A survey of municipal anaerobic sludge digesters and diagnostic activity assays. Water Res. 1988, 22, 365–372. [Google Scholar] [CrossRef]
  7. Ardolino, F.; Parrillo, F.; Arena, U. Biowaste-to-biomethane or biowaste-to-energy? An LCA study on anaerobic digestion of organic waste. J. Clean Prod. 2018, 174, 462–476. [Google Scholar] [CrossRef]
  8. Ricardo Energy and Evironment. The Role of Natural Gas and Biomethane in the Transport Sector. Report for Transport and Environment; Report No. ED 61479; Ricardo Energy and Evironment: Oxfordshire, UK, 2016. [Google Scholar]
  9. Gazzetta Ufficiale 2018. Available online: http://www.gazzettaufficiale.it/eli/id/2018/03/19/18A01821/SG (accessed on 29 December 2018).
  10. Cucchiella, F.; D’Adamo, I.; Gastaldi, M.; Miliacca, M. A profitability analysis of small-scale plants for biomethane injection into the gas grid. J. Clean Prod. 2018, 184, 179–187. [Google Scholar] [CrossRef]
  11. Franchetto, F. Nuovi Incentivi Biometano, Ecco il Decreto. Available online: http://www.nextville.it/news/3163 (accessed on 29 December 2018).
  12. CTI (Comitato Termotecnico Italiano). Biometano. Available online: https://www.cti2000.it/Bionett/SCHEDABiometano_ITA.pdf (accessed on 29 December 2018).
  13. Starr, K.; Gabarrell, X.; Villalba, G.; Talens, L.; Lombardi, L. Life cycle assessment of biogas upgrading technologies. Waste Manage 2012, 32, 991–999. [Google Scholar] [CrossRef]
  14. Berglund, M.; Börjesson, P. Assessment of energy performance in the life-cycle of biogas production. Biomass Bioenergy 2006, 30, 254–266. [Google Scholar] [CrossRef]
  15. Collet, P.; Hélias, A.; Lardon, L.; Ras, M.; Goy, R.A.; Steyer, J.P. Life-cycle assessment of microalgae culture coupled to biogas production. Bioresour. Technol. 2011, 102, 207–214. [Google Scholar] [CrossRef]
  16. Hijazi, O.; Munro, S.; Zerhusen, B.; Effenberger, M. Review of life cycle assessment for biogas production in Europe. Renew Sust. Energy Rev. 2016, 54, 1291–1300. [Google Scholar] [CrossRef]
  17. Pertl, A.; Mostbauer, P.; Obersteiner, G. Climate balance of biogas upgrading systems. Waste Manage 2010, 30, 92–99. [Google Scholar] [CrossRef] [PubMed]
  18. Poeschl, M.; Ward, S.; Owende, P. Environmental impacts of biogas deployment—Part II: Life cycle assessment of multiple production and utilization pathways. J. Clean Prod. 2012, 24, 184–201. [Google Scholar] [CrossRef]
  19. Cozma, P.; Wukovits, W.; Mămăligă, I.; Friedl, A.; Gavrilescu, M. Modeling and simulation of high pressure water scrubbing technology applied for biogas upgrading. Clean Technol. Environ. 2015, 17, 373–391. [Google Scholar] [CrossRef]
  20. Morero, B.; Rodriguez, M.B.; Campanella, E.A. Environmental impact assessment as a complement of life cycle assessment. Case study: Upgrading of biogas. Bioresour. Technol. 2015, 190, 402–407. [Google Scholar] [CrossRef] [PubMed]
  21. Morero, B.; Groppelli, E.; Campanella, E.A. Life cycle assessment of biomethane use in Argentina. Bioresour. Technol. 2015, 182, 208–216. [Google Scholar] [CrossRef] [PubMed]
  22. Leonzio, G. Upgrading of biogas to bio-methane with chemical absorption process: Simulation and environmental impact. J. Clean Prod. 2016, 131, 364–375. [Google Scholar] [CrossRef]
  23. Castellani, B.; Rinaldi, S.; Bonamente, E.; Nicolini, A.; Rossi, F.; Cotana, F. Carbon and energy footprint of the hydrate-based biogas upgrading process integrated with CO2 valorization. Sci. Total Environ. 2018, 615, 404–411. [Google Scholar] [CrossRef]
  24. Shanmugam, K.; Tysklind, M.; Upadhyayula, V.K. Use of liquefied biomethane (LBM) as a vehicle fuel for road freight transportation: A case study evaluating environmental performance of using LBM for operation of tractor trailers. Procedia CIRP 2018, 69, 517–522. [Google Scholar] [CrossRef]
  25. Guinée, J.B.; Gorrée, M.; Heijungs, R.; Huppes, G.; Kleijin, R.; de Koning, A.; van Oers, L.; Wegener Sleeswijk, A.; Suh, S.; de Udo, H.A.; et al. Life Cycle Assessment; An Operational Guide to the ISO Standards, Part 3: Scientific Background; Ministry of Housing, Spatial Planning and Environment (VROM) and Centre of Environmental Science (CML): The Hague, the Netherlands, 2001. [Google Scholar]
  26. ISO (International Organization for Standardization). Environmental Management—Life Cycle Assessment—Principles and Framework; Standard ISO14040; ISO: Geneva, Switzerland, 2006. [Google Scholar]
  27. ISO (International Organization for Standardization). Environmental Management—Life Cycle Assessment—Requirements and Guidelines; Standard ISO 14044; ISO: Geneva, Switzerland, 2006. [Google Scholar]
  28. European Commission (EC). Joint Research Center—Institute of Environment and Sustainability. International Reference Life Cycle Data System (ILCD) Handbook—General Guide for Life Cycle Assessment—Detailed Guidance, 1st ed.; Publications Office of the European Union: Luxembourg, 2010. [Google Scholar]
  29. Wernet, G.; Bauer, C.; Steubing, B.; Reinhard, J.; Moreno-Ruiz, E.; Weidema, B. The ecoinvent database version 3 (part I): Overview and methodology. Int. J. Life Cycle Assess 2016, 21, 1218–1230. [Google Scholar] [CrossRef]
  30. Cryopur. Available online: http://www.cryopur.com/it/ (accessed on 29 December 2018).
  31. Brightbiomethane. Available online: https://www.brightbiomethane.com/it (accessed on 29 December 2018).
  32. Sugiharto, A.; Sarto, S.; Hidayat, M. Dynamic performance of water scrubbing system in biogas purification. In Proceedings of American Institute of Physics (AIP) Conference; AIP Publishing: Melville, NY, USA, 2018; Volume 1977, p. 020056. [Google Scholar] [CrossRef]
  33. Hauser, M.J. Cost Evaluation and Life Cycle Assessment of Biogas Upgrading Technologies for an Anaerobic Digestion Case Study in The United States. Master’s Thesis, Norwegian University of Science and Technology (NTNU), Trondheim, Norway, June 2017. [Google Scholar]
  34. Jungbluth, N.; Chudacoff, M.; Dauriat, A.; Dinkel, F.; Doka, G.; Faist Emmenegger, M.; Gnansounou, E.; Kljun, N.; Schleiss, K.; Spielmann, M.; et al. Life Cycle Inventories of Bioenergy; Ecoinvent report No. 17; Swiss Centre for Life Cycle Inventories: Dübendorf, Switzerland, 2007. [Google Scholar]
  35. Pre Consultants. SimaPro 8 LCA Software: The Powerful Life Cycle Solution. 2017. Available online: http://www.pre.nl/ (accessed on 29 December 2018).
  36. Huijbregts, M.A.J.; Steinmann, Z.J.N.; Elshout, P.M.F.; Stam, G.; Verones, F.; Vieira, M.; Zijp, M.; Hollander, A.; van Zelm, R. ReCiPe2016: A harmonised life cycle impact assessment method at midpoint and endpoint level. Int. J. Life Cycle Assess 2017, 22, 138–147. [Google Scholar] [CrossRef]
  37. Frischknecht, R.; Jungbluth, N. Implementation of Life Cycle Impact Assessment Methods Final report Ecoinvent 2000; Swiss Centre for Life Cycle Inventories: Dübendorf, Switzerland, 2003. [Google Scholar]
  38. Cellura, M.; Longo, S.; Mistretta, M. Sensitivity analysis to quantify uncertainty in life cycle assessment: The case study of an Italian tile. Renew. Sustain. Energy Rev. 2011, 15, 4697–4705. [Google Scholar] [CrossRef]
  39. Beccali, M.; Cellura, M.; Iudicello, M.; Mistretta, M. Life cycle assessment of Italian citrus-based products. Sensitivity analysis and improvement scenarios. J. Environ. Manag. 2010, 91, 1415–1428. [Google Scholar] [CrossRef] [PubMed]
Figure 1. Schematic flowchart of the investigated system (the dotted line indicates the system boundary).
Energies 12 00718 g001
Figure 2. Breakdown of characterized impacts for different steps of the membrane upgrading technology (negative values = environmental credits).
Energies 12 00718 g002
Figure 3. Contribution of different inputs flow to the production of 1 m3 of biogas (referred to global warming impact category, with 4% graphical cut off). The thickness of the arrows is proportional to the contribution given.
Energies 12 00718 g003
Table 1. Life Cycle Inventory. Values are referred to the functional unit of 1 m3 of used biogas.
Biogas * use = 1 m3 F.U.
Inputs/OutputsUnitCogenerationUpgrading
CryoMembranePSAChemical ScrubbingHPWS
Inputs
Plant **#3.45 × 10−72.67 × 10−102.67 × 10−102.67 × 10−102.67 ×10−102.67 × 10⁻¹⁰
Lubricating oilkg6.67 × 10−4
ElectricitykWh 7.60 × 10−12.20 × 10−13.40 × 10−11.14 × 10−13.40 × 10⁻¹
HeatMJ 1.83
Waterkg 5.50 × 10−14.00
Monoethanolamine (MEA)kg 5.00 × 10⁻²
Output
CO2kg1.915.80 × 10−1 5.80 × 10−15.80 × 10−1
COkg1.12 × 10−3 5.80 × 10⁻¹ 5.80 × 10⁻¹
N2Okg5.76 × 10−5
CH4kg5.29 × 10−41.50 × 10⁻² 1.50 × 10−21.50 × 10−2
NOXkg3.44 × 10−4
NMVOCkg4.62 × 10−5 1.50 × 10⁻² 1.50 × 10⁻²
SO2kg5.88 × 10-43.70 × 10⁻⁴ 3.70 × 10−43.70 × 10−4
H2Skg 2.33 × 10⁻⁶ 2.33 × 10−62.33 × 10−6
Ammoniakg 3.70 × 10⁻⁴ 7.00 × 10−33.70 × 10−4
Acetaldehydekg 2.33 × 10⁻⁶ 1.84 × 10−12.33 × 10−6
ElectricityMJ6.56
HeatMJ11.27
BioCH4m3 6.20 × 10−16.30 × 10−16.20 × 10−16.30 × 10−16.30 × 10⁻¹
* CH4 content = 63% [24]; CH4 Lower Heating Value = 32.52 MJ/m3. ** For the cogeneration plant: electric energy conversion efficiency = 32%, thermal energy conversion efficiency = 55% [34].
Table 2. ReCiPe Midpoint (H) characterized total impacts calculated for the different conversion routes of biogas, with reference to a functional unit of 1 m3 of used biogas.
Impact CategoryUnitS0
Cogeneration
S1
Cryo
S2
Membrane
S3
PSA
S4
Chemical Scrubbing
S5
HPWS
GWkg CO2 eq5.70 × 10−11.161.091.111.271.11
SODkg CFC11 eq4.09 × 10−63.60 × 10−63.51 × 10−63.55 × 10−63.54 × 10−63.53 × 10⁻⁶
TAkg SO2 eq1.61 × 10−21.62 × 10−21.60 × 10−21.61 × 10−21.64 × 10−21.61 × 10⁻²
FEkg P eq7.14 × 10−48.77 × 10−48.01 × 10−48.21 × 10−48.01 × 10−48.20 × 10⁻⁴
HTkg 1,4-DCB eq1.551.991.911.941.931.93
MRSkg Cu eq1.62 × 10−33.00 × 10−32.76 × 10−32.82 × 10−32.76 × 10−32.84 × 10⁻³
FRSkg oil eq8.27 × 10−21.11 × 10−19.50 × 10−29.87 × 10−21.51 × 10−19.91 × 10⁻²
WCm31.31 × 10−21.97 × 10−21.52 × 10−21.63 × 10−21.52 × 10−22.04 × 10⁻²
Table 3. Cumulative Energy Demand (CED) characterized impacts calculated for different conversion routes of biogas, with reference to a functional unit of 1 m3 of used biogas.
Impact CategoryUnitS0 CogenerationS1
Cryo
S2 MembraneS3
PSA
S4 Chemical ScrubbingS5
HPWS
Non-renewable, fossilMJ3.795.074.354.536.914.54
Non-renewable, nuclearMJ1.175.362.433.061.943.10
Non-renewable, biomassMJ8.29 × 10−28.33 × 10−28.29 × 10−28.34 × 10−28.29 × 10−28.30 × 10⁻²
Renewable, biomassMJ1.091.231.161.181.201.18
Renewable, wind, solar, geothermalMJ2.97 × 10−21.23 × 10−15.94 × 10−27.31 × 10−25.40 × 10−27.44 × 10⁻²
Renewable, waterMJ1.40 × 10−11.625.94 × 10−18.14 × 10−14.10 × 10−18.31 × 10⁻¹
Table 4. ReCiPe Midpoint (H) characterized total impacts calculated through the avoided burden approach for the different conversion routes of biogas, with reference to a functional unit of 1 m3 of used biogas.
Impact CategoryUnitS0
Cogeneration
S1
Cryo
S2
Membrane
S3
PSA
S4
Chemical Scrubbing
S5
HPWS
GWkg CO2 eq−8.29 × 10−17.37 × 10−16.64 × 10−16.90 × 10−18.41 × 10−16.95 × 10−1
SODkg CFC11 eq3.31 × 10−63.11 × 10−63.01 × 10−63.05 × 10−63.04 × 10−63.05 × 10⁻⁶
TAkg SO2 eq1.13 × 10−21.52 × 10−21.50 × 10−21.52 × 10−21.54 × 10−21.51 × 10⁻²
FEkg P eq4.08 × 10−48.62 × 10−47.87 × 10−48.07 × 10−47.87 × 10−48.06 × 10⁻⁴
HTkg 1,4-DCB eq1.091.961.871.891.891.90
MRSkg Cu eq6.60 × 10−42.54 × 10−32.29 × 10−32.36 × 10−32.30 × 10−32.38 × 10⁻³
FRSkg oil eq−2.96 × 10⁻¹−5.14 × 10⁻¹−5.40 × 10⁻¹−5.26 × 10⁻¹−4.84 × 10⁻¹−5.15 × 10⁻¹
WCm3−2.95 × 10−32.01 × 10−21.56 × 10−21.66 × 10−21.56 × 10−22.08 × 10−2
Table 5. Cumulative Energy Demand (CED) characterized impacts calculated through the avoided burden approach for different conversion routes of biogas, with reference to a functional unit of 1 m3 of used biogas.
Impact CategoryUnitS0 CogenerationS1
Cryo
S2 MembraneS3
PSA
S4 Chemical ScrubbingS5
HPWS
Non-renewable, fossilMJ−1.36 × 101−2.34 × 101−2.46 × 101−2.40 × 101−2.20 × 101−2.35 × 101
Non-renewable, nuclearMJ−1.515.312.383.011.893.06
Non-renewable, biomassMJ7.98 × 10−28.32 × 10−28.28 × 10−28.33 × 10−28.28 × 10−28.29 × 10⁻²
Renewable, biomassMJ−4.49 × 10−11.231.161.181.191.17
Renewable, wind, solar, geothermalMJ−7.49 × 10−11.18 × 10−15.45 × 10−26.83 × 10−24.91 × 10−26.97 × 10−2
Renewable, waterMJ−1.901.605.74 × 10−17.94 × 10−13.90 × 10−18.12 × 10⁻¹
Table 6. Results of Monte Carlo uncertainty analysis related to the membrane upgrading technology.
Impact CategoryUnitMeanMedianSDCv (%)SEM
GWkg CO2 eq1.091.086.37 × 10−25.832.01 × 10−3
SODkg CFC-11 eq3.42 × 10−62.87 × 10−61.76 × 10−651.475.57 × 10−8
TAkg SO2 eq1.60 × 10−21.57 × 10−22.63 × 10−316.388.30 × 10−5
FEkg P eq6.95 × 10−42.71 × 10−41.89 × 10−3272.095.98 × 10−5
HTkg 1,4-DCB eq1.911.034.70367.441.49 × 10−1
MRSkg Cu eq2.80 × 10−32.60 × 10−38.23 × 10−429.412.60 × 10−5
FRSkg oil eq9.51 × 10−29.38 × 10−21.01 × 10−210.603.19 × 10−4
WCm33.02 × 10−26.52 × 10−24.38 × 10−11453.501.39 × 10−2

