Energy, CO2, and AQI Efficiency and Improvement of the Yangtze River Economic Belt


1
Business School, Hohai University, Focheng West Road No. 8, Nanjing 211100, China
2
School of Business Administration, Hohai University, Jinling North Road No. 200, Changzhou 213022, China
3
Department of Economics, Soochow University 56, Kueiyang St., Sec. 1, Taipei 10048, Taiwan
*
Author to whom correspondence should be addressed.
Energies 2019, 12(4), 647; https://doi.org/10.3390/en12040647
Submission received: 20 January 2019
/
Revised: 12 February 2019
/
Accepted: 13 February 2019
/
Published: 17 February 2019
Abstract
:With the rapid development of its economy, environmental governance is becoming more important in China. The Yangtze River Economic Belt (YREB), as the world’s largest inland shipping channel, can lead the country’s regional green economy development. As most research on China’s environmental efficiency focuses on provinces or the east and west regions, this paper examines its energy input and output and environmental effects from the aspects of YREB and non-YREB, breaking through the limitations of previous studies that only used cross-section or panel data for environmental assessment. This paper employs the meta-frontier dynamic SBM model, selects fixed assets as carry-over indicators, and considers the interrelationships between the dynamics variables during 2014–2016. The results are as follows: The overall energy efficiency and CO2 emission efficiency of YREB are higher than those of non-YREB. The difference in energy consumption, CO2, and AQI efficiency is large, but the performance of YREB is generally better than that of non-YREB. After setting the meta-frontier, non-YREB is better than YREB, for the main reason that the technology gap values of YREB are smaller than those of non-YREB. Our findings thus suggest that YREB should strengthen technical exchanges and promotion within its region, thereby decreasing regional technology differences, while non-YREB should address environment protection and CO2 emissions and advocate a low-carbon production mode.
1. Introduction
China’s government and its citizens have gradually become more and more concerned about the environment in recent years. However, the results of China’s efforts at environmental governance are not significant. According to the Ministry of Environment and Ecology, in 2017, the Air Quality Index (AQI) of 239 cities was greater than 100, with 70.7% of cities having air pollution exceeding the standard, while 99 cities’ AQI was between 0–100. It is clear that China needs to put forth much greater efforts to improve domestic air quality.
The Yangtze River Economic Belt (YREB) covers a broad economic area that borders China’s largest river. In 2016, the Yangtze River’s shipping volume was four times the amount on the Mississippi River and six times that on the Rhine. YREB has rich resources, convenient water and land transportation, and dense urban areas, and plays an important role in promoting economic development and green development. From 2014 to 2016, the China government issued the “Guiding Opinions on Promoting the Development of the Yangtze River Economic Belt Based on the Golden Waterway” and the “Outline of the Development Plan of the Yangtze River Economic Belt” to raise the development of YREB to the national level.
The upper reaches of the Yangtze River Basin in China include important places for nuclear power, hydropower, and heavy equipment. The lower reaches of the Yangtze River Delta encompass regions with the best industrialization, urbanization, and economic development in the country, especially for Shanghai, Jiangsu, and Zhejiang, which are very internationally competitive. The China government has clearly pointed out that the construction of YREB must maintain green development and ecological protection.
Most early environmental efficiency research studies examined environmental pollution and energy efficiency, using CO2 (instead of AQI) as the environmental variable and static DEA as the main analytical method. While dynamic analysis is based on the Malmquist Productivity Index (MPI) model, it cannot describe the continuity between years. Regardless of dynamic or static DEA environmental and energy analysis, most research assumes that each region has the same level of economic development and resource endowment, but neglecting regional or economic development differences results in measurement biases. The present paper is the first to examine the relationship between economic development, energy input and output, and environmental effects from the aspects of YREB and non-YREB, covering 30 provinces and cities. We break through the problems of previous research that focused on static analysis and which lacked carry-over variables over time under dynamic analysis. Considering regional differences, this paper evaluates environmental efficiency by the meta-frontier dynamic SBM model, and by considering the relationships between the variables and the dynamics over the years, we can solve the problem of long-term regional differences. Most researchers use GDP and CO2 as output indicators and do not fully consider the impact of energy use on the environment. Thus, another innovation of this paper is to select AQI, CO2, and technical gap values as the evaluation indicators for environmental efficiency.
2. Literature Review
As China’s society continues to develop, economic development is shifting from pursuing quantity to pursuing quality, with a gradually greater focus on resource utilization efficiency and environmental impacts (Tang [1]). Zhou et al. [2], Lv et al. [3], Song et al. [4], Wang et al. [5], Wu et al. [6], Wu et al. [7], and Guo et al. [8] used different methods and indicators to evaluate energy efficiency. The main input indicators were labor, energy use, and capital, and the output variables were mostly GDP. Baležentis et al. [9] showed that the coefficient associated with GDP decreases when renewables are included in the Environmental Kuznets Curve model.
Research has gradually recognized the importance of environmental effects in economic development and has begun to introduce relevant indicators (CO2, SO2) for environmental assessment from two main research perspectives. First, studies employ environmental indicators as output variables (results) to assess energy effects, such as in Wang et al. [10], Wang and Feng [11], and Guo et al. [12]). Chen et al. [13] showed that tourism volume was the main driving force behind the increase in tourism-related carbon emissions with the logarithmic mean Divisia index (LMDI) and simultaneous equations. Miao et al. [14] showed that sewage discharge free-of-charge water use and leakage are the crucial variables that constitute major contributions to the overall inefficiency value associated with urban water use. Second, others, such as Jia and Liu [15], utilize environmental indicators like CO2, SO2, and energy consumption as input variables to explore their impact on economic output. These studies’ indicators are relatively simple and do not fully reflect the economic development and environmental impact due to energy use. For any environmental efficiency assessment, one cannot just ignore air quality and environmental quality. However, scholars generally only analyze AQI itself (Zeng et al. [16], Heidarinejad [17], Gu and Liu [18]), with few focusing on the air quality index (AQI) and energy efficiency. Using the improved dynamic SBM model, Li et al. [19] analyzed the energy efficiency and AQI efficiency of 31 cities in China from 2013 to 2016, taking energy consumption, employees, and government expenditures as inputs; GDP (desirable) and AQI (undesirable) as outputs; and assets as the carry-over variable to assess intertemporal efficiency from one period to the next period. This paper offers further innovation in the literature by embedding AQI and technology gap variables into the meta-frontier dynamic SBM model to conduct an efficiency evaluation.
For the assessment of energy efficiency, most research studies utilize data envelopment analysis (DEA) models (such as DEA, Malmquist index, and Tobit model (Lv et al. [3]); SBM-DEA (Choi et al. [20]); DEA: Multi-directional Efficiency Analysis (MEA) (Wang et al. [21]); DEA-VRS (complete and window analyses) and Tobit regression (Zhang et al. [22]); and DEA-Luenberger productivity index (Chang and Hu [23])). For static models, Wang et al. [24]) used small cities’ data in 2008 in non-radial DEA to assess energy performance, by considering the differences among Chinese cities. Discussing the potential for energy conservation and emission reduction, they provided a theory for achieving China’s 2020 energy conservation and emission reduction targets. Yao et al. [25] offered detailed information on the energy efficiency and carbon emissions performance in 2011, helping to overcome bias in energy and carbon performance evaluation. Yan et al. [26] used the non-radial Malmquist productivity index, which was adapted to model the changes in 3E productivity during 2011–2013 for the 30 Chinese administrative regions. Miao et al. [27] employed the slack-based measure method and an extended Luenberger productivity indicator to estimate and decompose the atmospheric environmental performance.
For dynamic analysis, Wang et al. [28] took the improved DEA model and considered desirable and undesirable outputs and energy and non-energy inputs in order to assess regional energy efficiency in China in 2013. Wang et al. [29] designed a new all factor energy efficiency indicator to explain the heterogeneity of production technologies in various provinces of China, showing that the difference in energy efficiency and production technology between 29 provinces from 2001 to 2010 is very significant. Guo et al. [12] addressed the efficiency assessment of regional energy conservation and emission reduction and constructed an input and output selection evaluation index system to measure energy savings and emission reduction in 30 provinces of China from 2011 to 2012. However, most of these works in the literature have the following two problems: (1) they simply consider the trend of the data, but fail to describe the interrelationships between the years; and (2) their comparability between different indicators is weak, along with a lack of overall indicators to evaluate various factors. Although Wang et al. [30] proposed the concept of comprehensive indicators, it was still limited to static models.
In terms of research samples in the literature, Apergis [31] selected OECD member countries, Chang [32] employed 27 EU members, Song et al. [4] researched energy efficiency and carbon emissions in BRICS, Cui [33] selected nine countries, Zhang et al. [22] looked at 23 developing countries, Choi et al. [20] utilized panel data from 30 provinces in China, and Honma and Hu [34] used data on 47 regions in Japan. For research on China’s resource utilization efficiency and environmental efficiency, most scholars use provincial panel data, such as Wei et al. [35], Jia and Liu [15], Wang et al. [21], Wu et al. [6], Shen et al. [36], Li and Lin [37], Zou et al. [38], and Guo et al. [12]. For research on regions, Tang [1] divided China into eastern, central, and western regions to study the input-output efficiency of resources from 2000 to 2015. As one can see, the literature has not considered samples separated into YREB and non-YREB, and thus we employ these two regions as the research object.
3. Methods
3.1. Dynamic DEA
Data envelopment analysis is based on the concept of the Pareto optimal solution, using linear programming to assess the relative efficiency of a decision making unit (DMU). Charnes et al. [39] provided the CCR model in 1978 that extended Farrell’s theory to multiple inputs and outputs, naming it data envelopment analysis (DEA). Banker et al [40] proposed the BCC model in 1984 based on variable returns to scale (VRS). Tone [41] introduced the slack-based measure (SBM) and used non-radial models to deal with slacks in each input/output. The SBM model adds non-radial slacks and can avoid the question of radial proportionality.
To evaluate the efficiency for multiple carry-over periods, Färe and Grosskopf [42], Bogetoft et al. [43], Chen [44], Nemoto and Goto [45,46], and Park and Park [47] proposed putting the effect of internal linkages into Dynamic DEA. Tone and Tsutsui [48] extended the model to the Dynamic Slack-Based Measures (SBM) model and next proposed the weighted Dynamic SBM model. The Dynamic SBM model is divided into input-oriented, output-oriented, and non-oriented types.
Tone and Tsutsui [48] did not consider undesirable output and regional differences; thus, this paper uses a modified meta-frontier dynamics slack-based measure model. The model is introduced in the following section.
3.2. The Modified Meta-frontier Dynamic Slack-Based Measures (SBM) Model
This study utilizes panel data collected from 30 provinces in China, which represent the most developed cities within the Yangtze River Economic Belt (YREB) (11 provinces in total) and non-Yangtze River Economic Belt (non-YREB) (19 cities in total). Among them, we employ six variables: two are input variables, three are outputs variables, and one is a carry-over variable. The input variables are employees and energy consumed; the output variables are GDP (desirable), AQI (undesirable), and CO2 (undesirable); and the carry-over variable is fixed assets. The structure of dynamic DEA is in the Figure 1.
Since this study considers undesirable output and regional differences in the dynamic SBM model, we can modify Tone and Tsutsui’s [48] dynamic SBM model (See Appendix A) to make it the undesirable output in the meta-frontier dynamic SBM model. Battese and Rao [49] and Battese et al. [50] proposed a meta-frontier model that can be compared with the technical efficiency of different groups. O’Donnell et al. [51] set up a meta-frontier model that can accurately calculate the meta-frontier efficiencies and group efficiencies. However, most of DEA usually assumes that all DMUs have the same level of technology, but the assessed DMUs are often in different geographical locations or under different national policies, resulting in different technology levels. Therefore, based on the Tone and Tsutsui [48] Dynamic SBM, the O’Donnell et al. [51] meta-frontier model, and undesirable output, we set up the model as follows:
(1) Meta-frontier (MF)
We assume all units (N) are composed of DMUs in g groups (N = N1 + N2 + … + NG); ysj and xij indicate output item s (s = 1, 2, …, S) of item j (j = 1, 2, …, N) and input item i (i = 1, 2, …, m); Z indicates desirable carryover (i = 1, 2, …, n); g is desirable output; and b is undesirable output of item j (j = 1, 2, …, N) under the meta-frontier. The meta-frontier k of DMU efficiency can be solved by the following linear programming (LP):
Using Equations (1) and (2), we can find the overall technical efficiency (OTE) value of all DMUs under the meta-frontier model.
(2) Group-frontier (GF)
Each DMU under the group frontier chooses the most favorable final output weighted, so that the efficiency of the DMUs under the group frontier can be solved by the following equation:
(3) Technology gap ratio (TGR)
Since the meta-frontier model contains g groups, the technical efficiency of the meta-frontier (MFE) will be less than the technical efficiency of the group frontier (GFE). The ratio value, called the technology gap ratio (TGR), is shown as:
3.3. Energy, AQI, and CO2 Efficiencies
This paper follows the Hu and Wang [52] total-factor energy efficiency index to overcome any possible bias in the traditional energy efficiency indicators. There are three key features of this study: energy efficiency, AQI efficiency, and CO2 efficiency. In this study, we note that i represents area and t represents time.
By definition, energy efficiency is the ratio of target energy input to actual energy input. AQI or CO2 efficiency is the ratio of target AQI or CO2 undesirable output to actual AQI or CO2 undesirable output. The energy and AQI or CO2 efficiency models are defined as:
If the target energy input is equal to the actual input level, then the energy efficiency equals 1, representing efficiency. If the target energy input is less than the actual input level, then the energy efficiency is less than 1, representing inefficiency.
If target AQI or CO2 undesirable output is equal to the actual AQI or CO2 undesirable output level, then the AQI or CO2 efficiency equals 1, representing efficiency. If target AQI or CO2 undesirable output is less than the actual AQI or CO2 undesirable output level, then the AQI or CO2 efficiency is less than 1, representing inefficiency.
4. Results and Discussion
4.1. Data and Variables
This study uses panel data for 30 provinces that represent most provinces of China (except for Xizang). We collected data for 2014–2016 from the Statistical Yearbook of China [53], Demographics and Employment Statistical Yearbook of China, and Statistical Yearbooks from all cities [54]. We took air pollutants data from China Environmental and Protection Bureau reports [55]. Input, output, and carry-over variables are as follows.
Input variables:
- Labor input (em): number of employees in each city at year-end. Unit: persons.
- Energy consumed (com): total energy consumed in each province. Unit: 100 million.
Output variable:
- Desired output (GDP): each province’s GDP is taken as its output. Unit: 100 million RMB.
- Undesired output:
- AQI: Air Pollution Index; the pollutants in the evaluation are SO2, NO2, PM10, PM2.5, O3, CO, and six other items. Unit: μg/m3.
- CO2: data on CO2 emissions for each city are estimated from the energy consumption breakdown by each fuel category.
Carry-over variables:
- Fixed assets: capital stock of each city is calculated by fixed asset investment of each province. Unit: 100 million RMB.
This study divides the 30 sample provinces into two regions: Yangtze River Economic Belt (YREB) (11 provinces in total) and non-Yangtze River Economic Belt (non-YREB) (19 cities in total). YREB includes Anhui, Chongqing, Guizhou, Hubei, Hunan, Jiangsu, Jiangxi, Shanghai, Sichuan, Yunnan, and Zhejiang; non-YREB includes Beijing, Fujian, Gansu, Guangdong, Guangxi, Hainan, Hebei, Heilongjiang, Henan, Jilin, Liaoning, Neimenggu, Ningxia, Qinghai, Shandong, Shanxi, Shaanxi, Tianjin, and Xinjiang.
4.2. Input-output Indicator Statistics
The column of “Input variables” in Table 1 illustrates numerical analyses of labor, energy, and fixed assets. From 2014 to 2016, the average, maximum, and minimum values of labor do not change a lot. While there is a large difference in labor between provinces, there is no narrowing trend. Average energy consumption presents a decreasing trend from 2014. The maximum value of energy input has increased year by year, the difference in energy consumption between provinces is large, and the standard deviation displays no significant change. The average, maximum, minimum, and standard deviation of fixed assets are all increasing year by year. Capital investment in the provinces is increasing, while the gap among the provinces is gradually widening.
The column of “output variables” in Table 1 shows data statistics for the output variables GDP, CO2, and AQI. GDP increases year by year from 2014 to 2016. While maximum GDP growth is obvious, the minimum value changes little, and the standard deviation increases year by year. There is a large gap in GDP growth and a clear imbalance in regional development. The mean and minimum value changes of CO2 emissions are small, and the maximum value and standard deviation increase year by year. The average value of AQI from 2014 to 2016 decreases year by year, with the maximum value being the smallest in 2015. The standard deviation also decreases year by year. The AQI gap among provinces is narrowing.
4.3. Results
This study uses MAXDEA 7.0 to evaluate the energy consumption and AQI emission efficiency of 30 provinces in China. First, we calculated the total energy consumption, air pollutant emissions, and dynamic environmental efficiency scores of all provinces. Second, according to the division into YREB and non-YREB, we calculated the dynamic efficiency values of the two regions separately. Finally, we compared the efficiency values of each province in a region with the efficiency values in all provinces. This ratio provides room for improvement in environmental efficiency for each province.
Table 2 shows the overall efficiency scores and ranks for energy and air pollutant emissions in the 30 provinces from 2014 to 2016. The provinces of YREB are marked in red, while the others are non-YREB provinces.
Beijing, Guangdong, Hunan, Jiangsu, Neimenggu, Shandong, Shanghai, and Tianjin have energy efficiency values of 1, indicating that these cities have a higher energy output efficiency. Hunan, Shanghai, and Jiangsu are cities of YREB, while Beijing, Guangdong, Neimenggu, Shandong, and Tianjin are non-YREB cities. Gansu, Xinjiang, Ningxia, and Shanxi scores are low, indicating a poor energy consumption efficiency.
The provinces with increased efficiency scores are Fujian, Guizhou, Jilin, Liaoning, Qinghai, Sichuan, and Yunnan. Within YREB, Sichuan has the largest increase, from 0.62 in 2014 to 0.76 in 2016, representing an increase of 22.6%. Guizhou and Yunnan experience a small rise, with an efficiency increase of 0.04. Within non-YREB, the scores of Fujian, Jilin, Liaoning, and Qingha increase slightly.
More provinces show a decline in efficiency scores. Within YREB, Anhui, Hubei, Jiangxi, and Zhejiang respectively fall by 4.51%, 4.56%, 9.03%, and 8.96%. Chongqing’s efficiency scores fluctuate, with increases in 2014–2015, decreases in 2015–2016, and an overall drop of 1.47%. Within non-YREB, Xinjiang, Gansu, Hainan, Hebei, and Shaanxi respectively experience a large drop of 22.52%, 17.2%, 13.14%, 13.65%, and 11.39%. Heilongjiang, Henan, and Ningxia also fall between 4% and 7%. Shanxi has the lowest overall efficiency score, ranking last, and its overall efficiency score also decreases year by year.
The overall efficiency of energy consumption in YREB is generally higher than that in non-YREB. Except for Zhejiang, Jiangxi, Hubei, Chongqing, and Anhui, the provinces within YREB all rank better. Within YREB, Shanghai, Hunan, and Jiangsu have the highest overall energy efficiency at 1. The overall efficiencies of Zhejiang, Anhui, Jiangxi, and Yunnan are low and need improvement.
Beijing, Guangdong, Neimenggu, Shandong, and Tianjin have overall efficiency scores of 1, meaning these provinces have a higher resource utilization efficiency. However, some provinces in 2016, such as Gansu (0.24), Ningxia (0.25), Shanxi (0.21), and Xinjiang (0.21), have an overall efficiency score below 0.5. The overall efficiencies of Xinjiang, Shaanxi, Shanxi, Ningxia, Henan, Heilongjiang, Hebei, Hainan, and Gansu show a downward trend.
Table 3 lists the energy consumption scores of AQI and CO2 from 2014 to 2016. Beijing, Guangdong, Hunan, Jiangsu, Neimenggu, Shandong, Shanghai, and Tianjin’s energy consumption, AQI, and CO2 efficiency scores reach 1, indicating that these provinces have a high energy consumption efficiency and good air quality. Gansu, Guizhou, Hebei, Heilongjiang, Jilin, Ningxia, Shanxi, Shaanxi, Xinjiang, and Yunnan have lower energy efficiency, AQI, and CO2 efficiency scores (below 0.4).
In terms of energy consumption, Hunan, Jiangsu, and Shanghai score the highest in YREB at 1. Anhui, Chongqing, Guizhou, and Yunnan scores are less than 0.5. From 2014 to 2016, the efficiency scores of energy consumption in Sichuan and Yunnan increase rapidly by 20.4% and 24.6%, respectively. The energy consumption scores of Hubei, Jiangxi, Zhejiang, and Xinjiang show a downward trend. In non-YREB, the gap in energy consumption is wide, with a score difference up to 0.91. Beijing, Guangdong, Neimenggu, Shandong, and Tianjin have energy consumption efficiency scores of 1, indicating that these provinces have a higher energy efficiency. Gansu, Heilongjiang, Ningxia, Shanxi, Shaanxi, and Xinjiang scores are lower, with a minimum score of only 0.09. Among non-YREB, the energy consumption scores of Gansu, Hainan, Heilongjiang, Ningxia, Shaanxi, and Xinjiang decrease respectively by 17.95%, 21.82%, 17.30%, 18.53%, 19.22%, and 30.88%. The energy consumption scores of Guangxi, Liaoning, and Qinghai increase. Liaoning has the largest increase, reaching 36.39%, indicating that its energy efficiency has significantly improved.
From the air quality index (AQI) scores, the YREB provinces of Hubei, Hunan, Jiangsu, and Shanghai score higher, indicating that they have a better air quality. Among them, Hunan, Jiangsu, and Shanghai have scores of 1 in each year, exhibiting a good air quality. The AQI scores of Anhui and Zhejiang decrease year by year, with declines reaching 29.38% and 31.35%, respectively, while Chongqing’s increases by 24.87%. Although Jiangxi’s AQI score declines in 2015, it increases by 20.21% in 2016 compared to 2014. Sichuan’s AQI score shows the largest increase, from 0.49 in 2014 to 0.81 in 2016, representing an increase of 62.08%. Within non-YREB, Beijing, Guangdong, Neimenggu, Shandong, and Tianjin’s AQI scores are 1. Hainan, Hebei, Shanxi, and Xinjiang’s AQI scores drop significantly, with Hainan falling from 0.39 in 2014 to 0.31 in 2016, representing a decrease of 19.39%. Hebei’s AQI score moves higher in 2014. After a sharp decline in 2015, it rebounds slightly in 2016, but the overall decline is 56.27%. The AQI scores of Shanxi and Xinjiang decline year by year, with decreases of 36.79% and 36.60%, respectively. The AQI scores of Fujian, Heilongjiang, Henan, Jilin, and Liaoning increase, with Jilin having the largest growth rate of 22.59%. The improvement of air quality in these provinces is good.
In terms of CO2 efficiency, the scores for regions in YREB increase. In non-YREB, the CO2 scores increase in some provinces, but decline in most provinces. YREB is generally better than non-YREB in terms of the CO2 scores. Within YREB, Hunan, Jiangsu, and Shanghai have CO2 scores of 1, indicating that CO2 emissions from these provinces can reach the provincial standard. The CO2 scores of Anhui, Guizhou, Sichuan, and Yunnan increase year by year. In 2014, Yunnan’s score increase by 24.50%, and Sichuan’s score increases by 20.41%. Chongqing, Hubei, Jiangxi, and Zhejiang’s scores all decrease. Chongqing’s CO2 score drops year by year, falling by 0.09 to 2016, representing a decrease of 17.17%. Among the non-YREB provinces, Beijing, Guangdong, Neimenggu, Shandong, and Tianjin have CO2 scores of 1. The scores of Guangxi, Liaoning, and Qinghai increase by 22.65%, 60.46%, and 22.98%, respectively. The CO2 scores of Fujian, Hebei, and Henan also increase, but their growth rates are relatively small. There are more provinces in non-YREB that have low CO2 scores. Gansu, Hainan, Heilongjiang, Ningxia, Shanxi, Shaanxi, and Xinjiang show relatively large declines, reaching 17.95%, 21.82%, 17.30%, 18.52%, 11.28%, 19.22%, and 30.88%, respectively.
Figure 2 shows the distribution of AQI and CO2 mean values in YREB and non-YREB from 2014 to 2016. The internal differences in the AQI and CO2 average values for non-YREB are greater than those in YREB. The trends of AQI and CO2 in YREB are almost the same, while the differences between AQI and CO2 are small. The difference between the average scores of AQI and CO2 in non-YREB is large. Shaanxi presents the biggest difference, with a CO2 mean value close to 0 and AQI mean value of 0.98. The differences in Shanxi, Liaoning, and Heilongjiang are also large. Conversely, the differences between the AQI scores and CO2 scores in YREB are small. Non-YREB displays a large difference in CO2 efficiency scores, but the difference in AQI scores is relatively small. Compared to YREB, the difference in AQI scores for non-YREB is large.
Figure 3 shows the changes in efficiency scores and the mean values of AQI for YREB and non-YREB from 2014 to 2016. The changes in the AQI mean values are generally consistent with the changes in the CO2 efficiency scores. The changes in the CO2 efficiency scores of YREB are smaller than those of non-YREB, and the CO2 efficiency scores of most regions rose from 2014 to 2016. Guangxi, Liaoning, Fujian, and Qinghai in non-YREB and Sichuan and Yunnan in YREB all have higher scores.
Beijing, Guangdong, Neimenggu, Shandong, and Tianjin in YREB and Shanghai, Jiangsu, and Hunan in non-YREB have CO2 efficiency scores of 1. Guizhou and Yunnan in YREB and Gansu, Hebei, Heilongjiang, Jilin, Henan, Ningxia, and Shanxi in non-YREB have low CO2 scores of below 0.4. The number of provinces with low CO2 scores in YREB is fewer than the number in non-YREB.
There are 11 provinces with reduced CO2 efficiency scores, including Chongqing, Hubei, and Jiangxi in YREB and Gansu, Hainan, Heilongjiang, Jilin, Ningxia, Shaanxi, and Xinjiang in non-YREB. Xinjiang’s CO2 score has the largest drop of 30.8%, Hainan’s decline reaches 21.8%, Chongqing falls by 17.2%, and Gansu decreases by 17.9%. The CO2 score of Shaanxi in 2016 is 19.2% lower than that of 2014. The declines of Heilongjiang and Ningxia are both over 15%.
Table 4 shows the technology gap and ranks for each region. The regions with no technology gap from 2014 to 2016 are Beijing, Guangdong, Hunan, Jiangsu, Neimenggu, Shandong, Shanghai, and Tianjin, comprising five regions in non-YREB and three in YREB. The technology gaps of the observed regions are mostly higher than 0.9, and only Zhejiang in YREB is below 0.9.
The technology gaps of Anhui, Fujian, Guangzhou, Henan, Hubei, Jiangxi, Liaoning, Ningxia, and Zhejiang are all decreasing along with their ranks. The technology gaps of Anhui and Hebei drop respectively by 2.44% and 3.37% in 2014, indicating that their actual technology evaluation value is far from the target value. Gansu, Guizhou, Hainan, Hebei, and Jilin have higher technology gaps. In 2016, their technology gaps rose by 1.50%, 5.98%, and 1.39% versus 2014, respectively.
The mean value of the technology gaps in non-YREB is greater than that of the provinces in YREB. After setting the meta-frontier, the technology gap of YREB is not far from the frontier. Moreover, the standard deviation in the technology gap of YREB is 0.9971, or greater than 0.9948 for non-YREB. This shows evidence of greater intra-regional differences.
Table 5 Lists the Wilcoxon test scores for the average technology gaps. In 2014–2016, the average gap of YREB and the average gap of non-YREB both pass the significance test.
5. Conclusions
From above analysis, we present the following notable findings:
1. The total efficiency of energy utilization in YREB is higher than that in non-YREB, and regional differences are more obvious;
2. In terms of energy consumption, CO2, and AQI efficiency, YREB is better than non-YREB. YREB has fewer provinces with a lower energy consumption, CO2, and AQI efficiency. The number of low-score regions in non-YREB is large, and the scores of many provinces there are decreasing year by year;
3. The changes in AQI mean values and CO2 scores are the same in YREB and non-YREB. However, the changes in CO2 efficiency scores in YREB are smaller than those in non-YREB. Furthermore, YREB has a better CO2 efficiency performance than non-YREB;
4. After setting the meta-frontier, non-YREB is better than YREB for two main reasons: the technology gap values of non-YREB are smaller than those of YREB, and the standard deviations of these values for non-YREB are smaller than those of YREB. Therefore, YREB should address the unbalanced development within its region.
This paper offers the following policy suggestions to central and regional governments and related authorities.
The non-Yangtze River Economic Belt should learn from YREB in terms of energy efficiency, emission reduction, and ecological restoration. Non-YREB should also adjust its economic structure and energy structure, focus more on talent recruitment, and develop new technologies to improve the overall energy efficiency.
Non-YREB economies, especially those in the three northeastern provinces, should greatly restrict high-pollution and high-emission industries and change the economic growth mode away from an over-reliance on resources. These three provinces should also cultivate energy-saving and environmental protection industries and look to narrow their gap with YREB.
The non-Yangtze River Economic Belt should also set up better methods for CO2 emissions reduction and advocate low-carbon production technologies. The government should encourage the development and use of new energy sources such as solar energy, tidal energy, hydro energy, and wind energy through new policies and tax abatement.
There is a large technology gap between the provinces in YREB, especially for Zhejiang, Sichuan, and Guizhou. It indicates that these provinces have low levels of technological development and should comprehensively upgrade the skills and talents of their overall labor force.
Author Contributions
Conceptualization, F.-R.R. and Y.-H.C.; Methodology, F.-R.R.; Software, Y.-H.C.; Validation, F.-R.R., Y.-H.C., and T.-Y.L.; Formal Analysis, F.-R.R.; Investigation, Y.-H.C.; Resources, F.-R.R.; Data Curation, F.-R.R.; Writing-Original Draft Preparation, F.-R.R.; Writing-Review & Editing, F.-R.R.; Visualization, T.-Y.L.; Supervision, Y.-H.C.; Project Administration, Z.T.; Funding Acquisition, Y.-T.S.
Funding
This study was supported by the project of basic scientific research expense of central university (2018B32214).
Conflicts of Interest
The authors declare no conflict of interest.
Appendix A
Tone and Tsutsui [43] set up n DMUs (j = 1, 2, …, n) over T periods (t = 1, 2, …, T). The DMUs have multiple inputs and outputs in each term, with the z (I = 1…n1) as a carry-over from period t to period t + 1. The carry-over is presented by Equation (A1):
Here, the symbol α shows the desirable (discretionary, non-discretionary, undesirable). Non-oriented overall efficiency (δ*) is calculated by Equation (A2), and ωt and ωi are the weights to period t and the input i.
The non-oriented period efficiency (ρ*) follows below.
where desirable indicates desirable carry-over that continues to the next term, undesirable indicates undesirable carry-over that continues to the next term, discretionary means that the DMU is flexible to change carry-over, and non-discretionary means that DMU cannot change carry-over.
References
- Tang, Z. Evaluation on Chinese provincial resource input and environmental output efficiencies from 2000 to 2015. Geogr. Res. 2018, 37, 1515–1527. [Google Scholar]
- Zhou, D.Q.; Meng, F.Y.; Bai, Y. Energy efficiency and congestion assessment with energy mix effect: The case of APEC countries. J. Clean. Prod. 2017, 142, 819–828. [Google Scholar] [CrossRef]
- Lv, W.; Hong, X.; Fang, K. Chinese regional energy efficiency change and its determinants analysis: Malmquist index and Tobit model. Ann. Oper. Res. 2012, 228, 9–22. [Google Scholar] [CrossRef]
- Song, M.-L.; Zhang, L.-L.; Liu, W.; Fisher, R. Bootstrap-DEA analysis of BRICS’ energy efficiency based on small sample data. Appl. Energy 2013, 112, 1049–1055. [Google Scholar] [CrossRef]
- Wang, Q.; Zhao, Z.; Zhou, P.; Zhou, D. Energy efficiency and production technology heterogeneity in China: A meta-frontier DEA approach. Econ. Model. 2013, 35, 283–289. [Google Scholar] [CrossRef]
- Wu, A.-H.; Cao, Y.-Y.; Liu, B. Energy efficiency evaluation for regions in China: an application of DEA and Malmquist indices. Energy Effic. 2013, 7, 429–439. [Google Scholar] [CrossRef]
- Wu, J.; Lv, L.; Sun, J.; Ji, X. A comprehensive analysis of China’s regional energy saving and emission reduction efficiency: From production and treatment perspectives. Energy Policy 2015, 84, 166–176. [Google Scholar] [CrossRef]
- Guo, X.; Lu, C.-C.; Lee, J.-H.; Chiu, Y.-H. Applying the dynamic DEA model to evaluate the energy efficiency of OECD countries and China. Energy 2017, 134, 392–399. [Google Scholar] [CrossRef]
- Baležentis, T.; Streimikiene, D.; Zhang, T.F.; Liobikiene, G. The role of bioenergy in greenhouse gas emission reduction in EU countries: An Environmental Kuznets Curve modelling. Resour. Conserv. Recycl. 2019, 142, 225–231. [Google Scholar] [CrossRef]
- Wang, K.; Yu, S.; Zhang, W. China’s regional energy and environmental efficiency: A DEA window analysis based dynamic evaluation. Math. Comput. Model. 2013, 58, 1117–1127. [Google Scholar] [CrossRef]
- Wang, Z.; Feng, C. A performance evaluation of the energy, environmental, and economic efficiency and productivity in China: An application of global data envelopment analysis. Appl. Energy 2015, 147, 617–626. [Google Scholar] [CrossRef]
- Guo, X.; Zhu, Q.; Lv, L.; Chu, J.; Wu, J. Efficiency evaluation of regional energy saving and emission reduction in China: A modified slacks-based measure approach. J. Clean. Prod. 2017, 140, 1313–1321. [Google Scholar] [CrossRef]
- Chen, J.; Zhao, A.; Zhao, Q.; Song, M.; Baležentis, T.; Štreimikienė, D. Estimation and Factor Decomposition of Carbon Emissions in China’s Tourism Sector. Problemy Ekorozwoju 2018, 13, 91–101. [Google Scholar]
- Miao, Z.; Sheng, J.C.; Webber, M.; Baležentis, T.; Geng, Y.; Zhou, W.H. Measuring water use performance in the cities along China’s South-North Water Transfer Project. Appl. Geogr. 2018, 98, 184–200. [Google Scholar] [CrossRef]
- Jia, Y.P.; Liu, R.Z. Study of the Energy and Environmental Efficiency of the Chinese economy based on a DEA Model. Procedia Environ. Sci. 2012, 13, 2256–2263. [Google Scholar] [CrossRef] [Green Version]
- Zeng, Y.; Zhang, Q.; Jin, Z. Temporal-spatial Distribution Characteristics and Impact Factors of AQI in Fuzhou. Environ. Sci. Technol. 2017, 10, 12–23. [Google Scholar]
- Heidarinejad, Z.; Kavosi, A.; Mousapour, H.; Daryabor, M.R.; Radfard, M.; Abdolshahi, A.; Mohammadi, A.A.; Saleh, H.N.; Yousefi, M. Data on evaluation of AQI for different season in Kerman, Iran, 2015. Data in Brief 2018, 20, 1917–1923. [Google Scholar] [CrossRef]
- Miao, L.; Jilin, G. The air quality analysis of Dalian based on the data of AQI. Fourth Semin. Nov. Optoelectron. Detect. Technol. Appl. 2018, 10697, 106973C. [Google Scholar]
- Li, Y.; Chiu, Y.-H.; Lu, L.C. Energy and AQI performance of 31 cities in China. Energy Policy 2018, 122, 194–202. [Google Scholar] [CrossRef]
- Choi, Y.; Zhang, N.; Zhou, P. Efficiency and abatement costs of energy-related CO2 emissions in China: A slacks-based efficiency measure. Appl. Energy 2012, 98, 198–208. [Google Scholar] [CrossRef]
- Wang, K.; Wei, Y.-M.; Zhang, X. Energy and emissions efficiency patterns of Chinese regions: A multi-directional efficiency analysis. Appl. Energy 2013, 104, 105–116. [Google Scholar] [CrossRef]
- Zhang, X.-P.; Cheng, X.-M.; Yuan, J.-H.; Gao, X.-J. Total-factor energy efficiency in developing countries. Energy Policy 2011, 39, 644–650. [Google Scholar] [CrossRef]
- Chang, T.-P.; Hu, J.-L. Total-factor energy productivity growth, technical progress, and efficiency change: An empirical study of China. Appl. Energy 2010, 87, 3262–3270. [Google Scholar] [CrossRef]
- Wang, Q.; Su, B.; Sun, J.; Zhou, P.; Zhou, D. Measurement and decomposition of energy-saving and emissions reduction performance in Chinese cities. Appl. Energy 2015, 151, 85–92. [Google Scholar] [CrossRef]
- Yao, X.; Zhou, H.; Zhang, A.; Li, A. Regional energy efficiency, carbon emission performance and technology gaps in China: A meta-frontier non-radial directional distance function analysis. Energy Policy 2015, 84, 142–154. [Google Scholar] [CrossRef]
- Yan, Q.; Wang, X.; Baležentis, T.; Štreimikienė, D. Energy–economy–environmental (3E) performance of Chinese regions based on the data envelopment analysis model with mixed assumptions on disposability. Energy Environ. 2018, 29, 664–684. [Google Scholar] [CrossRef]
- Miao, Z.; Baležentis, T.; Tian, Z.; Shao, S.; Geng, Y.; Wu, R. Environmental Performance and Regulation Effect of China’s Atmospheric Pollutant Emissions: Evidence from “Three Regions and Ten Urban Agglomerations”. Environ. Resour. Econ. 2019, 1–32. [Google Scholar] [CrossRef]
- Wang, K.; Lu, B.; Wei, Y.-M. China’s regional energy and environmental efficiency: A Range-Adjusted Measure based analysis. Appl. Energy 2013, 112, 1403–1415. [Google Scholar] [CrossRef]
- Wang, Q.; Zhou, P.; Zhao, Z.; Shen, N. Energy Efficiency and Energy Saving Potential in China: A Directional Meta-Frontier DEA Approach. Sustainability 2014, 6, 5476–5492. [Google Scholar] [CrossRef] [Green Version]
- Wang, Z.; Feng, C.; Zhang, B. An empirical analysis of China’s energy efficiency from both static and dynamic perspectives. Energy 2014, 74, 322–330. [Google Scholar] [CrossRef]
- Apergis, N.; Aye, G.C.; Barros, C.P.; Gupta, R.; Wanke, P. Energy efficiency of selected OECD countries: A slacks based model with undesirable outputs. Energy Econ. 2015, 51, 45–53. [Google Scholar] [CrossRef] [Green Version]
- Chang, M.-C. Energy intensity, target level of energy intensity, and room for improvement in energy intensity: An application to the study of regions in the EU. Energy Policy 2014, 67, 648–655. [Google Scholar] [CrossRef]
- Cui, Q.; Kuang, H.-B.; Wu, C.-Y.; Li, Y. The changing trend and influencing factors of energy efficiency: The case of nine countries. Energy 2014, 64, 1026–1034. [Google Scholar] [CrossRef]
- Honma, S.; Hu, J.-L. A panel data parametric frontier technique for measuring total-factor energy efficiency: An application to Japanese regions. Energy 2014, 78, 732–739. [Google Scholar] [CrossRef] [Green Version]
- Wei, C.; Ni, J.; Shen, M. Empirical Analysis of Provincial Energy Efficiency in China. China World Econ 2009, 17, 88–103. [Google Scholar] [CrossRef]
- Shen, N.; Zhou, J.; Zou, W.-J. Energy Efficiency Measures and Convergence in China, Taking into Account the Effects of Environmental and Random Factors. Pol. J. Environ. Stud. 2015, 24, 257–267. [Google Scholar] [CrossRef] [Green Version]
- Li, K.; Lin, B. The improvement gap in energy intensity: Analysis of China’s thirty provincial regions using the improved DEA (data envelopment analysis) model. Energy 2015, 84, 589–599. [Google Scholar] [CrossRef]
- Zou, W.-J.; Cai, P.-H.; Shen, N.; Lu, C.-C. The technology gap of Chinese regions’ energy efficiency and spatial convergence—Based on the hybrid meta-frontier data envelopment analysis. J. Renew. Sustain. Energy 2015, 7, 1078–1092. [Google Scholar] [CrossRef]
- Charnes, A.; Cooper, W.; Rhodes, E. Measuring the efficiency of decision making units. Eur. J. Oper. Res. 1978, 2, 429–444. [Google Scholar] [CrossRef]
- Banker, R.D.; Charnes, A.; Cooper, W.W. Some Models for Estimating Technical and Scale Inefficiencies in Data Envelopment Analysis. Manag. Sci. 1984, 30, 1078–1092. [Google Scholar] [CrossRef]
- Tone, K. A slacks-based measure of efficiency in data envelopment analysis. Eur. J. Oper. Res. 2001, 130, 498–509. [Google Scholar] [CrossRef] [Green Version]
- Färe, R.; Grosskopf, S. Productivity and intermediate products: A frontier approach. Econ. Lett. 1996, 50, 65–70. [Google Scholar] [CrossRef] [Green Version]
- Bogetoft, P.; Christensen, D.L.; Damgard, I.; Geisler, M.; Jakobsen, T.P.; Krøigaard, M.; Nielsen, J.D.; Nielsen, J.B.; Nielsen, K.; Pagter, J.; et al. Multiparty Computation Goes Live. In Proceedings of the Financial Cryptography and Data Security, Accra Beach, Barbados, 23–26 February 2009; Springer: Berlin/Heidelberg, Germany, 2008; pp. 325–343. [Google Scholar]
- Chen, C.-M. A network-DEA model with new efficiency measures to incorporate the dynamic effect in production networks. Eur. J. Oper. Res. 2009, 194, 687–699. [Google Scholar] [CrossRef]
- Nemoto, J.; Goto, M. Dynamic data envelopment analysis: Modeling intertemporal behavior of a firm in the presence of productive inefficiencies. Econ. Lett. 1999, 64, 51–56. [Google Scholar] [CrossRef]
- Nemoto, J.; Goto, M. Measurement of Dynamic Efficiency in Production: An Application of Data Envelopment Analysis to Japanese Electric Utilities. J. Prod. Anal. 2003, 19, 191–210. [Google Scholar] [CrossRef]
- Park, K.S.; Park, K. Measurement of multiperiod aggregative efficiency. Eur. J. Oper. Res. 2009, 193, 567–580. [Google Scholar] [CrossRef]
- Tone, K.; Tsutsui, M. Dynamic DEA: A Slacks-based Measure Approach. Omega 2010, 38, 145–156. [Google Scholar] [CrossRef]
- Battese, G.E.; Rao, D.S.P. Technology gap, efficiency and a stochastic metafrontier function. Int. J. Bus. Econ. 2002, 1, 87–93. [Google Scholar]
- Battese, G.E.; Rao, D.S.P.; O’Donnell, C.J.; O’Donnell, C.J. A Metafrontier Production Function for Estimation of Technical Efficiencies and Technology Gaps for Firms Operating Under Different Technologies. J. Prod. Anal. 2004, 21, 91–103. [Google Scholar] [CrossRef]
- O’Donnell, C.J.; Rao, D.S.P.; Battese, G.E. Metafrontier frameworks for the study of firm-level efficiencies and technology ratios. Empir. Econ. 2008, 34, 231–255. [Google Scholar] [CrossRef]
- Hu, J.L.; Wang, S.C. Total-factor energy efficiency of regions in China. Energy Policy 2006, 34, 3206–3217. [Google Scholar] [CrossRef]
- National Bureau of statistics of China. China Statistical Yearbook. 2017. Available online: http://www.stats.gov.cn/ (accessed on 8 April 2018).
- China Statistical Yearbooks Database. Demographics and the Employment Statistical Yearbook of China, and the Statistical Yearbooks of all Cities. China Academic Journals Electronic Publishing House: Beijing, China, 2017. Available online: http://www.stats.gov.cn/ (accessed on 8 April 2018).
- China’s Environmental and Protection Bureau Reports. Ministry of Ecology and Environment of the People’s Republic of China, 2017. Available online: http://www.mep.gov.cn/ (accessed on 1 March 2018).
Figure 1.
The structure of dynamic DEA.
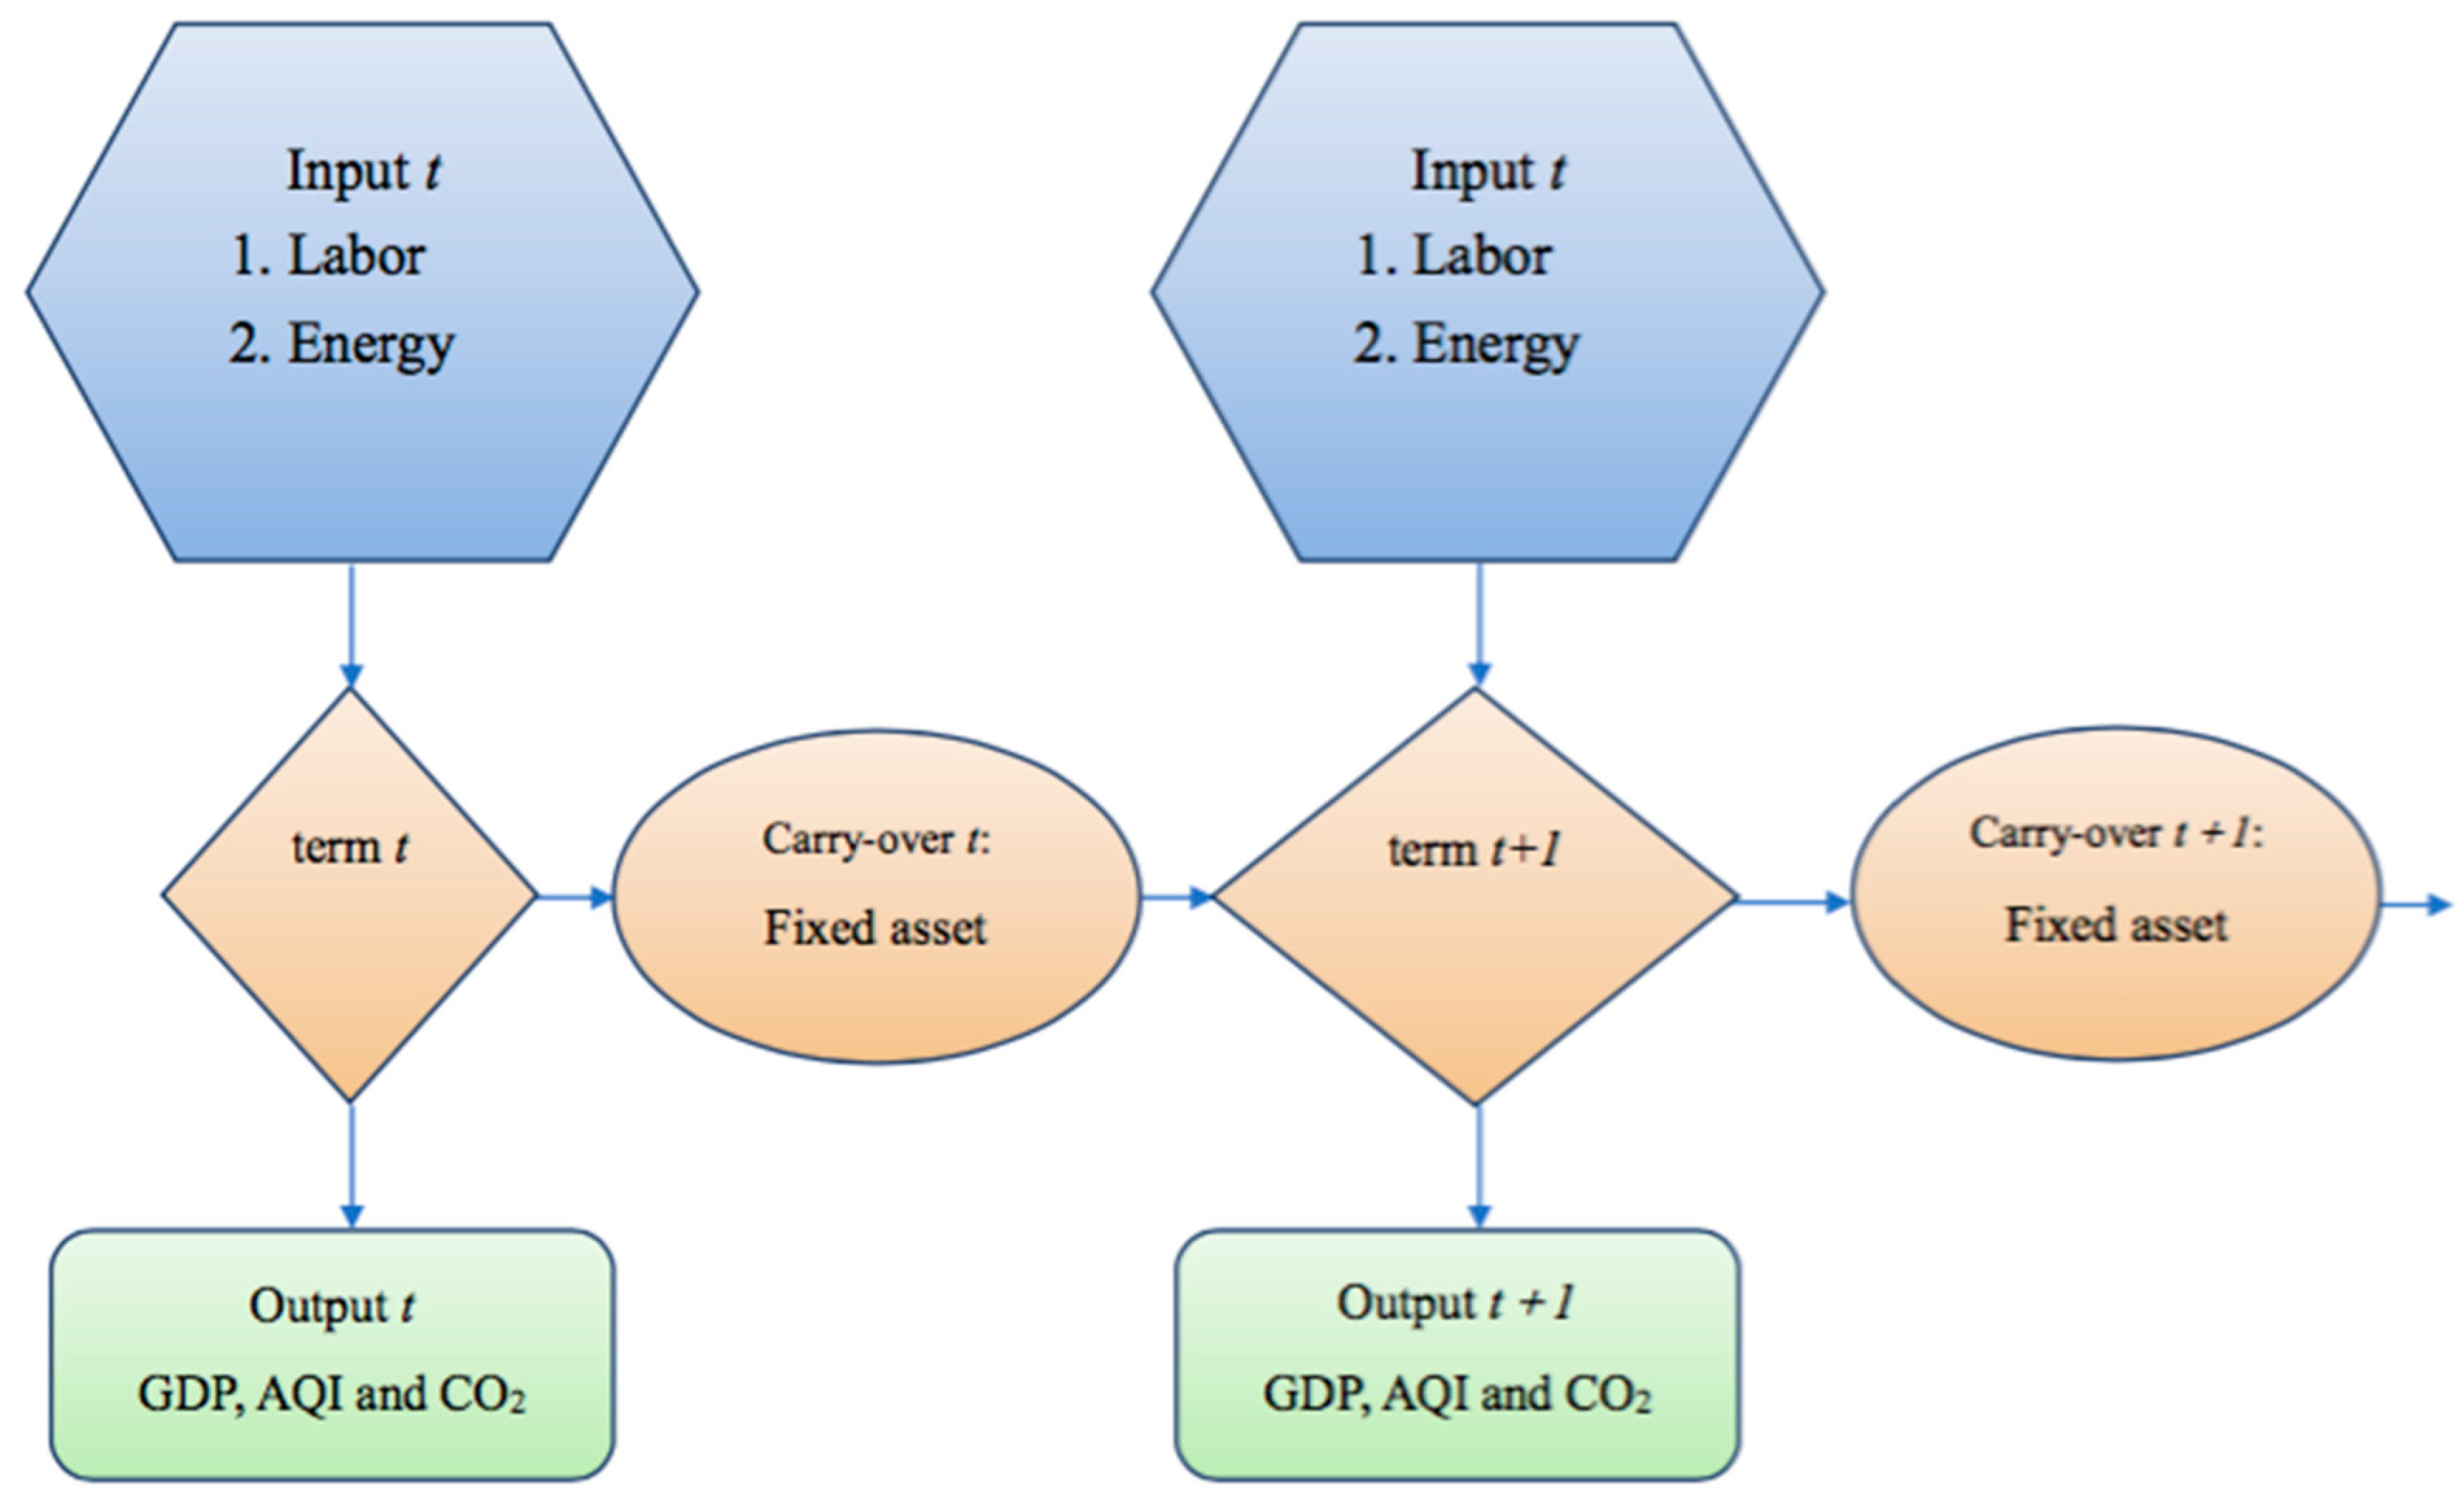
Figure 2.
(a) Average AQI and CO2 scores of the Yangtze River Economic Belt. (b) Average AQI and CO2 scores of the non-Yangtze River Economic Belt.
Figure 2.
(a) Average AQI and CO2 scores of the Yangtze River Economic Belt. (b) Average AQI and CO2 scores of the non-Yangtze River Economic Belt.
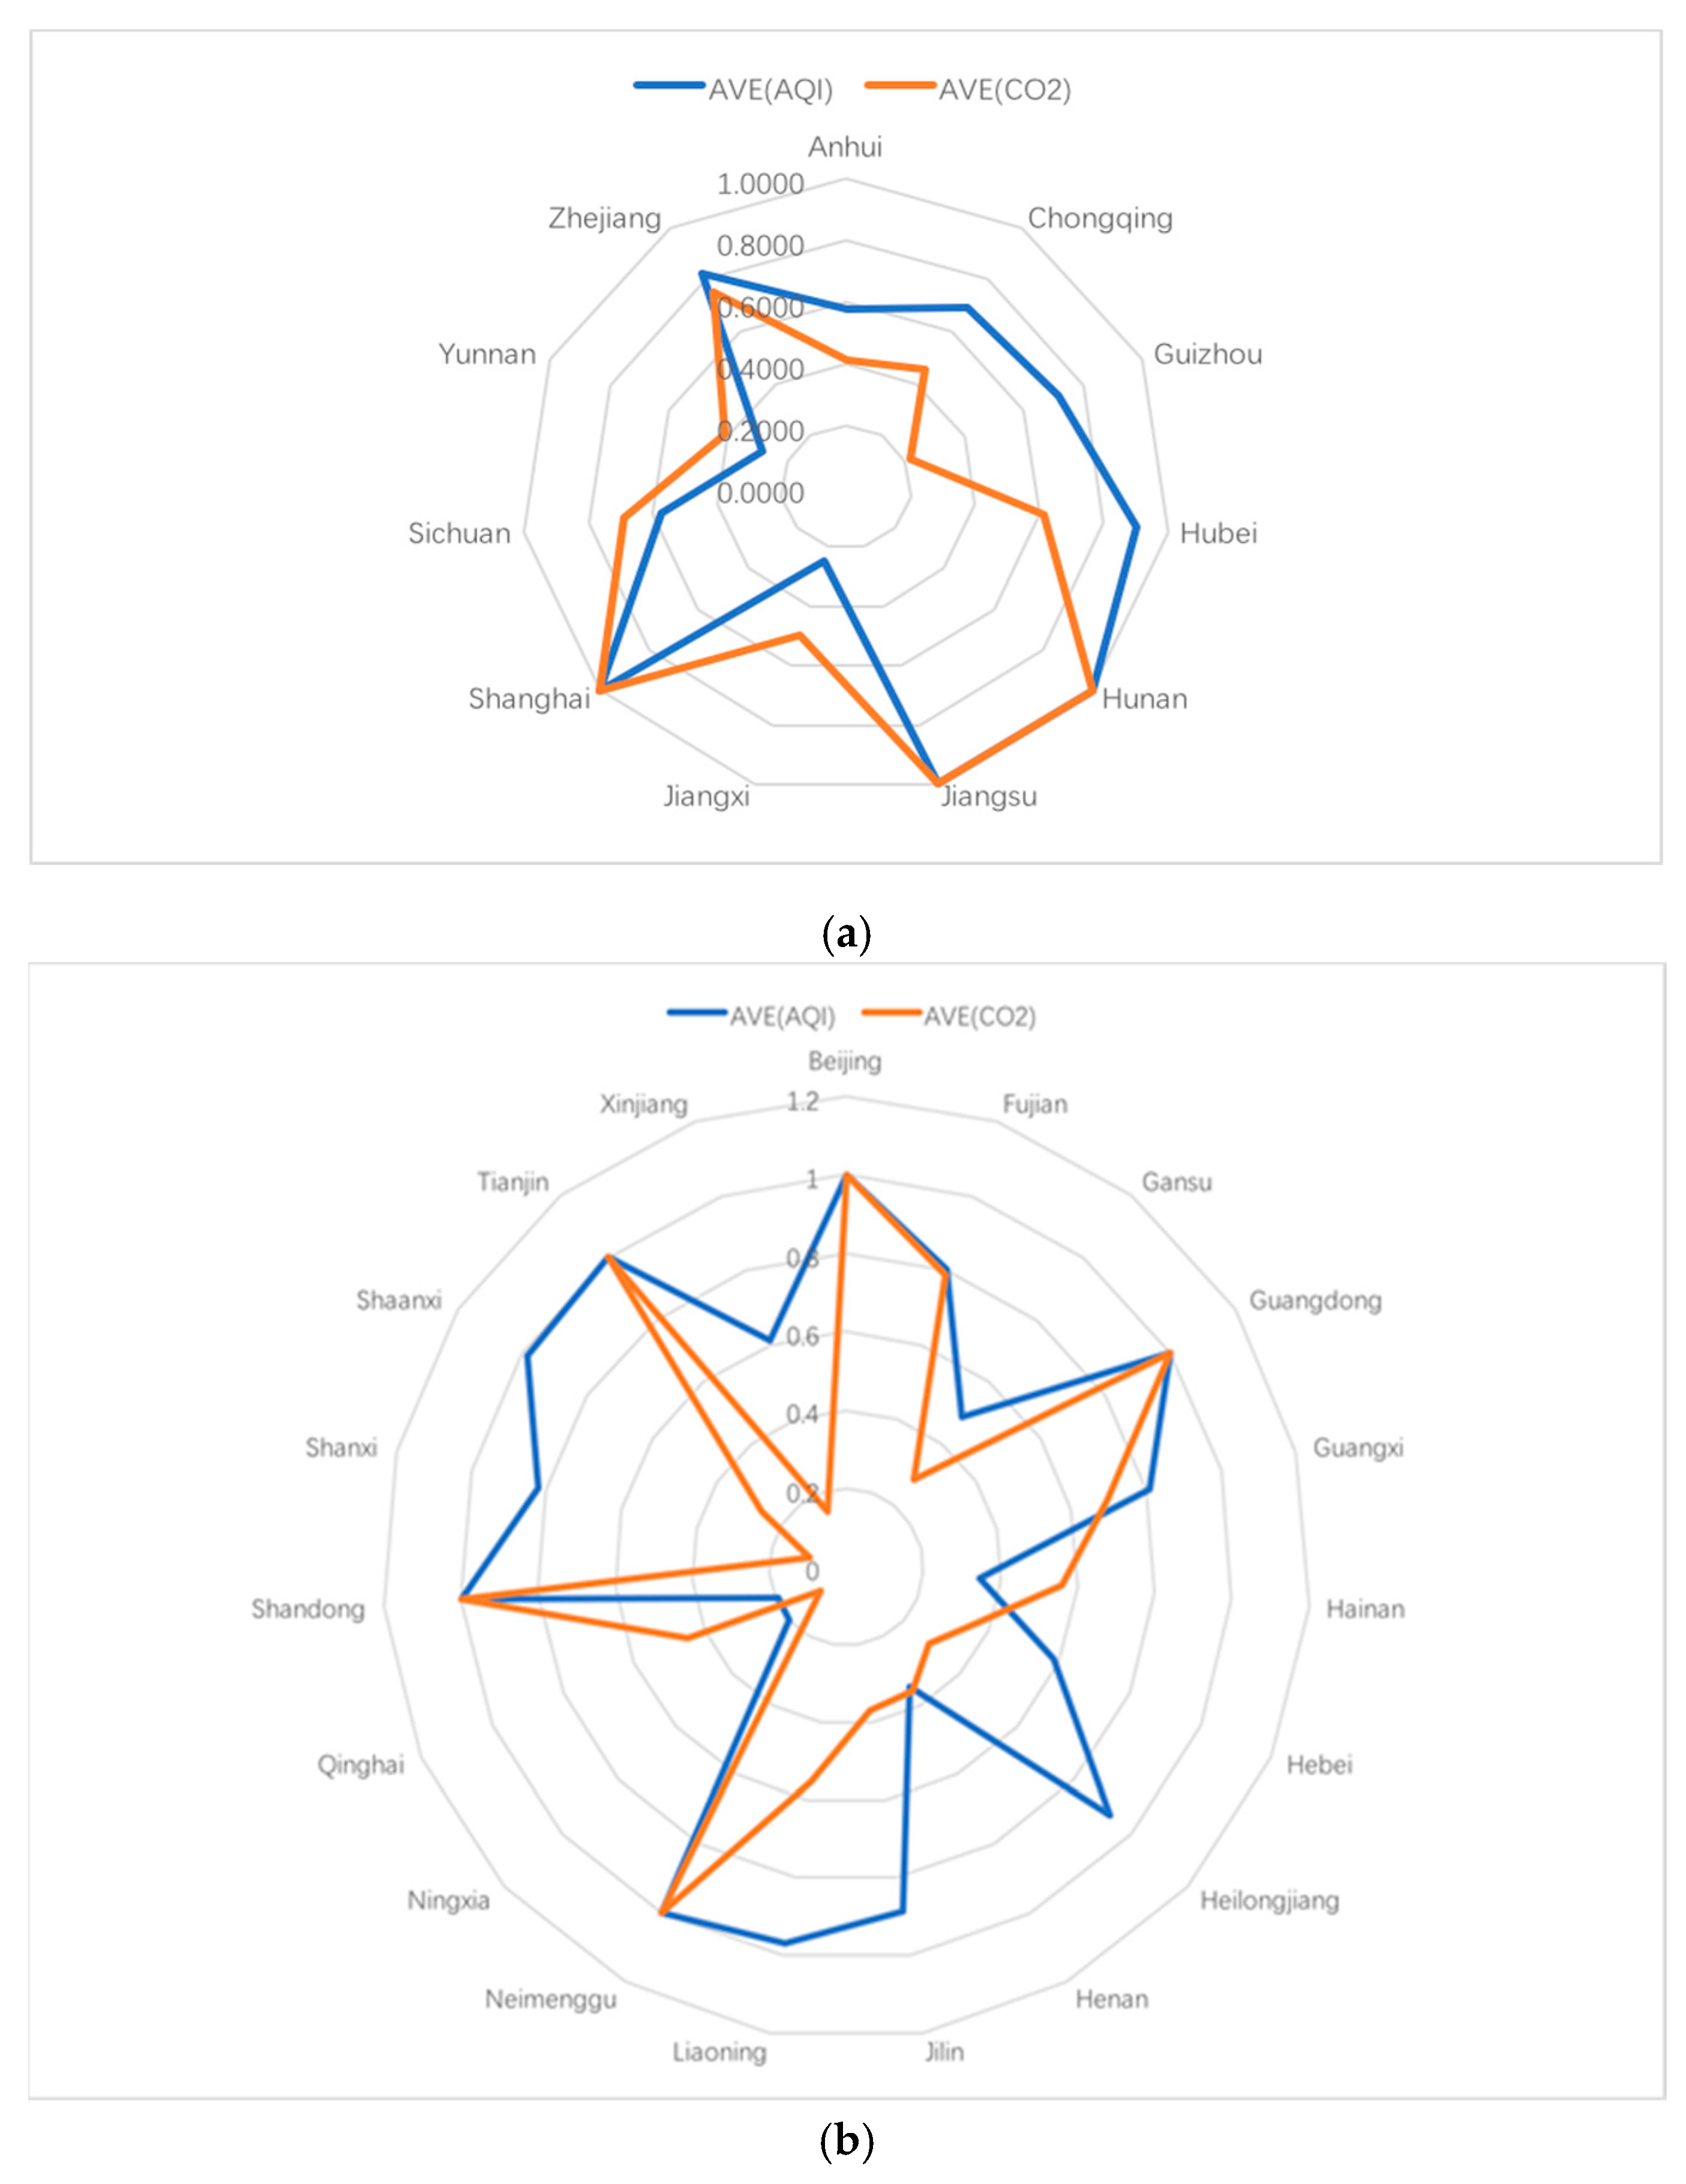
Figure 3.
(a) CO2 efficiency scores and AQI mean values of the Yangtze River Economic Belt. (b) CO2 efficiency scores and AQI mean values of the non-Yangtze River Economic Belt.
Figure 3.
(a) CO2 efficiency scores and AQI mean values of the Yangtze River Economic Belt. (b) CO2 efficiency scores and AQI mean values of the non-Yangtze River Economic Belt.


Table 1.
Statistical presentation of input-output variables.
| Statistical Presentation | Input Variables | Output Variables | ||||
|---|---|---|---|---|---|---|
| Labor | Fixed Assets | Energy | GDP | CO2 | AQI | |
| The Year of 2014 | ||||||
| Max | 1943.82 | 54,055.7 | 42,634.2 | 78,036.82 | 164,182.81 | 154 |
| Min | 61.88 | 3660.52 | 786.26 | 2575.8 | 2044.29 | 46.7500 |
| AVG | 627.3291 | 21,030.3434 | 14,577.9763 | 26,512.2156 | 41,211.3244 | 92.7624 |
| Std | 215.0595 | 16,211.0735 | 9062.1249 | 14,712.1203 | 23,561.5192 | 24.6898 |
| The Year of 2015 | ||||||
| Max | 1948.04 | 48,312.44 | 40,926.93 | 72,812.55 | 146,410.44 | 139.4167 |
| Min | 62.71 | 3210.63 | 1071.92 | 2417.05 | 2786.99 | 44.9167 |
| AVG | 600.9703 | 18,505.06 | 14,182.6044 | 24,058.0493 | 38,188.2830 | 92.3808 |
| Std | 216.4242 | 14,020.0395 | 8952.6012 | 14,051.5552 | 23,276.7673 | 25.3969 |
| The Year of 2016 | ||||||
| Max | 1943.82 | 54,055.7 | 42,634.2 | 78,036.82 | 164,182.81 | 154 |
| Min | 61.88 | 3660.52 | 786.26 | 2575.8 | 2044.29 | 46.75 |
| AVG | 627.3291 | 21,030.3434 | 14,577.9763 | 26,512.2156 | 41,211.3244 | 92.7624 |
| Std | 215.0595 | 16,211.0735 | 9062.1249 | 14,712.1203 | 23,561.5192 | 24.6898 |
Table 2.
Overall efficiency scores and ranks.
| 2014 | 2015 | 2016 | ||||
|---|---|---|---|---|---|---|
| DMU (Decision Making Unit) | Rank | Score | Rank | Score | Rank | Score |
| Anhui | 17 | 0.5405 | 17 | 0.5290 | 17 | 0.5161 |
| Beijing | 1 | 1 | 1 | 1 | 1 | 1 |
| Chongqing | 16 | 0.5527 | 15 | 0.5805 | 15 | 0.5446 |
| Fujian | 10 | 0.7727 | 9 | 0.7786 | 9 | 0.8077 |
| Gansu | 27 | 0.2956 | 27 | 0.2648 | 28 | 0.2438 |
| Guangdong | 1 | 1 | 1 | 1 | 1 | 1 |
| Guangxi | 12 | 0.6739 | 11 | 0.7372 | 12 | 0.7408 |
| Guizhou | 26 | 0.3321 | 26 | 0.3598 | 25 | 0.3704 |
| Hainan | 14 | 0.6165 | 16 | 0.5653 | 16 | 0.5355 |
| Hebei | 18 | 0.5391 | 19 | 0.4941 | 21 | 0.4655 |
| Heilongjiang | 23 | 0.4151 | 25 | 0.3718 | 24 | 0.3834 |
| Henan | 21 | 0.4499 | 22 | 0.4193 | 22 | 0.4314 |
| Hubei | 11 | 0.7275 | 12 | 0.6678 | 14 | 0.6943 |
| Hunan | 1 | 1 | 1 | 1 | 1 | 1 |
| Jiangsu | 1 | 1 | 1 | 1 | 1 | 1 |
| Jiangxi | 19 | 0.5351 | 18 | 0.4956 | 19 | 0.4868 |
| Jilin | 20 | 0.4948 | 20 | 0.4772 | 18 | 0.4952 |
| Liaoning | 15 | 0.6118 | 14 | 0.6055 | 11 | 0.7495 |
| Neimenggu | 1 | 1 | 1 | 1 | 1 | 1 |
| Ningxia | 29 | 0.2582 | 28 | 0.2537 | 27 | 0.2445 |
| Qinghai | 25 | 0.3723 | 23 | 0.3867 | 23 | 0.4110 |
| Shandong | 1 | 1 | 1 | 1 | 1 | 1 |
| Shanghai | 1 | 1 | 1 | 1 | 1 | 1 |
| Shanxi | 30 | 0.2491 | 30 | 0.2300 | 30 | 0.2101 |
| Shaanxi | 24 | 0.4021 | 24 | 0.3758 | 26 | 0.3563 |
| Sichuan | 13 | 0.6247 | 13 | 0.6624 | 10 | 0.7581 |
| Tianjin | 1 | 1 | 1 | 1 | 1 | 1 |
| Xinjiang | 28 | 0.2758 | 29 | 0.2388 | 29 | 0.2137 |
| Yunnan | 22 | 0.4355 | 21 | 0.4399 | 20 | 0.4782 |
| Zhejiang | 9 | 0.8072 | 10 | 0.7596 | 13 | 0.7349 |
Table 3.
Energy consumption, AQI, and CO2 efficiency scores and ranks from 2014 to 2016.
| 2014 | 2015 | 2016 | |||||||
|---|---|---|---|---|---|---|---|---|---|
| DMU | Com | AQI | CO2 | Com | AQI | CO2 | Com | AQI | CO2 |
| Anhui | 0.4106 | 0.6751 | 0.4106 | 0.4146 | 0.5743 | 0.4146 | 0.4138 | 0.4767 | 0.4138 |
| Beijing | 1 | 1 | 1 | 1 | 1 | 1 | 1 | 1 | 1 |
| Chongqing | 0.4991 | 0.5557 | 0.4991 | 0.4439 | 0.8268 | 0.4439 | 0.4134 | 0.6939 | 0.4134 |
| Fujian | 0.7657 | 0.8066 | 0.7657 | 0.7945 | 0.7484 | 0.7945 | 0.7998 | 0.8577 | 0.7998 |
| Gansu | 0.3119 | 0.5075 | 0.3119 | 0.2815 | 0.4720 | 0.2815 | 0.2559 | 0.4720 | 0.2559 |
| Guangdong | 1 | 1 | 1 | 1 | 1 | 1 | 1 | 1 | 1 |
| Guangxi | 0.6233 | 0.7635 | 0.6233 | 0.6684 | 0.9106 | 0.6947 | 0.7216 | 0.7494 | 0.7645 |
| Guizhou | 0.2078 | 1 | 0.2078 | 0.2368 | 0.3398 | 0.2368 | 0.2120 | 0.8196 | 0.2120 |
| Hainan | 0.6335 | 0.3919 | 0.6335 | 0.5514 | 0.3320 | 0.5514 | 0.4953 | 0.3159 | 0.4953 |
| Hebei | 0.3288 | 0.9738 | 0.3288 | 0.3990 | 0.3541 | 0.3989 | 0.3529 | 0.4258 | 0.3529 |
| Heilongjiang | 0.3180 | 0.9652 | 0.3180 | 0.2867 | 0.8207 | 0.2867 | 0.2630 | 1 | 0.2630 |
| Henan | 0.3590 | 0.3941 | 0.3590 | 0.3554 | 0.2280 | 0.3554 | 0.3610 | 0.4161 | 0.3610 |
| Hubei | 0.6330 | 1 | 0.6330 | 0.6080 | 0.7801 | 0.6080 | 0.6041 | 0.9303 | 0.6041 |
| Hunan | 1 | 1 | 1 | 1 | 1 | 1 | 1 | 1 | 1 |
| Jiangsu | 1 | 1 | 1 | 1 | 1 | 1 | 1 | 1 | 1 |
| Jiangxi | 0.5249 | 0.2524 | 0.5249 | 0.4949 | 0.1884 | 0.4949 | 0.4752 | 0.3034 | 0.4752 |
| Jilin | 0.3891 | 0.8157 | 0.3891 | 0.3694 | 0.8443 | 0.3694 | 0.3532 | 1 | 0.3532 |
| Liaoning | 0.4611 | 0.9568 | 0.4611 | 0.4529 | 0.9477 | 0.4529 | 0.6289 | 1 | 0.7399 |
| Neimenggu | 1 | 1 | 1 | 1 | 1 | 1 | 1 | 1 | 1 |
| Ningxia | 0.0993 | 0.2230 | 0.0993 | 0.0894 | 0.1669 | 0.0894 | 0.0809 | 0.2102 | 0.0809 |
| Qinghai | 0.4043 | 0.1976 | 0.4043 | 0.4394 | 0.1878 | 0.4394 | 0.4972 | 0.1948 | 0.4972 |
| Shandong | 1 | 1 | 1 | 1 | 1 | 1 | 1 | 1 | 1 |
| Shanghai | 1 | 1 | 1 | 1 | 1 | 1 | 1 | 1 | 1 |
| Shanxi | 0.1055 | 0.9487 | 0.1055 | 0.0944 | 0.9192 | 0.0944 | 0.0936 | 0.5997 | 0.0936 |
| Shaanxi | 0.2887 | 1 | 0.2887 | 0.2604 | 0.9547 | 0.2604 | 0.2332 | 1 | 0.2332 |
| Sichuan | 0.6183 | 0.4958 | 0.6183 | 0.7107 | 0.4151 | 0.7107 | 0.7445 | 0.8036 | 0.7445 |
| Tianjin | 1 | 1 | 1 | 1 | 1 | 1 | 1 | 1 | 1 |
| Xinjiang | 0.1791 | 0.7415 | 0.1791 | 0.1470 | 0.6259 | 0.1470 | 0.1238 | 0.4701 | 0.1238 |
| Yunnan | 0.3687 | 0.3049 | 0.3687 | 0.4023 | 0.2293 | 0.4023 | 0.4594 | 0.3109 | 0.4594 |
| Zhejiang | 0.7637 | 0.9588 | 0.7637 | 0.7308 | 0.8512 | 0.7308 | 0.7565 | 0.6582 | 0.7565 |
Table 4.
Regional ranks and technology gaps.
| 2014 | 2015 | 2016 | ||||
|---|---|---|---|---|---|---|
| DMU | Rank by div | Technology Gap | Rank by div | Technology Gap | Rank by div | Technology Gap |
| Anhui | 15 | 0.9977 | 24 | 0.9778 | 25 | 0.9733 |
| Beijing | 1 | 1 | 1 | 1 | 1 | 1 |
| Chongqing | 19 | 0.9964 | 18 | 0.9953 | 16 | 0.9996 |
| Fujian | 13 | 0.9993 | 20 | 0.9937 | 23 | 0.9914 |
| Gansu | 24 | 0.9852 | 16 | 0.9961 | 1 | 1 |
| Guangdong | 1 | 1 | 1 | 1 | 1 | 1 |
| Guangxi | 16 | 0.9975 | 17 | 0.9958 | 21 | 0.9927 |
| Guizhou | 26 | 0.9771 | 23 | 0.9838 | 1 | 1 |
| Hainan | 29 | 0.9436 | 1 | 1.0000 | 1 | 1 |
| Hebei | 28 | 0.9658 | 22 | 0.9839 | 24 | 0.9851 |
| Heilongjiang | 17 | 0.9973 | 21 | 0.9921 | 1 | 1 |
| Henan | 1 | 1 | 14 | 0.9977 | 18 | 0.9977 |
| Hubei | 22 | 0.9901 | 28 | 0.9192 | 28 | 0.9567 |
| Hunan | 1 | 1 | 1 | 1 | 1 | 1 |
| Jiangsu | 1 | 1 | 1 | 1 | 1 | 1 |
| Jiangxi | 1 | 1 | 26 | 0.9707 | 19 | 0.9975 |
| Jilin | 23 | 0.9863 | 19 | 0.9945 | 1 | 1 |
| Liaoning | 12 | 0.9999 | 25 | 0.9716 | 29 | 0.9158 |
| Neimenggu | 1 | 1 | 1 | 1 | 1 | 1 |
| Ningxia | 1 | 1 | 15 | 0.9976 | 17 | 0.9991 |
| Qinghai | 14 | 0.9990 | 13 | 0.9997 | 1 | 1 |
| Shandong | 1 | 1 | 1 | 1 | 1 | 1 |
| Shanghai | 1 | 1 | 1 | 1 | 1 | 1 |
| Shanxi | 21 | 0.9915 | 1 | 1 | 26 | 0.9716 |
| Shaanxi | 18 | 0.9969 | 1 | 1 | 1 | 1 |
| Sichuan | 27 | 0.9751 | 29 | 0.9019 | 27 | 0.9700 |
| Tianjin | 1 | 1 | 1 | 1 | 1 | 1 |
| Xinjiang | 20 | 0.9922 | 1 | 1 | 20 | 0.9942 |
| Yunnan | 25 | 0.9820 | 27 | 0.9311 | 22 | 0.9917 |
| Zhejiang | 30 | 0.8653 | 30 | 0.8134 | 30 | 0.8080 |
| Average YREB | 0.9803 | 0.9539 | 0.9724 | |||
| STEDVP YREB | 0.9964 | 0.9953 | 0.9996 | |||
| Average non-YREB | 0.9923 | 0.9959 | 0.9920 | |||
| STEDVP non-YREB | 0.9993 | 0.9937 | 0.9914 | |||
Table 5.
Wilcoxon test scores of average technology efficiency gaps.
| Year | Ave. Gap of YREB | Ave. Gap of Non-YREB | Wilcoxon Test Score |
|---|---|---|---|
| 2014 | 0.9803 | 0.9923 | 0.4592 |
| 2015 | 0.9539 | 0.9959 | 0.0241 ** |
| 2016 | 0.9724 | 0.9920 | 0.2080 |
** From the two-tailed test, the confidence interval 0.05 is significant.
© 2019 by the authors. Licensee MDPI, Basel, Switzerland. This article is an open access article distributed under the terms and conditions of the Creative Commons Attribution (CC BY) license (http://creativecommons.org/licenses/by/4.0/).
Share and Cite
MDPI and ACS Style
Ren, F.-R.; Tian, Z.; Shen, Y.-T.; Chiu, Y.-H.; Lin, T.-Y. Energy, CO2, and AQI Efficiency and Improvement of the Yangtze River Economic Belt. Energies 2019, 12, 647. https://doi.org/10.3390/en12040647
AMA Style
Ren F-R, Tian Z, Shen Y-T, Chiu Y-H, Lin T-Y. Energy, CO2, and AQI Efficiency and Improvement of the Yangtze River Economic Belt. Energies. 2019; 12(4):647. https://doi.org/10.3390/en12040647
Chicago/Turabian StyleRen, Fang-Rong, Ze Tian, Yu-Ting Shen, Yung-Ho Chiu, and Tai-Yu Lin. 2019. "Energy, CO2, and AQI Efficiency and Improvement of the Yangtze River Economic Belt" Energies 12, no. 4: 647. https://doi.org/10.3390/en12040647
Note that from the first issue of 2016, this journal uses article numbers instead of page numbers. See further details here.