Multiscale PMU Data Compression via Density-Based WAMS Clustering Analysis †


Abstract
:
1. Introduction
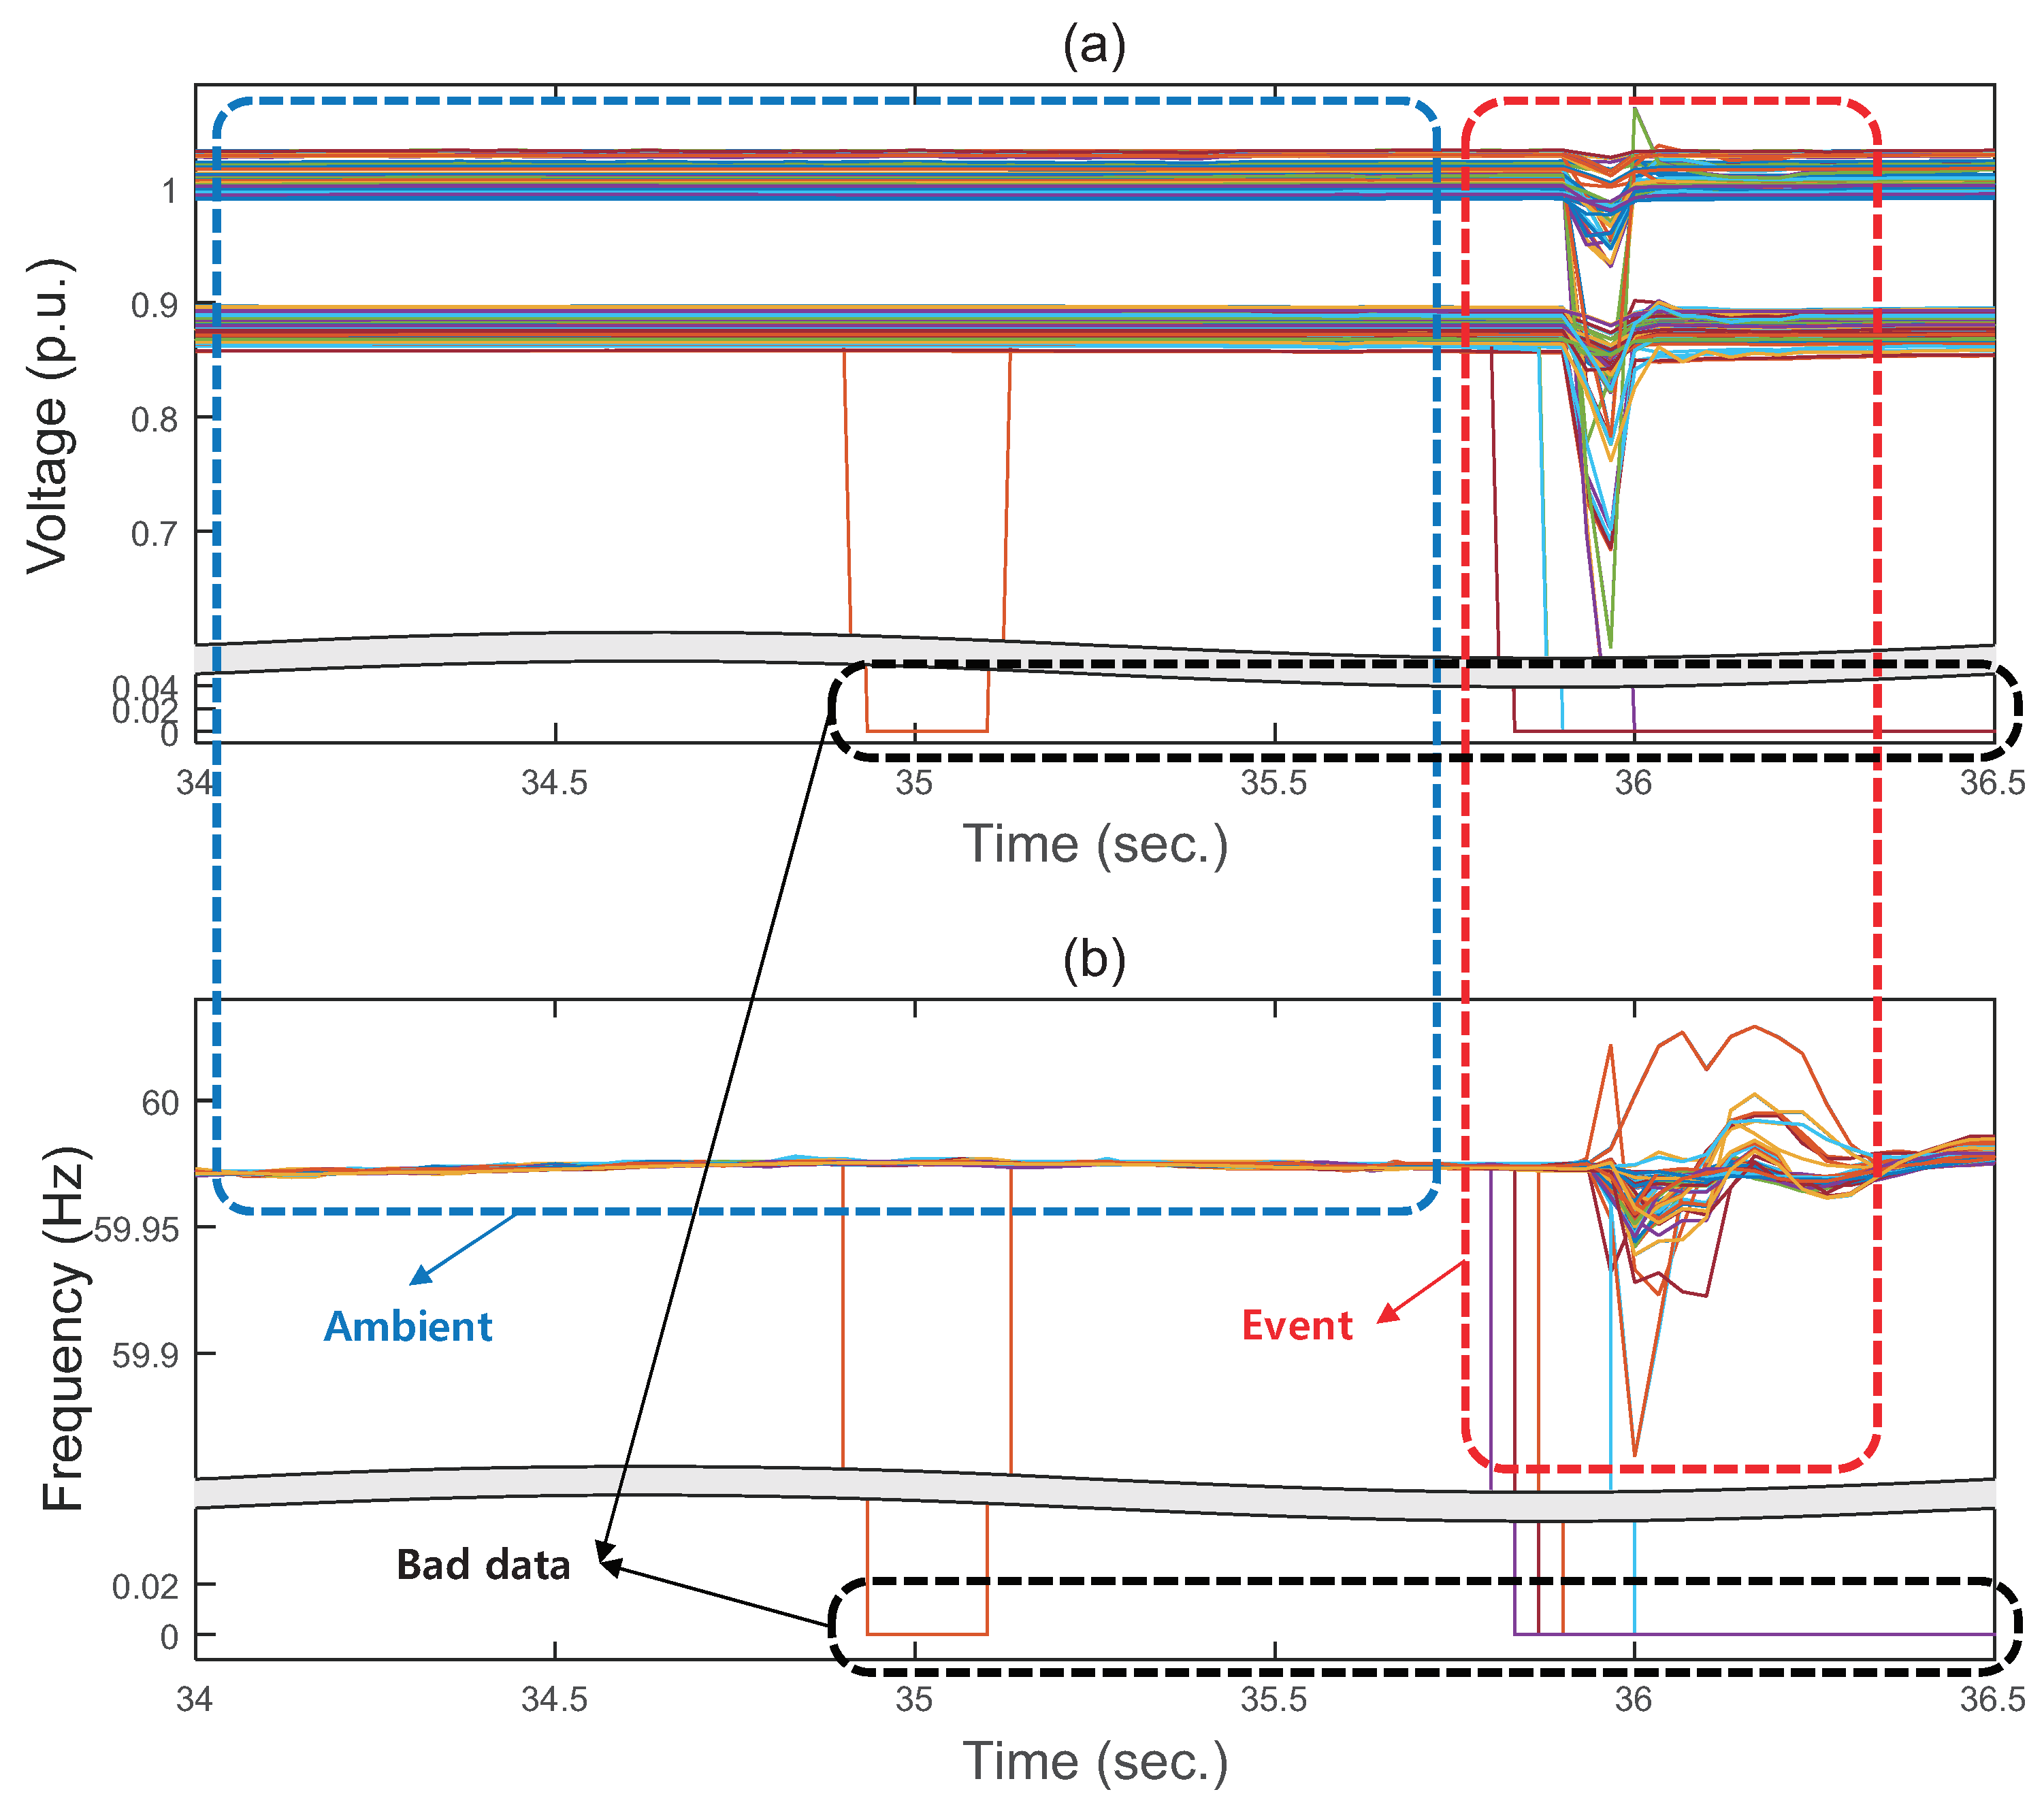
2. Characteristics of Real-World PMU Data
- The technique automatically clusters PMU signals into correlated subdatasets for the accurate reduction of dimensionality and exception of bad data.
- In an ambient period, a high compression ratio is applied to the clustered PMU dataset using redundancies between PMU signals over a long duration.
- In an event period, the clustered PMU dataset is compressed with high accuracy to preserve the individual transient phenomena that arise.
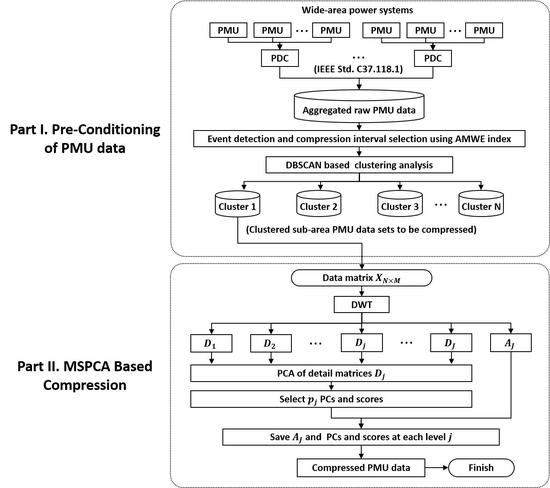
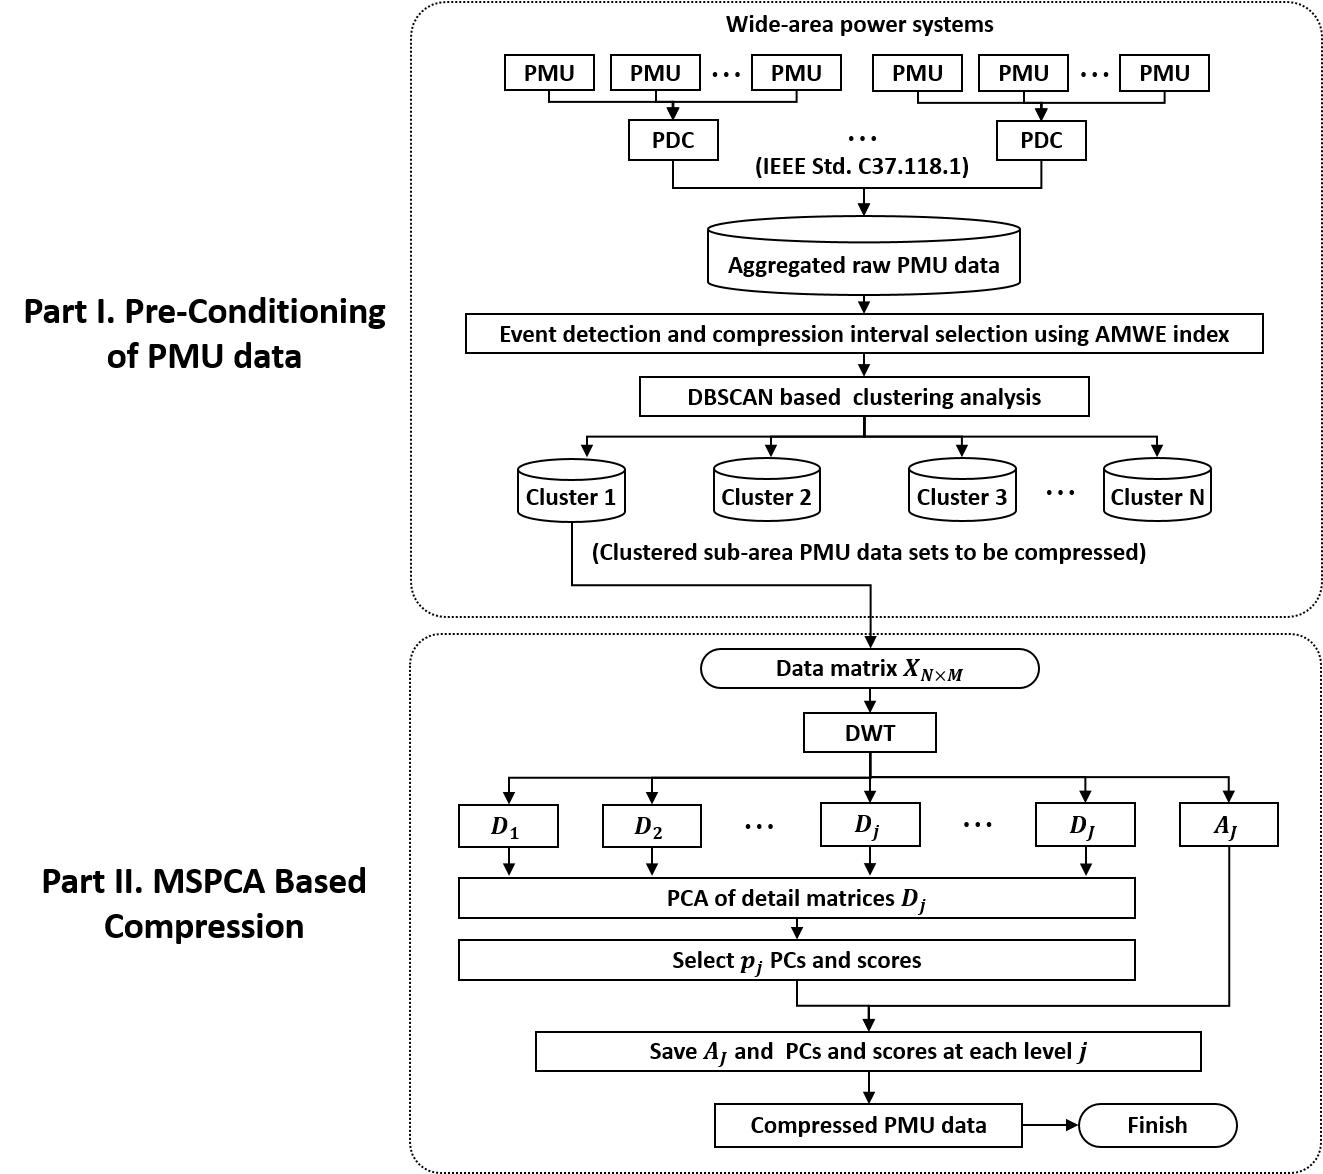
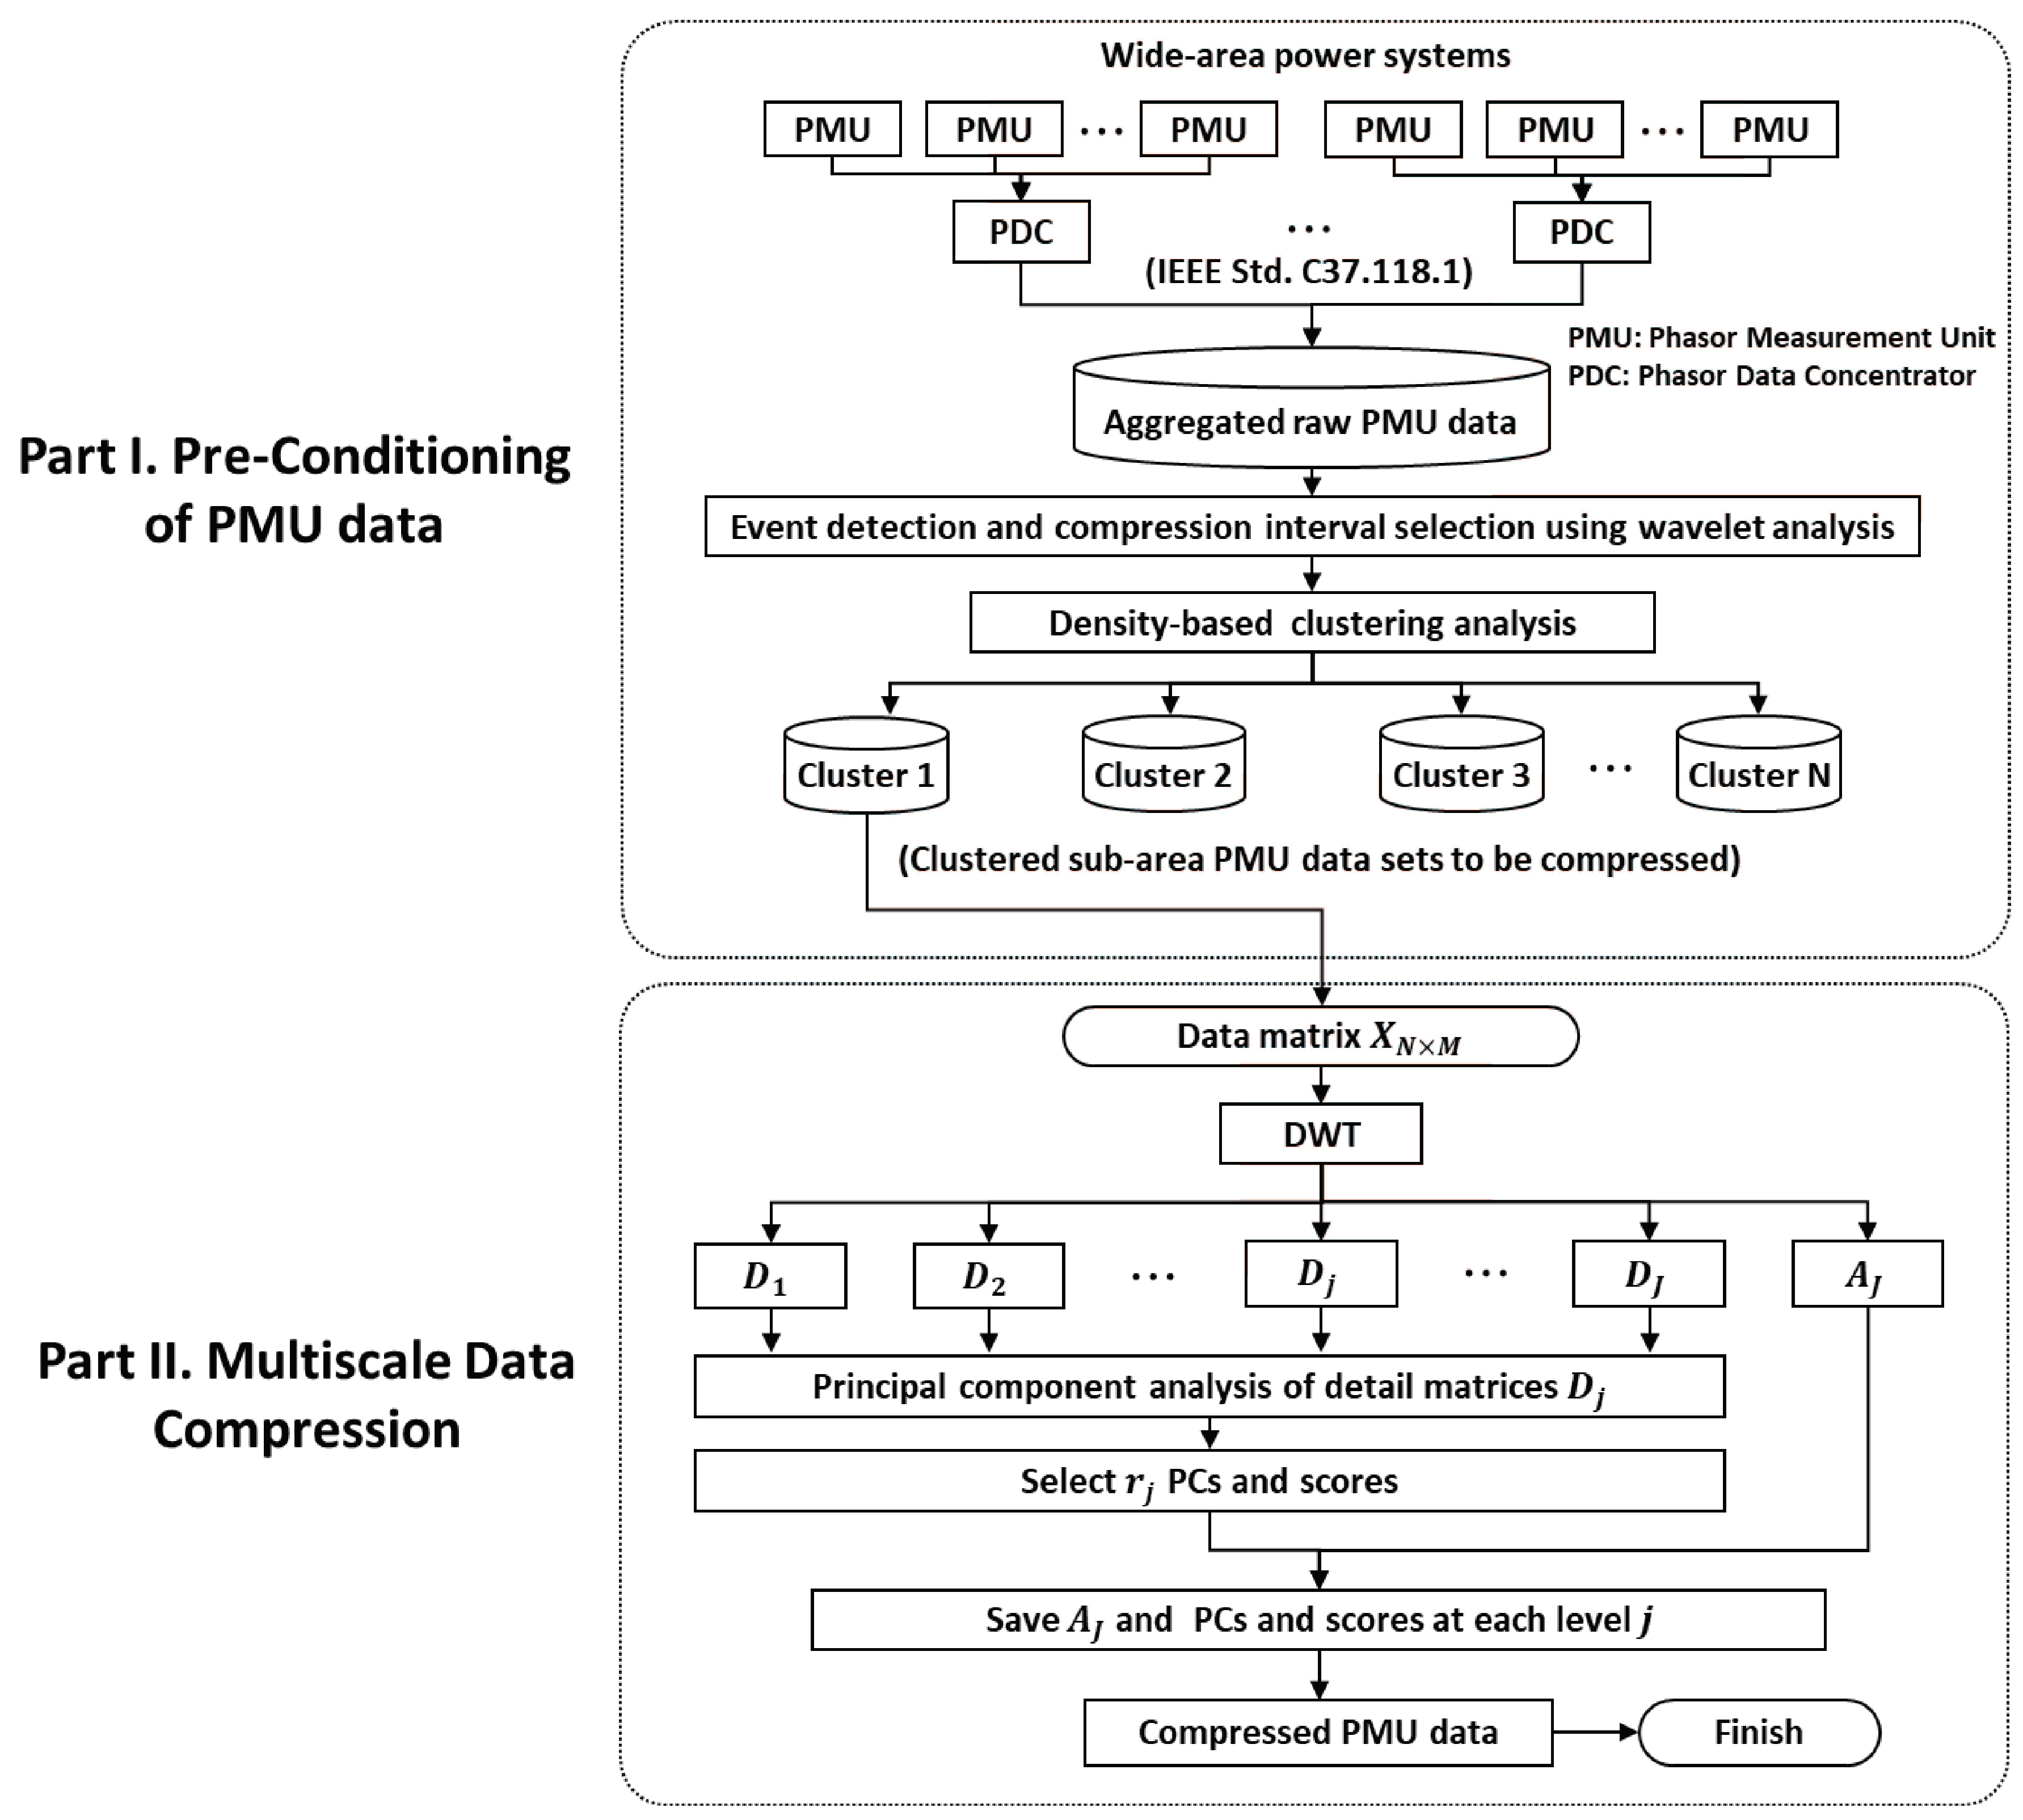
3. Framework for PMU Data Compression
3.1. Preconditioning of PMU Data
3.1.1. Event Detection and Compression Interval Selection
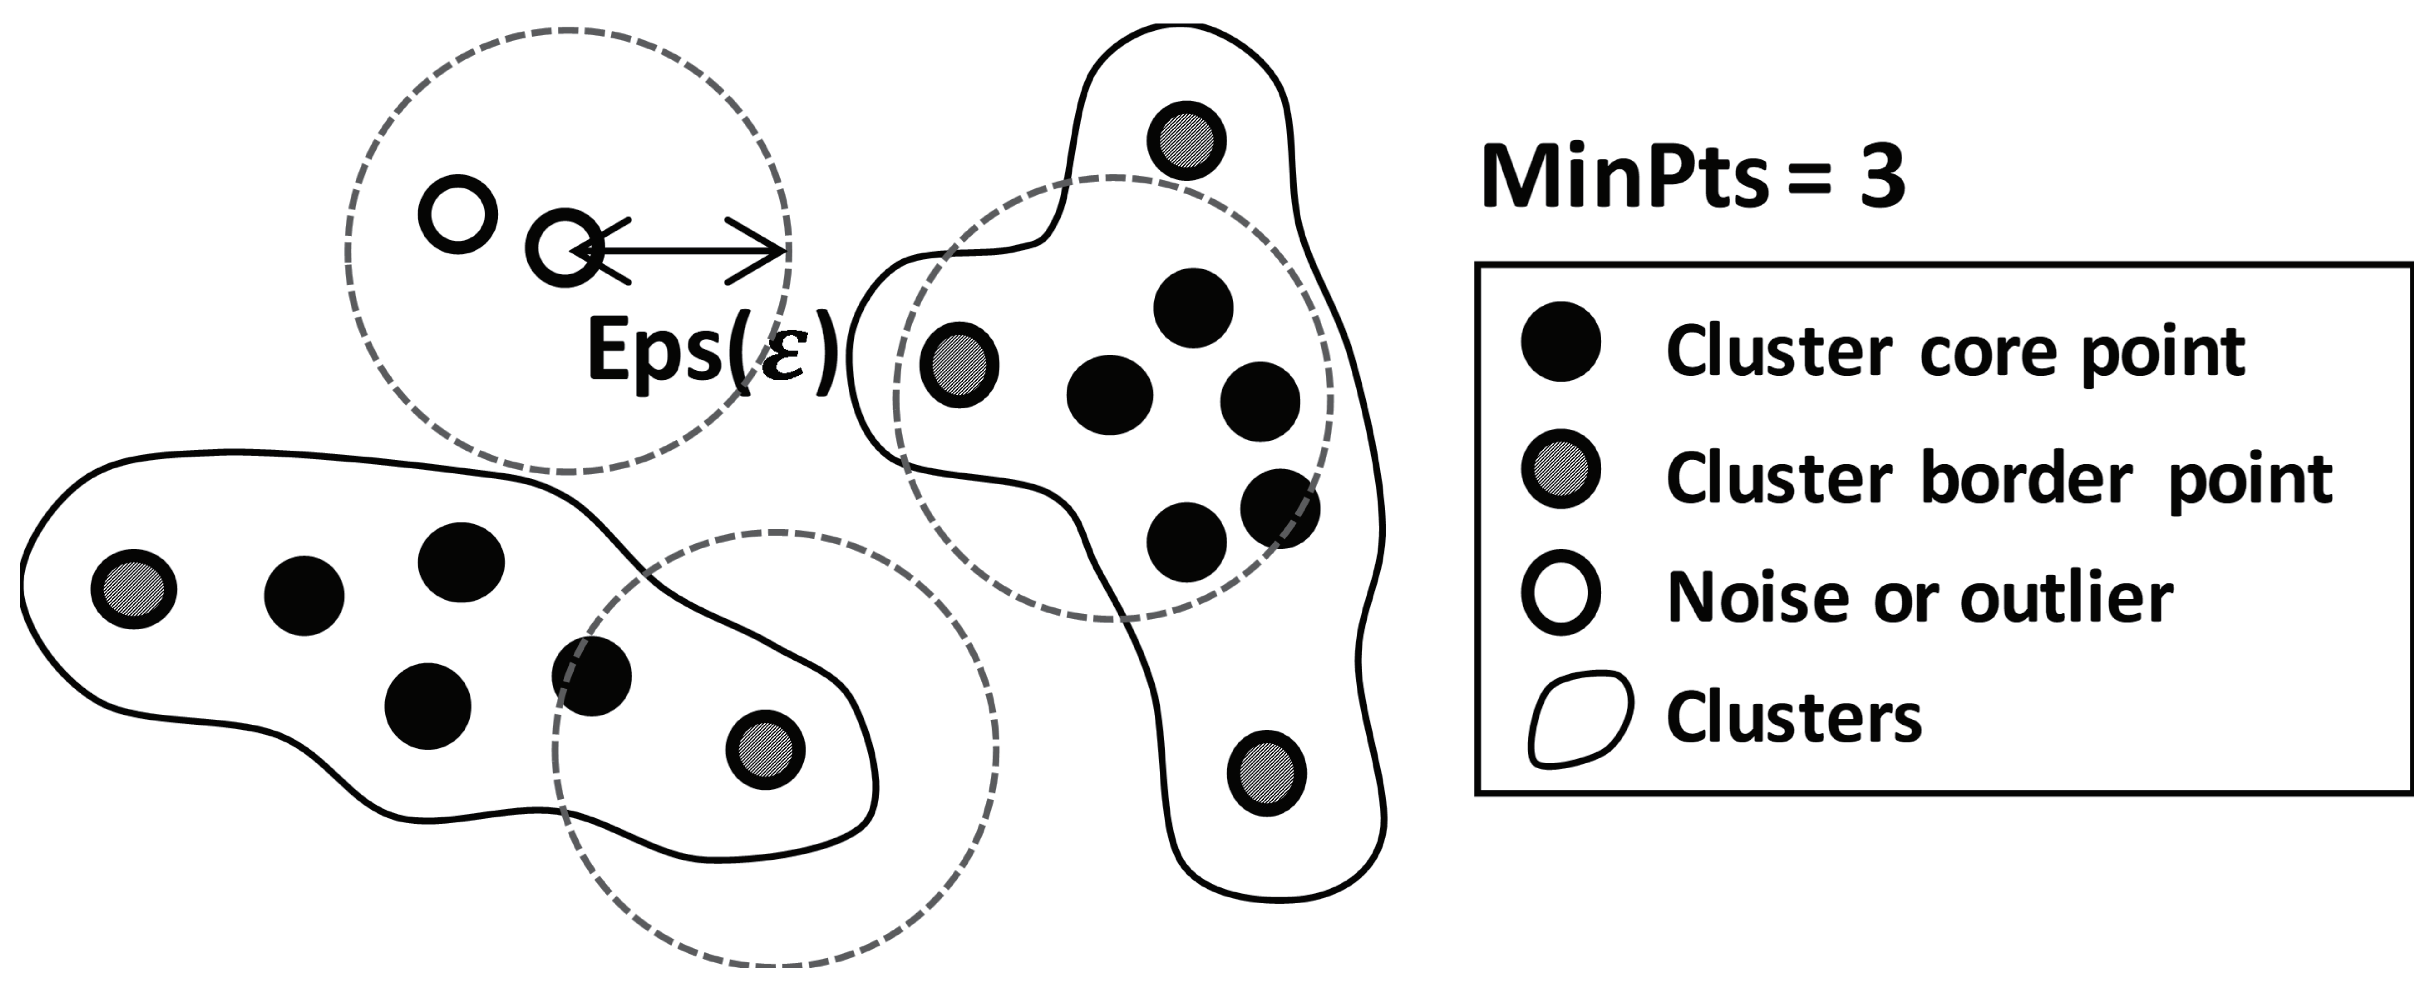
3.1.2. PMU Data Clustering Using DBSCAN
- -neighborhood: points within an from a point p.
- Core point: a point of which the -neighborhood contains at least of points.
- Border point: a point has neighbor points within a fewer than , but is the neighbor of a core point.
- Directly density-reachable: a point q is directly density-reachable from a point p if q is within the -neighborhood of p, and p is a core point.
- Density-reachable: a point p is density-reachable from q with regard to and if there is a chain of objects with , , such that is directly density-reachable from with regard to and for all .
- Density-connected: a point p is density-connected to object q with regard to and if there is a point o, such that both p and q are density-reachable from o with regard to and .
- Cluster C in a set of points D with regard to and is a nonempty subset of D, such that
- -
- Maximalirty: for all , if , and if q is density-reachable from p with regard to and , then .
- -
- Connectivity: for all , p is density-connected to q with regard to and in D.
- Outliers: points that are not directly density-reachable from at least one core point.
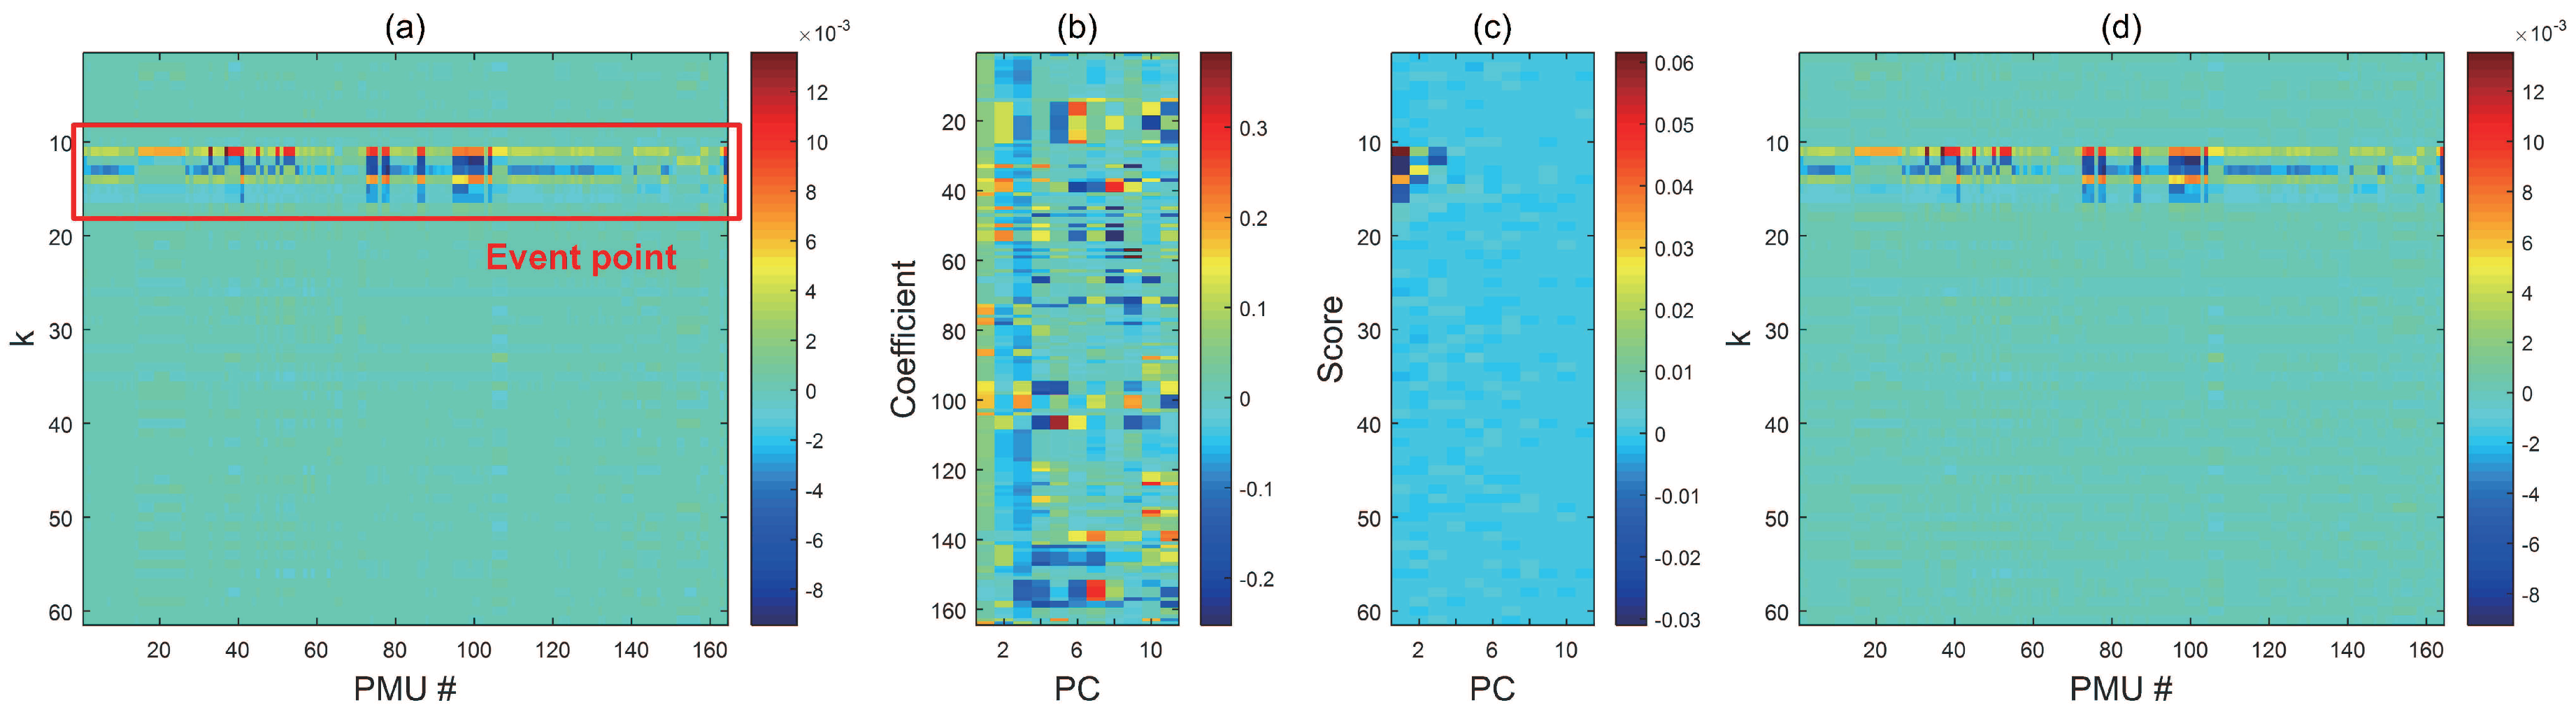
3.2. Data Compression via MSPCA
3.3. Performance Evaluation
4. Experiments
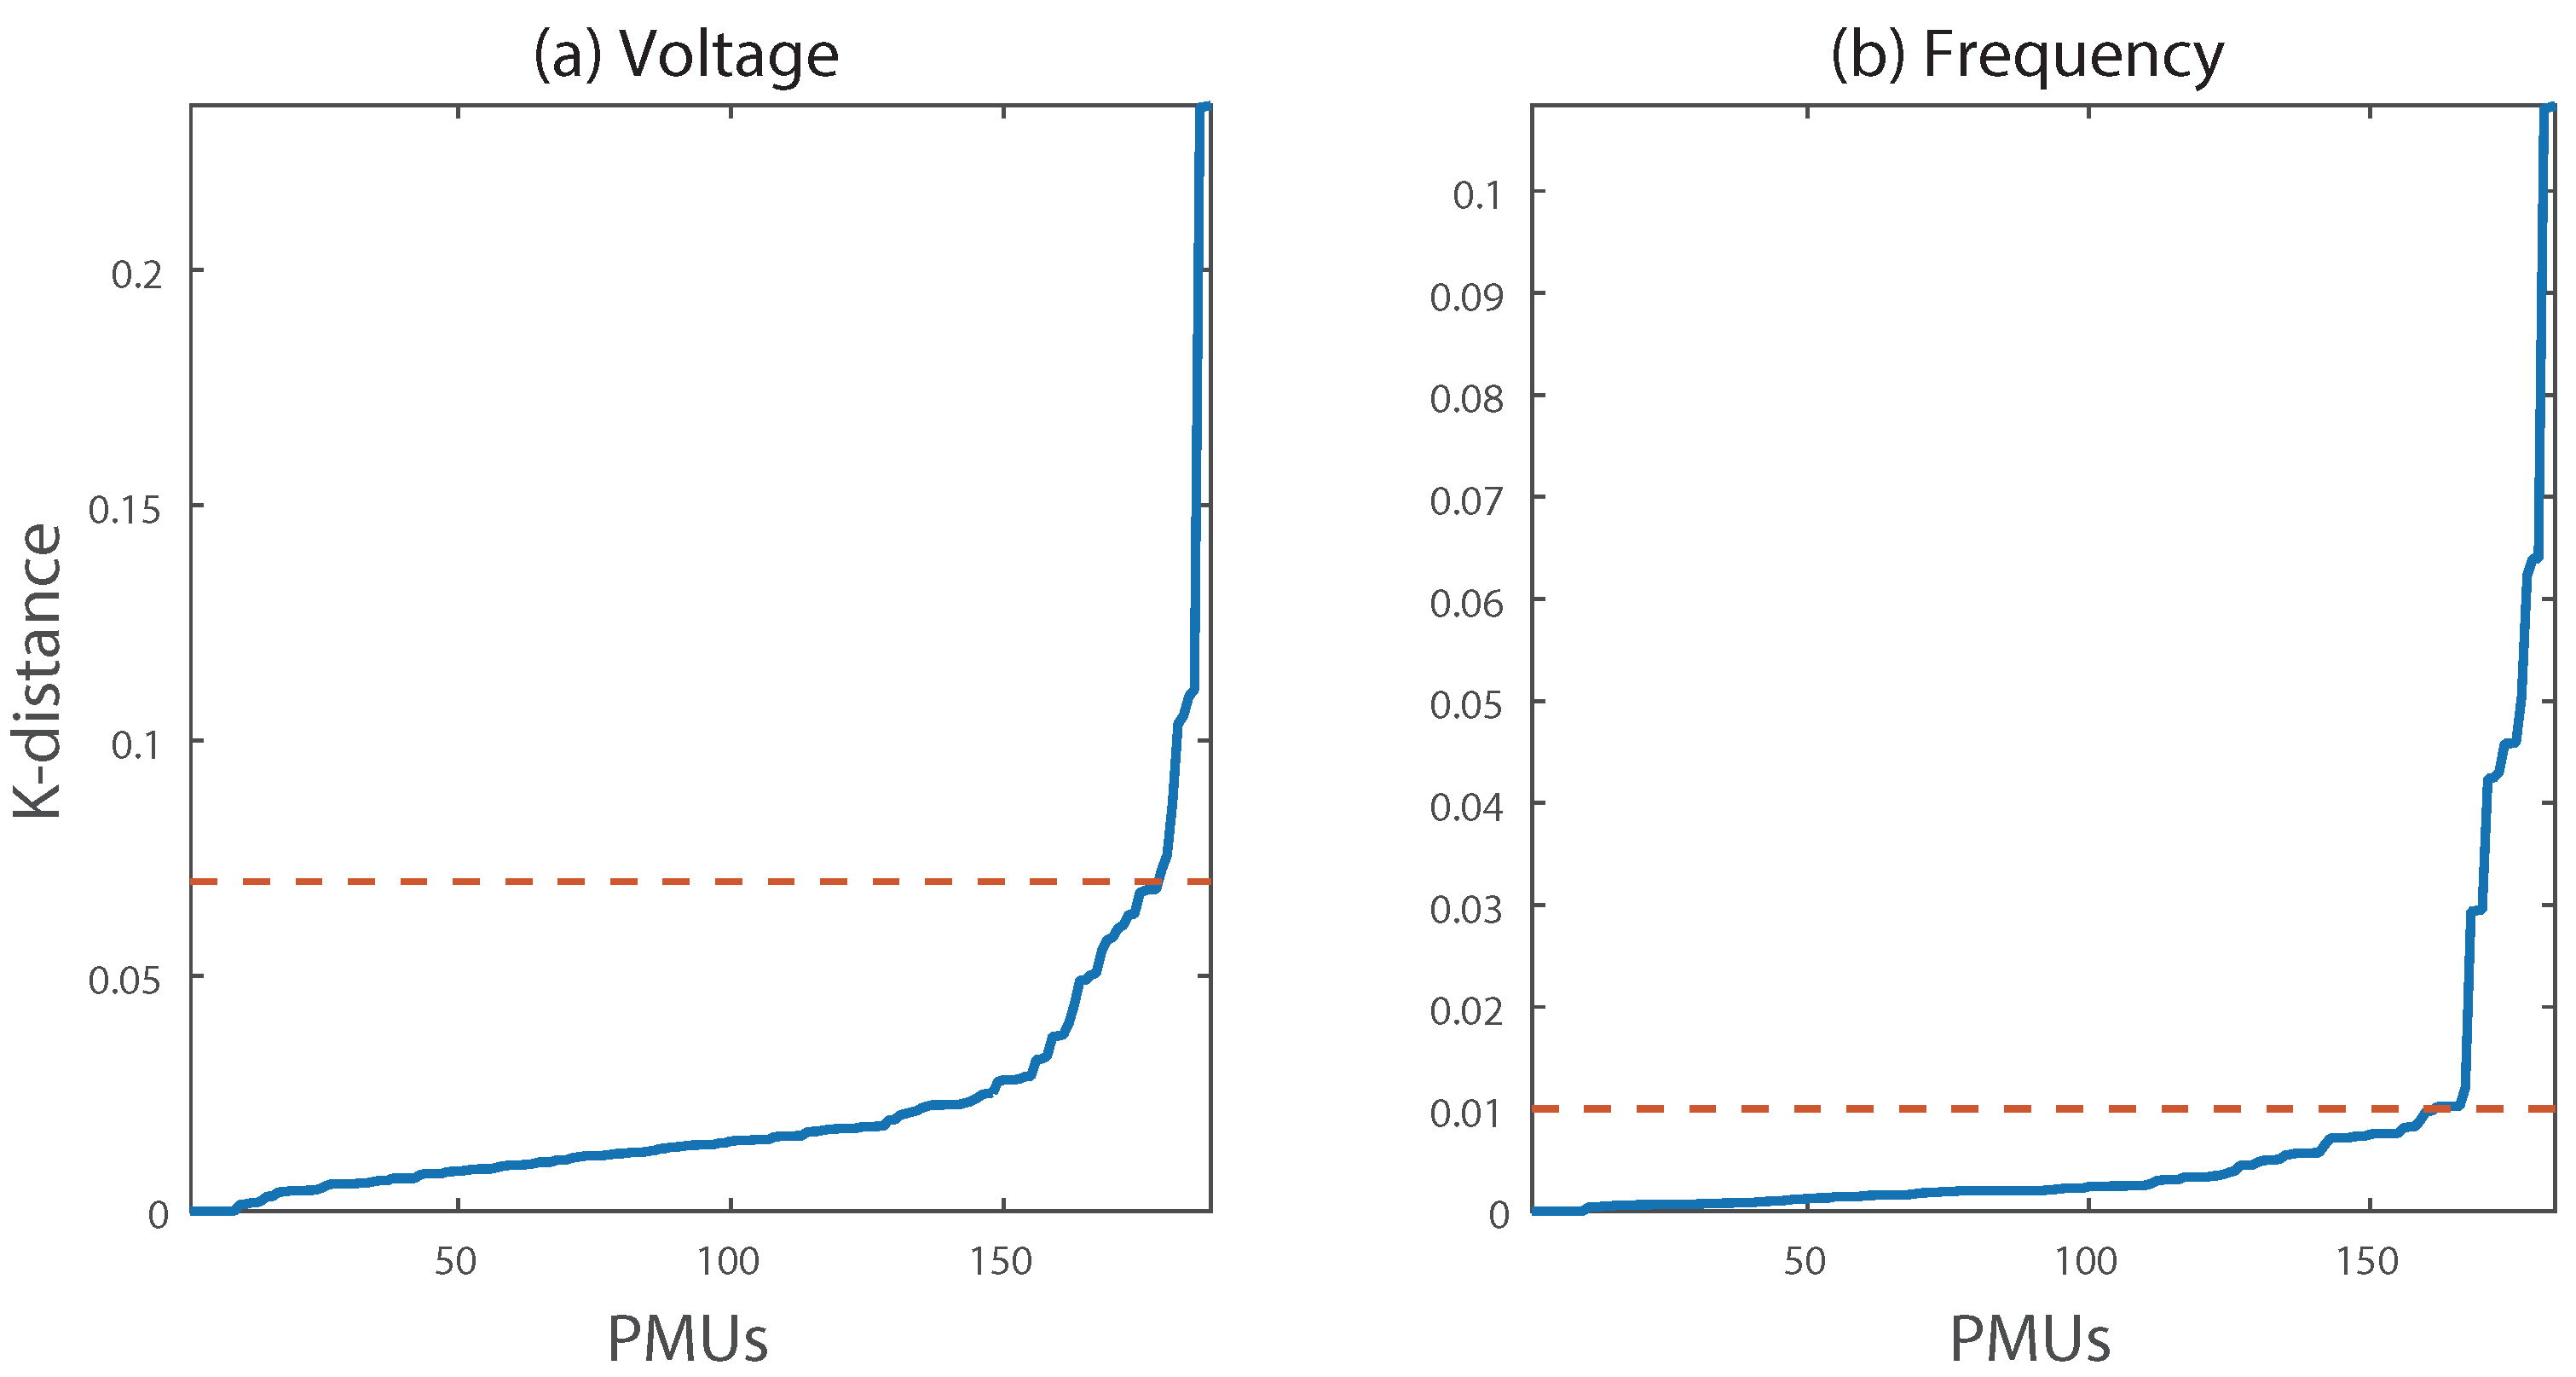
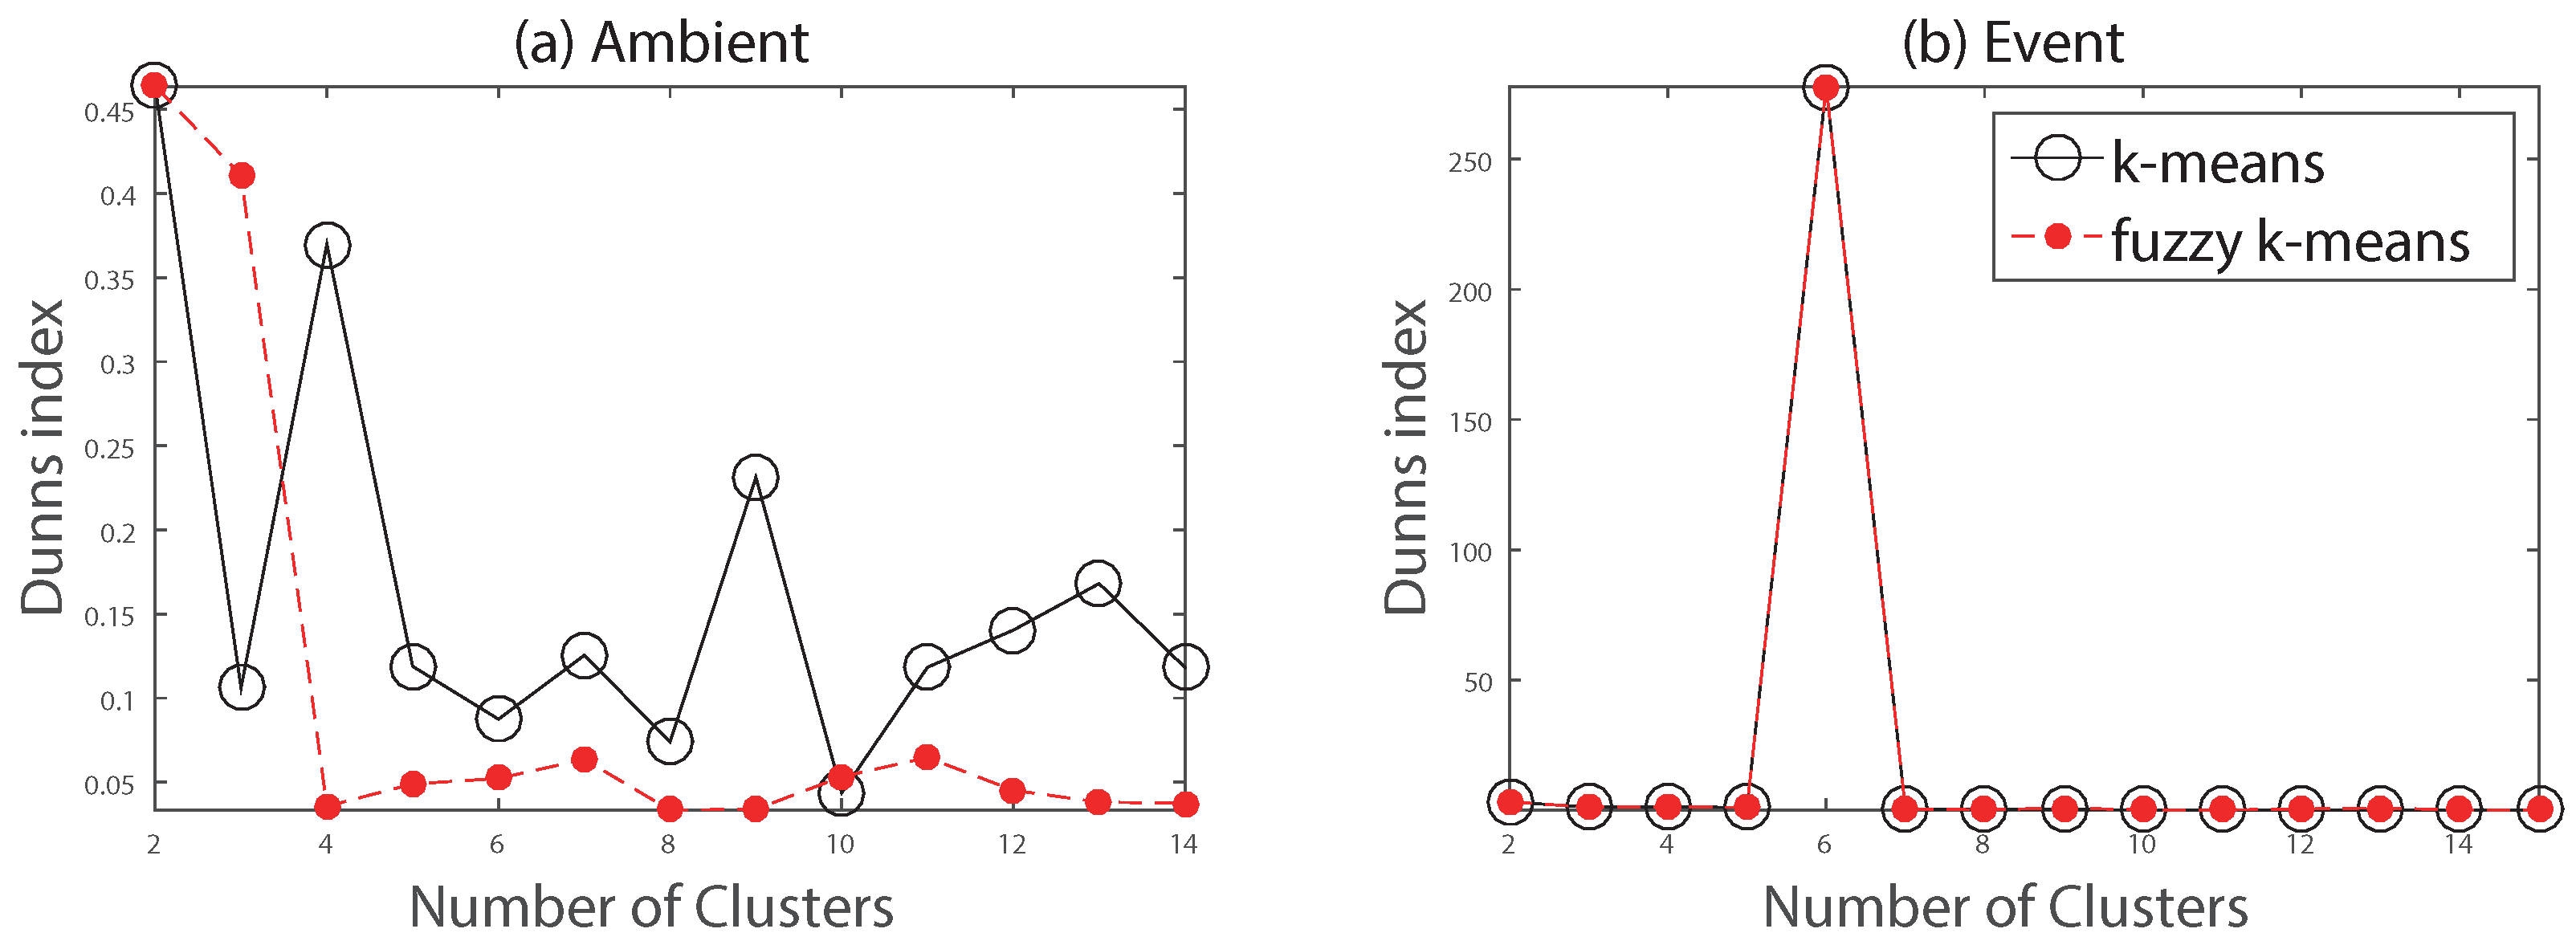
4.1. Selecting DBSCAN Density Parameters
4.2. MSPCA Parameter Setting
5. Application to Real-World Data
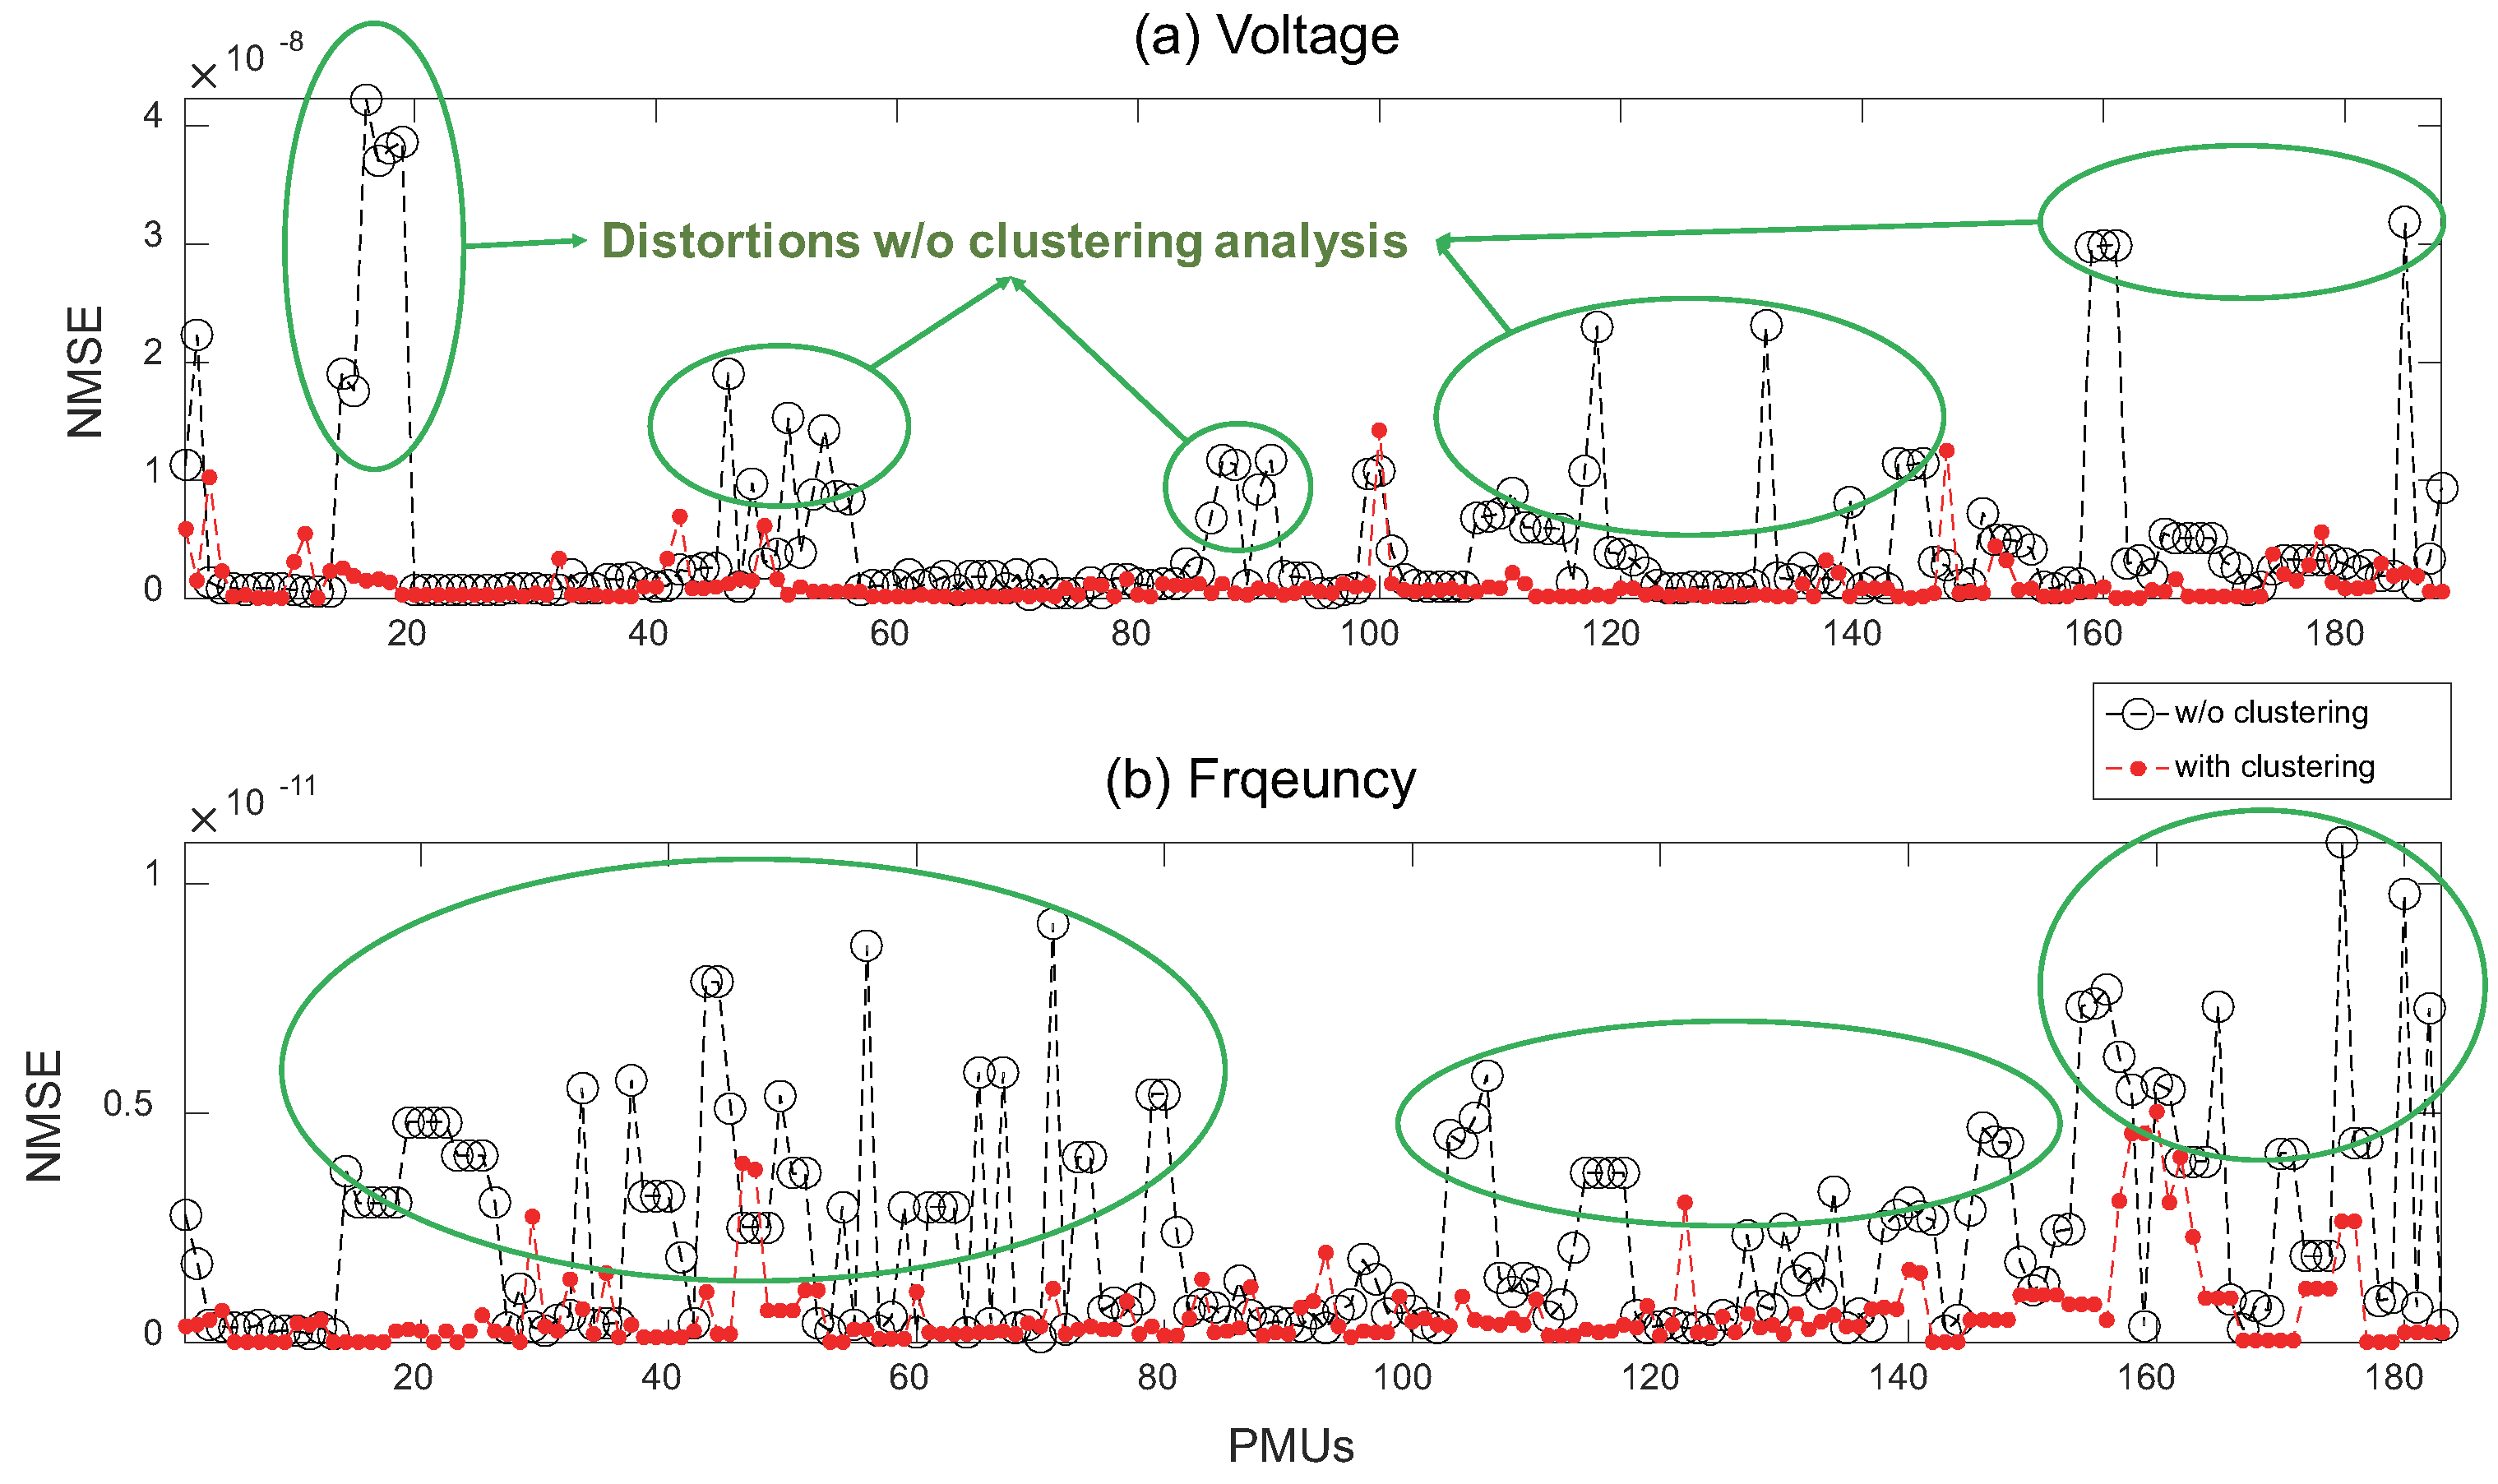
5.1. Evaluation of Proposed Method by Application
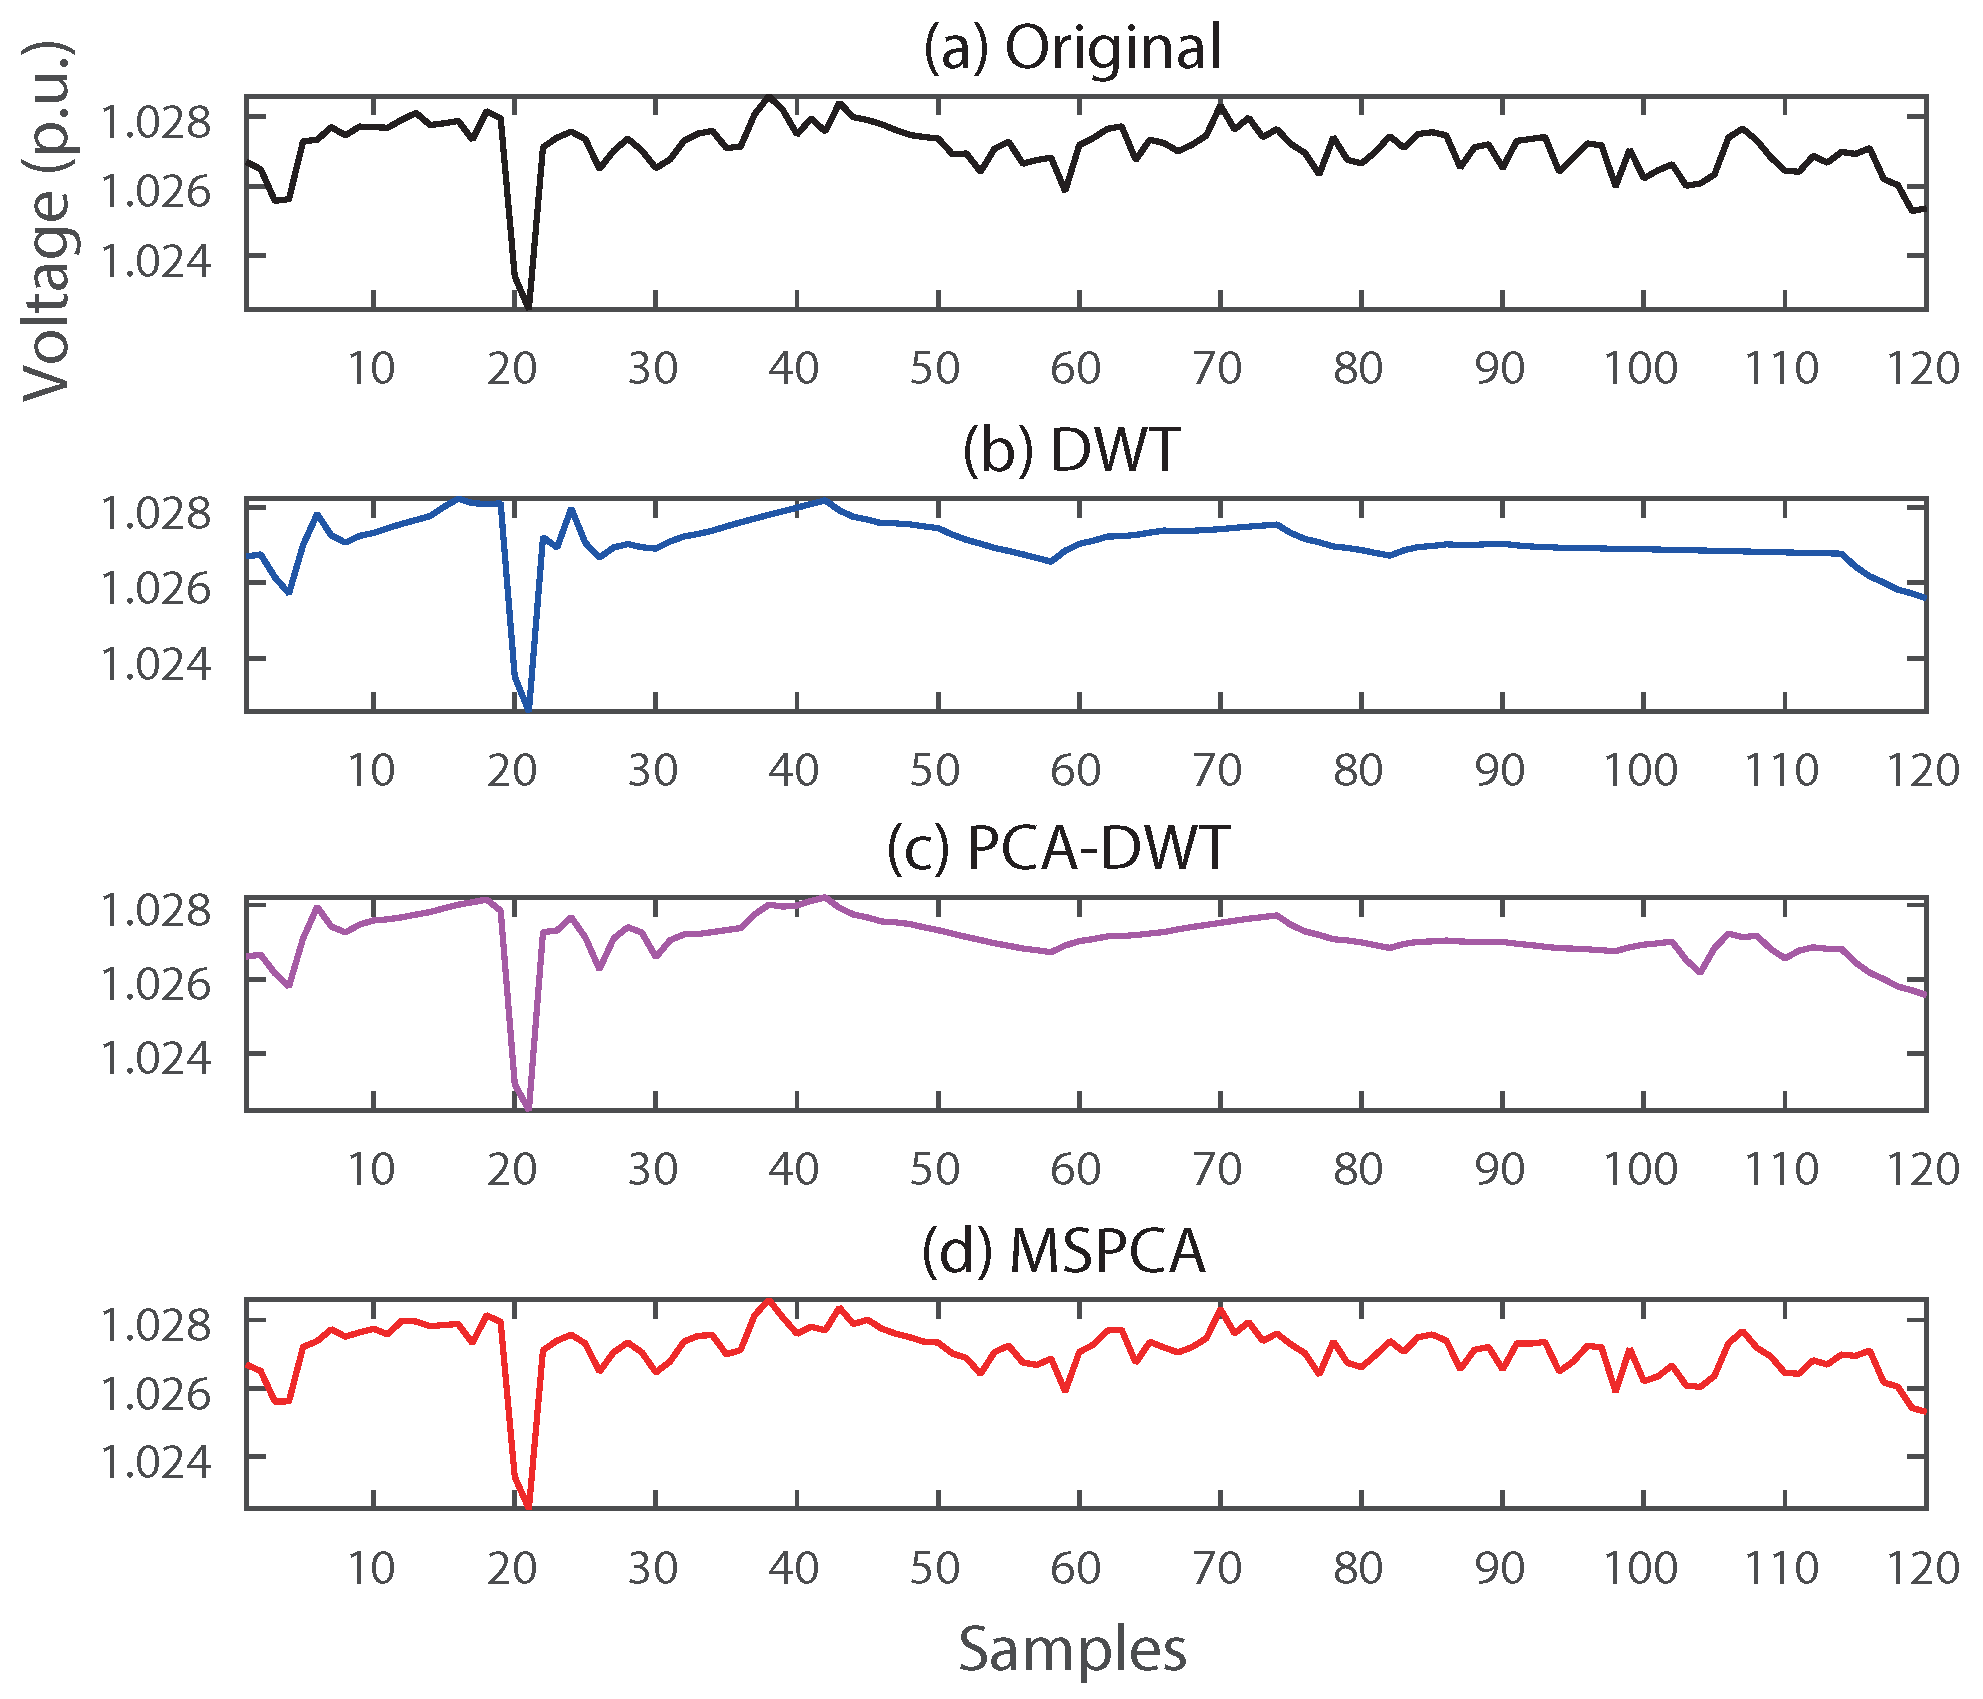
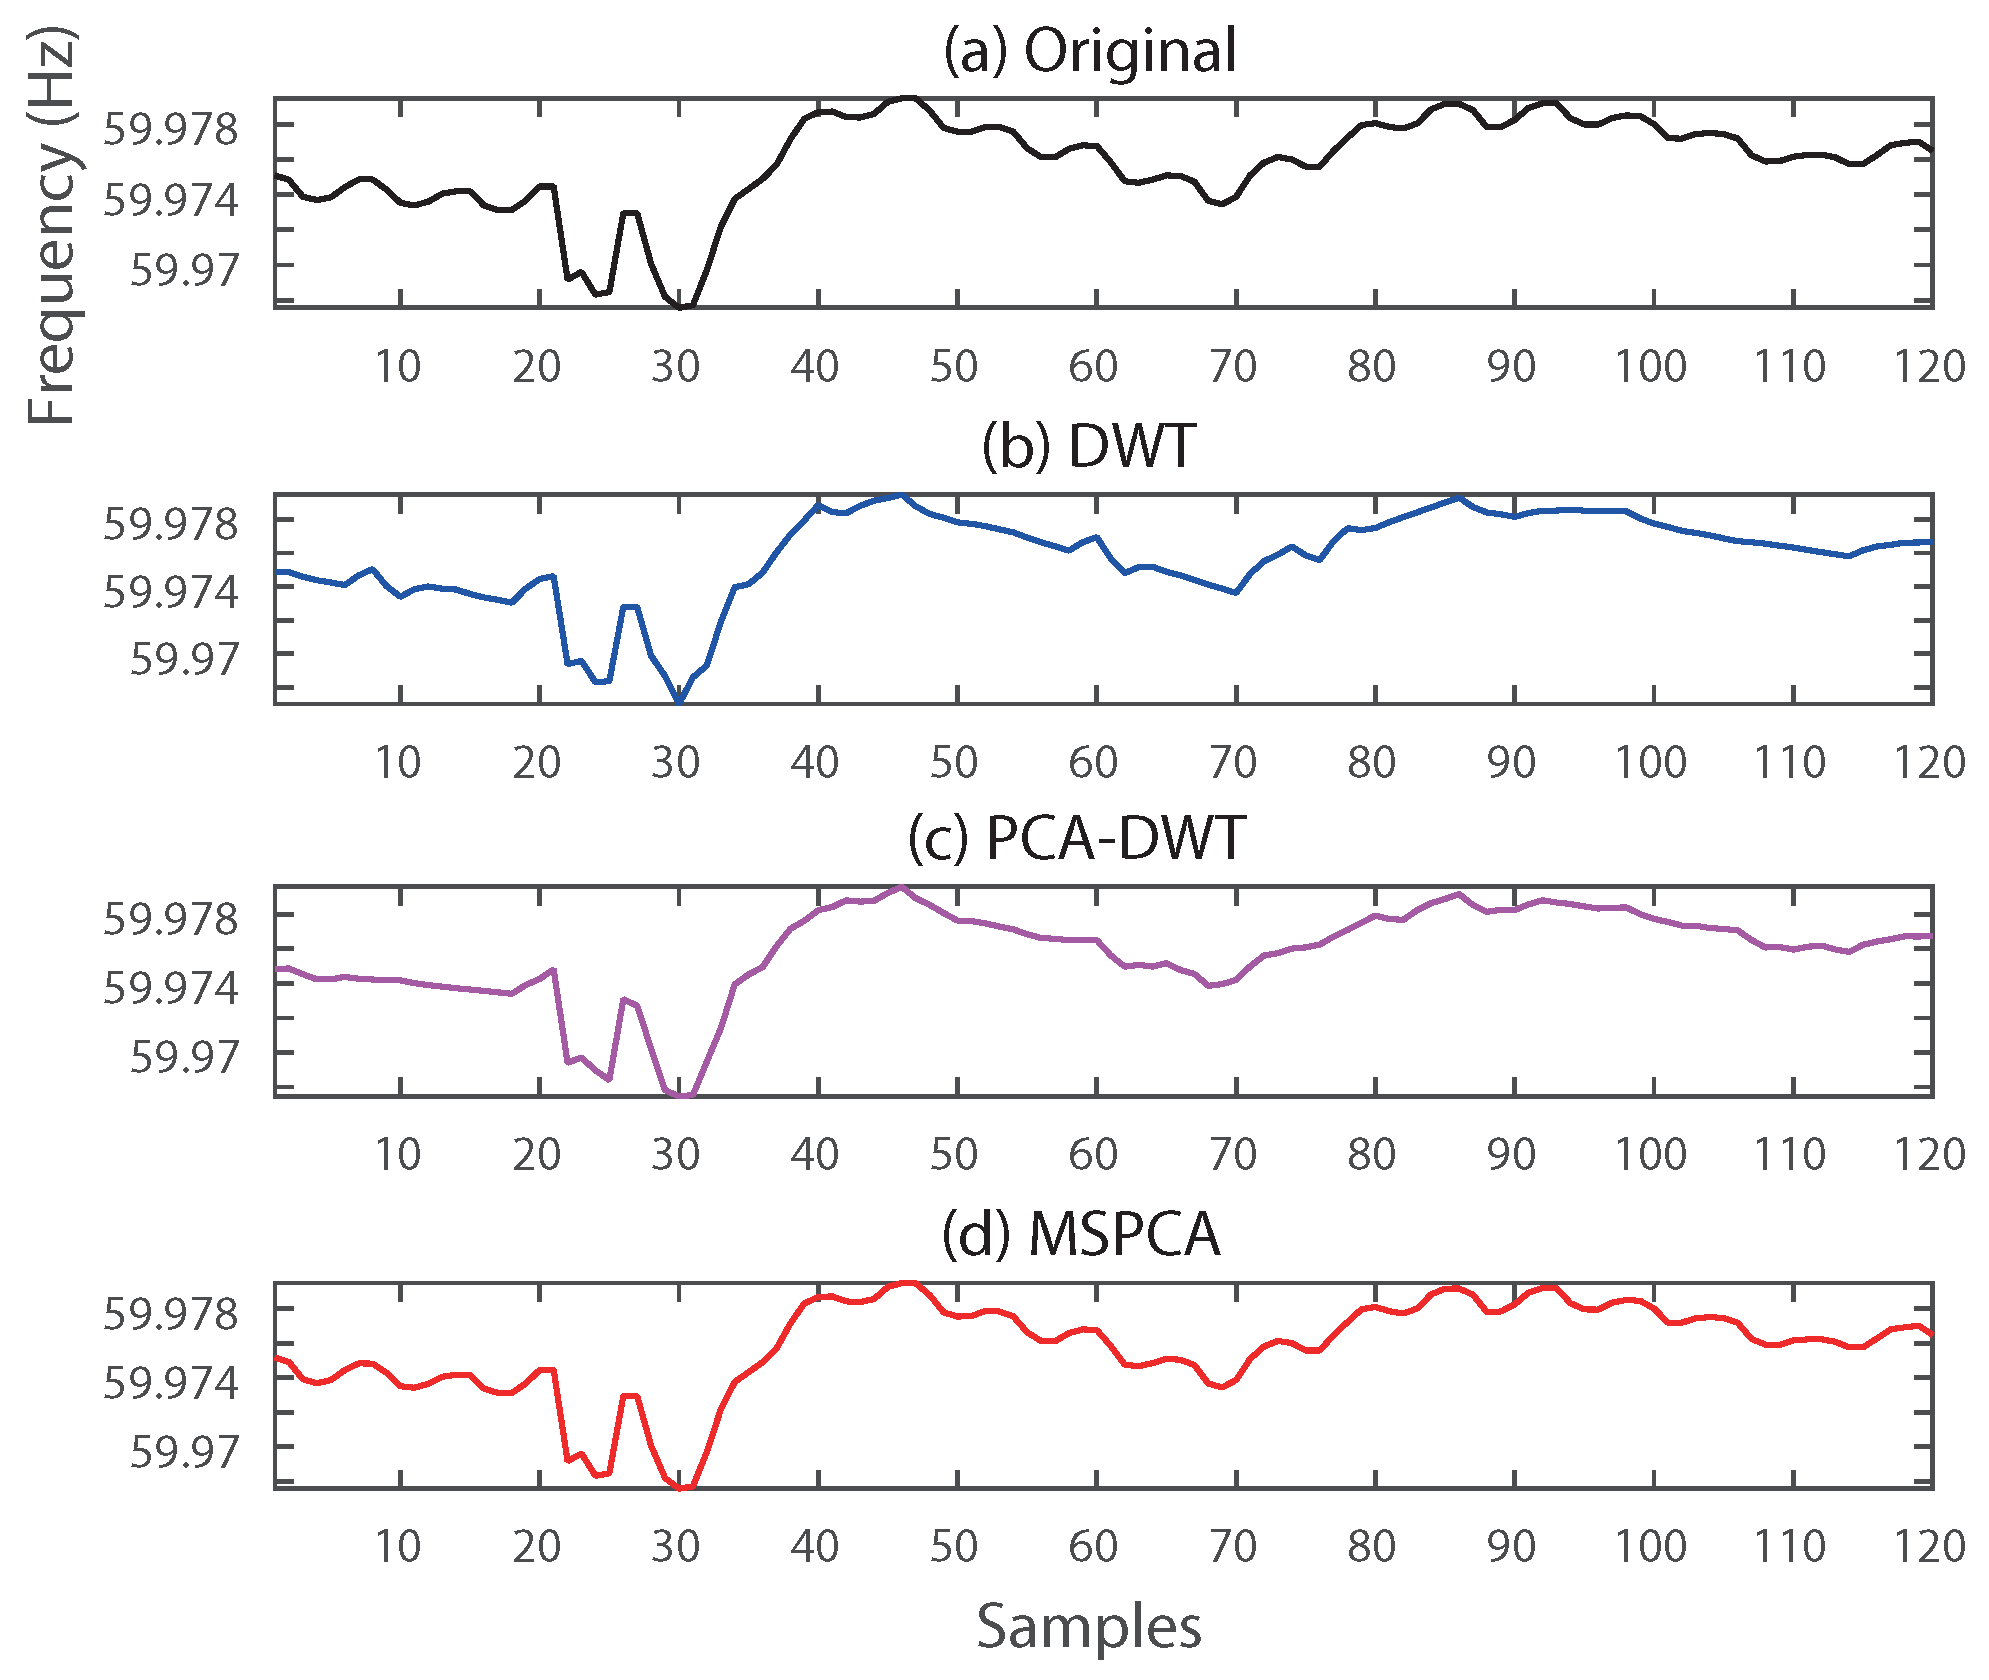
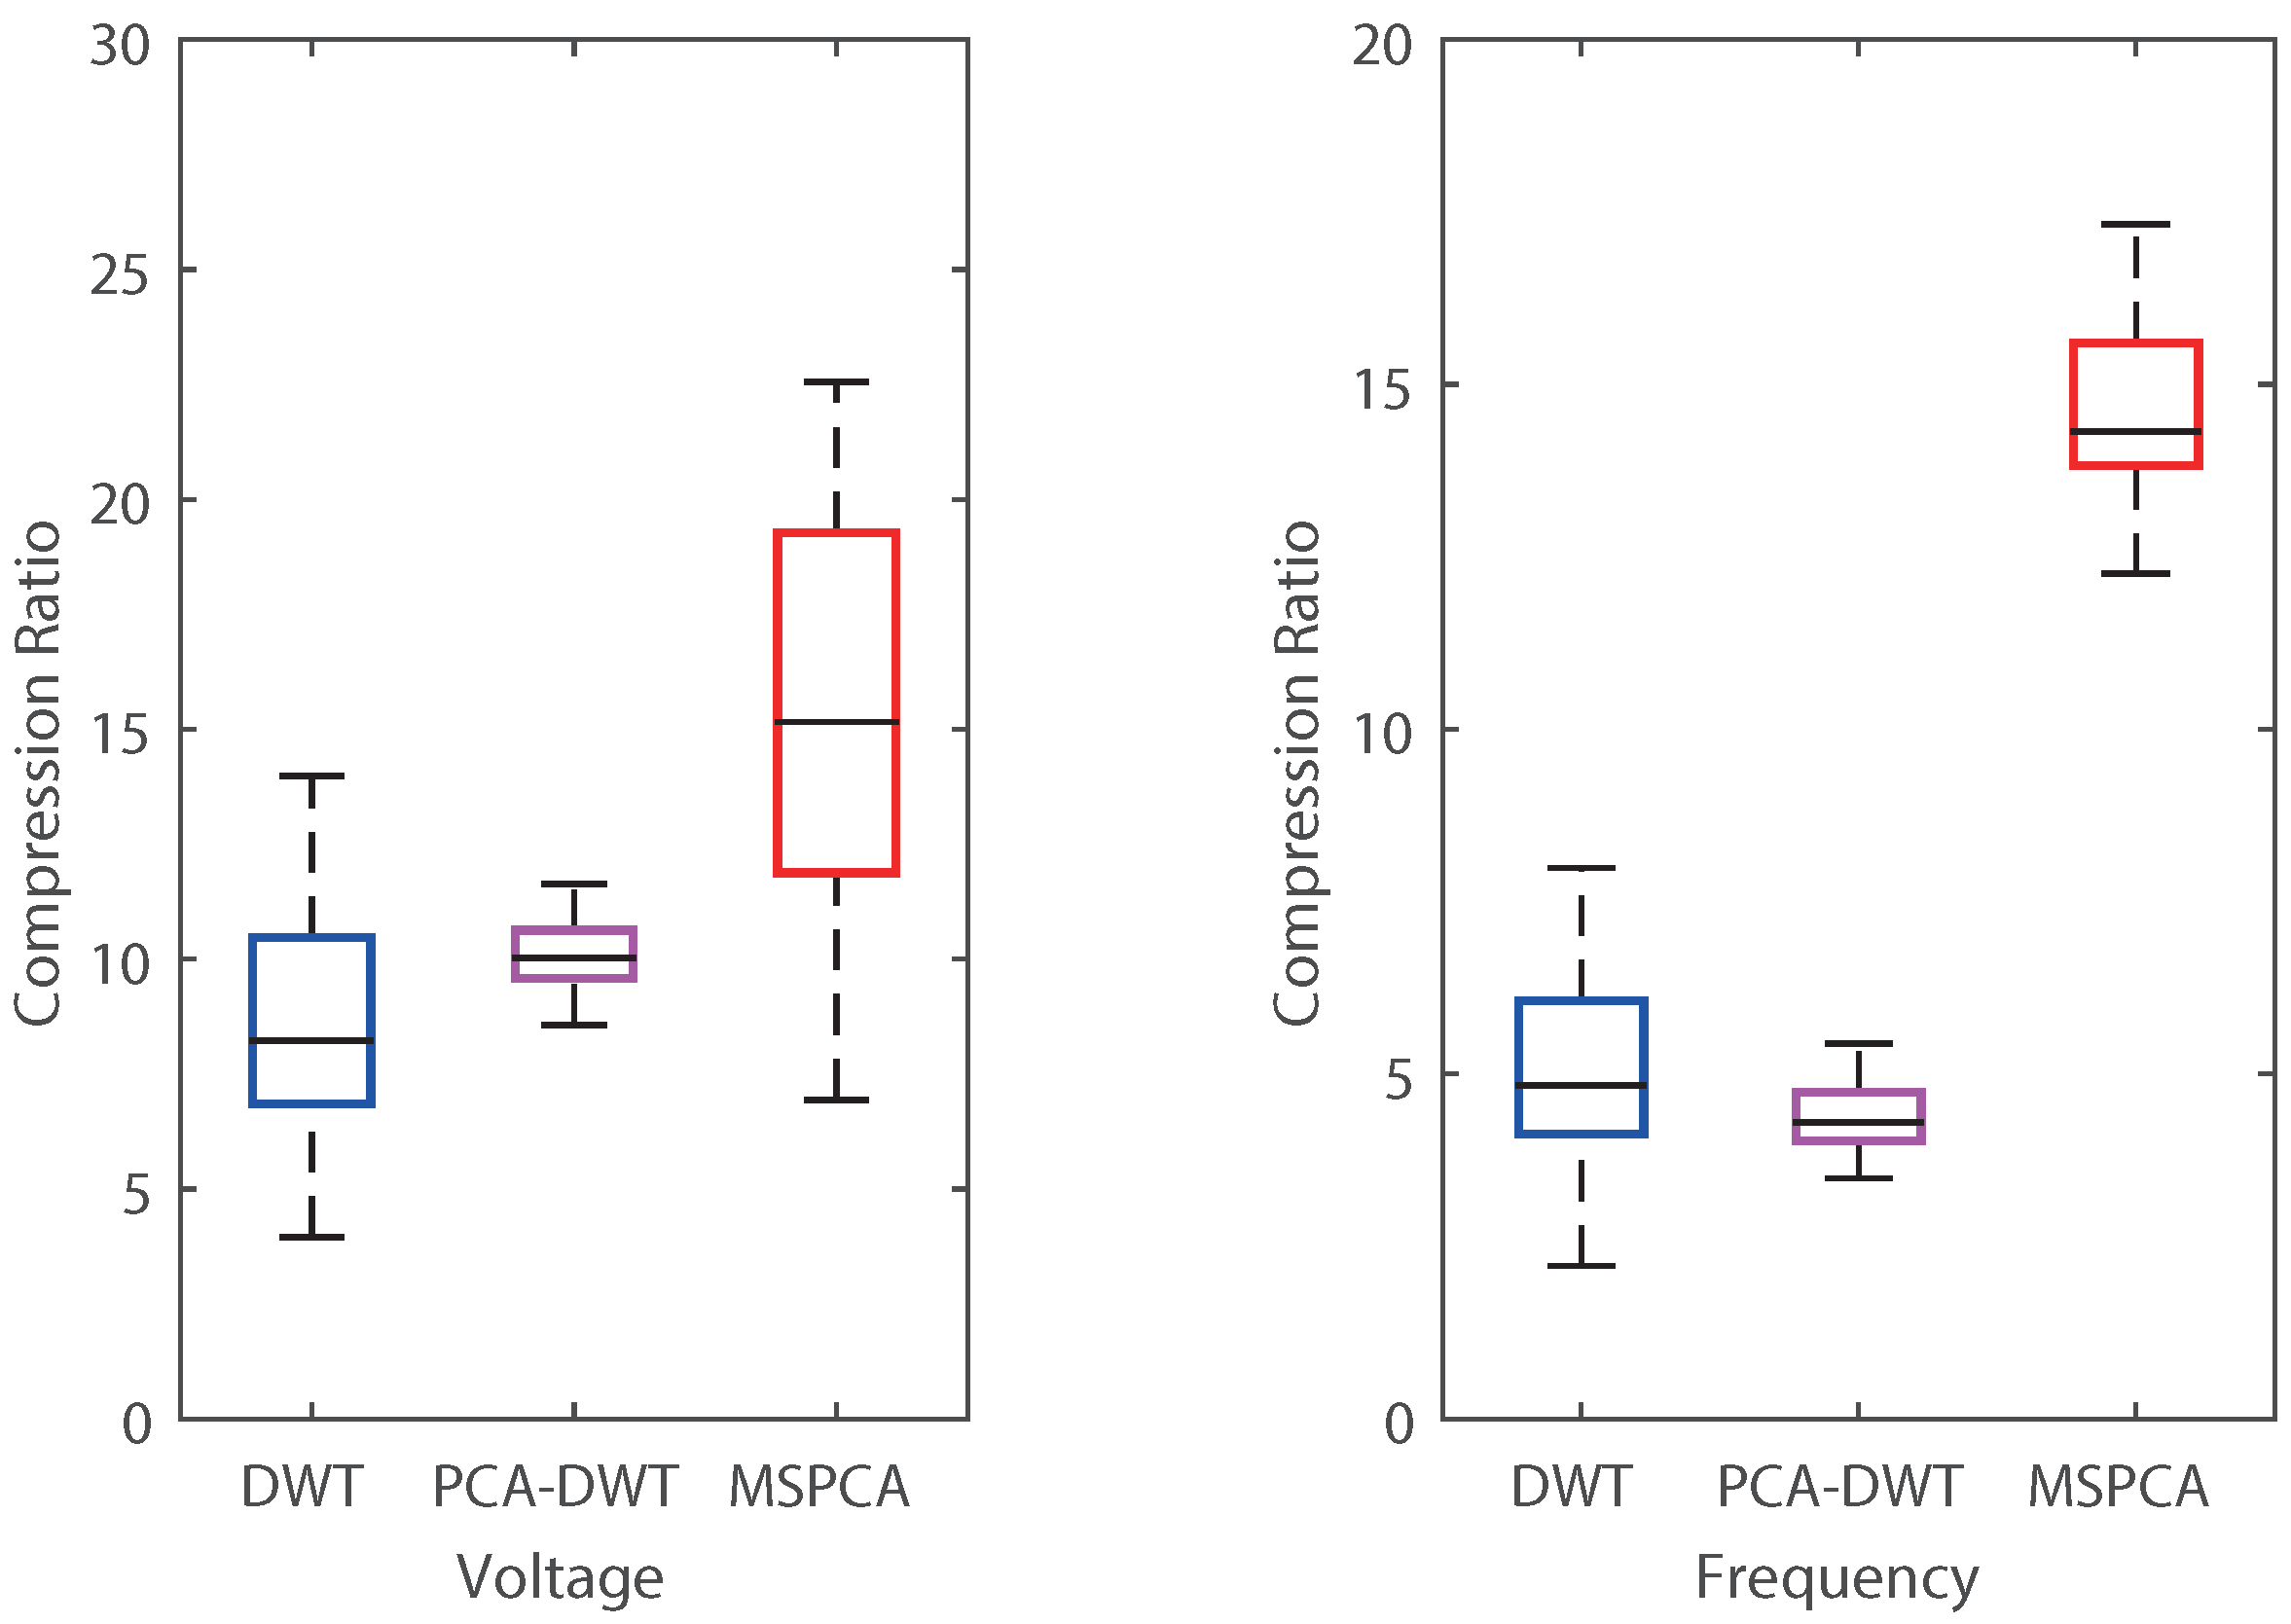
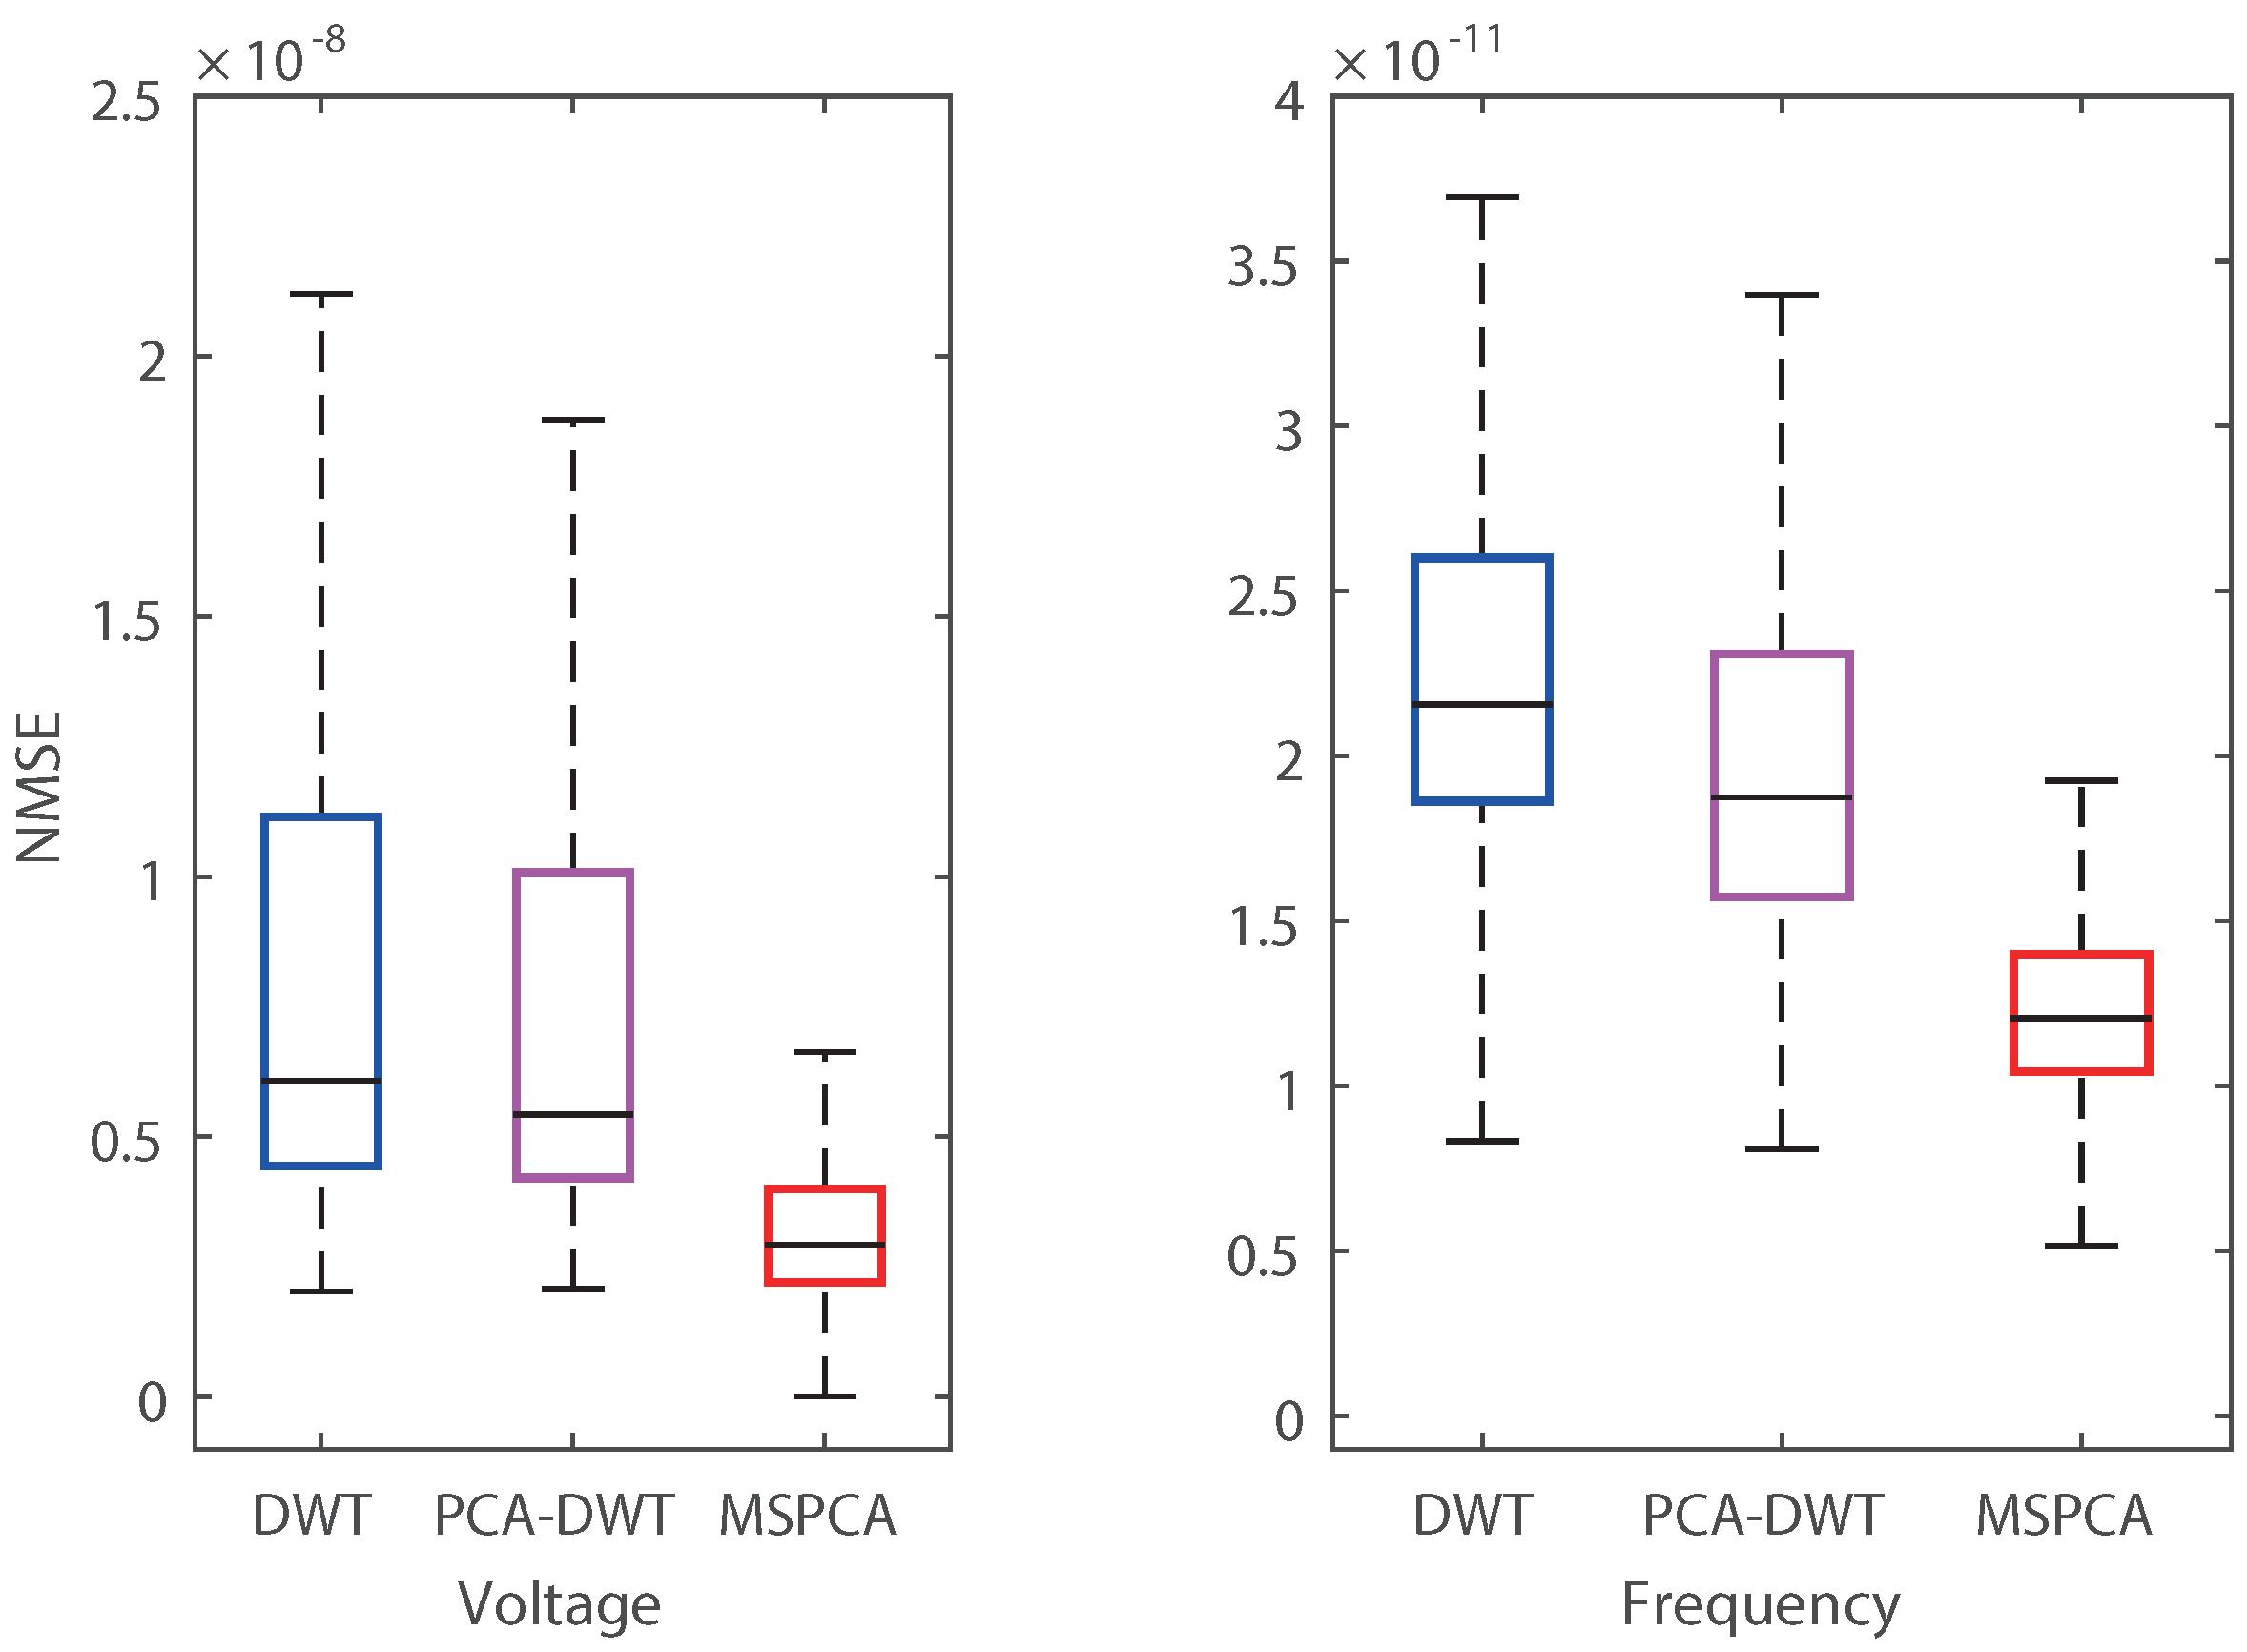
5.2. Comparison with Existing Approaches by Case Studies
6. Conclusions
Author Contributions
Acknowledgments
Conflicts of Interest
References
- Aminifar, F.; Fotuhi-Firuzabad, M.; Safdarian, A.; Davoudi, A. Shahidehpour, M. Synchrophasor measurement technology in power systems: Panorama and state-of-the-art. IEEE Access 2014, 1, 1607–1628. [Google Scholar] [CrossRef]
- White, A.; Jacobs, S. Use of Synchrophasor at OG&E. Available online: https://www.naspi.org/File.aspx?fileID=1318 (accessed on 26 August 2014).
- Das, S.; Sidhu, T.S. Application of compressive sampling in synchrophasor data communication in WAMS. IEEE Trans. Ind. Informat. 2015, 10, 450–460. [Google Scholar] [CrossRef]
- Zhang, F.; Cheng, L.; Li, X.; Sun, Y.; Gao, W.; Zhao, W. Application of a real-time data compression and adapted protocol techniques for WAMS. IEEE Trans. Power Syst. 2015, 30, 653–662. [Google Scholar] [CrossRef]
- Ning, J.; Wang, J.; Gao, W.; Liu, C. A wavelet-based data compression technique for smart grid. IEEE Trans. Smart Grid 2011, 2, 212–218. [Google Scholar] [CrossRef]
- Khan, J.; Bhuiyan, S.M.A.; Murphy, G.; Arline, M. Embedded-zerotree-wavelet-based data denoising and compression for smart grid. IEEE Trans. Ind. Appl. 2015, 51, 4190–4200. [Google Scholar] [CrossRef]
- Das, S.; Rao, P.S.N. Principal component analysis based compression scheme for power system steady state operational data. In Proceedings of the IEEE PES Innovative Smart Grid Technologies-India, Kollam, India, 1–3 December 2011. [Google Scholar]
- Mehra, R.; Bhatty, N.; Kazi, F.; Singh, N.M. Analysis of PCA based compression and denoising of smart grid data under normal and fault conditions. In Proceedings of the IEEE International Conference on Electronics, Computing and Communication Technologies, Bangalore, India, 17–19 January 2013. [Google Scholar]
- Ge, Y.; Flueck, A.J.; Kim, D.-K.; Ahn, J.-B.; Lee, J.-D.; Kwon, D.-Y. Power system real-time event detection and associated data archival reduction based on synchrophasors. IEEE Trans. Power Syst. 2015, 6, 2088–2097. [Google Scholar] [CrossRef]
- Gao, P.; Wang, M.; Ghiocel, S.G.; Chow, J.H.; Fardanesh, B.; Stefopoulos, G. Missing data recovery by exploiting low-dimensionality in power system synchrophasor measurements. IEEE Trans. Power Syst. 2016, 31, 1006–1013. [Google Scholar] [CrossRef]
- Gadde, P.H.; Biswal, M.; Brahma, S.; Cao, H. Efficient compression of PMU Data in WAMS. IEEE Trans. Smart Grid 2016, 7, 2406–2413. [Google Scholar] [CrossRef]
- Zhang, F.; Cheng, L.; Li, X.; Sun, Y.; Gao, W.; Zhao, W. Dimensionality reduction of synchrophasor data for early event detection: Linearized analysis. IEEE Trans. Power Syst. 2014, 29, 2784–2794. [Google Scholar]
- Kiu, X.; Laverty, D.M.; Best, R.J.; Li, K.; Morrow, D.J.; McLoone, S. Principal component analysis of wide-area phasor measurement for islanding detection a geometric view. IEEE Trans. Power Deliv. 2015, 30, 976–985. [Google Scholar]
- Tang, Y.; Li, F.; Zheng, C.; Wang, Q.; Wu, Y. PMU Measurement-Based Intelligent Strategy for Power System Controlled Islanding. Energies 2018, 11, 143. [Google Scholar] [CrossRef]
- Kim, D.-I.; Chun, T.Y.; Yoon, S.-H.; Lee, G.; Shin, Y.-J. Wavelet-based event detection method using PMU data. IEEE Trans. Smart Grid 2017, 8, 1154–1162. [Google Scholar] [CrossRef]
- Lotfifard, S. Sparse sensing slatform for line-outage identification in multiarea power systems. IEEE Trans. Ind. Informat. 2017, 13, 947–955. [Google Scholar] [CrossRef]
- Khoa, N.M.; Tung, D.D. Locating Fault on Transmission Line with Static Var Compensator Based on Phasor Measurement Unit. Energies 2018, 11, 2380. [Google Scholar] [CrossRef]
- Klaric, M.; Kuzle, I.; Holjevac, N. Wind Power Monitoring and Control Based on Synchrophasor Measurement Data Mining. Energies 2018, 11, 3525. [Google Scholar] [CrossRef]
- Esparza, A.; Segundo, J.; Nuñez, C.; Visairo, N.; Barocio, E.; García, H. Transient Stability Enhancement Using a Wide-Area Controlled SVC: An HIL Validation Approach. Energies 2018, 11, 1639. [Google Scholar] [CrossRef]
- Ivanković, I.; Kuzle, I.; Holjevac, N. Algorithm for Fast and Efficient Detection and Reaction to Angle Instability Conditions Using Phasor Measurement Unit Data. Energies 2018, 11, 681. [Google Scholar] [CrossRef]
- Zhao, J.; Zhang, G.; Scala, M.L.; Wang, Z. Enhanced robustness of state estimator to bad data processing through multi-innovation analysis. IEEE Trans. Ind. Informat. 2017, 13, 1610–1619. [Google Scholar] [CrossRef]
- Lee, G.; Shin, Y.-J. Multiscale PMU data compression based on wide-area event detection. In Proceedings of the IEEE International Conference on Smart Grid Communications (SmartGridComm), Dresden, Germany, 23–27 October 2017. [Google Scholar]
- Kamwa, I.; Pradhan, A.K.; Joos, G. Automatic segmentation of large power systems into fuzzy coherent areas for dynamic vulnerability assessment. IEEE Trans. Power Syst. 2007, 22, 1974–1985. [Google Scholar] [CrossRef]
- Dahal, O.P.; Brahma, S.M.; Cao, H. Comprehensive clustering of disturbance events recorded by phasor measurement units. IEEE Trans. Power Deliv. 2014, 29, 1390–1397. [Google Scholar] [CrossRef]
- Wang, X.; Shi, D.; Wang, Z.; Xu, C.; Zhang, O.; Zhang, X.; Yu, Z. Online calibration of phasor measurement unit using density-based spatial clustering. IEEE Trans. Power Deliv. 2018, 33, 1081–1090. [Google Scholar] [CrossRef]
- Ester, M.; Kriegel, H.-P.; Sander, J.; Xu, X. A density-based algorithm for discovering clusters in large spatial databases with noise. In Proceedings of the Second International Conference on Knowledge Discovery and Data Mining, Portland, OR, USA, 2–4 August 1996. [Google Scholar]
- Bakshi, B.R. Multiscale PCA with application to multivariate statistical monitoring. AIChE J. 1998, 44, 1596–1610. [Google Scholar] [CrossRef]
- Burrus, C.S.; Gopinatha, R.A.; Guo, H. Introduction to Wavelets and Wavelet Transforms—A Primer; Prentice-Hall: Englewood Cliffs, NJ, USA, 1998. [Google Scholar]
- Dunn, J. A fuzzy relative of the ISODATA process and its use in detecting compact well separated clusters. J. Cybern. 1974, 3, 32–57. [Google Scholar] [CrossRef]


| Data Type | Voltage | Frequency |
|---|---|---|
| EC (%) |
| State | Cluster | # of PMUs | # of Bad Data | NMSE (Average) | CR |
|---|---|---|---|---|---|
| Ambient | 0 | 1 | 1 | - | - |
| 1 | 193 | 0 | 18.22 | ||
| Event | 0 | 8 | 7 | - | - |
| 1 | 73 | 0 | 2.83 | ||
| 2 | 6 | 0 | 2.24 | ||
| 3 | 97 | 0 | 3.12 | ||
| 4 | 7 | 0 | 2.03 | ||
| 5 | 3 | 0 | 2.07 |
| State | Cluster | # of PMUs | # of Bad Data | NMSE (Average) | CR |
|---|---|---|---|---|---|
| Ambient | 0 | 1 | 1 | - | - |
| 1 | 193 | 0 | 15.37 | ||
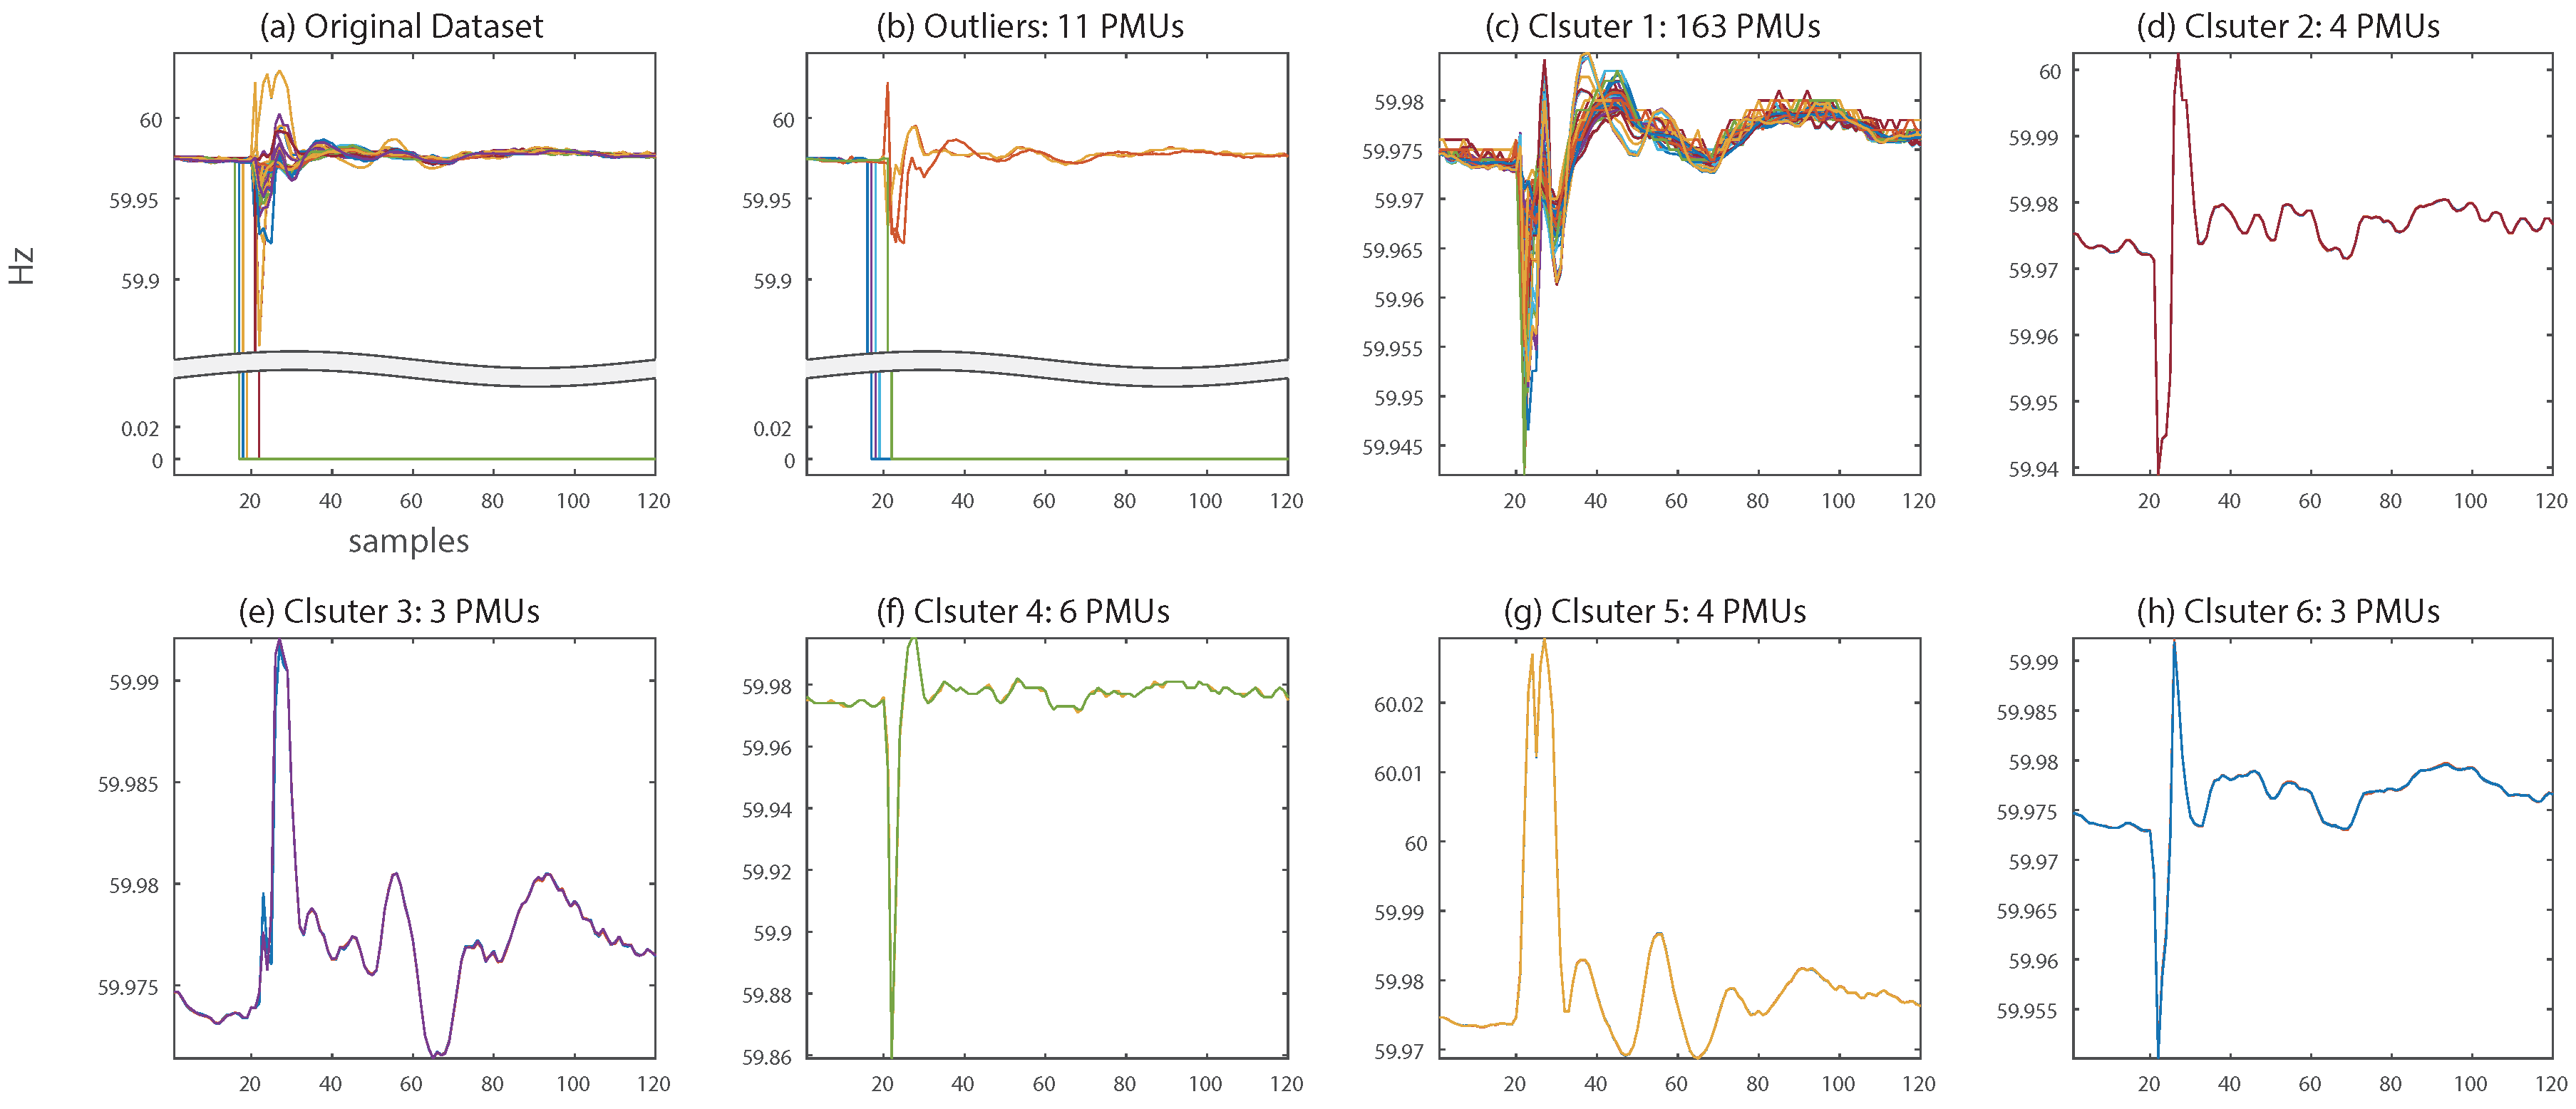
| Event | 0 | 11 | 7 | - | - |
| 1 | 163 | 0 | 2.01 | ||
| 2 | 4 | 0 | 1.11 | ||
| 3 | 3 | 0 | 1.55 | ||
| 4 | 6 | 0 | 1.79 | ||
| 5 | 4 | 0 | 1.70 | ||
| 6 | 3 | 0 | 1.43 |
| Compression Method | NMSE | CR | |
|---|---|---|---|
| Mean () | Max () | ||
| DWT | 7.57 | 1.39 | 3.78 |
| PCA–DWT | 9.85 | 2.26 | 4.62 |
| MSPCA | 1.85 | 0.39 | 2.64 |
| Compression Method | NMSE | CR | |
|---|---|---|---|
| Mean () | Max () | ||
| DWT | 2.37 | 2.41 | 2.87 |
| PCA–DWT | 2.31 | 2.28 | 2.03 |
| MSPCA | 0.01 | 0.19 | 1.96 |
| Process | DBSCAN | MSPCA | Total (s) | |
|---|---|---|---|---|
| Voltage | Ambient | 1.0184 | 0.5943 | 1.6127 |
| Event | 1.0842 | 0.5651 | 1.6493 | |
| Frequency | Ambient | 1.2914 | 0.6525 | 1.9439 |
| Event | 1.1501 | 0.6174 | 1.7675 | |
© 2019 by the authors. Licensee MDPI, Basel, Switzerland. This article is an open access article distributed under the terms and conditions of the Creative Commons Attribution (CC BY) license (http://creativecommons.org/licenses/by/4.0/).
Share and Cite
Lee, G.; Kim, D.-I.; Kim, S.H.; Shin, Y.-J. Multiscale PMU Data Compression via Density-Based WAMS Clustering Analysis. Energies 2019, 12, 617. https://doi.org/10.3390/en12040617
Lee G, Kim D-I, Kim SH, Shin Y-J. Multiscale PMU Data Compression via Density-Based WAMS Clustering Analysis. Energies. 2019; 12(4):617. https://doi.org/10.3390/en12040617
Chicago/Turabian StyleLee, Gyul, Do-In Kim, Seon Hyeog Kim, and Yong-June Shin. 2019. "Multiscale PMU Data Compression via Density-Based WAMS Clustering Analysis" Energies 12, no. 4: 617. https://doi.org/10.3390/en12040617
APA StyleLee, G., Kim, D.-I., Kim, S. H., & Shin, Y.-J. (2019). Multiscale PMU Data Compression via Density-Based WAMS Clustering Analysis. Energies, 12(4), 617. https://doi.org/10.3390/en12040617