Article

Methodology for the Energy Need Assessment to Effectively Design and Deploy Mini-Grids for Rural Electrification

1
DIEF, Department of Industrial Engineering, University of Florence, 50139 Florence, Italy
2
DIMA, Department of Mechanical and Aerospace Engineering, University of Rome La Sapienza, 00162 Roma, Italy
3
DESTEC, Department of Energy, Systems, Territory and Construction Engineering, University of Pisa, 56126 Pisa, Italy
*
Authors to whom correspondence should be addressed.
Energies 2019, 12(3), 574; https://doi.org/10.3390/en12030574
Submission received: 27 December 2018 / Revised: 5 February 2019 / Accepted: 5 February 2019 / Published: 12 February 2019
(This article belongs to the Special Issue Hybrid Renewable Energy Systems in Remote Sites 2019)

Abstract

:
In order to successfully deploy a large number of decentralized energy systems in developing countries, it is necessary to standardize effective methodologies and procedures to develop off-grid/mini-grid systems. Considering that the energy need assessment provides inputs and assumptions used in business modelling and mini-grid design, the accuracy of its results directly affects the technical and financial feasibility studies. Thus, the approach for applying a proven methodology for the energy need assessment of rural communities is aimed at obtaining reliable input data for the mini-grid development. This helps in reducing both the financial challenges by mitigating the uncertainties in electricity demand and the technical challenges by contributing to adequately size off-grid power generation systems, with a view to boost toward a common overall objective of mini-grid’s optimization methods and tools. Hence, taking into consideration that target communities differ in terms of needs and context conditions, the proposed paper describes an inclusive methodology that can be adapted case-by-case. It provides an effective applied solution the lack of proven guidelines from project developers or literature, giving priority to data collection methods able to achieve a large sample representative of the market, with high accuracy in estimating the energy consumptions from electricity substitutes.

1. Introduction

Energy is crucial for eradication of poverty through advancements in health, education, water supply and industrialization, to combating climate change [1]. Notwithstanding progress in every area of sustainable energy, energy poverty still involves a large proportion of the population living in developing countries, mainly concentrated in Sub-Saharan Africa. The International Energy Agency (IEA) estimates that currently 1.1 billion people lack access to electricity, with an electrification rate in Sub-Saharan Africa of 43% [2]. Furthermore, it is estimated that 2.8 billion people still lack access to clean cooking [2], and the use of traditional biomass cookstoves is responsible for approximately 4 million premature deaths every year, affecting women and children, due to the emissions of carbon monoxide and particulate matter [3].
To mention one of the largest global initiatives showing the international commitment to solve the problem of energy poverty, the United Nations launched in 2011 Sustainable Energy for All (SEforALL), having the core objective to assure universal access to modern and sustainable energy by 2030, improving the rate of renewables in the energy mix and promoting energy efficiency. Also thanks to the high visibility being given to the initiative during the Rio+20 Conference, SEforALL embarked on uncharted territory and rapidly generated momentum, clearly stating, inter alia, that the cooperation among research, private and public sector is the key to achieve these goals [4].
According to SEforALL and other international programs, the approach to the problem of access to energy has gone through a profound change in the last decade and, in particular, an actual turning point in the implementation of policies and regulations in developing countries was noticed in the last five years, enabling the rural electrification market to private actors. Accordingly, while before cooperation development agencies only supported no-profit actors in rural electrification projects, in the last years they have been allowing private investors to be eligible for funding as well (e.g., the 2016 and 2017 ElectriFI tenders financed from the EU, the RBF calls financed by the English cooperation, the EEP fund financed by the governments of UK, Austria and Finland or the first tender for the profit sector launched in July 2017 by the Italian Agency for Development Cooperation).
Considering that universal access to energy requires a mix of technical solutions, according to the New Policy Scenario drawn in the World Energy Outlook 2014 [5], the IEA expects that by 2040 around 80 million people in Sub-Saharan Africa will gain electricity access through off-grid systems (with the meaning of stand-alone systems for individual households or consumers) and around 140 million people through mini-grids (with the meaning of small grid systems linking households and other consumers, but not connected to larger regional grids). This will require the development of between 100,000 and 200,000 mini-grids [6].
These figures highlight the necessity for involving private capital to reach a wider impact of the international action: in mini-grid projects, the ratio between project budget and beneficiaries is too high to justify grant funding up to 70% on large scale programs of the total budget and no-profit actors cannot afford a reduction of grant funding. On the other hand, private actors are able to invest in such projects to open a huge potential market, even if they assume high financial and development risks. With this in mind, the viability of business models and their long-term technical and financial sustainability become fundamental aspects to face mini-grid projects and a special focus is on effective payment systems.
To successfully deploy a large number of decentralized energy systems, as required by the global market analysis conducted by IEA [5], standardizing effective methodologies and procedures to develop off-grid/mini-grid systems is fundamental. However, in order to develop financially viable projects, there are various barriers that have to be overcome to create an enabling environment for such investments that are related to the institutional and policy framework as well as to financial barriers and technical challenges. Among others, a key barrier to mini-grid proliferation is the uncertainty in predicting customer electricity consumption, which adds financial risk [7], and their willingness to pay. In other words, since the profitability of a project is highly dependent on the amount of electricity that is produced and sold, uncertainty regarding electricity demand in micro/mini-grids represents a significant risk for investors [8].
Even if electricity demand is extremely hard to predict, especially in a village that has never had access to electricity [9], adequate market assessment, mainly based on energy need assessment and its outputs such as load profiling and demand forecasting, is feasible and it is essential to define the baseline and deal with an effective project design as well as properly evaluate its impact. Thus, the approach for applying a proven methodology for the energy need assessment of rural communities in developing countries to obtain reliable input data for the mini-grid development provided in this paper can help in reducing both the financial challenges by mitigating the uncertainties in electricity demand and the technical challenges by contributing to adequately size off-grid power generation systems.
Furthermore, since the economic viability of mini-grid projects highly depends on the size of the installed assets and the related investment, which needs to be backed by a payable demand in the years after commissioning, there is clearly a link between the energy need assessment, the load profiling and engineering design of the off-grid systems: an undersized system will provide unsatisfactory service and will cause consumers dissatisfaction, whereas an oversized system will not recover the costs required to set it up [10].
In the development process of a mini-grid, several factors and data contribute to design a technical solution that is considered financially viable and the electricity demand pattern is necessarily affected by several factors including socio-economic and environmental factors by which the pattern forms various complex variations. Thus, first and foremost, it has to be highlighted that every target community differs from others in terms of needs and context conditions. Hence, the proposed paper describes an inclusive methodology that can be used and adapted case-by-case in order to bridge the gap between general recommendations and information provided by existing micro-grid literature and the lack of detailed information and guidance from practitioners [9] to boost toward a common overall objective of mini-grid’s optimization methods and tools.
To analyze in depth the literature framework that support the actual need of an effective methodology for the energy need assessment in rural electrification sector with a specific focus on to mini-grid development, the following section provide a comprehensive literature overview composed of the main issues behind this topic. Furthermore, a flowchart is reported below (Figure 1) where blue color boxes represent area of direct influence for the proposed methodology to show the correlation between the energy need assessment, the load profiling and engineering design of the off-grid systems.

2. Comparative Literature Overview

2.1. Load Profile as Input for Sizing and Optimization Models

With the objective of reducing the viability gap of micro-grids as a means to provide energy access to communities which are not feasible to be grid connected, many models and software tools are being developed to size optimally a micro-grid and to operate it to serve the demand while minimizing running costs. A literature overview of the approaches used to optimize power systems with multiple energy sources can be found in [11].
Among the commercial software available for this purpose, the most known and utilized is HOMER [12], which can optimally size a mini-grid, simulate its operation, and perform sensitivity analyses, considering technical, economic and environmental aspects [13]. HOMER can also be used to evaluate poor design choices and operational issues in existing mini-grids [14]. Whereas HOMER considers a single deterministic scenario of load and renewable energy generation, stochastic methods to cope with load and generation uncertainties have been proposed by other applied studies [11,15,16].
All the aforementioned software and models require the community load profile as input in order to run their algorithms. However, conducting surveys requires time, resources and specific competences. The simplest way of deriving a load profile for an unelectrified community would be that of combining data from other electrification projects in developing countries and adapting them to the context of operation with a number of assumptions. An example of this approach is given by Kolhe et al., [17], who investigated the optimal size of an off-grid energy system without conducting a primary data collection [18].
The effort of characterizing the load profiles of existing micro-grids to use as a improved input to simulation tools like HOMER has been pursued in [19], with respect to 11 micro-grids installed by Powergen in Kenya and Tanzania. Prinsloo and et al., developed a load profile “archetype” for rural micro-grids in Africa, by combining a variety of datasets found in literature, for the same purpose of improving inputs to computer models [20].
These approaches used to face the data input concerns are very valuable to gain a general understanding of the micro-grid sizing. However, when it comes to actually deploy a micro-grid project, with all its associated financial, technical and logistic concerns, a further deepening is required to bear the development risks.

2.2. The Relevance of Accuracy in the Energy Need Assessment

Accurately estimating incipient electrical load of rural consumers is fraught with challenges. Load estimation error is propagated through the design phase, potentially resulting in a system that is unduly expensive or fails to meet reliability targets [21]. Thus, the proposed methodology aims at increasing the accuracy by focusing on methods for data collection and data analysis, which are not stand-alone activities, but they should be applied as part of the assessment process.
The relevance of the accuracy of surveyed data is widely recognized in the literature. In [22] the authors compared load profiles and performance metrics based on interviews and on measurements relating to a rural mini-grid in Tanzania, finding distinct differences between estimations and measured data. The largest difference was in the calculated energy, which is also reflected in the load factor and capacity factor, which are underestimated by 34–117% using the interview-based method, whereas the estimate of the peak load shows a much smaller error (11%). The large overall differences in the performance metrics could have major implications for the dimensioning and operation of mini-grids. Lastly, it must be reported that the authors claim that the performance metrics calculated from the interviews are similar to those reported by other scholars.
In [21], instead, it can be found a discussion on the techno-economic consequences of estimation errors on energy consumptions of seven small-scale off-grid solar-PV systems in Malawi. The results show that PV array and battery sizing scale proportionately with load estimation error and that the cost of load over-estimation is approximately US$1.92 to US$6.02 per watthour, whereas under-estimation can precipitously degrade reliability. Thus, the economic merit of more accurate average daily load estimates has been shown, but a methodology for improving the estimates is lacking and greater discussion among the research and practitioner community regarding target reliability standards for off-grid systems is needed, as the authors claim.
In [7], the problem of the inaccuracies of the primary input data for energy estimation is also addressed by comparing pre-installation predictions and actual measured consumptions for eight solar powered micro-grids in Kenya. The analysis shows that the ability to accurately estimate past consumption based on survey or audit data, even in a relatively short time-horizon is prone to appreciable error: the predicted total is more than four times the actual (426 Wh/day per customer vs 113 Wh/day). Thus, the study reveals that predictions were poor, with error arguably most influenced by duration of use estimations and the general survey approach; furthermore, the authors state that the general reliability and accuracy of surveys methods applied has not been demonstrated. It should be reported that the one applied differs from that described in the proposed methodology on a crucial aspect: the energy-use surveys were conducted by entrusting potential customers with prediction on typical duration of daily use of each appliance whereas the proposed method is based on current use of appliances and electricity substitutes estimated through an advanced data analysis (see Section 4.4) and such results determine both current and forecast load profiles by applying correction factors to willingness to acquire new appliances once they had electricity access.
The aforementioned studies focus on errors in load estimate as result of low accuracy in the calculation of average consumptions coming from surveys. They do so disregarding a number of factors that play an important role in the energy need assessment and, in addition to those mentioned before, it should be also consider accounting for the probability of connection of new customers and demand growth of the old ones, considering if there are any programs to facilitate the purchase of appliances and the stimulation of productive activities [23]. This paper is not going to further discuss reasons for these discordances, but it does aim to highlight that there are many factors coming into play when explaining the discrepancy between the estimated energy needs and actual consumptions as measured during the operational phase of the project and that, in any case, such discrepancy is relevant enough to justify the real need for implementing more effective assessment methodologies.

2.3. Process of Load Profiling in Greenfield Projects

There are several references concerning how load curves are developed in greenfield projects to design mini-grids. Here follow a couple of valuable examples with a view to mention the process of load profiling applied by using survey to assess the energy needs as starting point. It should be noticed that these studies, unlike those referred to in the Section 3.4, do not describe a tested and replicable methodology but just the chosen method to handle the scope of work.
Camblong et al., [24] have reported in 2009 the use of surveys to assess the energy needs of villages in three regions of Senegal to install micro-grids. The data collection campaign was conducted by three teams composed of a supervisor, two interviewers and a data collector. Their action comprised “village surveys”, made with people chosen by the head of village, “household surveys” and “technical surveys”. The team compared the results in terms of Willingness to Pay and Substitutable Energy Expenses and hypothesized different service levels for the households as well as consumption for public services such as lightning or water pumping. The resulting load profile for a sample village is reported in [25], along with a design proposal.
More recently, Sandwell et al., [26] published in 2016 a survey of energy demand and usage patterns in households in several unelectrified villages in Uttar Pradesh, India. By acquiring demographic data and daily activities patterns of the respondents they obtained firstly the current hourly demand profile of basic electricity demand (named “basic” demand) and secondly a forecast demand profile (named “aspirational” demand), by combining the basic loads with aspirational loads, formed of desirable devices, assuming their usage in line with census statistics and literature. Lastly, they used a Monte Carlo simulation to highlight the daily and seasonal variation and design a solar PV-genset (powered by diesel or biomass) hybrid system with battery storage to effectively satisfy the energy demand.
Another relevant matter in deriving the load profiles is the energy equivalence given by the different sources that are going to be substituted by the electricity supply. Such calculation is often disregarded or approximate whereas it is considered as crucial in the proposed methodologies and the data collection is structured to provide all the necessary data.
Even if non-electric lightning sources offer generally poor lighting levels, with low conversion efficiency with respect to the fuel used [27] they represent the main sources of energy in unelectrified communities and complementary sources in those electrified. In the literature, there are studies that adopt this approach, such as a comparative analysis of the technology, economics and CO2 emissions between kerosene-based lamps and modern bio-energy systems and solar photovoltaics, which considered fuel consumption, power rating, luminous flux, efficacy and useful life of devices [28].
Another example is given by a paper on the energy profile of a South African off-grid village where the sources of lighting were candles and paraffin lamps [29]. Overall energy consumption, expressed in megajoule, were obtained by differentiating the energy sources, but without considering explicitly which source could be substituted by electricity, so without estimating a possible electric energy load profile.

2.4. Process of Load Profiling in Greenfield Projects

Among others, an important reference on survey methodology is the World Bank Living Standards Measurement Study (LSMS), being amply proven and implemented in over twenty developing countries. In the late 1970s, the lack for internationally comparable data to perform well-supported statements about world poverty [30] led to the establishment of LSMS in 1980 to improve the type and quality of household data collected by government statistical offices in developing countries [31]. The questionnaires inspected all major aspects of economic well-being at the household and community level [32] and featured novelties such as multi-topic questionnaires, rigorous quality control procedures and a pioneering use of computer software. The program also emitted specific guidelines on how to customize the questionnaires based on the social, economic and political context of the target country [32,33]. The work cycle devised by the method was of 4 weeks to survey two locations [34], which makes LSMS questionnaires very time and cost intensive and as such not viable to conduct extensive energy policy analysis [35]. In [35] a comparison between LSMS and specialized household energy surveys can be found, highlighting how the latter are implemented to inform a particular energy policy or investment. For example, they are used to assess the efficiency and efficacy of fuel price subsidies or to establish baseline information and monitor rural electrification programs.
In the recent years, the Massachusetts Institute of Technology (MIT) launched an initiative, the D-Lab, devoted to develop and advance collaborative approaches and practical solutions to global poverty challenges [36]. In particular, D-Labs’ Off-Grid Energy Group focuses on providing information and resources to design and implement programs that increase energy access for organizations based in off-grid regions [37], following a bottom-up approach, where local organizations active in a certain area or community drive the needs assessment, solution identification and project implementation [38]. Among its activities, D-Lab developed an Off-Grid Energy Roadmap, which first step consists in the assessment of energy needs and market opportunities [39]. At this scope a specialized set of tools was developed and published in 2017: the D-Lab Energy Assessment Toolkit (EAT) [38] This toolkit aims to gather and analyze data about current energy access and expenditures, aspirational energy needs, existing supply chain and community institutions and stakeholders (private sector, government, NGO). Thus, such documents were taken as reference since it deals with energy needs of off-grid regions in general (e.g., clean cookstoves) but it is not focused on mini-grids, representing the first difference with the proposed methodology. The second one stands in for whom it is intended: on one side EAT is designed for local organizations seeking to increase energy access in their own communities and to make informed decisions about how to meet the specific needs in their community through market based initiatives, on the other side the proposed methodology aims to address the requirements of the mini-grid developers and meet constraints of the business-oriented projects. In fact, D-Lab specifies that their community-based assessment approach is not intended to replace studies that track energy access on a national level, or to generate market intelligence reports for external organizations looking to expand their business or programs into new markets. However, there are several similitudes between the two methodologies that come into the light also thanks to the support document on user research framework [40]. Firstly, promoting an approach to illuminate needs of stakeholders as a pillar of the data collection activities. Secondly, the importance of triangulation given by the use of three data collection tools (even if the focus group is replaced by group-interview in the proposed methodology): combining several methods can result in convergence (which adds credibility to qualitative research and the results obtained) or divergence (which signals unrecognized or unarticulated needs). Lastly, the emphasis on flexibility of tools to best suit the specific scope of the assessment and the given context: even if both methodologies provide validated implementation tools, they are only intended to be a guide, as it is assumed that the evaluation team is able to make decisions about the scale and scope of the assessment and modify the questions accordingly.
The bottom-up approach promoted by the proposed study, according to guidelines by MIT D-Lab, has already been pursued by a research team that published the results of a detailed field study of rural energy consumption patterns dating back to 1976–1980, related to six villages in India having already access to electricity [41]. It contains several methodological indications arising from the experience of the researchers, such as the importance of (i) establishing a relationship with the villagers, (ii) carrying out preliminary field activities and tests before conducting the data collection campaign, (iii) cross-checking in-built consistency between data from different sources and (iv) training of field investigators as added value to improve the reliability of the data collection’s results.
The application of proxy techniques to obtain some crucial indicators of energy need assessment, as foreseen in the proposed methodology, is supported, among others, by a study on residential energy use and costs in 2013 in Kenya, with particular regard to the willingness to pay for a given service [42]. The survey did not, in fact, directly ask what the respondent would be willing to pay for recharge portable battery kits service, whose answers are considered as uniformed, unrealistic and inconsistent in areas without previous access to the proposed service, rather it was deduced from current expense levels and feedback from the focus groups. Furthermore, the study also highlights the use of surveys as tools to provide useful information for the sustainable design and operation of energy development project.

3. Materials and Methods

3.1. Effective Methodology for the Energy Need Assessment

The paper objective aims at proposing an effective methodology for the energy need assessment in rural electrification sector to obtain reliable inputs for load profiling and mini-grid sizing, with a view to characterizing the community’s energy needs and exploring the viability of potential projects as well as optimization of operational energy systems.
An accurate and reliable energy need assessment represents the preliminary and fundamental activity to design a rural electrification project, including both technical solutions as well as other ancillary activities in order to enable local communities to properly manage the electricity service and to boost their socio-economic development.
With a view to study all the factors affecting technical solutions, characterization of the community’s energy needs is aimed at classifying the contexts of intervention in order to move toward a common overall objective of mini-grid’s optimization methods and tools. The main community’s features are defined so as to guide the energy need assessment methodology presented in this paper. Such figures will be investigated through indicators and indexes that represent the objective of an ongoing study aimed at finalizing such characterization of target communities.
In order to address the requirements of mini-grid developers, the proposed methodology is specifically focused on the energy need assessment for rural electrification projects. This specification is fundamental to point out how and why this methodology differs from others which deal with the energy needs in general. In fact, taking as reference the Energy Assessment Toolkit developed by MIT D-Lab, the main differences consist of the assessment’s focus on mini-grid and in for whom it is intended (for further details see Section 3.4). That means that the methodology gives priority to (i) data collection methods able to achieve a large sample representative of the market and (ii) high accuracy in estimating the energy consumptions from electricity substitutes, which are crucial to provide reliable data for load profiling.

3.2. Main Phases of the Methodology in Brief

In brief, the proposed energy need assessment uses different methods and tools in order to apply a data collection methodology based on multi-source strategy, including both qualitative and quantitative approach. Different tools are used for measuring the indicators identified whereas data coming from different sources are compared and processed by using a weighed analysis.
To summarize the main activities that the energy need assessment is composed of, the methodology can be divided into three macro-phases:
  • first phase: macro-data analysis and pre-assessment activities;
  • second phase: data collection campaign;
  • third phase: data analysis and reporting.
The first phase is focused on the review of conventional indicators and literature. The aim of this phase is to analyze and describe the context of intervention, utilizing and comparing data already collected by other related projects, relevant macro statistics and background data.
In the second phase, a field investigation is carried out in the villages of intervention and surrounding areas. The overall objective is to provide a description of the population living in the targeted villages with a view to assessing the electricity demand and the ability to pay of users (potential or existing) by customer groups. A set of additional information is gathered to best suit the specific objective of the assessment formulated on a case-by-case basis. The field investigation was conducted by applying a multi-source data collection strategy in order to provide highly reliable results. Furthermore, particular attention was paid to opinions and suggestions from population and local authorities in order to promote a bottom-up approach and lay the groundwork for a participatory project development.
In the third phase, data analysis of the inputs collected during the first and the second phase is conducted, and a detailed report is instructed to show an evaluation and validation of the results, including the main findings, the correlations among the main variables and recommendations for the program interventions.

3.3. Macro-Data Analysis

As part of the first phase of the assessment, the aim of this activity is to examine and describe the context which the data collection campaign is going to be built upon. Preliminary macro-data analysis based on literature, publications and reports by accredited agencies and institutions is carried out at country, local level and sector level, such as off-grid systems and mini-grid outlook.
Specifically, the macro-data analysis is mainly focused on, but not limited to, relevant macro statistics and background data concerning demographic dimensions, economic data, access to public services, national grid masterplan, mapping of potential villages and their distance from the national grid (for greenfield projects), business activities the local economy is based on, medium-large farms, industries or companies (national or international), organizations active in the region (NGOs, UN field offices, etc.) and energy projects realized in the region.
The main outputs the macro-data analysis should provide to move forward are the following:
  • administrative framework
  • map of potential villages pre-selected (for greenfield projects)
  • list of local stakeholders to contact
  • list of organizations active in energy sector
  • list of energy projects realized in the region
  • list of potential local partners

3.4. Pre-Assessment Activities

As part of the first phase of the assessment, defining the specific objective of the energy need assessment and formulating the key results accordingly should be a priority before proceeding with any practical activities. Such results in fact are given by the explanation of a set of key indicators, coming from the data collection. That is why a review of the standard data collection tools on a case-by-case basis is strongly recommended because questionnaires need to be checked before every application in order to best suit the given specific objective, results and context of intervention.
Actually, depending on the type of project (potential, existent, on-grid, off-grid, etc.) some indicators may be more relevant than others and some cannot be applied in a given context, such as existing and potential anchor loads with productive use of electricity, public infrastructures to be optimized through a reliable and/or more affordable electricity supply, market information and access to microcredit and banking services. This is one of the reasons why classifying the contexts of intervention with a view on the community’s energy needs mentioned before can boost toward an optimization of methods and tools to develop rural electrification project.
Lastly, the pre-assessment activities are also focused on conducting a preliminary stakeholder consultation at national and local level to pave the way for the data collection campaign.
Particularly in rural areas of developing countries, consultations are an essential step to increase local understanding of the action, favoring a trustfully environment and collaborative approach and consequently and enhancing the reliability of assessment’s results. Here follows a list of potential stakeholders to be contacted beforehand:
  • political authorities at village/county/district level
  • technical persons of relevant national agencies or local administrations
  • representatives of local associations and financial institutions

3.5. Data Collection Campaign

The objective of this second phase of the assessment is to properly collect data from direct sources in order to provide a description of the population living in the targeted villages with a view to assess the electricity demand and the ability to pay by customer groups in terms of existing and potential demand.
Thus, the energy consumption modelling coming from the proposed assessment methodology is based on a bottom-up approach, which is used to model consumptions of each end-use and hence to identify areas for efficiency improvements at user level and is based on statistical or engineering models [43]. Current and forecast data are fundamental for the mini-grid development, as highlighted in literature, since power system engineering refers to load forecasting as the domain of models able to provide data for setting the best planning and operating of grids [44].
Furthermore, the methodology emphasizes the importance of carrying out data collection activity with a focus not only on statistical results but also gathering opinions and suggestions from population, local authorities and stakeholders in order to promote a bottom-up approach and lay the groundwork for a participatory project development.
In fact, community engagement strategies can draw together various elements that can maximize sustainability and transformative potential of mini grids, even if it requires time and budget allocated, that have been to date underrepresented in the literature on mini grid deployment models [45]. Much of the literature focuses on a top-down approach rather than bottom-up approach and practitioners should consider a shift in rhetoric and conceptual approach to community engagement by recognizing its added value for the project impact [45].
Thus, pursuing the assessment of the entire community, particularly in terms of energy needs and potential increasing demand, the proposed data collection campaign is structured to provide disaggregated results on stakeholder consultation, household survey and business activities survey. For avoidance of doubt, please note that these survey types differ from the three data collection methods explained below.
In order to explain how this phase is developed, the following are the key features of data collection methodology required to be defined before proceeding:
  • target areas of intervention: the ground is divided into sub-areas to apply the defined sampling strategy;
  • cluster sampling: target market is classified into customer groups, such as households, small businesses and anchor loads (however, if any context’s peculiarities, the classification may be revised, and questionnaires updated accordingly);
  • data collection methods: multi-source data collection strategy represents an essential aspect of the proposed methodology; three methods should be applied in order to achieve high accuracy of results: (1) face-to-face interviews with stakeholders, (2) group interviews and (3) door-to-door interviews; each method is described in detail in the following sections;
  • GPS mapping: to mainly record main potential customers, village boundaries and distance from the national grid.
Depending on the data collection method, different sampling procedures should be applied. They are reported below at the end of each method’s explanation.

3.5.1. Data Collection Method 1: Face-to-Face Interviews with Stakeholders

The first method to be applied is the face-to-face interview, which is a qualitative data collection method. It is applied at least to the following stakeholders: local authorities, technical officers at village and district level, representatives of local associations, representatives of financial institutions, owners or managers of the main business activities. Special focus is on anchor users and productive users of electricity.
Interviews with key stakeholders should be conducted in order to detect the general perspective of the market from their point of view, the community background, needs and potential constraints (e.g., access to credit constraints) as well as aggregate data on current energy sources used, relative expenditure and price of key products available in the local market (e.g., fuel). The interview also aims at identifying the main business activities, anchor loads, current or potential productive use of electricity as well as public institutions and existing infrastructures requiring reliable electricity supply.
A guiding questionnaire is prepared for interviews that should also take into consideration all inquiries based around the main questions, depending on the specific case study, as well as additional probing questions added as needed.
Sampling strategy: Qualitative interviews should be conducted with at least one representative for political sector, local associations, whereas the target is to reach 100% of the main business activities, productive users of electricity and financial institutions.

3.5.2. Data Collection Method 2: Group Interviews with Population

The second method applied during the data collection campaign is the group interviews, which is a hybrid quantitative and qualitative data collection method. It is targeted at household’s level to collect mainly quantitative data through a survey by using closed-ended questions but also qualitative data through a short discussion stimulated by open questions at the end of the session to let personal opinions and concerns come to light.
The strength of this method is that it is efficient and time saving: it allows collection of a large sample of data at once, from up to 25 participants per group. It is also a good tool for the community engagement, even if it requires to be properly carried out by an expert evaluation team.
Sampling strategy: A random sampling procedure is used in each site of intervention with the support of the chairperson to collect the people. The only selection criteria is that under 18 are not admitted. Three group interviews per site should be conducted in order to reach the target number calculated by applying Equation 1 reported below.

3.5.3. Data Collection Method 3: Door-to-Door Interviews with Small Business Activities and Households

The third method applied during the data collection campaign is the door-to-door interview, which is a quantitative data collection method. It is targeted at households and small business activities, recorded separately, through a short-structured survey questionnaire.
The strength of this method is that it allows the evaluator to visit each building sampled, implying high reliability of the data source on energy issues and collection of GPS coordinates with a view to allow the project developer to lay the groundwork for a remote monitoring & evaluation framework over the project life.
Sampling strategy: The sampling procedure applied in each site of intervention consists of two stages: in the first one, a section of the target area depending on the sub-villages or the organization of the targeted village according to local authorities; in the second one, a simple random sampling from each section. It must be specified that households and small business activities are recorded separately. Sample households size for method 3 are based on Equation (1) [46]:
n = p ( 1 p ) × N p ( 1 p ) + [ ( d Z ) 2 ( N 1 ) ]
where p = 0.5 (for maximum variability in normally distributed attributes)
N = population (i.e., number of households in this case)
d = level of precision (10%)
Z = Z – value (1.96 for Confidence interval of 95%)
Considering that number of existing business activities is not usually available in advance, it should be estimated to plan the field mission on the basis of previous experience in the area or census statistics, if any, or alternatively literature reference. For instance, based on their extensive experience in rural areas of East Africa, the authors consider a ratio between small business activities and total households of 6–8%. With the aim of visiting all of them, the evaluation team should target to reach at least 80% of the total estimated number.

3.5.4. GIS Mapping

A GPS mapping of the main potential customers and village boundaries is carried out by using GIS software, guaranteeing the quality of the geolocation with a high degree of confidence. Particular attention must be paid to the distance from the national grid and between villages. Among the geo-localized items, the following should be ensured within the area of intervention: infrastructure, social institutions, existent anchor loads and main business activities. Additionally, GPS coordinates of sample households and business activities as explained above in the door-to-door method should be collected.

3.6. Data Analysis and Reporting

The data analysis of the inputs collected during the second phase of the energy need assessment should be conducted in order to compare and process input data coming from different sources by using a weighed analysis. The analysis should consider appropriate sampling weights for the estimated parameters to reflect the probability of sampling households and businesses from different sources as well as adjustments for non-response. Cross-checking should be carried out in order to find out discordances between data.
The different data sources are at first managed separately to observe disaggregate data. At the same time, since the market is divided into customer groups during the data collection campaign, data analysis is carried out using different data categories.
The process mainly consists of five phases:
  • Data entry and processing: to get raw data organized into different data sources and different customer categories;
  • Analysis of raw data: raw data are studied question by question;
  • Cross-checking: results of disaggregated data analysis are compared;
  • Aggregation: data from different sources, already processed in previous phase, are aggregated to obtain final results;
  • Modelling and algorithms: final results represent variables to calculate all the indicators reported in this assessment by applying algorithms.

3.7. Outputs of the Energy Need Assessment

The assessment provides the following overall outputs:
  • GPS mapping of the target area, showing its borders, distances from the national grid, positions of the productive or commercial activities and sampled households: this output resumes key data for the distribution grid design and evaluation of the best cost-effective technical solution.
  • Summary and preliminary assessment of the different institutions, organizations, business leaders, or leading members of the community who may help organize the finance, maintenance, and operation of the mini-grid: this output is relevant to design ancillary activities to support the socio-economic environment of a rural electrification project.
  • Assessment of current and potential anchor loads: these customer group are crucial to ensure the project sustainability and their energy needs significantly affect the load profiling and, consequently, the mini-grid sizing.
  • Average consumptions and expenditures for electricity substitutes per each customer group: it represents the key set of indicators to obtain a reliable load profiling.
  • Willingness and ability to pay for electricity supply per each customer group: these indicators are particularly relevant to set electricity tariff plan.
  • Load profiling of current and forecast electricity demand: this is considered one of the most important output of the energy need assessment and its reliability is based on accuracy of results given by data collection and data analysis, representing the core phases of the energy need assessment. It must be specified that forecast load curve is not included in this paper since the optimization of its method of calculation represents an on-going research of the authors.
  • Suggestions and recommendations for the project developers on (i) business model design, (ii) engineering design of energy management systems and (iii) formulation of supporting activities for socio-economic development.

4. Results

4.1. The Methodology Validation: Case Study in Rwanda

The presented methodology for energy need assessment has been tested and improved time since 2012. So far, it has been applied in 9 data collection campaigns for a total of 42 villages assessed in Central America and East Africa. More than a mini-grid has been already realized based on its results. The presented case study, held in May and June 2018, was carried out with the purpose of validating the methodology. The evidence of its reliability is given by comparing a key output of the energy need assessment with the actual value adopted in the mini-grid implementation: the willing to pay of potential customers. It is a very sensitive and representative indicator since it directly affects the project sustainability and it comes from other outputs such as the average consumption and expenditures and the assessment of current and potential anchor loads. With reference to the Village A, the assessment returns a flat tariff of 2940 RWF/month to reach the higher penetration rate of potential market. The actual flat tariff negotiated between the mini-grid developer, local communities and authorities was about the same: 3000 RWF/month.
A comprehensive market assessment has been conducted in three villages in a rural area of the Eastern Province of Rwanda, where three mini-grids are planned to be developed. The specific purpose of the market study was to assess the electricity demand and the ability to pay by households, businesses, social institutions and anchor customers.
Potential customers living in the target areas were categorized into four customer groups and other minor sub-groups: households (domestic use of electricity), small business activities (commercial and artisan use of electricity with appliances requiring power up to 5 kW), public services (use of electricity for public benefit) and anchor loads (productive use of electricity or other businesses with appliances requiring power over 5 kW and at least a consumption of 2 kWh/day), which are considered as stakeholders in the Table 1, whereas Table 2 summarizes the main survey figures considering gender balance and the sampling size.
The assessment is described by using disaggregated results for every surveyed village in order to highlight differences among potential markets for each mini-grid. The study analyzed all the direct or indirect aspects related to the energy needs from greenfield projects up to operating mini-grids.

4.2. Results on Socio-Economic Concerns

Local economy is based on farming and related commercial and productive activities, coupled with small livestock. Main crops cultivated are maize, beans, bananas, peanuts, manioca and sorghum, among which only maize and sorghum are currently processed by milling services.
Seasonality of business activities reflects dry seasons, which are harvest seasons as well: the “high season” periods, meaning when the business revenues are high, are from January to March and from June to August.
With regards to households income, population living in the targeted villages works 7.2, 7,0 and 7.7 hours per day on average in village A, B and C respectively, to earn 20,770 RWF, 26,256 RWF and 32,354 RWF per month on average.
Considering that access to microfinance is an essential factor to evaluate potential increase in energy demand and room of improvement of business activities, there are several saving groups in the targeted area (5, 23 and 13 in village A, B and C respectively).
The field mission disclosed a lack of access to water: the main water sources are unprotected springs (improperly called well or dam, or ibinamba in local language) that do not respect sanitation standards, and only few protected springs. However, during the dry season, the available water supply is not able to satisfy the needs of the entire population.
Furthermore, there is a fully convergence of data on sanitation concerns: 90% of the population uses private covered pit latrines (90%, 100% and 95% in village A, B and C respectively) with minor a percentage using uncovered pit latrines.
Additionally, a housing assessment was conducted to verify whether buildings meet the minimum safety criteria to be connected: spread of construction techniques with limited durability such as unburnt bricks with mud (representing 35%, 78% and 30% of buildings in village A, B and C respectively) suggests to verify case by case their eligibility for electricity connection.
Lastly, transports and energy used for cooking were investigated: the main mean of transport present is bicycle (owned by 70%, 60% and 54% of people in village A, B and C respectively) whereas only a few own motorbikes. Main cooking fuels are firewood and charcoal.

4.3. Results on Energy Concerns

In order to provide the detailed results given by the most important indicators about energy concerns, the following description and figures are only related to village A, located in the Eastern Province of Rwanda.
First of all, considering that rural electrification projects might only address the needs for lighting and electrical devices, the energy consumptions for cooking are analyzed separately from other sources of energy mentioned below: Almost all the people living in the targeted villages use firewood corresponding to 9102 Wh/day and related average monthly expenditure of 11,035 RWF per household.
The current sources of energy for lighting and appliances used in the community, including sources of electricity and electricity substitutes, are given in Figure 2. Data analysis results show the exclusive use of a source and the mixed use of different sources. That is important firstly for the estimation accuracy of the average consumptions and expenditures in energy per customer group and secondly to identify potential customers within a given customer group, which might be supported by specific project activities, especially among small businesses.
Electrical appliances usage and their dissemination in the communities represents an indicator for household wealth. Regarding the energy need assessment, analysis of current electrical devices is crucial to estimate the energy load profile of the community and to provide reliable input data for the mini-grid design, especially considering that the appliances absorbed power is quite higher than the one required by lighting products.
Current energy consumption and expenditures for lighting and electrical devices per customer represent two crucial indicators of the energy need assessment, which are calculated separately per each customer group to favor the undertaking of specific actions (see Table 3 and Figure 3).
The first part of the energy need assessment focuses on the current demand for electricity so the substitution potential for the mini-grid, whereas another relevant part concerns the potential unexpressed demand for electricity that would arise in case a mini grid was available.
Demographic growth together with increase of business activities represent two indicators of the potential increase of energy demand. In fact, according to the Fourth Population and Housing Census of Rwanda, performed in 2012 (RPHC4) [47], projections of rural population claim an increase of the size of rural population by 23.2% to 35% between 2012 and 2032. In contrast, the survey results reveal that 54% of small business started up less than one year ago. Considering this general foreword, the assessment of potential energy demand is mainly based on (i) the willingness of acquiring electrical devices in the future, divided into customer groups, and (ii) potential business opportunities.
A preliminary identification of potential opportunities was conducted: the general perception is that there are no relevant opportunities for strong anchor loads, however, there is a clear business attitude and intention to start new small business activities.
Among potential business opportunities raised as result of direct questions to people interviewed, the most promising businesses result to be selling refrigerating products and bakery. Furthermore, even if 5 entrepreneurs are willing to activate new milling service, the milling market seems to be saturated with 6 mills already existing for 950 households. They currently operate for a couple of hours per day and it would be preferable to optimize such activities instead of opening new ones. With reference to the forecast of how many new devices will be acquired for business purposes, it must be noted that results only represent a preliminary estimation of the number and type of potential businesses, since an in-depth analysis, which includes real financial capability and business sustainability, should be conducted case-by-case to both optimize the plant sizing and eventually select business activities to be supported by the project. In other words, it is assumed that, in rural contexts, the more vibrant is the current economy the more extensive is the room for improvement in the upcoming future, whereas a lower economic development would require a stronger action on improvement of socio-economic environment, including capacity building and access to finance, among others.
Due to the lack in quantity and quality of measured data in greenfield projects, surveys are required to assess the Willingness To Pay (WTP), considering that previous studies have warned against the tendency of rural households to overstate their WTP, as mentioned in [48].
In order to clarify the meaning given in this paper, WTP is the maximum price at or below which a consumer will definitely buy or consume one unit of a good or services [49], which is represented by the electricity tariff in this case. There are different methods to evaluate the WTP. Considering the most common ones, WTP can be obtained either by asking directly how much an individual is willing to pay for a service, resulting in an ‘expressed’ WTP, or by calculating the current energy expenditures, resulting in a ‘revealed’ WTP [50].
In the rural context, as users move from basic lighting to paying for additional services, the slope of WTP reduces as income poverty appears to come into play. In fact, beyond the basic level of services, WTP become a factor of income elasticity meaning, in other words, affordability [51]. This specific aspect can be quantified by considering the Ability To Pay (ATP), which is a parameter dependent on the income level of the interviewee, and it is directly related to the affordability of the tariff for the users [52]. WTP and ATP of rural household consumers are closely related since a higher (or lower) rate of willingness to pay is strongly affected by the share of disposable income assigned to electricity as a service in the overall household income [52]. That is why it should be taken into account, what is the percentage of household budget devoted to energy consumption versus other development priorities, such as education or water.
As explained in the previous sections, the potential marked was divided into three main customer groups in order to better analyze, among other, the revealed WTP of each group, which results to be fundamental to set the electricity tariff plan.

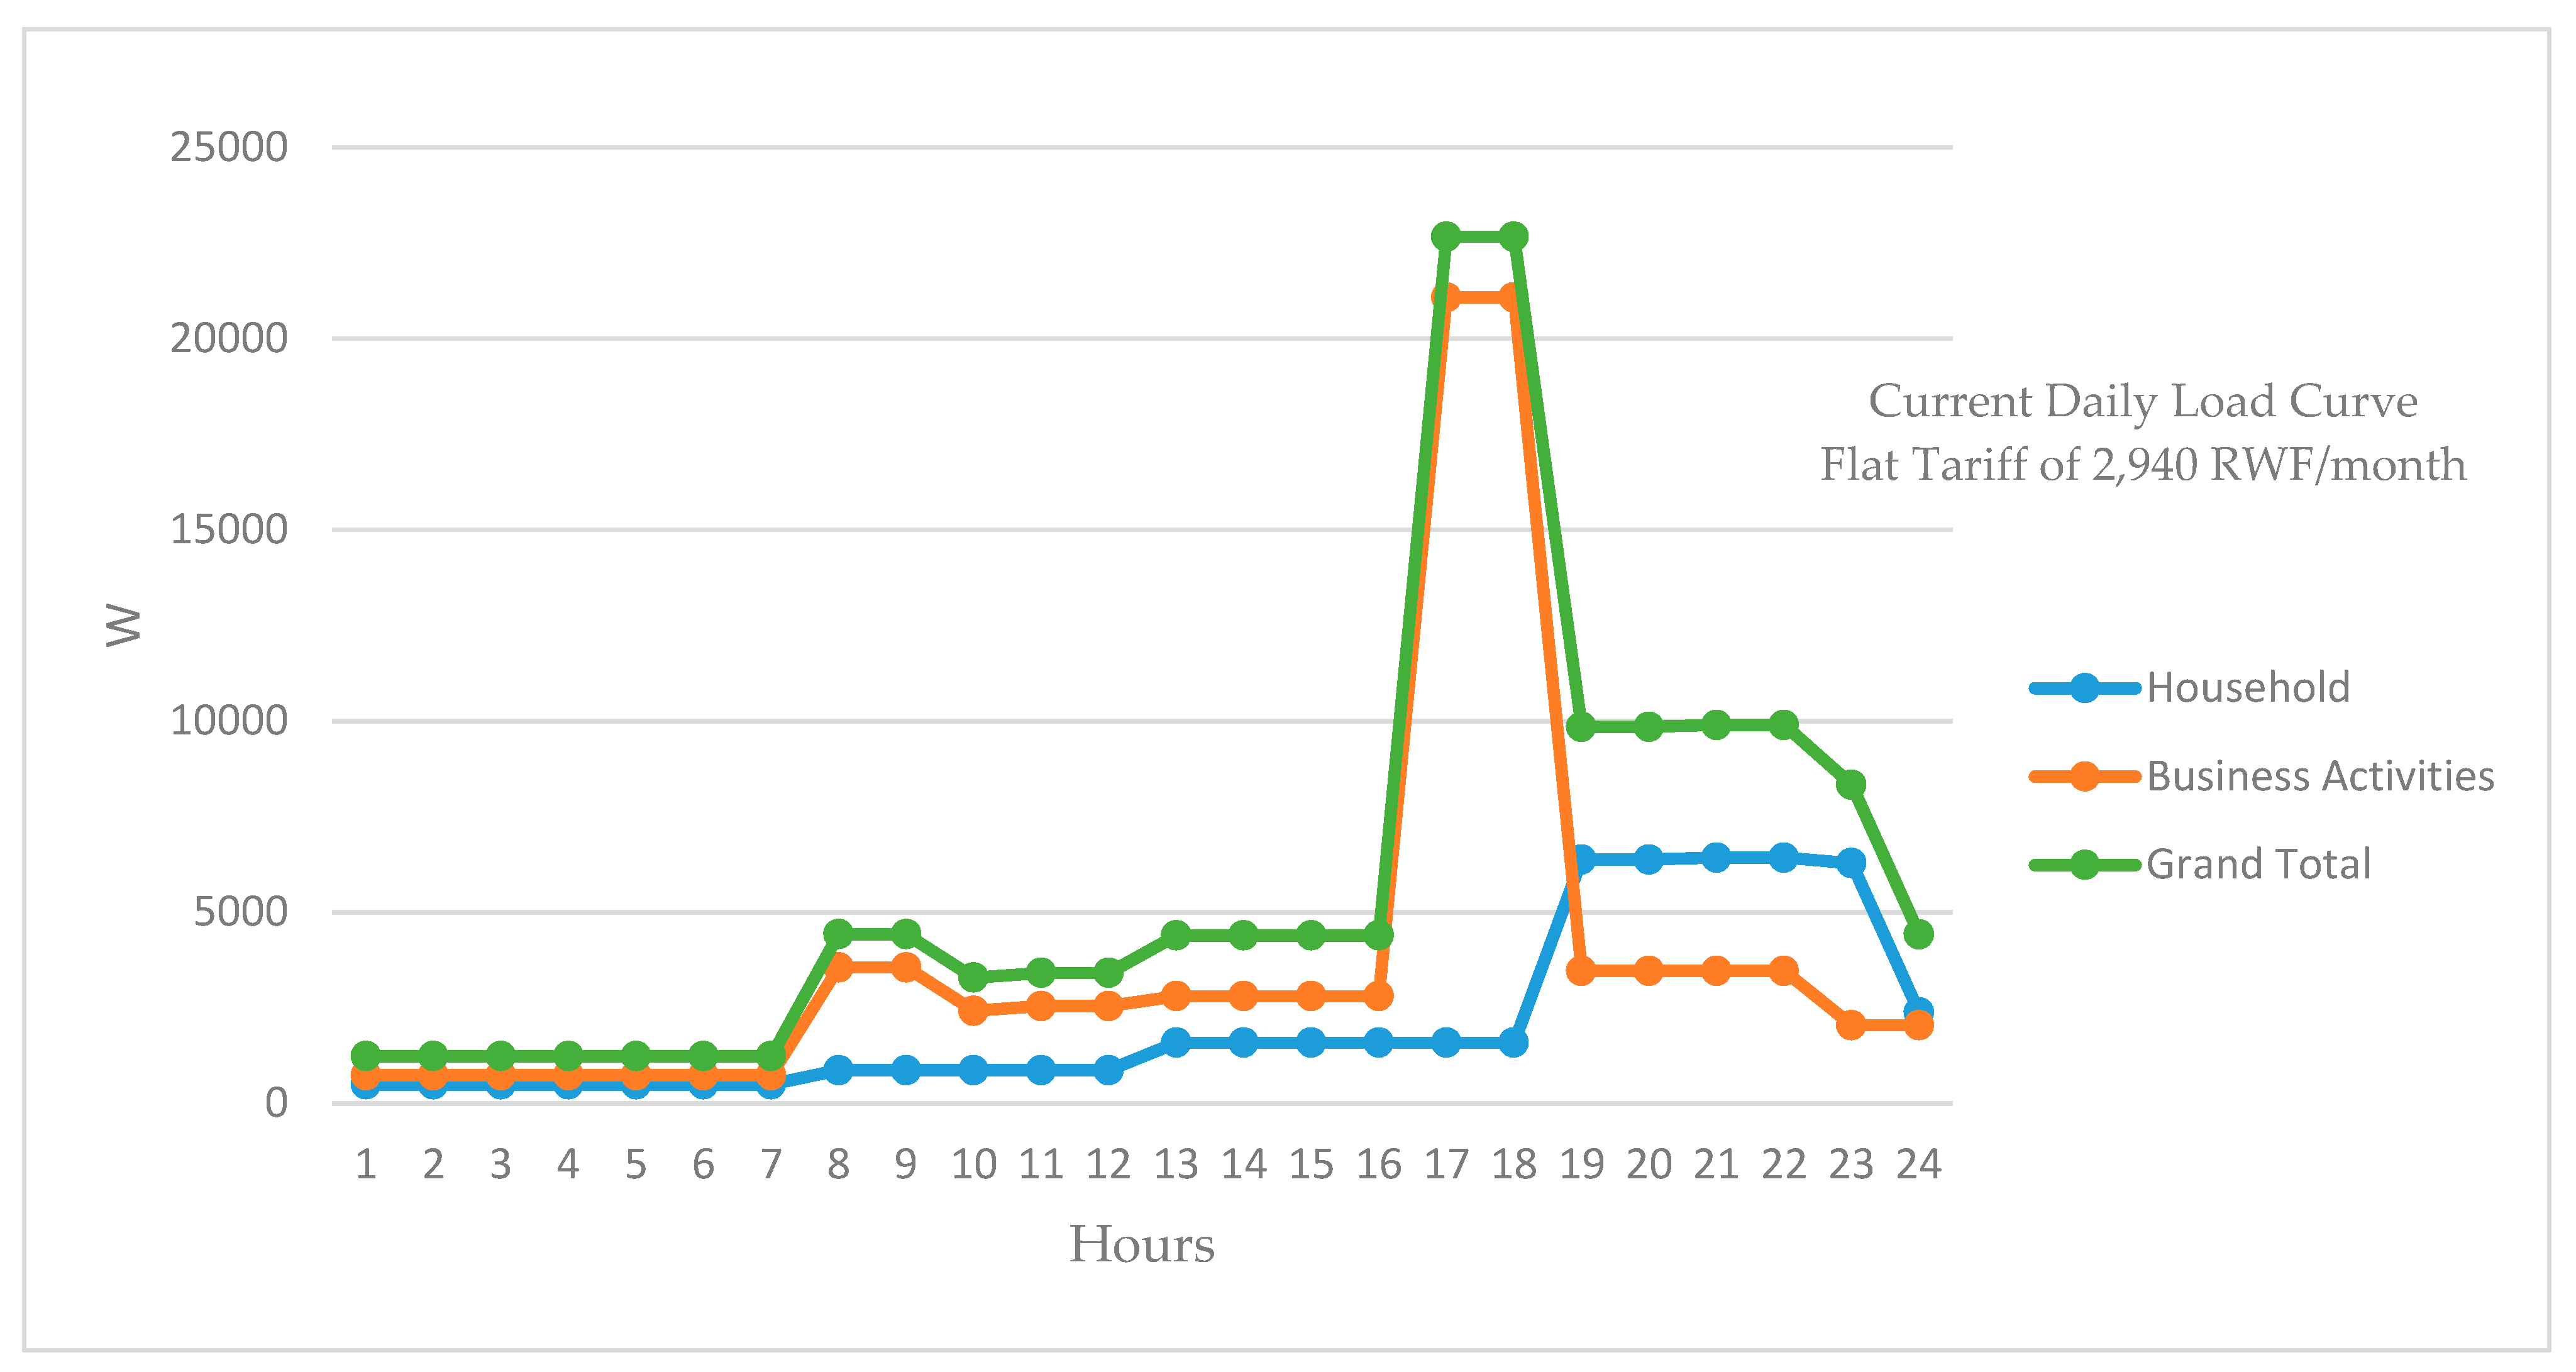
4.4. Current Energy Load Curves

The energy load profiling, which is considered as the current energy demand, and a detailed load profiling on possible sub-scenarios was carried out considering tentative electricity tariff plans. It must be specified that forecast load curve is not included in this paper since the optimization of its method of calculation represents an on-going research for the authors.
To profile the load curves, a market penetration was assumed depending on the willingness to pay as well as to change from SHS or PV panels with battery to reliable 24/7 energy supply. However, the penetration rate should be adjusted taking into consideration financial variables in predicting economic activity of the mini-grid (e.g., multi-phase construction, grid layout and related access to, taxes and inflation rate, etc.), which are typical of the business planning and not part of this study.
The energy demand was calculated by using the equation (2), in which two correction factors have been considered: the SHS Correction Factor (C1) and the Commercial Demand Factor (C2), taking as a reference the guidelines issued by GIZ [53]:
Et = Eh × C1h × C2h + Eb × C1b × C2b + Ea × C1a × C2a
where:
Et = Total Daily Energy Consumptions for Electricity Substitutes at a given Flat Tariff Threshold
Eh, b, a = Total Daily Energy Consumptions for Electricity Substitutes of Households (h), Small Businesses (b) and Anchor Loads (a)
C1h, b, a = SHS Correction Factor for Households (h), Small Businesses (b) and Anchor Loads (a)
C2 h, b, a= Commercial Demand Factor for Households (h), Small Businesses (b) and Anchor Loads (a).
First was shown the number of people using SHS that do not consider to improve their quality of life through a reliable electricity supply and their related current energy consumptions. Thus, the SHS Correction Factor (C1) in the equation (2) reflects such component of SHS users and decreases the total estimated daily consumptions. In this case, C1 for households is 98.5%, C1 for small businesses is 98.0% and C1 for anchor loads is 100%.
Second, the commercial demand was worked out by classifying different consumer categories, as defined in the rest of the study: three thresholds were identified among the estimated monthly expenditures and how many users were able to pay at least such values, representing the percentage of potential market intending to apply for connection at a given electricity tariff. Thresholds are given in the Table 4 below in terms of monthly flat tariff, whereas percentages represent the Commercial Demand Factor (C2) in the Equation (2).
The table above shows that the poorest part of the population, given by the first quartile of data analysis on the average monthly income, have a low current energy consumption as well and therefore willingness to pay. In other words, it is unlikely that they will apply for electricity connection.
Lastly, the study also focused on getting to know what are the current electrical devices in use and for how long they are used, in order to model load evolution, based on possible additional devices that customers may plan or wish to have. Thus, the demand assessment focused on the time of use of electrical appliances, the distribution of the energy demand throughout the day, the peak power demand and the number of customers in each category.
The Table 5 summarizes variations of energy consumptions depending on the flat tariff applied.
In conclusion, taking into account the market penetration reported in Table 4, the recommended flat tariff should be set below 2,940 RWF/month. The daily load profiles of the community with this flat tariff applied (Figure 4) shows that domestic loads reach their peak during the evening, between 7 p.m. and 11 p.m., while business activities reach their peak between 5 p.m. and 6 p.m. that is when the mills operate. During the rest of the day business activities’ total consumption is lower than households since the present businesses are mainly small commercial or artisan activities and do not represent a productive anchor load.

4.5. Sizing of Mini-Grid Based on Assessment Results

Based on the output from the load profiling, the authors sized a mini-grid for the assessed village.
HOMER Pro Microgrid Analysis Tool 3.11.6 [54] is the simulation tool adopted for the optimization of the plant. This simulation tool assists in the planning and design of renewable energy based multi-source generation systems.
Power plant configuration, life-cycle cost (excluding dismantling) and the energy and economic comparison were carried out using the two main operations of the software: Simulation and Optimization.
In the Simulation area, HOMER Pro determines technical performance, feasibility and life-cycle cost of a system for every hour of the year.
In the Optimization section HOMER displays each feasible system and its configuration in a search space sorted by the least cost depending on the total net present cost. In this way, we can find the optimal configuration which satisfies the constraints imposed in the model. The description of economic output is set out in the following section [14].
Detailed description on HOMER PRO software can be found in [12].
The authors considered solar irradiation as the only renewable source. The solar irradiation and surface annual solar radiation data have been obtained from an average of 20 years of NASA data, which interpolate data of available weather stations to infer specific location [55]. The average annual of daily solar radiation in this region is 5.02 kWh/m2. The average clearness index is 0.50. Based on these data, assumptions for the different months are represented in Figure 5.
It was assumed to size a hybrid mini-grid composed by a PV plant, a Battery Energy Storage System (BESS) and a diesel generator (Figure 6).
The considered PV system and replacement cost is 2,200 $/kWp. The O & M cost is set to 10 $/kWp/year. The solar module type is a polycrystalline PV panel with efficiency 15%. Costs include purchase, transportation and installation of modules, all balance of system components like cables and structures (excluding the inverter) and the security system.
The cost of the inverter is set to be 300 $/kW, and the efficiency is assumed to be 95%.
For the BESS the authors consider a Li-Ion battery, with round trip losses of 8%, an estimated cost of 600 $/kWh, an O & M cost of 10 $/kWh/year, and a connection on the DC bus [14].
The cost of the diesel Generator is set to 500 $/kW and the fuel price is set to 1.4 $/l, data collected during the site visit.
The optimal configuration proposed by Homer is formed by 29.4 kWp PV generator, with a 15 kW converter, a 110 kWh BESS, and a 36 kW diesel generator.
The PV total energy production would be 59.3% of the total annually energy needs, with a COE of 0.447$/kWh (382.53 RWF/kWh) with a project lifetime of 25 years, it should be noticed that this value, excluding bar and barber shops, is under the Average cost of electricity paid by villagers.

5. Discussion: Reliable Input Data for Load Profiling and Mini-Grid Sizing

5.1. Strengths of the Proposed Methodology

The strengths of this methodology are that the use of different data sources:
(i)
increases the results accuracy
(ii)
allows an expert consultant to immediately bring to light relevant discordances and points of investigation to clarify during the field mission.
(iii)
supports in defining the current energy sources and expenditure for electricity substitutes by using a large sample size of the potential market (a crucial indicator to evaluate the real ability to pay of customers)
(iv)
helps to record perspective and detailed information from stakeholders and anchor users (fundamental qualitative data to customize the mini-grid project development).
(v)
allows the project developers to lay the groundwork for a remote monitoring & evaluation framework over the project life, thanks to the use of GPS coordinates.
Lastly, it is important to highlight that it is based on the assumption that the key indicators are given by proxy variables since people that never had access to electricity and do not have regular income have little reliability in estimating their consumptions and expenditures as well as in predicting their future appliances purchases and their pattern of us [21], as recommended in the literature focused on mini-grid development [56].

5.2. Mini-Grid Sensitivity to Inputs and Assumptions Coming from the Energy Need Assessment

The energy need assessment is particularly important in the development of rural electrification project, especially in mini-grids, both from (i) a business perspective, which allows for reducing the investment risk and from (ii) a technical perspective, which allows for developing reliable load profiling and optimize the energy management systems. It follows from this that the accuracy of inputs used as well as assumptions selected directly affect the technical and financial feasibility studies. Results of the energy need assessment represents such inputs and provide most of the assumptions used in business modelling and mini-grid design.
The effects of uncertainties in load profiles have in fact a huge impact on the sizing, cost and reliability of off-grid systems, as discussed in [21], where the authors argue that the estimation of average daily load as the starting point for intuitive design approach is not satisfactory, and that alternatives for improving such estimates is not available. This issue has been investigated in detail also in [57], but the authors did not tackle the uncertainties in primary data acquisition and used a proxy method for getting “typical” classes of users based on their observations on already electrified peri-urban areas of Uganda. The same authors proposed a method to formulate load profiles for expected new customers in off-grid rural areas without prior access to electricity [44]. The method employs a bottom-up stochastic approach to take into account the variability of the overall time in which an appliance is functioning in a day and its functioning windows; but there is no insight on how to acquire the input data for it, and the model is validated on an already electrified site.
Another example of a tool dedicated to generating load profiles and estimate demand diversity is given in [58], but again the availability of reliable survey data is taken for granted. Thus, this study aims to contribute in bridging the gap between the development of modelling tools and the field challenges with a focus on uncertainties of remote communities.

5.3. Estimation of Current Average Consumptions and Expenditures for Electricity Substitutes

The estimation of current average consumptions and expenditures for electricity substitutes represent two key indicators of the energy need assessment since consumptions are the basis for profiling the energy load curves and expenditures are crucial for evaluating the willingness to pay and, consequently, the electricity tariff plan as well as the level of service quality.
With respect to the literature, [59,60] mainly reporting on linear regression method and inverse matrix calculation which needed a comparative case study, the novelty here is based on the analytical calculation of the current average energy consumptions of a typical user per each customer group. This approach considers each source used differentiating the exclusive use of a source and the mixed use of different sources. The matrix used to calculate average daily consumptions for electricity substitutes is reported in Table 6 while the matrix used for the related monthly expenditure is reported in Table 7.

5.4. Next Steps

The authors plan to validate further the exposed methodology by analyzing the nexus between the results of the assessments and the evolution of the load curves over the operational phase electrification projects. The purpose is to understand which factors affect the households’ connection trend (in other word, the market penetration rate) and their electricity consumption over the operational phase of a rural electrification project.
Then, the accuracy of forecast load curves will be evaluated on the basis of actual monitoring data collected and examined in order to optimize the prediction calculation process, which is currently an ongoing study. As for the assessment methodology described in this paper, an approach to define a standardized method is going to be outlined with a view to actually take it into consideration in the project development, as already pursued by previous studies [56].
The methodology described in this paper could be applied to brownfield projects as well to optimize operational mini-grids, upgrade the electricity tariff plan and/or explore room for improvement of services. Such application requires a general review of tools and methods as well as testing and validation phases in operational environment, which are currently in progress.
At the same time, with a view to study all the factors affecting the technical solutions in both greenfield and brownfield, the authors are also focused on the characterization of the community’s energy needs, aimed at classifying the contexts of intervention in order to boost toward a common overall objective of mini-grid’s optimization methods and tools. The main community’s features are defined in order to guide the energy need assessment methodology presented in this paper. An ongoing study are analyzing such figures through indicators and indexes to finalize this research.

6. Conclusions

The paper proposes an effective methodology for the energy need assessment in rural electrification sector to obtain reliable inputs for load profiling and mini-grid sizing, with a view to characterizing the community’s energy needs and exploring the viability of potential projects as well as optimization of operational energy systems.
Summarizing the highlights of an in-depth comparative literature overview, the paper points out (i) how the load profile represents an input for sizing and optimization models, (ii) the relevance of accuracy in the energy need assessment, (iii) the process of load profiling in greenfield projects and (iv) the main references to structured survey methodologies for developing countries.
Hence, the proposed methodology can be used and adapted case-by-case in order to provide an effective applied solution to general recommendations and information from existing micro-grid literature and the lack of proven guidelines from project developers with a view to boost toward a common overall objective of mini-grid’s optimization methods and tools. In order to address the requirements of mini-grid sector, the proposed methodology gives priority to (i) data collection methods able to achieve a large sample representative of the market and (ii) high accuracy in estimating the energy consumptions from electricity substitutes.
The evidence of the methodology’s reliability is given by comparing a key output of the energy need assessment with the actual value adopted in case study used for the validation: the willing to pay of potential customers. It is a very sensitive and representative indicator since it directly affects the project sustainability and it comes from other outputs such as the average consumption and expenditures and the assessment of current and potential anchor loads. With reference to the Village A (Table 4), the assessment returns a flat tariff of 2940 RWF/month to reach the higher penetration rate of potential market. The actual flat tariff negotiated between the mini-grid developer, local communities and authorities was about the same: 3000 RWF/month.
Considering that the energy need assessment is particularly important from both business perspective, allowing to reduce the investment risk, and technical perspective, allowing to develop reliable load profiling and optimize the energy management systems, the accuracy of inputs used as well as assumptions selected directly affect the technical and financial feasibility studies. Results of the energy need assessment represent such inputs and provide the most of the assumptions used in business modelling and mini-grid design. Thus, this study is aimed at contributing to bridging the gap between the development of modelling tools and the field challenges with a focus on uncertainties of remote communities.

Author Contributions

Conceptualization, A.M. and R.G.; data curation, V.G., R.D.C.; methodology, V.G.; investigations, in particular data collection campaigns and methodology testing phase, V.G., R.D.C., P.C., C.T.; validation, V.G., R.D.C.; development of data collection tools, V.G., R.D.C.; data analysis and modelling, V.G.; demand profiling V.G., R.D.C.; power plant design with HOMER, R.D.C.; literature overview, P.C.; writing—introduction, C.T., V.G.; writing—methods and materials, V.G.; writing—results, V.G., R.D.C.; writing—discussion, V.G., R.D.C., C.T.; writing—review and editing, V.G.; supervision, A.M., R.G.

Acknowledgments

We would like to acknowledge Energy 4 Impact (E4I) and AVSI Foundation, which are international NGOs working in the rural electrification sector of developing countries. With specific regard to the case study used for the methodology validation described in this paper, E4I supported the project developer on Market Assessment through the SOGER program and AVSI provided its consulting services to E4I.

Conflicts of Interest

The authors declare no conflict of interest. In order to declare in this section any role of external organizations in this study, AVSI Foundation has facilitated the field mission to conduct the data collection campaign of the case study described in this paper by providing local staff for face-to-face interviews and logistic support under the agreement with Energy 4 Impact (E4I). Authors were authorized to publish the results of such energy need assessment with the exception of confidential information, as agreed.

References

  1. United Nations Economic and Social Council. Progress towards the Sustainable Development Goals; United Nations Economic and Social Council: New York, NY, USA, 2016.
  2. International Energy Agency. Energy Access Outlook 2017: From Poverty to Prosperity; International Energy Agency: Paris, France, 2017. [Google Scholar]
  3. The World Bank. Global Tracking Framework 2017-Progress toward Sustainable Energy 2017; The World Bank: Washington, DC, USA, 2017. [Google Scholar]
  4. Sustainable Energy for All. 2013. Available online: https://www.seforall.org/about-us (accessed on 1 August 2018).
  5. International Energy Agency. World Energy Outlook 2014; International Energy Agency: Paris, France, 2014. [Google Scholar]
  6. International Energy Agency. Africa Energy Outlook; International Energy Agency: Paris, France, 2014. [Google Scholar]
  7. Blodgett, C.; Dauenhauer, P.; Louie, H.; Kickham, L. Energy for Sustainable Development Accuracy of energy-use surveys in predicting rural mini-grid user consumption. Energy Sustain. 2017, 41, 88–105. [Google Scholar] [CrossRef]
  8. Williams, N.J.; Jaramillo, P.; Taneja, J.; Ustun, T.S. Enabling private sector investment in microgrid-based rural electrification in developing countries: A review. Renew. Sustain. Energy Rev. 2015, 52, 1268–1281. [Google Scholar] [CrossRef]
  9. Schnitzer, D.; Lounsbury, D.S.; Carvallo, J.P.; Deshmukh, R.; Apt, J.; Kammen, D.M. Microgrids for Rural Electrification: A Critical Review of Best Practices Based on Seven Case Studies; United Nations Foundation: New York, NY, USA, 2014. [Google Scholar]
  10. Energy Sector Management Assistance Program (ESMAP). Mini-Grid Design Manual; ESMAP: Washington, DC, USA, 2000. [Google Scholar]
  11. Fioriti, D.; Giglioli, R.; Poli, D.; Lutzemberger, G.; Micangeli, A.; Del Citto, R.; Perez-Arriaga, I.; Duenas-Martinez, P. Stochastic sizing of isolated rural mini-grids, including effects of fuel procurement and operational strategies. Electr. Power Syst. Res. 2018, 160, 419–428. [Google Scholar] [CrossRef]
  12. Lambert, T.; Gilman, P.; Lilienthal, P. Micropower System Modeling with Homer. Integr. Altern. Sources Energy 2006, 379–418. [Google Scholar] [CrossRef]
  13. Micangeli, A.; Del Citto, R.; Checchi, F.; Viganò, D.; Nouboundieu, S.; Cestari, G. Rural Electrification in Central America and East Africa, two case Rural Electrification in Central America and East Africa, two case studies of sustainable microgrids. Iberoam. J. Dev. Stud. 2018, 7. [Google Scholar] [CrossRef]
  14. Micangeli, A.; Del Citto, R.; Kiva, I.N.; Santori, S.G.; Gambino, V.; Kiplagat, J.; Viganò, D.; Fioriti, D.; Poli, D. Energy Production Analysis and Optimization of Mini-Grid in Remote Areas: The Case Study of Habaswein, Kenya. Energies 2017, 10, 2041. [Google Scholar] [CrossRef]
  15. Fioriti, D.; Giglioli, R.; Poli, D.; Lutzemberger, G.; Vanni, A.; Salza, P. Optimal sizing of a hybrid mini-grid considering the fuel procurement and a rolling horizon system operation. In Proceedings of the 2017 IEEE International Conference on Environment and Electrical Engineering and Industrial and Commercial Power Systems Europe (EEEIC/I&CPS Europe 2017), Milan, Italy, 6–9 June 2017. [Google Scholar]
  16. Fioriti, D.; Giglioli, R.; Poli, D. Short-term operation of a hybrid minigrid under load and renewable production uncertainty. In Proceedings of the IEEE Global Humanitarian Technology Conference: Technology for the Benefit of Humanity (GHTC 2016), Seattle, WA, USA, 13–16 October 2016. [Google Scholar]
  17. Kolhe, M.L.; Ranaweera, K.M.I.U.; Gunawardana, A.G.B.S. Techno-economic sizing of off-grid hybrid renewable energy system for rural electrification in Sri Lanka. Sustain. Energy Technol. Assess. 2015, 11, 53–64. [Google Scholar] [CrossRef]
  18. Louie, B.H.; Dauenhauer, P.; Wilson, M.; Zomers, A.; Mutale, J. Eternal Light. IEEE Power Energy Mag. 2014, 12, 70–78. [Google Scholar]
  19. Williams, N.J.; Jaramillo, P.; Cornell, B.; Lyons-Galante, I.; Wynn, E. Load characteristics of East African microgrids. In Proceedings of the 2017 IEEE PES-IAS PowerAfrica, Accra, Ghana, 27–30 June 2017. [Google Scholar]
  20. Prinsloo, G.; Dobson, R.; Brent, A. Scoping exercise to determine load profile archetype reference shapes for solar co-generation models in isolated off-grid rural African villages. J. Energy South. Africa 2016, 28, 1–33. [Google Scholar] [CrossRef]
  21. Louie, H.; Dauenhauer, P. Effects of load estimation error on small-scale off-grid photovoltaic system design, cost and reliability. Energy Sustain. Dev. 2016, 34, 30–43. [Google Scholar] [CrossRef]
  22. Hartvigsson, E.; Ahlgren, E.O. Energy for Sustainable Development Comparison of load pro fi les in a mini-grid: Assessment of performance metrics using measured and interview-based data. Energy Sustain. Dev. 2018, 43, 186–195. [Google Scholar] [CrossRef]
  23. Louw, K.; Conradie, B.; Howells, M.; Dekenah, M. Determinants of electricity demand for newly electrified low-income African households. Energy Policy 2008, 36, 2812–2818. [Google Scholar] [CrossRef]
  24. Camblong, H.; Sarr, J.; Niang, A.T.; Curea, O.; Alzola, J.A.; Sylla, E.H.; Santos, M. Micro-grids project, Part 1: Analysis of rural electrification with high content of renewable energy sources in Senegal. Renew. Energy 2009, 34, 2141–2150. [Google Scholar] [CrossRef]
  25. Alzola, J.A.; Vechiu, I.; Camblong, H.; Santos, M.; Sall, M.; Sow, G. Microgrids project, Part 2: Design of an electrification kit with high content of renewable energy sources in Senegal. Renew. Energy 2009, 34, 2151–2159. [Google Scholar] [CrossRef]
  26. Sandwell, P.; Chambon, C.; Saraogi, A.; Chabenat, A.; Mazur, M.; Ekins-Daukes, N.; Nelson, J. Analysis of energy access and impact of modern energy sources in unelectrified villages in Uttar Pradesh. Energy Sustain. Dev. 2016, 35, 67–79. [Google Scholar] [CrossRef]
  27. Dutt, G.S. Illumination and sustainable development Part I: Technology and economics. Energy Sustain. Dev. 1994, 1, 23–35. [Google Scholar] [CrossRef]
  28. Mahapatra, S.; Chanakya, H.N.; Dasappa, S. Energy for Sustainable Development Evaluation of various energy devices for domestic lighting in India: Technology, economics and CO2 emissions. ESD 2009, 13, 271–279. [Google Scholar]
  29. Lloyd, P. The energy profile of a rural community. J. Energy South. Africa 2004, 15, 80–87. [Google Scholar]
  30. Deaton, A. The Analysis of Household Surveys. In A Microeconometric Approach to Development Policy; The International Bank for Reconstruction and Development: Washington, DC, USA, 1997. [Google Scholar]
  31. Grosh, M.E.; Glewwe, P. A Guide to Living Standards Measurement Study Surveys and Their Data Sets; VP Dev Econ & Chief Economist (DEC): Washington, DC, USA, 1995. [Google Scholar]
  32. Ainsworth, M.; Van der Gaag, J. Guidelines for Adapting the LSMS Living Standards Questionnaires to Local Conditions; ECR Transition Unit (ECRTU): Washington, DC, USA, 1988. [Google Scholar]
  33. Olivier, R. Model Living Standards Measurement Study Survey Questionnaire for the Countries of the Former Soviet Union; DEC: Washington, DC, USA, 1997. [Google Scholar]
  34. Grosh, M.E.; Muñoz, J. A Manual for Planning and Implementing the Living Standards Measurement Study Survey; VP Dev Econ & Chief Economist (DEC): Washington, DC, USA, 1996. [Google Scholar]
  35. Barnes, D.F.; O’Sullivan, K. Energy Policies and Multitopic Household Surveys: Guidelines for Questionnaire Design in Living Standards Measurement Studies; ECR Transition Unit (ECRTU); Energy Unit (SEGEN): Washington, DC, USA, 2007. [Google Scholar]
  36. D-Lab | D-Lab. Available online: https://d-lab.mit.edu/about (accessed on 1 August 2018).
  37. D-Lab’s Off-Grid Energy Group | D-Lab. Available online: https://d-lab.mit.edu/research/energy (accessed on 1 August 2018).
  38. Verploegen, E. MIT D-Lab Energy Assessment Toolkit. 2017. Available online: http://d-lab.mit.edu/research/energy/energy-needs-assessment-toolkit (accessed on 1 August 2018).
  39. Off-Grid Energy Roadmap | D-Lab. Available online: http://d-lab.mit.edu/research/energy/energy-needs-assessment-toolkit (accessed on 1 August 2018).
  40. Smith, R.; Leith, K. MIT D-Lab Scale-Ups User Research Framework. 2015. Available online: https://d-lab.mit.edu/resources/publications/d-lab-user-research-framework (accessed on 1 August 2018).
  41. Reddy, A.K.N. Rural energy consumption patterns—A field study. Biomass 1982, 2, 255–280. [Google Scholar]
  42. Van Acker, V.; Szablya, S.J.; Louie, H.; McLean Sloughter, J.; Pirbhai, A.S. Survey of Energy Use and Costs in Rural Kenya for Community Microgrid Business Model Development. In Proceedings of the IEEE Global Humanitarian Technology Conference (GHTC 2014), San Jose, CA, USA, 10–13 October 2014; pp. 166–173. [Google Scholar]
  43. Swan, L.G.; Ugursal, V.I. Modeling of end-use energy consumption in the residential sector: A review of modeling techniques. Renew. Sustain. Energy Rev. 2009, 13, 1819–1835. [Google Scholar] [CrossRef]
  44. Mandelli, S.; Merlo, M.; Colombo, E. Novel procedure to formulate load profiles for off-grid rural areas. Energy Sustain. Dev. 2016, 31, 130–142. [Google Scholar] [CrossRef]
  45. Baudish, I.; Bruce, A. Maximising Sustainability and Trasformative Potential Via Community Engagement in Mini Grid Deployment Models. In Proceedings of the 31st European Photovoltaic Solar Energy Conference and Exhibition (EU PVSEC 2015), Hamburg, Germany, 14–18 September 2015; pp. 2718–2725. [Google Scholar]
  46. Yamane, T. Statistics: An Introductory Analysis, 3rd ed.; Harper and Row: New York, NY, USA, 1973. [Google Scholar]
  47. National Institute of Statistics of Rwanda (NSIR). Fourth Population and Housing Census, Rwanda, 2012; National Institute of Statistics of Rwanda (NSIR): Kigali, Rwanda, 2014.
  48. Cust, J.; Singh, A.; Neuhoff, K. Rural Electrification in India: Economic and Industrial Aspects of Renewables; Cambridge Working Papers in Economics (CWPE): Cambridge, UK, 2007; 36p. [Google Scholar]
  49. Varian, H.R. Microeconomic Analysis, 3rd ed.; W.W. Norton&Company: New York, NY, USA, 1992. [Google Scholar]
  50. Franz, M.; Peterschmidt, N.; Rohrer, M.; Kondev, B. Mini-Grid Policy Toolkit; RECP-EU Energy Initiative: Eschborn, Germany, 2014. [Google Scholar]
  51. Graber, S.; Narayanan, T.; Alfaro, J.; Palit, D. Solar microgrids in rural India: Consumers’ willingness to pay for attributes of electricity. Energy Sustain. Dev. 2018, 42, 32–43. [Google Scholar] [CrossRef]
  52. Gill, B.; Saluja, S.; Palit, D. Electricity Pricing and the Willingness to Pay for Electricity in India: Current Understanding and the Way Forward; The Energy and Resources Institute: New Delhi, India, 2017. [Google Scholar]
  53. GIZ Promotion of Solar-Hybrid Mini-Grids. What Size Shall It Be? GIZ Promotion of Solar-Hybrid Mini-Grids: Bonn, Germany, 2016. [Google Scholar]
  54. HOMER Energy. Available online: https://www.homerenergy.com/products/pro/index.html (accessed on 1 August 2018).
  55. NASA Power. Available online: https://power.larc.nasa.gov/ (accessed on 1 August 2018).
  56. Kobayakawa, T.; Kandpal, T.C. Photovoltaic micro-grid in a remote village in India: Survey based identification of socio-economic and other characteristics affecting connectivity with micro-grid. Energy Sustain. Dev. 2014, 18, 28–35. [Google Scholar] [CrossRef]
  57. Mandelli, S.; Brivio, C.; Colombo, E.; Merlo, M. Effect of load profile uncertainty on the optimum sizing of off-grid PV systems for rural electrification. Sustain. Energy Technol. Assess. 2016, 18, 34–47. [Google Scholar] [CrossRef]
  58. Boait, P.; Advani, V.; Gammon, R. Estimation of demand diversity and daily demand profile for off-grid electrification in developing countries. Energy Sustain. Dev. 2015, 29, 135–141. [Google Scholar] [CrossRef]
  59. Islanm, A.; Hasib, S.R.; Islam, M.S. Short term electricity demand forecasting for an isolated area using two different approaches. J. Power Technol. 2013, 93, 185–193. [Google Scholar]
  60. Gleeson, B.; Kechadi, T.; Rashid, T. A Hybrid Kohonen-based approach for short-term electric load forecasting. In Proceedings of the 3rd International Conference on Cybernetics and Information Technologies, Systems and Applications (CITSA 2006), Orlando, FL, USA, 12–15 July 2006. [Google Scholar]
Figure 1. Development process flowchart for greenfield mini-grid projects.
Energies 12 00574 g001
Figure 2. Sources of energy current used per cluster of customers. (a) Sources of energy currently used by households. (b) Sources of energy currently used by small businesses.
Energies 12 00574 g002
Figure 3. Correlation between Current Electricity Unit Cost and Consumptions.
Energies 12 00574 g003
Figure 4. Current daily load curves.
Energies 12 00574 g004
Figure 5. Assumed average daily solar irradiation and clearness index for the plant location.
Energies 12 00574 g005
Figure 6. Scheme of the Hybrid mini-grid.
Energies 12 00574 g006
Table 1. Main survey figures of the data collection.
Demographic DataSurvey Main Figures
Eastern Province of RwandaTotal PopulationTotal
Households (HHs)
Survey Method 1 Stakeholder consultationSurvey Method 2
Group
interviews
Survey Method 3
Door-to-door interviews
Village A385095012101101 HHs +
35 Small Bus
Village B44569912990107 HHs +
46 Small Bus
Village C38048771910497 HHs +
38 Small Bus
Total12,110281860295305 HHs +
119 Small Bus
Table 2. Main survey figures considering gender balance and the sampling size.
Data Collection CampaignTotalMethod 1Method 2Method 3
Villages A-B-CSampled data *Stakeholder consultationGroup interviewsDoor-to-door interviews
Male36935199170
Female771096135
Households surveyed60045295305
% of total HHs21%n.a.10%11%
Male89n.a.n.a.89
Female30n.a.n.a.30
Small businesses surveyed119n.a.n.a.119
% of total Small bus69%n.a.n.a.69%
Male1515n.a.n.a.
Female00n.a.n.a.
Anchor businesses surveyed1515n.a.n.a.
% of total Anchor bus100%100%n.a.n.a.
* Stakeholders are not included in the sampling size calculation.
Table 3. Average consumptions and expenditures for electricity substitutes per customer.
VILLAGE A
Customer GroupAverage Daily Consumptions from Electricity Substitutes per Customer (Wh)Average Monthly Expenditures for Electricity Substitutes per Customer (RWF)Average Cost of Electricity Unit (RWF/kWh) *
Households1563856824
Small Businesses
Retail shop5505988436
Bar11118869319
Barber shop279913,601194
Tailoring000
Bicycle mechanic3504908561
Anchor loads
Mills724578,800435
* Assuming 30 days per month for HHs and 25 days per month for businesses.
Table 4. Market penetration considering the willingness to pay (WTP).
Market Penetration Considering the Willingness To Pay: Commercial Demand Factor (C2)
Flat Tariff Thresholds (RWF/month)
Customer groups10,03570002940
Households24%24%38%
Small businesses39%66%73%
Anchor loads100%100%100%
Table 5. Current energy demand by type of consumer.
Village A1-Flat Tariff 2940 RWF/month2-Flat Tariff 7000 RWF/month3-Flat Tariff 10,035 RWF/month
Type of customerConsumptions [Wh/day]Percentage of total energy [%]Consumptions [Wh/day]Percentage of total energy [%]Consumptions [Wh/day]Percentage of total energy [%]
Households48,40534%30,40326%30,40330%
Small business49,78335%44,86238%26,51026%
Anchor loads (mills)43,46931%43,46937%43,46943%
Total141,657100%118,734100%100,382100%
Table 6. Calculation of the average daily consumption from electricity substitutes per customer.
Households% of Current UsersMax Power (W)Lighting from (time)Lighting to (time)Lighting (hours/day)Electrical Devices from (time)Electrical Devices to (time)Electrical Devices (hours/day)Number of Bulbs (n°)Number of Units/Day (Liters, Batteries, etc)Capacity Per Unit (Wh)Mobile Phone Charging (charges/day)Mobile Phones (% of Total Customer Group)Radios(% of Total Customer Group)Other Devices (n° of Devices/Customer)Power Assumed for Lighting (W/bulb)Power for Mobile Phone (W)Power for Radio (W)Power Assumed for Other Electrical Devices (W)Energy for Lighting (Wh)Energy for Electrical Devices (Wh)Total Daily Energy/Customer (Wh)Total Daily Energy/Customer Group (Wh)
Solar Home Systems50.0%5018.026.58.512.522.09.52.2--0.4100%75%0.50861050146311457915
PV panels (without battery)0.8%3517.922.95.013.320.06.73.0--0.357%27% 8610-118201371067
PV panels with battery1.4%3517.922.95.013.320.06.73.0--0.357%27%0.628610351181662843669
Solar lanterns16.3%1217.922.95.013.320.06.73.0--0.357%27%-8610121182013721,335
Rechargeable torches8.7%-17.922.95.013.320.06.73.00.112.20.357%27%--610-120211699
Torches with battery27.3%-17.922.95.013.320.06.73.00.112.150.357%27%--610-120215318
Candles (only considering energy for lighting)4.7%417.922.95.013.320.06.7-2.0-0.357%27%--61044020602670
MIX 2: SHS + PV Panels0.4%------------------2363185542.148
MIX 2: SHS + Solar lanterns0.4%------------------2363185542.148
MIX 2: SHS + Torches with battery3.7%------------------11931843715.246
MIX 2: SHS + Candles0.4%------------------1583184761.845
MIX 3: PV Panels + Solar lanterns0.4%------------------236392751.067
MIX 6: Solar lanterns + Rechargeable torches0.8%------------------236392752.133
MIX 6: Solar lanterns + Torches with battery0.8%------------------119391581.226
MIX 8: Torches with battery + Kerosene lamps3.7%------------------12021717
MIX 8: Torches with battery + Candles7.9%------------------4139806.006
No source of electricity0.5%---------------------0
Not answering2.5%---------------------0
check100.0%
Average daily consumption from ELECTRICITY SUBSTITUTES per customer (Wh)156
Table 7. Calculation of the average monthly expenditure from electricity substitutes per customer.
HouseholdsTotal Number of Current UsersUnitUnit Cost (RWF)Monthly Consumption -30 Days Considered- (n° of units)Asset Costs Splitted Over 36 Months* (RWF)Total Monthly Expenditure/ Customer (RWF)Total Monthly Expenditure/ Customer Group (RWF)
Solar Home Systems184average monthly fee*10.9701010.9702.019.116
PV panels (without battery)8lump sum 11.9441.94415.086
PV panels with battery13lump sum 14.1314.13153.412
Solar lanterns155lump sum 147247273.276
Rechargeable torches83per charge2002,2 44036.414
Torches with battery259per disposable batteries2002,2 440113.983
Candles (only considering energy for lighting)45pieces5060.0 3.000134.483
MIX 2: SHS + PV Panels4----12.91550.101
MIX 2: SHS + Solar lanterns4----11.44344.389
MIX 2: SHS + Torches with battery35----11.410398.379
MIX 2: SHS + Candles4----13.97054.195
MIX 3: PV Panels + Solar lanterns4----2.4179.375
MIX 6: Solar lanterns + Rechargeable torches8----9447.328
MIX 6: Solar lanterns + Torches with battery8----9127.078
MIX 8: Torches with battery + Kerosene lamps35----44015.362
MIX 8: Torches with battery + Candles75----3.440258.000
No source of electricity4------
Not answering23------
check950
People Charging Mobile Phone at kiosk281charge10010.1 1.009283.109
Average MONTHLY expenditure for ELECTRICITY SUBSTITUTES per customer (RWF)3856

